NW Bicester Masterplan - ecobicester.org.uk · Checker Janice Hughes ... The Highways Agency have...
34
NW Bicester Masterplan Access and Travel Strategy Appendix 7 – Traffic Impact
Transcript of NW Bicester Masterplan - ecobicester.org.uk · Checker Janice Hughes ... The Highways Agency have...

NW Bicester Masterplan
Access and Travel Strategy Appendix 7 – Traffic Impact

Hyder Consulting (UK) Limited
2212959
HCL House Fortran Road St Mellons Business Park St Mellons Cardiff CF3 0EY United Kingdom
Tel: +44 (0)29 2092 6700
Fax: +44 (0)29 2079 9275
www.hyderconsulting.com
A2 Dominion
NW Bicester Masterplan
Appendix 7 – Traffic Impact
Author Janice Hughes
Checker Janice Hughes
Approver Philip Harker
Report No 007-UA005241-UE31R-01
Date 19th June 2014
This report has been prepared for A2 Dominion Group in
accordance with the terms and conditions of
appointment for NW Bicester Masterplan dated March
2013. Hyder Consulting (UK) Limited (2212959) cannot
accept any responsibility for any use of or reliance on the
contents of this report by any third party.


NW Bicester Masterplan –Access and Travel Strategy Appendix 7
Hyder Consulting (UK) Limited-2212959 Page i
CONTENTS
1 Introduction ........................................................................................... 1
1.1 Overview............................................................................................... 1
1.2 Strategic Modelling ............................................................................... 1
1.3 Scenario for Traffic Assessment ........................................................... 2
1.4 Initial Modelling March 2014 & Iterative Modelling April/May 2014 ....... 2
1.5 Traffic Impact: Bicester Cordon ............................................................ 4
1.6 Traffic Impact: Link Flows ................................................................... 11
1.7 Traffic Impact: Junctions ..................................................................... 18
1.8 Impact of a SE Link Road ................................................................... 24
1.9 Commentary on Traffic Impact ........................................................... 27


NW Bicester Masterplan –Access and Travel Strategy Appendix 7
Hyder Consulting (UK) Limited-2212959 Page 1
1 Introduction
1.1 Overview
This Appendix sets out the anticipated traffic impact associated with the full NW
Bicester development (i.e. 6,000 homes including the Exemplar). The generated traffic
set out in Appendix 6 (Trip Generation) has been modelled in the Bicester Saturn
Model by White Young Green and these outputs analysed to give an overview of
impacts and used in individual junction assessments.
1.2 Strategic Modelling
The traffic generation from the site has been modelled by White Young Green on
behalf of A2Dominion using the County’s Bicester Saturn Model. The model is being
used to test various scenarios for the whole town’s development on behalf of
Oxfordshire County Council as part of the Local Plan evidence base and is considered
to provide the best available tool for assessing the impact of NW Bicester.
The modelling has used 2031 as the opening year for the full development of NW
Bicester, whilst it is recognised that build-out of the development will take longer. The
upper trajectory of housing delivery within a 25 year timescale is for 4,062 homes by
2031 and 6,000 by the end of 2039 (13016 NW Bicester V4 _05-05-14). However, the
use of 2031 for the Opening Year is the approach taken as this fits with the end date of
the Local Plan and is the best available basis for assessment and represents a worst
case.
The following scenarios have been assessed:
1) Base Year 2012
2) Reference Case 2031 – this includes full development of the town including
developments beyond 2031 but not NW Bicester (with the exception of the
permitted Exemplar development). This gives visibility on predicted traffic patterns
in the town without NW Bicester, for comparison.
3) Full Development 2031 - 85%ile Trip Rates with level crossing removed – this
scenario includes NW Bicester as well as all other developments as per the Local
Plan in the town.
4) Full Development 2031 - 85%ile Trip Rates with level crossings removed and a SE
Link Road – this scenario assesses whether a link road in the SE of Bicester
influences the level and distribution of impacts of the NW Bicester compared to not
having a SE Link Road.
5) Full Development 2031 - Average Trip Rates with level crossing removed – this
scenario uses the lower total person trip rates for residential land use as the basis
for the traffic generation for NW Bicester.
The Technical Note by WYG detailing the modelling assumptions is attached as Annex
A.

NW Bicester Masterplan –Access and Travel Strategy Appendix 7
Hyder Consulting (UK) Limited-2212959 Page 2
1.3 Scenario for Traffic Assessment
It was agreed in discussion with Oxfordshire County Council (OCC) that the 2031 Full
NW Bicester Development (85th%ile) with no SE Link Road represented the most
appropriate scenario for the assessment of the development and the design of the road
link and junctions. This enables an understanding of the impacts without strategic road
improvements elsewhere in the town. The results for the NW Bicester Development
with a SE link road included are however discussed at the end of this Appendix to
assess how a SE link road would affect the impacts of NW Bicester.
The 85%ile NW Bicester vehicle trip rate is higher than SW Bicester or Graven Hill in
the AM peak hour and higher than Graven Hill in the PM peak hour. It is considered
that these trip rates represent a development which has similar traffic generation to
other developments in the town. Use of this modelling scenario for assessing the
development therefore provides a view of what would happen to the road network if the
development is similar to other developments in the town. It avoids the need to
consider how traffic would be accommodated if the modal shift targets are not met.
It has also been agreed that the 2031 Full NW Bicester Development (average trip
rates) with no SE Link Road scenario provides an appropriate basis for comparison,
giving the level of traffic that could be anticipated to result if the sustainable travel
targets are achieved for NW Bicester. The Highways Agency have identified that this
target scenario is considered to be the most appropriate traffic generation level for
assessing the impact on the motorway junctions and monitoring would thereafter be put
in place to ascertain whether the targets are being met.
1.4 Initial Modelling March 2014 & Iterative Modelling April/May 2014
The results of the modelling of the main scenarios identified two notable features of the
Full Development (85th%ile) scenario:
The proposed new link road of Howes Lane/ Lord’s Lane appeared not to be fully
used for traffic movements with traffic increasing significantly on the radial routes
(Middleton Stoney Road, Banbury Road and Buckingham Road);
A large amount of traffic using Banbury Road and the junction with the A4095;
and
Increases in traffic were observed through adjacent residential areas.
The results were discussed with Cherwell DC (CDC) and OCC and it was agreed that
further model runs would be undertaken including two potential mitigation measures
(each tested separately):
1. Changing the speed limit on the proposed new Howes Lane/ Lord’s Lane link from
30mph to 40mph; and
2. Introducing traffic calming measures to the Shakespeare Drive area. This tested a
one way north to south from the old Howes Lane into Shakespeare Drive and
20mph on Shakespeare Drive, Blenheim Drive and West Street, to see in principle
what benefits traffic calming would bring, although details of what might be
implemented would be for further discussion.

NW Bicester Masterplan –Access and Travel Strategy Appendix 7
Hyder Consulting (UK) Limited-2212959 Page 3
At the same time as undertaking the model runs above, minor changes were made to
the modelling details of the Banbury Road/ A4095 junction as the Saturn outputs
seemed to be suggesting there was more than expected capacity.
The results of the additional scenarios are summarised below.
New Howes Lane/ Lord’s Lane 40mph
The scenario with Howes Lane/ Lord’s Lane as a 40mph link showed traffic levels
increasing on the following links compared to it being 30mph:
Vendee Drive (additional 25-58 vehicles i.e. a minor change)
New Howes Lane and Lord’s Lane (in the range of 61-193 extra vehicles in a
peak hour, depending on time period and location)
Queens Road in the town centre (+173 in the PM peak)
Some increase on Bucknell Road (100 vehicles in a peak hour)
Some increase on Buckingham Road (100 vehicles in a peak hour)
Traffic on the other hand reduced on these links:
Middleton Stoney Road west of Howes Lane (minor change)
Banbury Road north and south of the A4095 (200 trip reduction on the northern
section, 335 on the southern in a peak hour)
Shakespeare Drive (small reduction of 54 trips in the PM peak)
Shakespeare Drive area traffic calming
The following can be noted with the introduction of traffic calming compared to the
previous results:
New Howes Lane and Lord’s Lane sees additional traffic compared to not having
the traffic calming (161 and 224 trips for example at the western end in the AM
and PM peak and 6 and 347 extra trips at the eastern end in the AM and PM
peak)
More traffic on Middleton Stoney Road west of new Howes Lane (5% additional
in the AM peak and 3% in the PM peak)
Significant reduction on the northern end of Shakespeare Drive (62% of traffic in
the AM peak and 75% PM peak) although not impacting on the Middleton Stoney
end
Reduction in traffic movements at the Banbury Road roundabout
Increase in traffic in the PM peak hour on Buckingham Road and Bucknell Road
compared to no traffic calming.
It was concluded that on the basis that both options increase use of the link road and
reduce traffic on Banbury Road there were benefits in introducing minor modifications
to the proposals for NW Bicester compared to the original modelling results. The
results showed slightly higher impact of the traffic calming on the use of the new route

NW Bicester Masterplan –Access and Travel Strategy Appendix 7
Hyder Consulting (UK) Limited-2212959 Page 4
than the speed limit change. The traffic calming introduction would increase traffic on
Middleton Stoney Road but significantly reduce traffic on Shakespeare Drive at the
northern end. The change of the new link to a 40mph route was considered to
represent a detrimental impact on the principles of the NW Bicester Masterplan and the
ability to integrate the development with the existing residential areas of the town.
At a meeting with OCC and CDC on 8th May 2014 it was agreed that the scenario for
testing of the traffic impact would incorporate the traffic calming principles but not
change the design speed of the Howes Lane/ Lord’s Lane Link Road. The revised
scenario with the traffic calming is therefore the basis of further assessment, with
85th%ile trip rates and average trips rates.
It should be emphasised that the traffic measures tested represent potential ideas but
require further consideration and consultation to confirm and design appropriate
measures.
1.5 Traffic Impact: Bicester Cordon
An analysis has been undertaken of total traffic entering and leaving Bicester in the AM
and PM peak hours in the Base Year 2012 and future year 2031 with and without NW
Bicester. The Full NW Bicester development scenario incorporates the traffic calming
as discussed above and uses 85th%ile and average trip rates in this commentary.
Twelve cordon locations have been selected as providing all of the routes in and out of
the town, with Bucknell village, Caversfield and Chesterton included within the cordon.
The cordon locations are shown on Figure 1 below. The analysis also examines which
routes the Bicester Saturn Model forecasts are most used in each scenario.

NW Bicester Masterplan –Access and Travel Strategy Appendix 7
Hyder Consulting (UK) Limited-2212959 Page 5
Figure 1 – Bicester Cordon Locations
1.5.1 Base Year 2012
Base Year 2012 traffic movements inbound and outbound through each cordon are
shown in Table 1 below. These are Base Year movements from the Bicester Saturn
Model validated to observed movements.
It can be seen that the A41 from the M40 J9 is the most used route, representing 27%
of trips in the PM peak, but the A41 east of the A4421 is similarly used with 25% of PM
peak trips. The B4100 Banbury Road and A4421 Buckingham Road (both 12% in PM
peak) are also significant routes.
In total there were 9,536 trips in and out of Bicester in the AM peak hour and 9,660 in
the PM peak hour. There is not a strong outbound movement in the AM peak and
inbound in the PM peak – in fact there are more inbound than outbound trips in both
peak hours.

NW Bicester Masterplan –Access and Travel Strategy Appendix 7
Hyder Consulting (UK) Limited-2212959 Page 6
Table 1: Base Year 2012 Cordon Traffic Movements
1.5.2 Reference Case 2031 (No NW Bicester)
In the 2031 Reference Case (no NW Bicester), a 29% growth in traffic entering and
leaving Bicester in the AM peak hour and 31% in the PM peak hour is anticipated by
the model, giving 12,282 trips in the AM peak hour and 12,657 in the PM peak hour.
Notably in the Reference Case the movements become more ‘tidal’ with a higher
movement inbound in the AM peak and outbound in the PM peak.
Table 2 shows the forecast cordon traffic movements in 2031 without NW Bicester.
The pattern of trips changes in this scenario to the A41 from the M40 representing
proportionately less trips and the A41 from the east increasing in importance. An
increased proportion of trips are also seen on the A4421 Buckingham Road, B4100
Banbury Road and the more minor routes to the west. This pattern possibly reflects
increasing traffic and delays on the A41 approaching the M40 and thus traffic appears
to re-route together with the changes in the pattern of development with a number of
large developments planned for the south east side of Bicester.
Table 2: 2031 Reference Case (No NW Bicester) Cordon Traffic Movements
Inbound Outbound Inbound Outbound
1 A41 E of M40 1210 1205 1493 1109 25.33% 26.94%
2 Wendlebury Road, E of M40 238 93 46 161 3.47% 2.14%
3 A41, E of A4421 junction 1085 1056 1185 1193 22.45% 24.62%
4 Bicester Road, E of A4421 junction 319 344 330 287 6.95% 6.39%
5 A4421 Buckingham Road, N of Skimmingdish Lane Junction 673 638 671 461 13.75% 11.72%
6 Fringford Road, N of Caversfield 16 58 46 66 0.78% 1.16%
7 B4100 Banbury Road, N of Bainton Road junction 632 485 525 661 11.71% 12.28%
8 Ardley Road, N of Bucknell 105 102 107 88 2.17% 2.02%
9 Middleton Road, W of Bucknell 25 2 2 10 0.28% 0.12%
10 B4030 Middleton Stoney Road, NW of NWB access 288 268 291 364 5.83% 6.78%
11 A4095, W of Chesterton 70 217 25 179 3.01% 2.11%
12 Green Lane, W of Chesterton 301 106 254 106 4.27% 3.73%
TOTAL 4962 4574 4975 4685 100.00% 100.00%
IN AND OUTBOUND TOTAL
AM % PM%
9536 9660
Reference Name
AM PM
Inbound Outbound Inbound Outbound
1 A41 E of M40 1533 1231 1562 1481 22.50% 24.04%
2 Wendlebury Road, E of M40 367 83 51 203 3.66% 2.01%
3 A41, E of A4421 junction 1861 1235 1324 1694 25.21% 23.84%
4 Bicester Road, E of A4421 junction 162 259 193 387 3.43% 4.58%
5 A4421 Buckingham Road, N of Skimmingdish Lane Junction 1095 685 933 708 14.49% 12.97%
6 Fringford Road, N of Caversfield 25 74 52 136 0.81% 1.49%
7 B4100 Banbury Road, N of Bainton Road junction 847 506 670 929 11.02% 12.63%
8 Ardley Road, N of Bucknell 200 149 97 436 2.84% 4.21%
9 Middleton Road, W of Bucknell 12 20 4 26 0.26% 0.24%
10 B4030 Middleton Stoney Road, NW of NWB access 274 248 275 367 4.25% 5.07%
11 A4095, W of Chesterton 495 310 45 523 6.55% 4.49%
12 Green Lane, W of Chesterton 499 112 260 301 4.97% 4.43%
TOTAL 7370 4912 5466 7191 100.00% 100.00%
IN AND OUTBOUND TOTAL
Reference Name
12282 12657
AM % PM%
AM PM
NW Bicester Masterplan –Access and Travel Strategy Appendix 7
Hyder Consulting (UK) Limited-2212959 Page 7
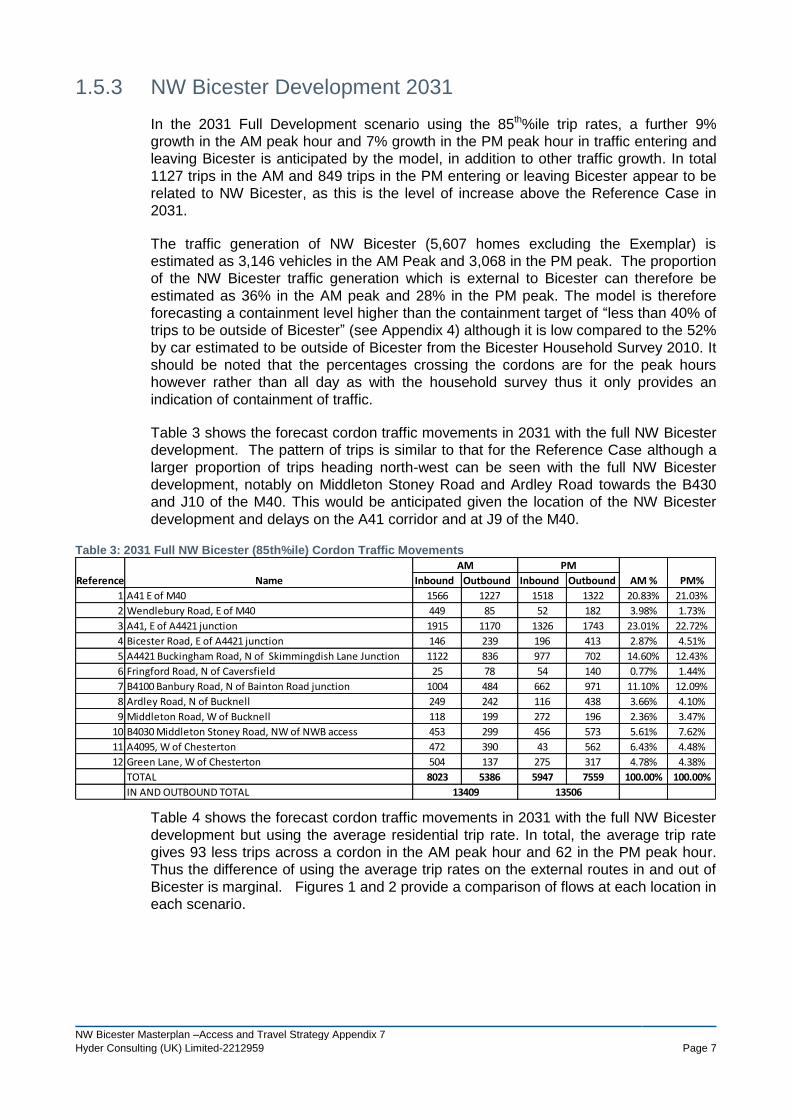
1.5.3 NW Bicester Development 2031
In the 2031 Full Development scenario using the 85th%ile trip rates, a further 9%
growth in the AM peak hour and 7% growth in the PM peak hour in traffic entering and
leaving Bicester is anticipated by the model, in addition to other traffic growth. In total
1127 trips in the AM and 849 trips in the PM entering or leaving Bicester appear to be
related to NW Bicester, as this is the level of increase above the Reference Case in
2031.
The traffic generation of NW Bicester (5,607 homes excluding the Exemplar) is
estimated as 3,146 vehicles in the AM Peak and 3,068 in the PM peak. The proportion
of the NW Bicester traffic generation which is external to Bicester can therefore be
estimated as 36% in the AM peak and 28% in the PM peak. The model is therefore
forecasting a containment level higher than the containment target of “less than 40% of
trips to be outside of Bicester” (see Appendix 4) although it is low compared to the 52%
by car estimated to be outside of Bicester from the Bicester Household Survey 2010. It
should be noted that the percentages crossing the cordons are for the peak hours
however rather than all day as with the household survey thus it only provides an
indication of containment of traffic.
Table 3 shows the forecast cordon traffic movements in 2031 with the full NW Bicester
development. The pattern of trips is similar to that for the Reference Case although a
larger proportion of trips heading north-west can be seen with the full NW Bicester
development, notably on Middleton Stoney Road and Ardley Road towards the B430
and J10 of the M40. This would be anticipated given the location of the NW Bicester
development and delays on the A41 corridor and at J9 of the M40.
Table 3: 2031 Full NW Bicester (85th%ile) Cordon Traffic Movements
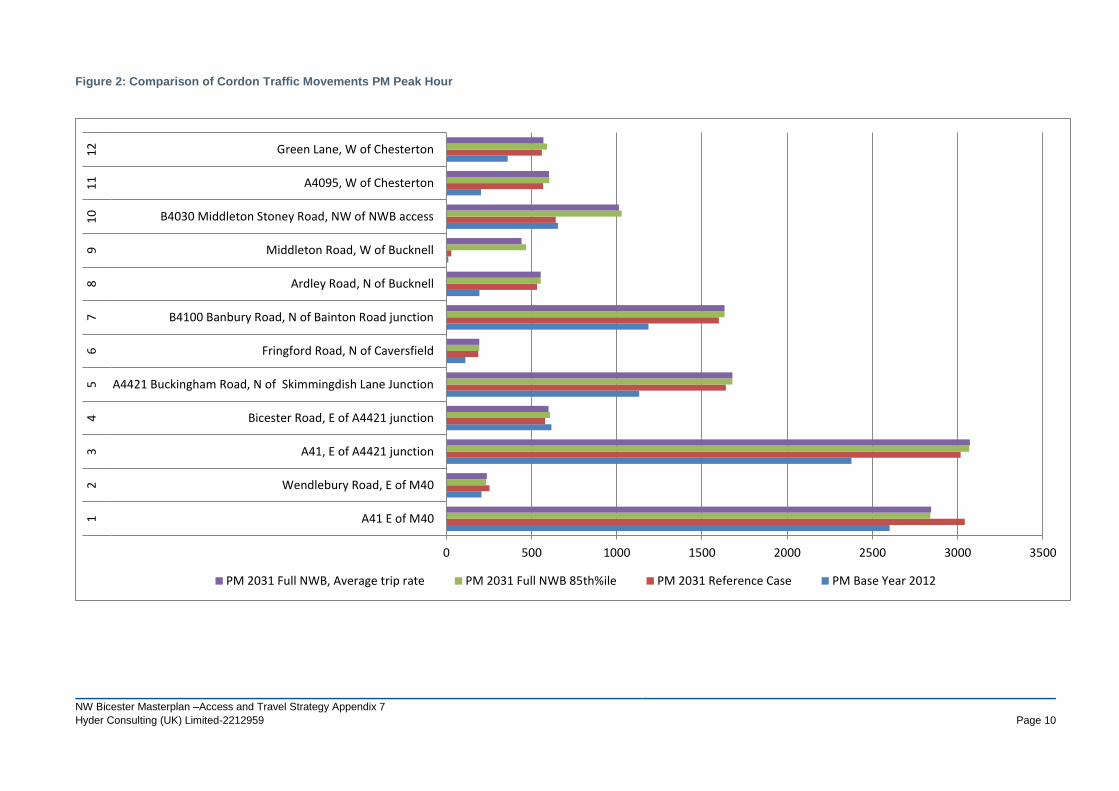
Table 4 shows the forecast cordon traffic movements in 2031 with the full NW Bicester
development but using the average residential trip rate. In total, the average trip rate
gives 93 less trips across a cordon in the AM peak hour and 62 in the PM peak hour.
Thus the difference of using the average trip rates on the external routes in and out of
Bicester is marginal. Figures 1 and 2 provide a comparison of flows at each location in
each scenario.
Inbound Outbound Inbound Outbound
1 A41 E of M40 1566 1227 1518 1322 20.83% 21.03%
2 Wendlebury Road, E of M40 449 85 52 182 3.98% 1.73%
3 A41, E of A4421 junction 1915 1170 1326 1743 23.01% 22.72%
4 Bicester Road, E of A4421 junction 146 239 196 413 2.87% 4.51%
5 A4421 Buckingham Road, N of Skimmingdish Lane Junction 1122 836 977 702 14.60% 12.43%
6 Fringford Road, N of Caversfield 25 78 54 140 0.77% 1.44%
7 B4100 Banbury Road, N of Bainton Road junction 1004 484 662 971 11.10% 12.09%
8 Ardley Road, N of Bucknell 249 242 116 438 3.66% 4.10%
9 Middleton Road, W of Bucknell 118 199 272 196 2.36% 3.47%
10 B4030 Middleton Stoney Road, NW of NWB access 453 299 456 573 5.61% 7.62%
11 A4095, W of Chesterton 472 390 43 562 6.43% 4.48%
12 Green Lane, W of Chesterton 504 137 275 317 4.78% 4.38%
TOTAL 8023 5386 5947 7559 100.00% 100.00%
IN AND OUTBOUND TOTAL
Reference Name PM%AM %
13409 13506
AM PM

NW Bicester Masterplan –Access and Travel Strategy Appendix 7
Hyder Consulting (UK) Limited-2212959 Page 8
Table 4: 2031 Full NW Bicester (Average Trip Rates) Cordon Traffic Movements
Inbound Outbound Inbound Outbound
1 A41 E of M40 1541 1223 1531 1314 20.76% 21.16%
2 Wendlebury Road, E of M40 435 83 52 186 3.89% 1.77%
3 A41, E of A4421 junction 1906 1163 1333 1740 23.05% 22.86%
4 Bicester Road, E of A4421 junction 145 253 194 406 2.99% 4.46%
5 A4421 Buckingham Road, N of Skimmingdish Lane Junction 1122 836 977 702 14.70% 12.49%
6 Fringford Road, N of Caversfield 25 78 54 140 0.77% 1.44%
7 B4100 Banbury Road, N of Bainton Road junction 1004 484 662 971 11.17% 12.15%
8 Ardley Road, N of Bucknell 249 242 116 438 3.69% 4.12%
9 Middleton Road, W of Bucknell 114 189 255 187 2.28% 3.29%
10 B4030 Middleton Stoney Road, NW of NWB access 476 296 448 565 5.80% 7.53%
11 A4095, W of Chesterton 449 376 43 560 6.20% 4.49%
12 Green Lane, W of Chesterton 495 132 256 314 4.71% 4.24%
TOTAL 7961 5355 5921 7523 100.00% 100.00%
IN AND OUTBOUND TOTAL
Reference Name AM % PM%
AM PM
13316 13444

NW Bicester Masterplan –Access and Travel Strategy Appendix 7
Hyder Consulting (UK) Limited-2212959 Page 9
Figure 1: Comparison of Cordon Traffic Movements AM Peak Hour
0 500 1000 1500 2000 2500 3000 3500
A41 E of M40
Wendlebury Road, E of M40
A41, E of A4421 junction
Bicester Road, E of A4421 junction
A4421 Buckingham Road, N of Skimmingdish Lane Junction
Fringford Road, N of Caversfield
B4100 Banbury Road, N of Bainton Road junction
Ardley Road, N of Bucknell
Middleton Road, W of Bucknell
B4030 Middleton Stoney Road, NW of NWB access
A4095, W of Chesterton
Green Lane, W of Chesterton
12
34
56
78
91
01
11
2
AM 2031 Full NWB, Average trip rate AM 2031 Full NWB 85th%ile AM 2031 Reference Case AM Base Year 2012
NW Bicester Masterplan –Access and Travel Strategy Appendix 7
Hyder Consulting (UK) Limited-2212959 Page 10
Figure 2: Comparison of Cordon Traffic Movements PM Peak Hour
0 500 1000 1500 2000 2500 3000 3500
A41 E of M40
Wendlebury Road, E of M40
A41, E of A4421 junction
Bicester Road, E of A4421 junction
A4421 Buckingham Road, N of Skimmingdish Lane Junction
Fringford Road, N of Caversfield
B4100 Banbury Road, N of Bainton Road junction
Ardley Road, N of Bucknell
Middleton Road, W of Bucknell
B4030 Middleton Stoney Road, NW of NWB access
A4095, W of Chesterton
Green Lane, W of Chesterton
12
34
56
78
91
01
11
2
PM 2031 Full NWB, Average trip rate PM 2031 Full NWB 85th%ile PM 2031 Reference Case PM Base Year 2012
NW Bicester Masterplan –Access and Travel Strategy Appendix 7
Hyder Consulting (UK) Limited-2212959 Page 11
1.6 Traffic Impact: Link Flows
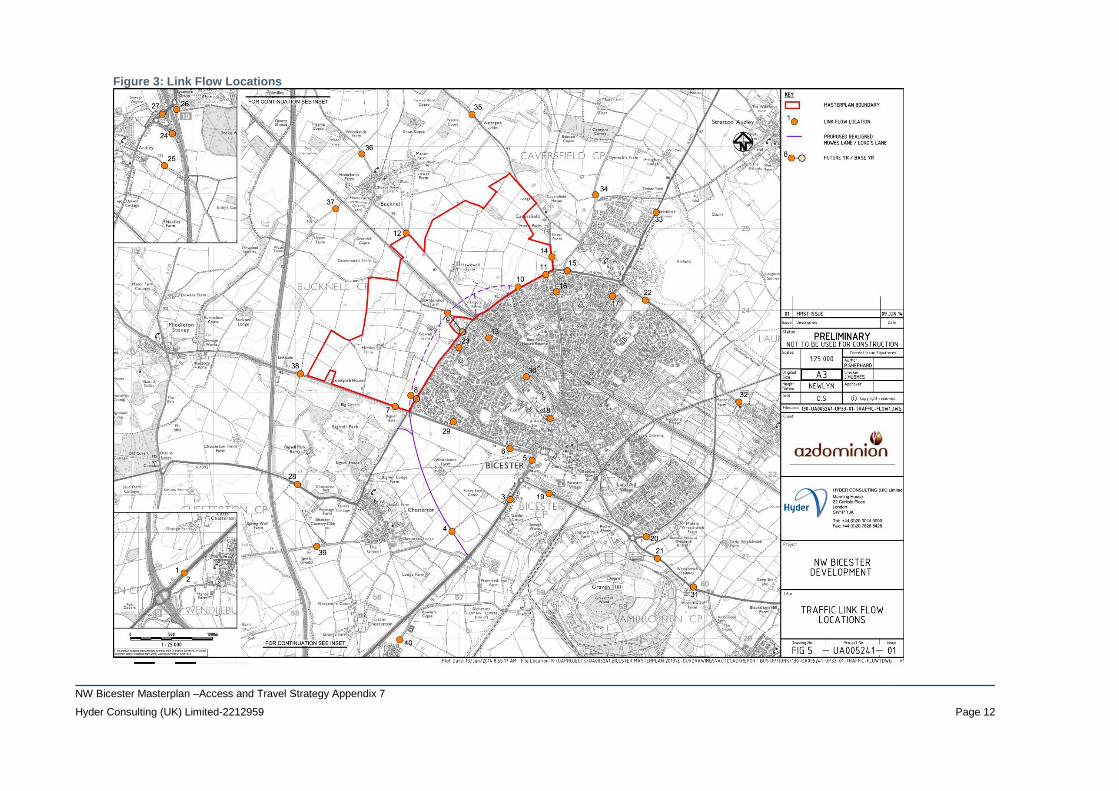
Link flows on key routes within the town have been identified and the flows analysed in
each scenario. The location of the link flows is shown in Figure 3.
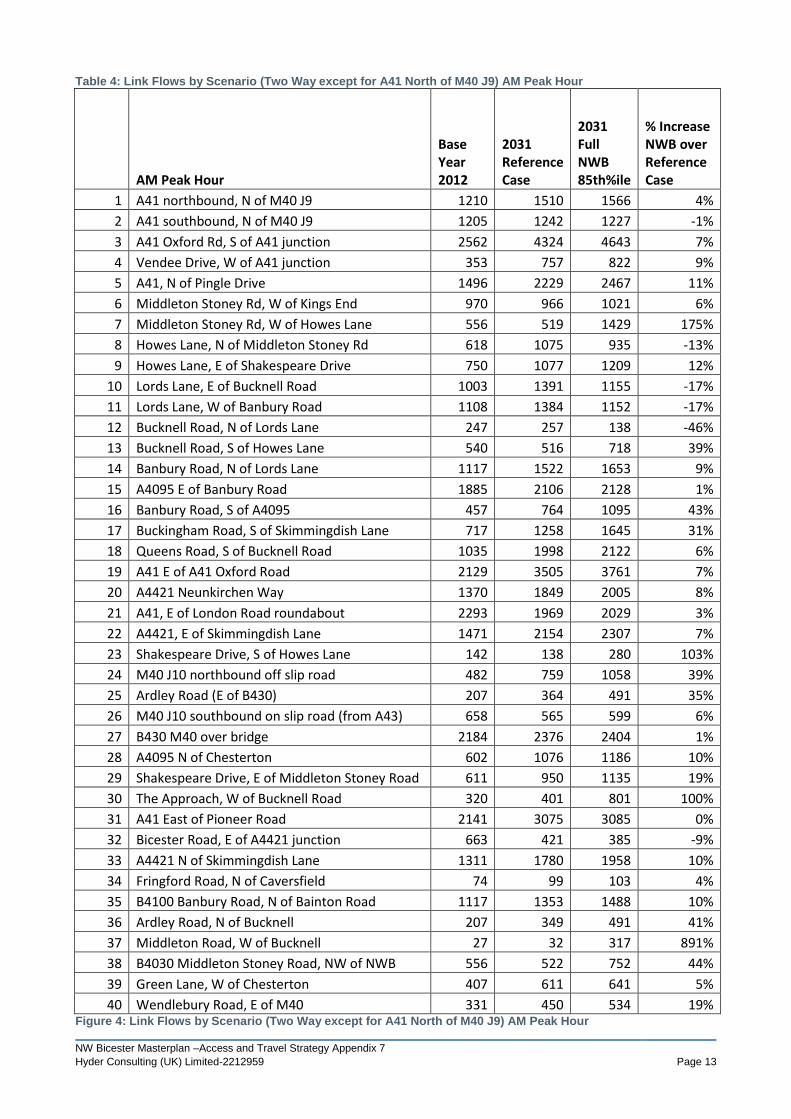
Tables 4 and 5 and Figures 4 and 5 show the link flows in the AM and PM peak hours
respectively in the Base Year 2012 compared to the 2031 with and without NW
Bicester. The percentage change with NW Bicester compared to the Reference Case
(i.e. without NW Bicester) is also shown.
In the AM peak hour, the most significant impacts in terms of increased traffic from
NW Bicester compared to the Reference Case are on:
Middleton Stoney Road, west of Howes Lane (i.e. close to the development
access junctions);
Bucknell Road, south of Howes Lane junction;
Banbury Road, south of A4095;
Buckingham Road, south of Skimmingdish Lane;
Shakespeare Drive, south of Howes Lane;
The Approach, west of Bucknell Road;
Ardley Road and Middleton Road in the vicinity of Bucknell.
There are also significant increases in traffic in the vicinity of J10 of the M40 although it
should be noted that there are some issues with the Bicester Saturn Model in this area
(traffic switching between the mainline and the B430).
There are some links which show a reduction compared to the Reference Case, in
particular:
The realigned Howes Lane at the western end compared to the existing Howes
Lane;
The realigned Lord’s Lane compared to the existing Lord’s Lane; and
Bucknell Road, north of NW Bicester.
The reduction in flows on the new links compared to the existing links is partly due to
the changing nature of the route (30 mph) and also due to the use of the routes on the
eastern and western site boundaries to access the development (Middleton Stoney
Road and Banbury Road).
NW Bicester Masterplan –Access and Travel Strategy Appendix 7
Hyder Consulting (UK) Limited-2212959 Page 12
Figure 3: Link Flow Locations
NW Bicester Masterplan –Access and Travel Strategy Appendix 7
Hyder Consulting (UK) Limited-2212959 Page 13
Table 4: Link Flows by Scenario (Two Way except for A41 North of M40 J9) AM Peak Hour
AM Peak Hour
Base Year 2012
2031 Reference Case
2031 Full NWB 85th%ile
% Increase NWB over Reference Case
1 A41 northbound, N of M40 J9 1210 1510 1566 4%
2 A41 southbound, N of M40 J9 1205 1242 1227 -1%
3 A41 Oxford Rd, S of A41 junction 2562 4324 4643 7%
4 Vendee Drive, W of A41 junction 353 757 822 9%
5 A41, N of Pingle Drive 1496 2229 2467 11%
6 Middleton Stoney Rd, W of Kings End 970 966 1021 6%
7 Middleton Stoney Rd, W of Howes Lane 556 519 1429 175%
8 Howes Lane, N of Middleton Stoney Rd 618 1075 935 -13%
9 Howes Lane, E of Shakespeare Drive 750 1077 1209 12%
10 Lords Lane, E of Bucknell Road 1003 1391 1155 -17%
11 Lords Lane, W of Banbury Road 1108 1384 1152 -17%
12 Bucknell Road, N of Lords Lane 247 257 138 -46%
13 Bucknell Road, S of Howes Lane 540 516 718 39%
14 Banbury Road, N of Lords Lane 1117 1522 1653 9%
15 A4095 E of Banbury Road 1885 2106 2128 1%
16 Banbury Road, S of A4095 457 764 1095 43%
17 Buckingham Road, S of Skimmingdish Lane 717 1258 1645 31%
18 Queens Road, S of Bucknell Road 1035 1998 2122 6%
19 A41 E of A41 Oxford Road 2129 3505 3761 7%
20 A4421 Neunkirchen Way 1370 1849 2005 8%
21 A41, E of London Road roundabout 2293 1969 2029 3%
22 A4421, E of Skimmingdish Lane 1471 2154 2307 7%
23 Shakespeare Drive, S of Howes Lane 142 138 280 103%
24 M40 J10 northbound off slip road 482 759 1058 39%
25 Ardley Road (E of B430) 207 364 491 35%
26 M40 J10 southbound on slip road (from A43) 658 565 599 6%
27 B430 M40 over bridge 2184 2376 2404 1%
28 A4095 N of Chesterton 602 1076 1186 10%
29 Shakespeare Drive, E of Middleton Stoney Road 611 950 1135 19%
30 The Approach, W of Bucknell Road 320 401 801 100%
31 A41 East of Pioneer Road 2141 3075 3085 0%
32 Bicester Road, E of A4421 junction 663 421 385 -9%
33 A4421 N of Skimmingdish Lane 1311 1780 1958 10%
34 Fringford Road, N of Caversfield 74 99 103 4%
35 B4100 Banbury Road, N of Bainton Road 1117 1353 1488 10%
36 Ardley Road, N of Bucknell 207 349 491 41%
37 Middleton Road, W of Bucknell 27 32 317 891%
38 B4030 Middleton Stoney Road, NW of NWB 556 522 752 44%
39 Green Lane, W of Chesterton 407 611 641 5%
40 Wendlebury Road, E of M40 331 450 534 19% Figure 4: Link Flows by Scenario (Two Way except for A41 North of M40 J9) AM Peak Hour

NW Bicester Masterplan –Access and Travel Strategy Appendix 7
Hyder Consulting (UK) Limited-2212959 Page 14
Note: Links included as cordon locations are not shown again in the link flow figure.
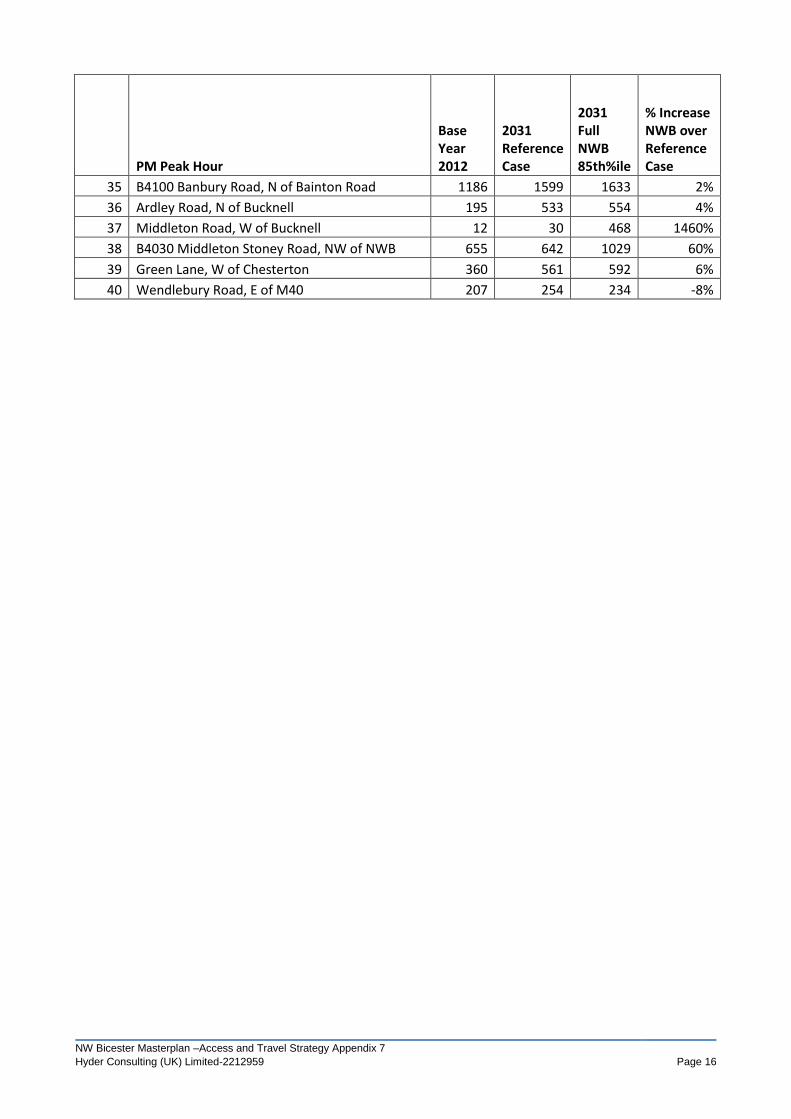
In the PM peak hour, the most significant impacts in terms of increased traffic from
NW Bicester are on:
Vendee Drive;
Middleton Stoney Road, west of Howes Lane;
Banbury Road, north and south of the A4095;
Buckingham Road, south of Skimmingdish Lane;
Queens Road;
Shakespeare Drive, south of Howes Lane;
‘The Approach’, west of Bucknell Road; and
Again, there are also notable increases in traffic in the vicinity of J10 of the M40.
0 500 1000 1500 2000 2500 3000 3500 4000 4500 5000
A41 northbound, N of M40 J9
A41 southbound, N of M40 J9
A41 Oxford Rd, S of A41 junction
Vendee Drive, W of A41 junction
A41, N of Pingle Drive
Middleton Stoney Rd, W of Kings End
Middleton Stoney Rd, W of Howes Lane
Howes Lane, N of Middleton Stoney Rd
Howes Lane, E of Shakespeare Drive
Lords Lane, E of Bucknell Road
Lords Lane, W of Banbury Road
Bucknell Road, N of Lords Lane
Bucknell Road, S of Howes Lane
Banbury Road, N of Lords Lane
A4095 E of Banbury Road
Banbury Road, S of A4095
Buckingham Road, S of Skimmingdish Lane
Queens Road, S of Bucknell Road
A41 E of A41 Oxford Road
A4421 Neunkirchen Way
A41, E of London Road roundabout
A4421, E of Skimmingdish Lane
Shakespeare Drive, S of Howes Lane
M40 J10 northbound off sliproad
Ardley Road (E of B430)
M40 J10 southbound on sliproad (from A43)
B430 M40 overbridge
A4095 N of Chesterton
Shakespeare Drive, E of Middleton Stoney Road
The Approach, W of Bucknell Road
A41 East of Pioneer Road1
23
45
67
89
10
11
12
13
14
15
16
17
18
19
20
21
22
23
24
25
26
27
28
29
30
31
2031 Full NWB 85%ile Reference Case 2031 Base Year 2012

NW Bicester Masterplan –Access and Travel Strategy Appendix 7
Hyder Consulting (UK) Limited-2212959 Page 15
The same links show a reduction compared to the Reference Case as the AM Peak
Hour, namely:
The realigned Howes Lane at the western end;
The realigned Lord’s Lane; and
Bucknell Road, north of NW Bicester.
Table 5: Link Flows by Scenario (Two Way except for A41 North of M40 J9) PM Peak Hour
PM Peak Hour
Base Year 2012
2031 Reference Case
2031 Full NWB 85th%ile
% Increase NWB over Reference Case
1 A41 northbound, N of M40 J9 1493 1575 1518 -4%
2 A41 southbound, N of M40 J9 1109 1269 1322 4%
3 A41 Oxford Rd, S of A41 junction 2490 4016 4335 8%
4 Vendee Drive, W of A41 junction 249 989 1201 21%
5 A41, N of Pingle Drive 1678 2235 2461 10%
6 Middleton Stoney Rd, W of Kings End 846 1158 1345 16%
7 Middleton Stoney Rd, W of Howes Lane 655 642 1625 153%
8 Howes Lane, N of Middleton Stoney Rd 697 1198 896 -25%
9 Howes Lane, E of Shakespeare Drive 848 1173 1216 4%
10 Lords Lane, E of Bucknell Road 1118 1409 1206 -14%
11 Lords Lane, W of Banbury Road 1215 1448 1112 -23%
12 Bucknell Road, N of Lords Lane 192 432 162 -63%
13 Bucknell Road, S of Howes Lane 833 932 1011 8%
14 Banbury Road, N of Lords Lane 1186 1755 2239 28%
15 A4095 E of Banbury Road 1886 2163 2291 6%
16 Banbury Road, S of A4095 634 929 1191 28%
17 Buckingham Road, S of Skimmingdish Lane 842 1252 1530 22%
18 Queens Road, S of Bucknell Road 1454 2109 2384 13%
19 A41 E of A41 Oxford Road 2265 3447 3719 8%
20 A4421 Neunkirchen Way 1661 1938 2149 11%
21 A41, E of London Road roundabout 2396 1632 1699 4%
22 A4421, E of Skimmingdish Lane 1688 2453 2775 13%
23 Shakespeare Drive, S of Howes Lane 152 85 212 149%
24 M40 J10 northbound off slip road 599 523 697 33%
25 Ardley Road (E of B430) 195 532 554 4%
26 M40 J10 southbound on slip road (from A43) 354 240 232 -3%
27 B430 M40 over bridge 2170 2579 2770 7%
28 A4095 N of Chesterton 553 976 1055 8%
29 Shakespeare Drive, E of Middleton Stoney Road 455 873 1222 40%
30 The Approach, W of Bucknell Road 243 507 715 41%
31 A41 East of Pioneer Road 2378 3009 3069 2%
32 Bicester Road, E of A4421 junction 617 580 609 5%
33 A4421 N of Skimmingdish Lane 1132 1641 1679 2%
34 Fringford Road, N of Caversfield 112 188 194 3%
NW Bicester Masterplan –Access and Travel Strategy Appendix 7
Hyder Consulting (UK) Limited-2212959 Page 16
PM Peak Hour
Base Year 2012
2031 Reference Case
2031 Full NWB 85th%ile
% Increase NWB over Reference Case
35 B4100 Banbury Road, N of Bainton Road 1186 1599 1633 2%
36 Ardley Road, N of Bucknell 195 533 554 4%
37 Middleton Road, W of Bucknell 12 30 468 1460%
38 B4030 Middleton Stoney Road, NW of NWB 655 642 1029 60%
39 Green Lane, W of Chesterton 360 561 592 6%
40 Wendlebury Road, E of M40 207 254 234 -8%

NW Bicester Masterplan –Access and Travel Strategy Appendix 7
Hyder Consulting (UK) Limited-2212959 Page 17
Figure 5: Link Flows by Scenario (Two Way except for A41 North of M40 J9) PM Peak Hour
0 500 1000 1500 2000 2500 3000 3500 4000 4500 5000
A41 northbound, N of M40 J9
A41 southbound, N of M40 J9
A41 Oxford Rd, S of A41 junction
Vendee Drive, W of A41 junction
A41, N of Pingle Drive
Middleton Stoney Rd, W of Kings End
Middleton Stoney Rd, W of Howes Lane
Howes Lane, N of Middleton Stoney Rd
Howes Lane, E of Shakespeare Drive
Lords Lane, E of Bucknell Road
Lords Lane, W of Banbury Road
Bucknell Road, N of Lords Lane
Bucknell Road, S of Howes Lane
Banbury Road, N of Lords Lane
A4095 E of Banbury Road
Banbury Road, S of A4095
Buckingham Road, S of Skimmingdish Lane
Queens Road, S of Bucknell Road
A41 E of A41 Oxford Road
A4421 Neunkirchen Way
A41, E of London Road roundabout
A4421, E of Skimmingdish Lane
Shakespeare Drive, S of Howes Lane
M40 J10 northbound off sliproad
Ardley Road (E of B430)
M40 J10 southbound on sliproad (from A43)
B430 M40 overbridge
A4095 N of Chesterton
Shakespeare Drive, E of Middleton Stoney Road
The Approach, W of Bucknell Road
A41 East of Pioneer Road
12
34
56
78
91
01
11
21
31
41
51
61
71
81
92
02
12
22
32
42
52
62
72
82
93
03
1
2031 Full NWB 85th Reference Case 2031 Base Year 2012
NW Bicester Masterplan –Access and Travel Strategy Appendix 7
Hyder Consulting (UK) Limited-2212959 Page 18
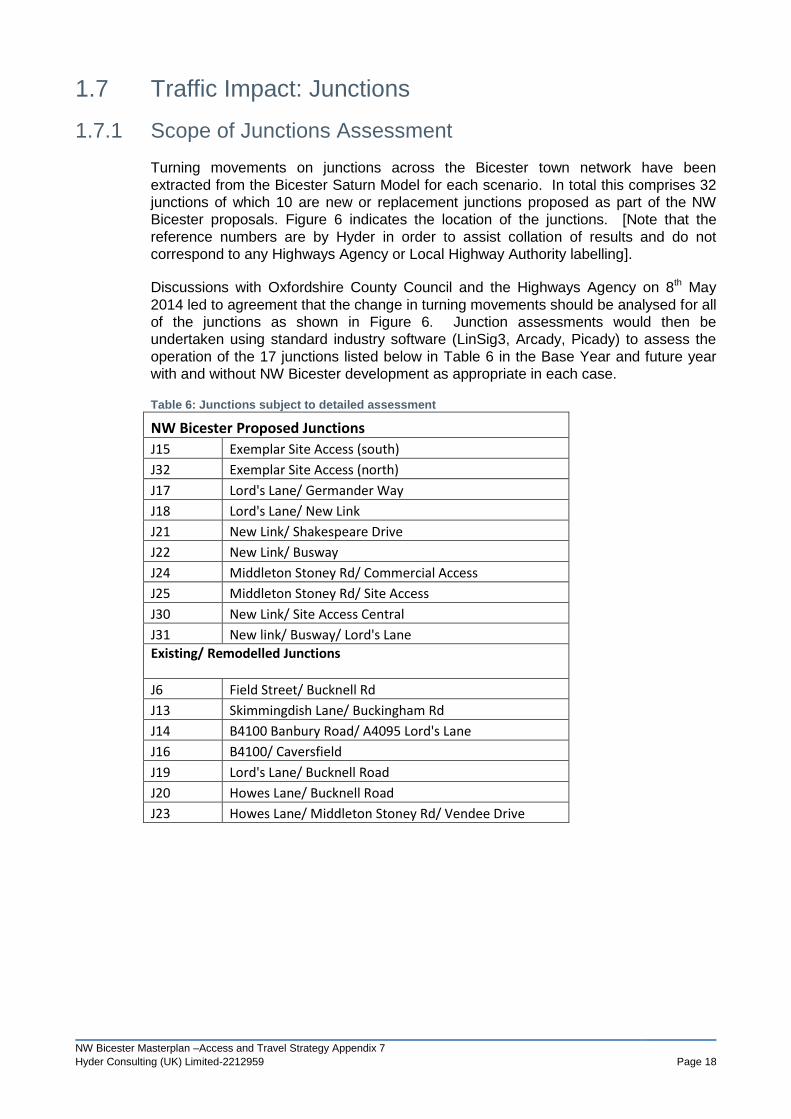
1.7 Traffic Impact: Junctions
1.7.1 Scope of Junctions Assessment
Turning movements on junctions across the Bicester town network have been
extracted from the Bicester Saturn Model for each scenario. In total this comprises 32
junctions of which 10 are new or replacement junctions proposed as part of the NW
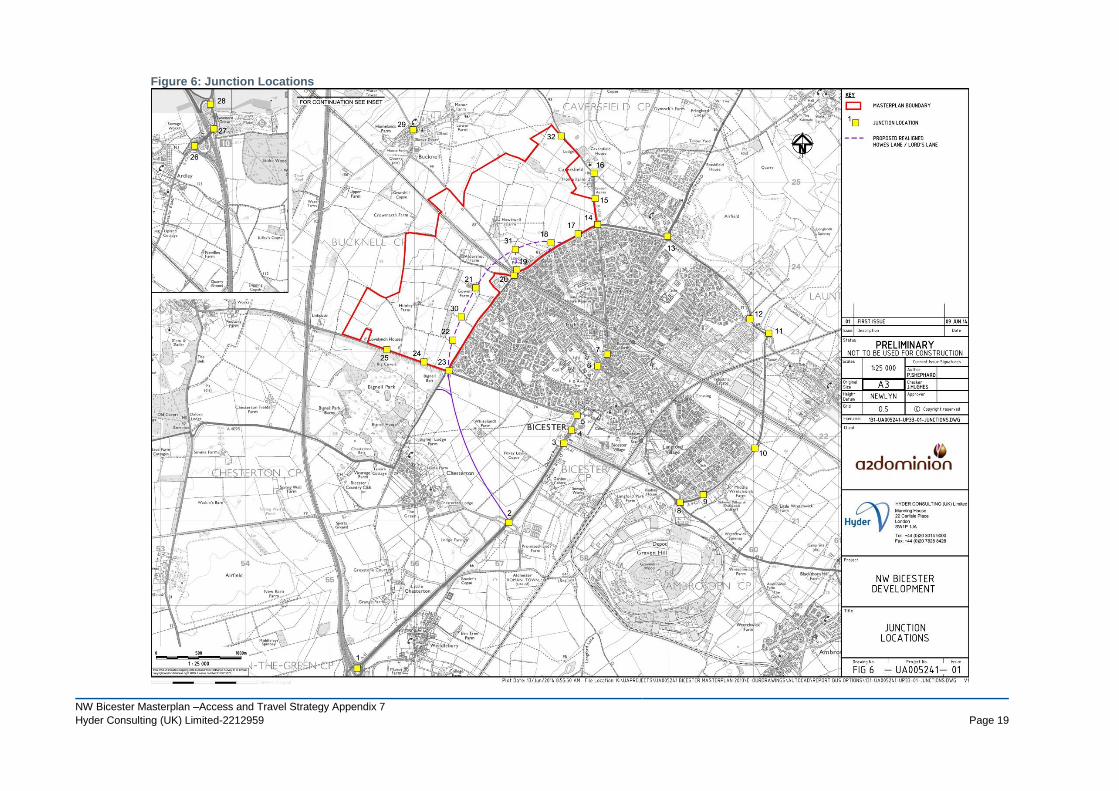
Bicester proposals. Figure 6 indicates the location of the junctions. [Note that the
reference numbers are by Hyder in order to assist collation of results and do not
correspond to any Highways Agency or Local Highway Authority labelling].
Discussions with Oxfordshire County Council and the Highways Agency on 8th May
2014 led to agreement that the change in turning movements should be analysed for all
of the junctions as shown in Figure 6. Junction assessments would then be
undertaken using standard industry software (LinSig3, Arcady, Picady) to assess the
operation of the 17 junctions listed below in Table 6 in the Base Year and future year
with and without NW Bicester development as appropriate in each case.
Table 6: Junctions subject to detailed assessment
NW Bicester Proposed Junctions
J15 Exemplar Site Access (south)
J32 Exemplar Site Access (north)
J17 Lord's Lane/ Germander Way
J18 Lord's Lane/ New Link
J21 New Link/ Shakespeare Drive
J22 New Link/ Busway
J24 Middleton Stoney Rd/ Commercial Access
J25 Middleton Stoney Rd/ Site Access
J30 New Link/ Site Access Central
J31 New link/ Busway/ Lord's Lane
Existing/ Remodelled Junctions
J6 Field Street/ Bucknell Rd
J13 Skimmingdish Lane/ Buckingham Rd
J14 B4100 Banbury Road/ A4095 Lord's Lane
J16 B4100/ Caversfield
J19 Lord's Lane/ Bucknell Road
J20 Howes Lane/ Bucknell Road
J23 Howes Lane/ Middleton Stoney Rd/ Vendee Drive
NW Bicester Masterplan –Access and Travel Strategy Appendix 7
Hyder Consulting (UK) Limited-2212959 Page 19
Figure 6: Junction Locations

NW Bicester Masterplan –Access and Travel Strategy Appendix 7
Hyder Consulting (UK) Limited-2212959 Page 20
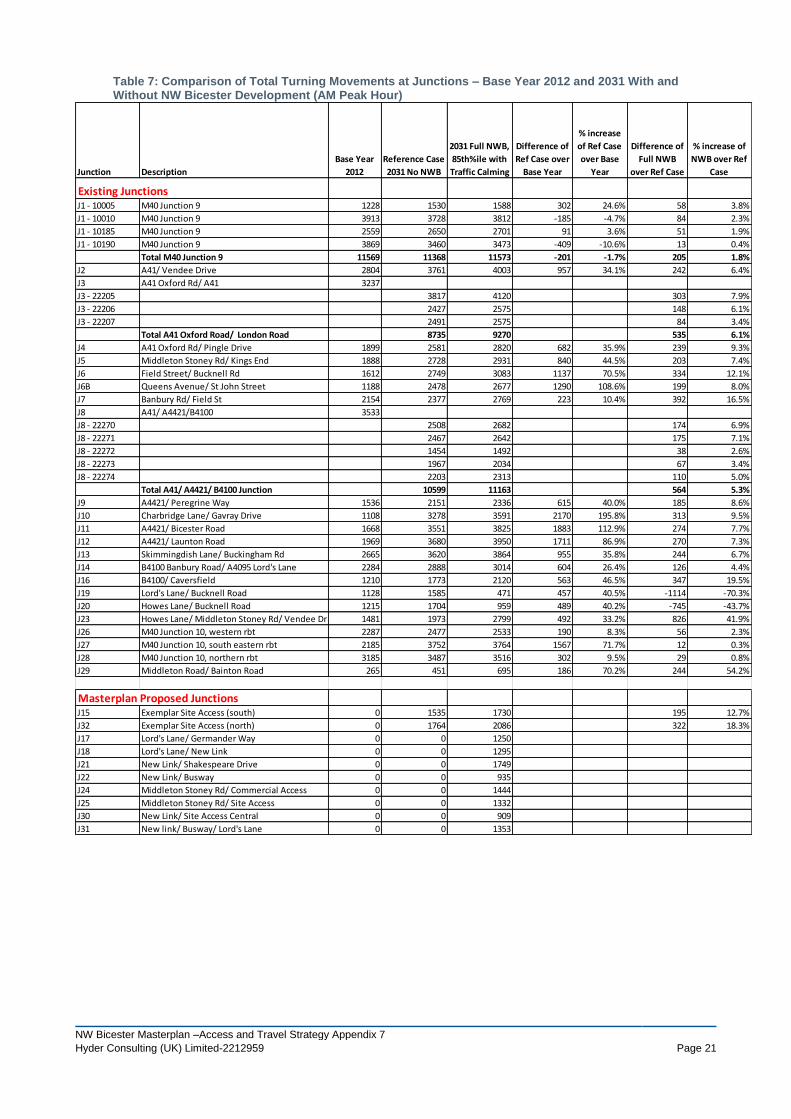
1.7.2 Junction Impact
Tables 7 and 8 provide the total turning movements at each of the 32 junctions in the
AM and PM peak hours, in the Base Year 2012, 2031 Reference Case without NW
Bicester and the 2031 Full Development (85th%ile trip rate). It should be noted that
there are some junctions with proposals for significant modifications from the Base
Year 2012 to the Reference Case 2031 and thus direct comparison of movements is
not always possible. This includes the re-configuration of J10 of the M40 as a result of
the proposed pinch point scheme and various junctions on the A41 as part of the
Bicester Village expansion for example. The junctions in the town centre are also in the
Base Year 2012 model in their previous configuration as the town centre changes were
implemented in 2013. The change in forecast turning movements can however be
assessed between the Reference Case and the Full development scenario.
NW Bicester Masterplan –Access and Travel Strategy Appendix 7
Hyder Consulting (UK) Limited-2212959 Page 21
Table 7: Comparison of Total Turning Movements at Junctions – Base Year 2012 and 2031 With and Without NW Bicester Development (AM Peak Hour)
Junction Description
Base Year
2012
Reference Case
2031 No NWB
2031 Full NWB,
85th%ile with
Traffic Calming
Difference of
Ref Case over
Base Year
% increase
of Ref Case
over Base
Year
Difference of
Full NWB
over Ref Case
% increase of
NWB over Ref
Case
Existing JunctionsJ1 - 10005 M40 Junction 9 1228 1530 1588 302 24.6% 58 3.8%
J1 - 10010 M40 Junction 9 3913 3728 3812 -185 -4.7% 84 2.3%
J1 - 10185 M40 Junction 9 2559 2650 2701 91 3.6% 51 1.9%
J1 - 10190 M40 Junction 9 3869 3460 3473 -409 -10.6% 13 0.4%
Total M40 Junction 9 11569 11368 11573 -201 -1.7% 205 1.8%
J2 A41/ Vendee Drive 2804 3761 4003 957 34.1% 242 6.4%
J3 A41 Oxford Rd/ A41 3237
J3 - 22205 3817 4120 303 7.9%
J3 - 22206 2427 2575 148 6.1%
J3 - 22207 2491 2575 84 3.4%
Total A41 Oxford Road/ London Road 8735 9270 535 6.1%
J4 A41 Oxford Rd/ Pingle Drive 1899 2581 2820 682 35.9% 239 9.3%
J5 Middleton Stoney Rd/ Kings End 1888 2728 2931 840 44.5% 203 7.4%
J6 Field Street/ Bucknell Rd 1612 2749 3083 1137 70.5% 334 12.1%
J6B Queens Avenue/ St John Street 1188 2478 2677 1290 108.6% 199 8.0%
J7 Banbury Rd/ Field St 2154 2377 2769 223 10.4% 392 16.5%
J8 A41/ A4421/B4100 3533
J8 - 22270 2508 2682 174 6.9%
J8 - 22271 2467 2642 175 7.1%
J8 - 22272 1454 1492 38 2.6%
J8 - 22273 1967 2034 67 3.4%
J8 - 22274 2203 2313 110 5.0%
Total A41/ A4421/ B4100 Junction 10599 11163 564 5.3%
J9 A4421/ Peregrine Way 1536 2151 2336 615 40.0% 185 8.6%
J10 Charbridge Lane/ Gavray Drive 1108 3278 3591 2170 195.8% 313 9.5%
J11 A4421/ Bicester Road 1668 3551 3825 1883 112.9% 274 7.7%
J12 A4421/ Launton Road 1969 3680 3950 1711 86.9% 270 7.3%
J13 Skimmingdish Lane/ Buckingham Rd 2665 3620 3864 955 35.8% 244 6.7%
J14 B4100 Banbury Road/ A4095 Lord's Lane 2284 2888 3014 604 26.4% 126 4.4%
J16 B4100/ Caversfield 1210 1773 2120 563 46.5% 347 19.5%
J19 Lord's Lane/ Bucknell Road 1128 1585 471 457 40.5% -1114 -70.3%
J20 Howes Lane/ Bucknell Road 1215 1704 959 489 40.2% -745 -43.7%
J23 Howes Lane/ Middleton Stoney Rd/ Vendee Dr 1481 1973 2799 492 33.2% 826 41.9%
J26 M40 Junction 10, western rbt 2287 2477 2533 190 8.3% 56 2.3%
J27 M40 Junction 10, south eastern rbt 2185 3752 3764 1567 71.7% 12 0.3%
J28 M40 Junction 10, northern rbt 3185 3487 3516 302 9.5% 29 0.8%
J29 Middleton Road/ Bainton Road 265 451 695 186 70.2% 244 54.2%
Masterplan Proposed JunctionsJ15 Exemplar Site Access (south) 0 1535 1730 195 12.7%
J32 Exemplar Site Access (north) 0 1764 2086 322 18.3%
J17 Lord's Lane/ Germander Way 0 0 1250
J18 Lord's Lane/ New Link 0 0 1295
J21 New Link/ Shakespeare Drive 0 0 1749
J22 New Link/ Busway 0 0 935
J24 Middleton Stoney Rd/ Commercial Access 0 0 1444
J25 Middleton Stoney Rd/ Site Access 0 0 1332
J30 New Link/ Site Access Central 0 0 909
J31 New link/ Busway/ Lord's Lane 0 0 1353
NW Bicester Masterplan –Access and Travel Strategy Appendix 7
Hyder Consulting (UK) Limited-2212959 Page 22
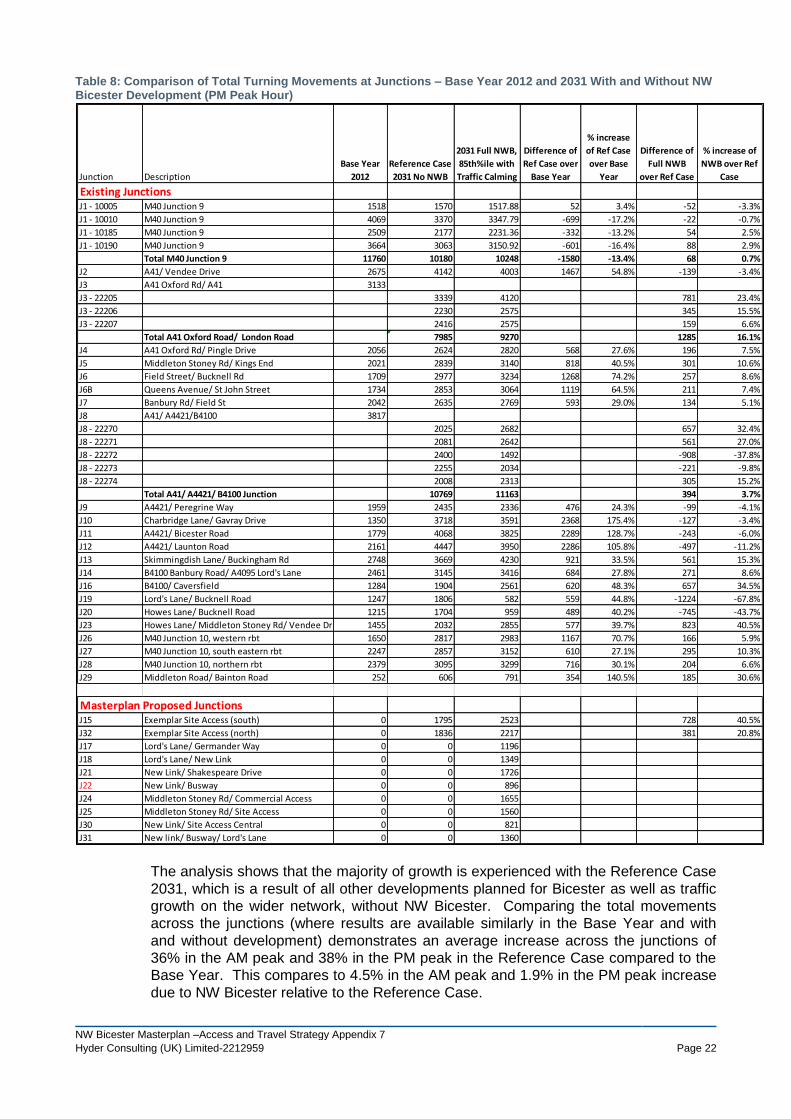
Table 8: Comparison of Total Turning Movements at Junctions – Base Year 2012 and 2031 With and Without NW Bicester Development (PM Peak Hour)
The analysis shows that the majority of growth is experienced with the Reference Case
2031, which is a result of all other developments planned for Bicester as well as traffic
growth on the wider network, without NW Bicester. Comparing the total movements
across the junctions (where results are available similarly in the Base Year and with
and without development) demonstrates an average increase across the junctions of
36% in the AM peak and 38% in the PM peak in the Reference Case compared to the
Base Year. This compares to 4.5% in the AM peak and 1.9% in the PM peak increase
due to NW Bicester relative to the Reference Case.
Junction Description
Base Year
2012
Reference Case
2031 No NWB
2031 Full NWB,
85th%ile with
Traffic Calming
Difference of
Ref Case over
Base Year
% increase
of Ref Case
over Base
Year
Difference of
Full NWB
over Ref Case
% increase of
NWB over Ref
Case
Existing JunctionsJ1 - 10005 M40 Junction 9 1518 1570 1517.88 52 3.4% -52 -3.3%
J1 - 10010 M40 Junction 9 4069 3370 3347.79 -699 -17.2% -22 -0.7%
J1 - 10185 M40 Junction 9 2509 2177 2231.36 -332 -13.2% 54 2.5%
J1 - 10190 M40 Junction 9 3664 3063 3150.92 -601 -16.4% 88 2.9%
Total M40 Junction 9 11760 10180 10248 -1580 -13.4% 68 0.7%
J2 A41/ Vendee Drive 2675 4142 4003 1467 54.8% -139 -3.4%
J3 A41 Oxford Rd/ A41 3133
J3 - 22205 3339 4120 781 23.4%
J3 - 22206 2230 2575 345 15.5%
J3 - 22207 2416 2575 159 6.6%
Total A41 Oxford Road/ London Road 7985 9270 1285 16.1%
J4 A41 Oxford Rd/ Pingle Drive 2056 2624 2820 568 27.6% 196 7.5%
J5 Middleton Stoney Rd/ Kings End 2021 2839 3140 818 40.5% 301 10.6%
J6 Field Street/ Bucknell Rd 1709 2977 3234 1268 74.2% 257 8.6%
J6B Queens Avenue/ St John Street 1734 2853 3064 1119 64.5% 211 7.4%
J7 Banbury Rd/ Field St 2042 2635 2769 593 29.0% 134 5.1%
J8 A41/ A4421/B4100 3817
J8 - 22270 2025 2682 657 32.4%
J8 - 22271 2081 2642 561 27.0%
J8 - 22272 2400 1492 -908 -37.8%
J8 - 22273 2255 2034 -221 -9.8%
J8 - 22274 2008 2313 305 15.2%
Total A41/ A4421/ B4100 Junction 10769 11163 394 3.7%
J9 A4421/ Peregrine Way 1959 2435 2336 476 24.3% -99 -4.1%
J10 Charbridge Lane/ Gavray Drive 1350 3718 3591 2368 175.4% -127 -3.4%
J11 A4421/ Bicester Road 1779 4068 3825 2289 128.7% -243 -6.0%
J12 A4421/ Launton Road 2161 4447 3950 2286 105.8% -497 -11.2%
J13 Skimmingdish Lane/ Buckingham Rd 2748 3669 4230 921 33.5% 561 15.3%
J14 B4100 Banbury Road/ A4095 Lord's Lane 2461 3145 3416 684 27.8% 271 8.6%
J16 B4100/ Caversfield 1284 1904 2561 620 48.3% 657 34.5%
J19 Lord's Lane/ Bucknell Road 1247 1806 582 559 44.8% -1224 -67.8%
J20 Howes Lane/ Bucknell Road 1215 1704 959 489 40.2% -745 -43.7%
J23 Howes Lane/ Middleton Stoney Rd/ Vendee Dr 1455 2032 2855 577 39.7% 823 40.5%
J26 M40 Junction 10, western rbt 1650 2817 2983 1167 70.7% 166 5.9%
J27 M40 Junction 10, south eastern rbt 2247 2857 3152 610 27.1% 295 10.3%
J28 M40 Junction 10, northern rbt 2379 3095 3299 716 30.1% 204 6.6%
J29 Middleton Road/ Bainton Road 252 606 791 354 140.5% 185 30.6%
Masterplan Proposed JunctionsJ15 Exemplar Site Access (south) 0 1795 2523 728 40.5%
J32 Exemplar Site Access (north) 0 1836 2217 381 20.8%
J17 Lord's Lane/ Germander Way 0 0 1196
J18 Lord's Lane/ New Link 0 0 1349
J21 New Link/ Shakespeare Drive 0 0 1726
J22 New Link/ Busway 0 0 896
J24 Middleton Stoney Rd/ Commercial Access 0 0 1655
J25 Middleton Stoney Rd/ Site Access 0 0 1560
J30 New Link/ Site Access Central 0 0 821
J31 New link/ Busway/ Lord's Lane 0 0 1360

NW Bicester Masterplan –Access and Travel Strategy Appendix 7
Hyder Consulting (UK) Limited-2212959 Page 23
In the AM peak hour, the junctions subject to an increase in traffic as a result of NW
Bicester of more than 10% above the Reference Case/ without NW Bicester are:
Field Street/ Bucknell Road;
Banbury Road/ Field Street;
B4100/ Caversfield;
Howes Lane/ Middleton Stoney Road/ Vendee Drive;
Middleton Road/ Bainton Road in Bucknell; and
Exemplar site access junctions north and south.
In the PM peak hour, the junctions subject to an increase in traffic as a result of NW
Bicester of more than 10% above the Reference Case/ without NW Bicester are:
A41 Oxford Road/ London Road;
Middleton Stoney Road/ Kings End;
Skimmingdish Lane/ Buckingham Road;
B4100/ Caversfield;
Howes Lane/ Middleton Stoney Road/ Vendee Drive;
Middleton Road/ Bainton Road in Bucknell;
M40 Junction 10 south eastern roundabout; and
Exemplar site access junctions north and south.
The assessment of individual junctions as agreed with the County Council has
informed the design process for the re-aligned Howes Lane/ Lord’s Lane as well as
areas where off-site mitigation may be necessary. The full development of NW
Bicester together with all the other traffic growth indicates capacity issues at the
following junctions which have been assessed in detail:
B4100 Banbury Road/ A4095 Lord’s Lane roundabout;
B4100/ link to Caversfield;
A4095 Skimmingdish Lane/ A4421 Buckingham Road roundabout;
Bucknell Road/ Field Street junction in the town centre.
In addition, with the full development and traffic growth on the B4100 in the 2031
model, the proposed southern access junction to the Exemplar development is over
capacity for traffic emerging from the junction and is anticipated to require traffic signals
at a future point as the Masterplan is substantially built out.
The NW Bicester team will be working with Oxfordshire County Council to agree
appropriate mitigation to address the capacity issues at these junctions. It is
recognised however that there will be capacity issues across the network as a result of
the whole development of Bicester and there is a need to consider mitigation of these
as part of a strategic plan for the transport network. The following section discusses
the implications of a SE Link Road.

NW Bicester Masterplan –Access and Travel Strategy Appendix 7
Hyder Consulting (UK) Limited-2212959 Page 24
1.8 Impact of a SE Link Road
A traffic modelling scenario has been provided which assesses the full NW Bicester
(85th%ile) traffic with the introduction of a SE Link Road (as set out in the OCC
Bicester Peripheral Routes Study).
Figure 7 below shows the indicative route for improvement included in the modelling
(the highest performing option in the Peripheral Route Study report was selected whilst
recognising that there is not a preferred route). This indicates an improved eastern
peripheral road from the A4421 Buckingham Road/ Skimmingdish Lane junction to the
Gavray Drive junction and an offline improvement around the Graven Hill development
and connecting to the A41 Oxford Road.
Figure 7: SE Link Road Option for Traffic Modelling
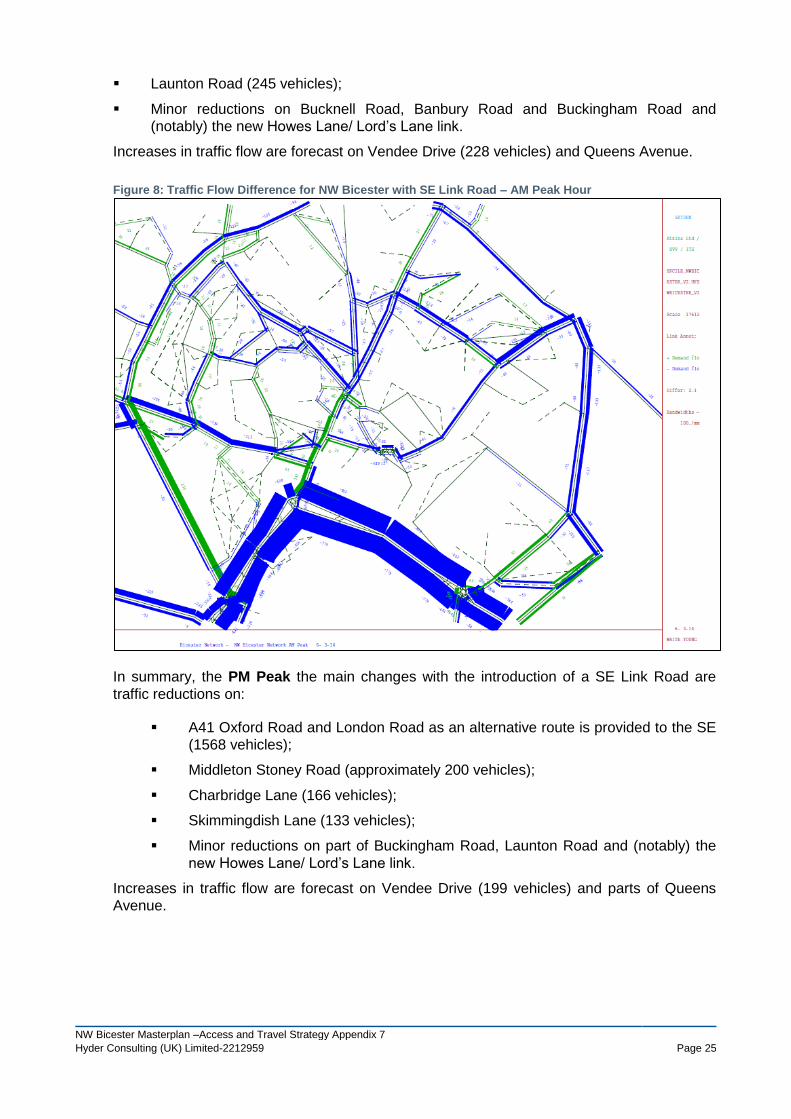
Figures 8 and 9 illustrate the change in traffic flow anticipated by the Bicester Saturn Model
by introducing the SE Link Road with the full development of the NW Bicester Masterplan.
Those routes in blue are where a reduction is forecast, green routes are where an increase is
forecast between the scenarios. It should be noted that the changes are not specifically
related to the NW Bicester traffic but provide the comparison between total traffic movements
with and without the SE Link Road.
In summary, the AM Peak the main changes with the introduction of a SE Link Road are
traffic reductions on:
A41 Oxford Road and London Road as an alternative route is provided to the SE (1581
vehicles);
Middleton Stoney Road (approximately 200 vehicles);
Charbridge Lane (221 vehicles);
NW Bicester Masterplan –Access and Travel Strategy Appendix 7
Hyder Consulting (UK) Limited-2212959 Page 25
Launton Road (245 vehicles);
Minor reductions on Bucknell Road, Banbury Road and Buckingham Road and
(notably) the new Howes Lane/ Lord’s Lane link.
Increases in traffic flow are forecast on Vendee Drive (228 vehicles) and Queens Avenue.
Figure 8: Traffic Flow Difference for NW Bicester with SE Link Road – AM Peak Hour
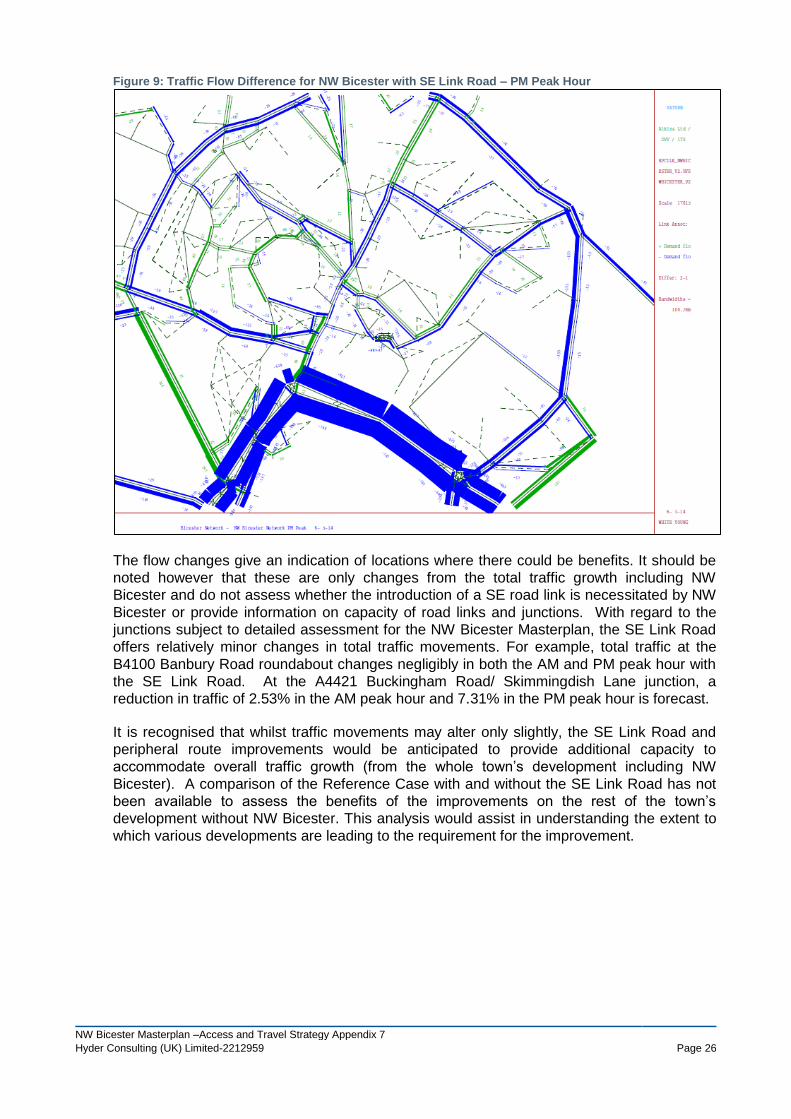
In summary, the PM Peak the main changes with the introduction of a SE Link Road are
traffic reductions on:
A41 Oxford Road and London Road as an alternative route is provided to the SE
(1568 vehicles);
Middleton Stoney Road (approximately 200 vehicles);
Charbridge Lane (166 vehicles);
Skimmingdish Lane (133 vehicles);
Minor reductions on part of Buckingham Road, Launton Road and (notably) the
new Howes Lane/ Lord’s Lane link.
Increases in traffic flow are forecast on Vendee Drive (199 vehicles) and parts of Queens
Avenue.
NW Bicester Masterplan –Access and Travel Strategy Appendix 7
Hyder Consulting (UK) Limited-2212959 Page 26
Figure 9: Traffic Flow Difference for NW Bicester with SE Link Road – PM Peak Hour
The flow changes give an indication of locations where there could be benefits. It should be
noted however that these are only changes from the total traffic growth including NW
Bicester and do not assess whether the introduction of a SE road link is necessitated by NW
Bicester or provide information on capacity of road links and junctions. With regard to the
junctions subject to detailed assessment for the NW Bicester Masterplan, the SE Link Road
offers relatively minor changes in total traffic movements. For example, total traffic at the
B4100 Banbury Road roundabout changes negligibly in both the AM and PM peak hour with
the SE Link Road. At the A4421 Buckingham Road/ Skimmingdish Lane junction, a
reduction in traffic of 2.53% in the AM peak hour and 7.31% in the PM peak hour is forecast.
It is recognised that whilst traffic movements may alter only slightly, the SE Link Road and
peripheral route improvements would be anticipated to provide additional capacity to
accommodate overall traffic growth (from the whole town’s development including NW
Bicester). A comparison of the Reference Case with and without the SE Link Road has not
been available to assess the benefits of the improvements on the rest of the town’s
development without NW Bicester. This analysis would assist in understanding the extent to
which various developments are leading to the requirement for the improvement.
NW Bicester Masterplan –Access and Travel Strategy Appendix 7
Hyder Consulting (UK) Limited-2212959 Page 27
1.9 Commentary on Traffic Impact
The analysis shows that the planned growth of Bicester will lead to a significant
increase in traffic across the network, without NW Bicester. The analysis also shows
that the NW Bicester development will (as would be expected) lead to further impact. It
is important to note however that the analysis contained in this Appendix is based on
full growth of Bicester by 2031 as well as the full NW Bicester development of 6,000
homes by 2031. As such it represents a worst case scenario as the NW Bicester
development will build out over a considerably longer time period. Moreover, the results
for NW Bicester are based on the 85th%ile trip rates for residential, which effectively
represent a level of traffic which might be expected if the development is similar to
other developments in the town. Whereas the aim is that the traffic levels would be
more aligned to the average trip rates, which are lower given the emphasis on
sustainable travel to meet the modal shift targets of PPS1.
The impact analysis highlights that significant improvements will be required to
accommodate additional traffic in the town. The exact nature of the improvements and
the responsibility for implementation forms part of an on-going dialogue between the
NW Bicester team and the County Council.
In these discussions it is recognised that the NW Bicester scheme will make a
substantial investment and improvement to the Bicester road network by providing a
realigned Howes Lane/Lord’s Lane and associated junctions. It will also make a
substantial contribution to bus and walking and cycling travel options which will have
the effect of reducing the traffic impact. As such the assessment (with the agreement
of the County Council) focusses on the impact of key off-site junctions closely related to
the development and the routes to the town centre. The issues in the south east and
east of Bicester are being addressed in the wider work by the County Council.
The County Council has been considering the options for addressing future traffic
growth, such as set out in the Bicester Movement Study (February 2013) and the
Peripheral Routes Study 2014. This includes the consideration of peripheral route
improvements on the eastern side of Bicester and a SE Link Road. The analysis by
Hyder above shows that there would be immediate benefits in the SE of the town, and
would provide capacity to accommodate growth in the town. The NW Bicester team are
working closely with the County Council on these issues.
The NW Bicester development will also impact on the strategic road network with
respect to Junctions 9 and 10 of the M40. It is notable that the traffic using J9 appears
to diminish in both the Reference Case and with NW Bicester compared to the Base
Year, whereas traffic using J10 increases, particularly in the PM peak. These effects
are likely to be due to the increase in delays anticipated as a result of traffic growth on
the A41 and J9, leading to traffic choosing alternative routes (i.e. routeing to J10). This
highlights the fact that traffic modelling is responsive to capacity issues. If
improvements are introduced in any particular location or measures introduced to deter
traffic then traffic patterns are likely to alter. This could mean for example that an
improvement at J9 could reduce the traffic travelling north-west to J10.
An over-arching discussion on the approach to the motorway junctions has been
undertaken by the County Council as part of the consideration of the Cherwell Local
Plan and the NW Bicester team have been party to these discussions. The modelling
results have been provided to the Highways Agency and these are being used as part
of information to examine the need for future investment in the network (post Phase 2
for J9 and the J10 pinch point scheme).