NUTRITIONAL AND HORMONAL FACTORS AFFECTING … · Dottorato in Frutticoltura Mediterranea...
129
Dottorato in Frutticoltura Mediterranea Dipartimento di Scienze Agrarie e Forestali AGR/03 - Arboricoltura generale e Coltivazioni arboree Departamento de Producción Vegetal NUTRITIONAL AND HORMONAL FACTORS AFFECTING FRUIT SET IN AVOCADO (Persea americana Mill.) Ph.D STUDENT COORDINATOR ANTONIO D’ASARO PROF. MARIA ANTONIETTA GERMANÀ SUPERVISOR CO-SUPERVISOR PROF. PROF. MANUEL AGUSTÍ FONFRÍA VITTORIO FARINA CYCLE XXIX 2016/2017 January 2017
Transcript of NUTRITIONAL AND HORMONAL FACTORS AFFECTING … · Dottorato in Frutticoltura Mediterranea...

Dottorato in Frutticoltura Mediterranea
Dipartimento di Scienze Agrarie e Forestali
AGR/03 - Arboricoltura generale e Coltivazioni arboree
Departamento de Producción Vegetal
NUTRITIONAL AND HORMONAL FACTORS
AFFECTING FRUIT SET IN AVOCADO
(Persea americana Mill.)
Ph.D STUDENT COORDINATOR
ANTONIO D’ASARO PROF. MARIA ANTONIETTA GERMANÀ
SUPERVISOR CO-SUPERVISOR
PROF. PROF.
MANUEL AGUSTÍ FONFRÍA VITTORIO FARINA
CYCLE XXIX
2016/2017
January 2017

Index
3
Index
ABSTRACT ......................................................................................... 7
RIASSUNTO ....................................................................................... 9
RESUMEN ......................................................................................... 11
RESUM .............................................................................................. 13
I. GENERAL INTRODUCTION .................................................... 17
1. ORIGIN AND GEOGRAPHICAL DISTRIBUTION.............................................17
2. TAXONOMY AND MORPHOLOGY .......................................................................18
2.1 Taxonomy ................................................................................................................................. 18
2.2 Morphology .............................................................................................................................. 18
3. VEGETATIVE DEVELOPMENT OF AVOCADO ...............................................22
4. FLOWERING ...................................................................................................................24
4.1 Induction and floral differentiation ................................................................................... 24
4.2 Reproductive biology ............................................................................................................ 25
5. FRUIT SET AND DEVELOPMENT OF FRUIT ....................................................28
5.1 Fertilization .............................................................................................................................. 28
5.2 The physiological fruit drop ................................................................................................ 29
5.3 Vegetative development-fruit development relationship ........................................... 30
5.4 Alternate bearing .................................................................................................................... 31
5.5 Stimulation techniques of fruit set .................................................................................... 33
6. THE ROLE OF CARBOHYDRATES IN SETTING AND FRUIT
DEVELOPMENT .................................................................................................................34
7. HORMONAL CONTROL OF FRUIT SET AND FRUIT DEVELOPMENT .35
II. HYPOTHESIS .............................................................................. 38
III. MATERIALS AND METHODS ............................................... 40
1. VEGETAL MATERIAL ................................................................................................40
2. EXPERIMENTAL DESIGN .........................................................................................40
2.1 Intensity of flowering vs. fruit set ..................................................................................... 40
2.2. The exogenous control of the abscission of reproductive organ ............................ 41

Index
4
2.3. Vegetative development vs. Reproductive development. Hormonal and
nutritional control .......................................................................................................................... 42
3. ANALYSIS OF CARBOHYDRATES ........................................................................45
4. HORMONAL ANALYSIS.............................................................................................46
5. STATISTICAL ANALYSIS ..........................................................................................47
IV. RESULTS .................................................................................... 49
1. INTENSITY OF FLOWERING-FRUIT SET ..........................................................49
1.1 Reduction of the flowers number by applying GA3 ................................................ 49
2. VEGETATIVE DEVELOPMENT- REPRODUCTIVE DEVELOPMENT
RELATIONSHIP. HORMONAL AND NUTRITIONAL CONTROL ..................52
2.1 The time course of flower abscission ............................................................................... 52
2.2 The time course of fruit abscission. Number of fruits per panicle. Influence of
the flowers number ........................................................................................................................ 53
2.3 Carbohydrate consumption .................................................................................................. 56
2.3.1 Consumption during flowering ............................................................................................... 56
2.3.2 Consumption during the initial development of fruit ................................................... 62
2.4 Endogenous hormonal control ............................................................................................ 67
2.4.1 During flowering ........................................................................................................................... 67
2.4.2 During the initial development of fruit ............................................................................... 74
3. EXSOGENUS CONTROL OF THE ABSCISSION OF REPRODUCTIVES
ORGANS ................................................................................................................................80
3.1 Influence of GA3 and PBZ on the abscission of flowers and fruits. Action of
ringing ............................................................................................................................................... 80
3.2 Influence of GA3 and PBZ on individual panicles. ...................................................... 85
3.2.1 On the vegetative development ............................................................................................. 85
3.2.2 On the carbohydrate content .................................................................................................. 88
3.3 Influence of Ringing, GA and PBZ on carbohydrate metabolism ...................... 89
3.3.1 Treatment on individual inflorescences ........................................................................ 89
3.3.1.1 During flowering.................................................................................................................... 89
3.3.1.2 During the initial development of fruit .......................................................................... 93
3.3.2 Treatments to the entire tree .................................................................................................. 98
3.4 Influence of GA3 and PBZ during anthesis and fruit set in the hormonal balance
.......................................................................................................................................................... 109
V. DISCUSSION ............................................................................. 113

Index
5
VI. CONCLUSIONS ....................................................................... 118
VII. REFERENCES ........................................................................ 120

ABSTRACTS

Abstracts
7
ABSTRACT
Under favourable conditions, the avocado sets more fruits than the tree is able to
bring to maturity, so that the plant adjusts, during the early stages of development,
its ability to nourish them by modifying their number, that is, causing the fruit
drop of those who can not maintain their growth rate. Accordingly, carbohydrate
availability could be a key factor in the physiological abscission of these fruits.
Since this species presents dichogamy, the abscission of fruits has also been
attributed to the absence of pollination, but at the same time it has been related to
failures in seed development, embryo abortion, seed coat collapse, and with the
effect of an environmental stress, especially by cold or heat.
In order to demonstrate if in avocado the competition between flowers is
responsible for fruit set and initial development of the fruit, it has been
determined the influence of the flowering intensity in the time course of
carbohydrate and hormonal content, in the rate of fruits abscission and its
evolution, and finally, on percentage of fruits set.
For this purpose experiments have been designed in order to: 1) reduce flowering,
and with it the competition between flowers, 2) reduce vegetative growth, and 3)
promote fruit set.
The experiments were carried out in commercial orchards of avocado (Persea
americana Mill.) cv. Hass (group A flowering), located in Torrent and Llaurí
(Valencia), Spain, and in Caronia Marina (Messina), Italy. Adult trees (5-8 years),
planted at a distance of 5 x 6 m. In all of them there were cv. Fuerte (flowering
group B) to ensure pollination.
The results showed that gibberellic acid applied during the floral bud inductive
period delayed sprouting, reduced the number of flowers per panicle, increased
apical shoot length, and delayed fruitlet abscission.
Gibberellic acid applied at anthesis enhanced fruit set and delayed fruitlet
abscission. It correlated with an immediate and temporary increase of GA1, IAA
and tZ content. But the GA1 immeditely derived in its catabolite GA8. Since IAA
synthesis precedes fruit set and tZ increasing content, the possibility that
fertilization triggers the tZ synthesis mediated by auxin cannot be discarded.
Gibberellic acid applied at the beginning of fruit set also, temporarily, increased

Abstracts
8
the endogenous concentration of GA1 and GA8, As well as the number of fruits
that initiated the development and delayed their abscission.
Paclobutrazol applied at anthesis reduced the growth of the terminal shoot y
anticipated flowers abscission, but did not affect initial fruit set.
In no case it was possible to increase the total number of fruits per panicle, so that
the competition between developing organs is not the cause of the lack of fruit set
in this species.

Abstracts
9
RIASSUNTO
In condizioni favorevoli, l’avocado riesce ad allegare più frutti di quelli che
l’albero è capace di portare a maturazione, in queste condizioni la pianta modifica,
durante le prime fasi di sviluppo, la sua capacità di nutrirli modificando il numero,
provocando la cascola di quelli che non posso mantenere il ritmo di crescita. Di
conseguenza, la disponibilità di carboidrati potrebbe essere un fattore chiave per
quanto riguarda la cascola dei frutti. Dato che questa specie presenta la dicogamia,
l’abscissione dei frutti si è attribuita anche all’assenza di impollinazione, però allo
stesso tempo si è relazionata a problemi riguardo lo sviluppo del seme, aborto
dell’embrione, collasso della coperta seminale, e per effetto dello stress
ambientale, specialmente per calore e freddo.
Con il fine di dimostrare se nell’avocado la competizione tra fiori è responsabile
dell’allegagione e dello sviluppo iniziale dei frutti, abbiamo determinato:
l’influenza dell’intensità di fioritura sull’evoluzione del contenuto dei carboidrati
e ormoni, nel ritmo di abscissione dei frutti e la sua evoluzione, e in fine, sulla
percentuale di frutti allegati. Per fare tutto ciò, abbiamo disegnato diversi
esperimenti in modo da: 1) ridurre la fioritura, e con questa la competizione tra
fiori, 2) ridurre lo sviluppo vegetativo, e 3) promuovere l’allegagione dei frutti.
Gli esperimenti sono stati effettuati presso frutteti commerciali di avocado
(Persea americana Mill.) cv. Hass (gruppo A della fioritura), siti in Torrent e
Llaurí (Valencia), Spagna, e in Caronia Marina (Messina), Italia. Sono stati presi
in considerazione alberi adulti (5-8 anni di età), piantati a una distanza di 5 x 6 m.
In tutti i frutteti erano presenti alberi della cv. Fuerte (gruppo B della fioritura) per
assicurare l’impollinazione.
I risultati dimostrano che applicando acido gibberellico durante il periodo di
induzione fiorale si ha avuto un ritardo del germogliamento, riduzione del numero
di fiori in ciascuna pannocchia, incremento dello sviluppo del germoglio apicale,
e ritardo dell’abscissione fisiologica dei frutticini. L’applicazione di acido
gibberellico durante l’antesi ha migliorato l’allegagione e ha ritardato
l’abscissione dei frutticini. Ciò è correlato a un immediato e temporaneo
incremento del contenuto di GA1, IAA e tZ. Ma GA1 derivò immediatamente nel
suo catabolite GA8. Dal momento che la sintesi di IAA precede l’allegagione e il

Abstracts
10
crescente aumento del contenuto di tZ, la possibilità che la fecondazione
innescherebbe la sintesi di tZ mediata dall’auxina non può essere scartata.
L’applicazione di acido gibberellico all’inizio dell’allegagione, anche in questo
caso ha aumentato temporaneamente, la concentrazione endogena di GA1 e GA8,
così come il numero di frutti che iniziano lo sviluppo, e ha ritardato l’abscissione
di quest’ultimi.
L’applicazione di paclobutrazol durante l’antesi ha ridotto la crescita del
germoglio terminale e ha anticipato l’abscissione dei fiori, ma non ha influenzato
l’allegagione iniziale.
In nessun caso si è riusciti ad aumentare il numero totale dei frutti per pannocchia,
ciò significa che la competizione tra organi in via di sviluppo non è la causa della
mancata allegagione in questa specie.

Abstracts
11
RESUMEN
En condiciones favorables, el aguacate cuaja más frutos de los que el árbol es
capaz de llevar a la madurez, de modo que la planta ajusta, durante las primeras
fases del desarrollo, su capacidad de nutrirlos modificando su número, esto es,
provocando la caída de los que no pueden mantener su tasa de crecimiento. De
acuerdo con ello, la disponibilidad de carbohidratos podría ser un factor clave en
la abscisión fisiológica de estos frutos. Dado que esta especie presenta dicogamia,
la abscisión de frutos también se ha atribuido a la ausencia de polinización, pero
al mismo tiempo se ha relacionado con fallos en el desarrollo de la semilla, el
aborto del embrión, el colapso de la cubierta seminal, y con el efecto de un estrés
ambiental, especialmente por frío o calor.
Con el fin de demostrar si en el aguacate la competencia entre flores es
responsable del cuajado y desarrollo inicial del fruto, se ha determinado la
influencia que la intensidad de floración tiene en la evolución del contenido en
carbohidratos y hormonas, en la tasa de abscisión de frutos y su evolución, y,
finalmente, sobre porcentaje de frutos cuajados. Para ello se han diseñado
experimentos para 1) reducir la floración, y con ello la competencia entre flores,
2) reducir el desarrollo vegetativo, y 3) promover el cuajado de frutos.
Los experimentos se llevaron a cabo en huertos comerciales de aguacate cv. Hass
(grupo A de floración), localizados en Torrent y Llaurí (Valencia), España, y en
Caronia Marina, Messina, Italia. Se utilizaron árboles adultos (5-8 años de edad),
plantados a una distancia de 5 x 6 m. En todos ellos había árboles del cv. Fuerte
(grupo B de floración) para asegurar la polinización.
Los resultados demuestran que la aplicación de ácido giberélico durante la
inducción floral retrasó la brotación, redujo el número de flores por panícula,
aumentó la longitud del brote desarrollado a partir de la yema terminal de la
panícula, y retrasó la abscisión fisiológica de frutos.
Su aplicación en antesis promovió el cuajado de frutos y retrasó su abscisión. Ello
se corresponde con un aumento inmediato y temporal de la síntesis endógena de
GA1, IAA y tZ. Pero la GA1 derivó inmediatamente en su catabolito GA8. Puesto
que la síntesis de IAA precedió al cuajado y al contenido creciente de tZ, la

Abstracts
12
posibilidad de que la fecundación desencadene la síntesis de tZ mediada por la
auxina no puede ser descartada.
La aplicación de ácido giberélico al inicio del cuajado también aumentó,
temporalmente, la concentración endógena de GA1 y GA8, así como el número de
frutos que iniciaron el desarrollo, y retrasó su abscisión.
La aplicación de paclobutrazol en antesis redujo el crecimiento del brote terminal
y anticipó la abscisión de las flores, pero no afectó el cuajado inicial.
En ningún caso se consiguió aumentar el número total de frutos por panícula, de
modo que la competencia entre órganos en desarrollo no es la causa de la falta de
cuajado en esta especie.

Abstracts
13
RESUM
En condicions favorables, l'alvocat qualla més fruits dels que l'arbre és capaç de
portar a la maduresa, de manera que la planta s'ajusta, durant les primeres fases
del desenvolupament, la capacitat de nodrir-modificant el nombre, és a dir,
provocant la caiguda dels que no poden mantenir la seva taxa de creixement.
D'acord amb això, la disponibilitat de carbohidrats podria ser un factor clau en la
abscisió fisiològica d'aquests fruits. Atès que aquesta espècie presenta dicogàmia,
la abscisió de fruits també s'ha atribuït a l'absència de pol·linització, però al
mateix temps s'ha relacionat amb errors en el desenvolupament de la llavor,
l'avortament de l'embrió, el col·lapse de la coberta seminal, i amb l'efecte d'un
estrès ambiental, especialment per fred o calor.
Per tal de demostrar si en l'alvocat la competència entre flors és responsable
del quallat i desenvolupament inicial del fruit, s'ha determinat la influència que
la intensitat de floració té en l'evolució del contingut en carbohidrats i hormones,
en la taxa d'abscisió de fruits i la seva evolució, i, finalment, sobre percentatge de
fruits quallats. Per això s'han dissenyat experiments per a 1) reduir la floració, i
amb això la competència entre flors, 2) reduir el desenvolupament vegetatiu, i 3)
promoure el quallat de fruits.
Els experiments es van dur a terme en horts comercials d'alvocat cv. Hass (grup A
de floració), localitzats a Torrent i Llaurí (València), Espanya, i en Caronia
Marina, Messina, Itàlia. Es van utilitzar arbres adults (5-8 anys d'edat), plantats a
una distància de 5 x 6 m. En tots ells hi havia arbres del cv. Fort (grup B de
floració) per assegurar la pol·linització.
Els resultats demostren que l'aplicació d'àcid giberèlic durant la inducció floral
retardar la brotada, va reduir el nombre de flors per panícula, va augmentar la
longitud del brot desenvolupat a partir del rovell terminal de la panícula, i va
retardar la abscissió fisiològica de fruits.
La seva aplicació en antesi va promoure el quallat de fruits i va retardar la seva
abscisió. Això es correspon amb un augment immediat i temporal de la síntesi
endògena de GA1, IAA i tZ. Però la GA1 va derivar immediatament en el seu
catabolit GA8. Ja que la síntesi de IAA va precedir al quallat i al contingut

Abstracts
14
creixent de tZ, la possibilitat que la fecundació desencadeni la síntesi de tZ
intervinguda per l'auxina no pot ser descartada.
L'aplicació d'àcid giberèlic a l'inici del quallat també va augmentar, temporalment,
la concentració endògena de GA1 i GA8, així com el nombre de fruits que van
iniciar el desenvolupament, i va retardar la seva abscisió.
L'aplicació de paclobutrazol en antesi va reduir el creixement del brot terminal i
va anticipar la abscisió de les flors, però no va afectar el quallat inicial.
En cap cas es va aconseguir augmentar el nombre total de fruits per panícula, de
manera que la competència entre òrgans en desenvolupament no és la causa de la
manca de quallat en aquesta espècie.


General introduction
16
I. GENERAL INTRODUCTION

General introduction
17
I. GENERAL INTRODUCTION
1. ORIGIN AND GEOGRAPHICAL DISTRIBUTION
The avocado scattering center is in Central America and southern Mexico. The
origin in Mesoamerica includes habitats from sea level to over 3,000 meters above
sea level, covering a wide range of climates and soil types, which explains its
great genetic diversity and adaptability. Its introduction in South Africa, Israel,
Chile, Australia and the United States, has resulted in significant genetic
improvements in its quality and agronomic factors, as well as the point of view of
the consumer (Cerdas et al., 2006).
The avocado belongs to the Lauraceae family, one of the most primitive families
of dicots, consisting of 52 genera and about 3,500 species. The genus Persea
consists of 150 species distributed throughout tropical and subtropical regions,
especially Asia and America, where there are about 80 species (Bernal y Díaz,
2005).
Within genus Persea three species are recognized of agronomic interest, one of
which, the P. americana, is composed of several taxa, which are popularly
described as races. Although you can distinguish numerous varieties within each
species, at present there are only three that are marketed and are considered
geographical ecotypes:
P. americana Mill., var. Americana. It corresponds to the Antillean race or
lowland, originates from tropical areas, and grows below 1200 musl in the
tropics.
P. americana (Schlet + Cham) Blake, var. Drymifolia. Known as Mexican race,
it is distributed in the eastern slopes of the highlands, at altitudes above 1000
musl and in hot climates, from arid to semiarid.
P. americana Williams, var. Guatemalensis. Known as Guatemalan race, it
grows from humid and hot climate of the rainy tropical forest to semiarid
places, between 100 and 2300 musl.
The avocado has increased in importance in recent years in many countries around
the world. The United States, Mexico and Brazil are the largest producers, while

General introduction
18
Israel, South Africa, Australia, New Zealand, Philippines, Spain, Cyprus, Canary
Islands, Chile, Ecuador, Venezuela, Greece, and the Caribbean are actively
increasing commercial production (B.O Bergh, personal communication;
Gustafson 1976). Spain is the only European country with a significant
commercial production of avocados, the most cultivated part is the Andalusian
Mediterranean coast, mainly the provinces of Malaga and Granada.
2. TAXONOMY AND MORPHOLOGY
2.1 Taxonomy
Velásquez (2006), presents the following description:
Kingdom: Vegetable
Division: Spermatophyta
Subdivision: Angiospermae
Class: Dicotyledoneae
Subclass: Dipetala
Order: Ranales
Family: Lauraceae
Genus: Persea
Species: Persea americana Miller, Persea gratissima Gaerth, Persea drymifolia
Blake.
2.2 Morphology
The avocado is a perennial plant of great vegetative growth, arriving in its natural
habitat to a height of 10 to 12 m. It has shallow roots, which absorb water and
nutrients mainly in the apices through the primary tissues; this determines the
susceptibility of the tree to excessive moisture that induces to fungi attacks and
vascular rots. The branches are abundant, thin, fragile and sensitive to the sunburn
and frost, can easily be broken when loading many fruits or by the action of the
wind.
Plant: Extremely vigorous tree (powerful trunk with vigorous ramifications), and
can reach up to 20 m of height.

General introduction
19
Leaves: Evergreen tree. Alternating leaves, with peduncles, very bright. When
they are young people they have a reddish colour and when arriving at the
maturity they become smooth, coriaceous and of an intense green.
Flowers: perfect green-yellow, 1.10 cm in diameter, calyx of 3 sepals and corolla
of 3 petals, 12 stamens, 9 of which are functional and 3 staminodes, single pistil
with a single carpel and a single egg, and whose floral formula is 3-3-6-3-3 (Figs.
1-2-3).
Figure 1: Longitudinal section of avocado male flower.
Figure 2: Longitudinal section of avocado female flower.

General introduction
20
Figure 3: Flower of avocado.
Inflorescences: They have about 30 cm of length and contain on average around
250 flowers; an adult of avocado tree can exceed one million flowers. The
majority of inflorescences arise from the axillary buds placed in more terminal
positions of the vegetative shoots, and rarely originate from secondary or not
terminal buds; the terminal bud of this shoot is vegetative, giving this way
continuity, but can abort and not can pursue the growth. It has been suggested
(Scora et al., 2007) that this inflorescence is a tirso with the primary axis
paniculate, ending in a vegetative bud, and with secondary axes dicasicos. The
flowering, depending on the variety, occurs between February and April (Fig. 4).

General introduction
21
Figure 4: Inflorescence of avocado.
Buds: in avocados there are two types of buds:
Floral (Fig. 5)
Vegetative (Fig. 6)
Figure 5: Avocado floral bud.

General introduction
22
Figure 6: Avocado vegetative bud.
The flower bud is thicker than the vegetative and usually has a more yellowish
colour. Up to form the inflorescence it passes through intermediate states,
developing a main axis and several branches in which the flowers are located.
Fruit: Berry with a single seed, oval, sometimes spherical. Smooth or rough
exocarp, light green to very dark surface, almost black. Greenish-yellow
mesocarp, soft and rich in fatty acids. The maturation of the fruit does not take
place until it is separated from the tree.
Root system: It is imperfect in terms of water absorption. Despite that it can be
extended up to the 120 and 150 cm depth, the largest amount of absorbent roots
are located between 0 and 60 cm. Depending on the type of soil, the roots are
more or less absorbed and assumes lateral positions. The primary lateral roots
branch off mostly in secondary lateral, which in turn begin to divide, but in more
open angles. This system of branching develops abundance of rootlets, of white
colour. This superficial radical structure, is extensively suberized and is relatively
inefficient in the absorption of water, which can cause the loss of fruits during the
critical stages of development such as the fruit set and growth of this
(Gardiazabal, 2004).
3. VEGETATIVE DEVELOPMENT OF AVOCADO
Avocado plantations start their production in the third year of established and
stabilizes it from the seventh or eighth year. The three major events of the
phenological cycle of avocado are the root growth, the vegetative growth and the
flowering-fruiting (Cristoffanini, 1996). In conditions of tropical climate, the
avocado can have along a same year one or more vegetative cycles followed by a
period of root growth. The roots begin their growth when the first vegetative
growth begins to decline. Subsequently, a second period of vegetative growth

General introduction
23
begins, restoring this way the balance between a phase of root growth followed by
another vegetative phase (Calabrese, 1992; Hernandez, 1991) (Fig.7).
As in most of the evergreen fruit trees the growth of the vegetative shoots of the
Avocado is synchronized in the flows that vary in force, duration and magnitude
(Scora et al., 2002; Rocha-Arroyo et al., 2011). These flows generally occur two
or three times a year and may or may not include the entire tree (Davenport,
1986). Their number depends on the environmental conditions, the magnitude of
each one of them is variable, and usually only one is responsible for the
reproductive development (Salazar-Garcia et al., 2006; Salazar-Garcia et al.,
2007; Rocha-Arroyo et al., 2011).
The vegetative growth presents a defined sigmoidal growth pattern, in which the
initial stage presents a slow growth, followed by a significant increase and a final
stage of stable growth. The stage of accelerated growth coincides with the
flowering stage, in which it is possible to achieve a rate of growth of the
vegetative shoots of up to 3 mm/day. These streams can last 3 to 4 months. In the
subtropics the magnitude of this growth is determined strongly by the seasonality,
being higher in spring (Dixon, 2007).
In a study conducted by Rosales et al. (2003) it was observed that the apical
vegetative growth of "Hass" avocado starts 7 days after the start of the sprouting
of reproductive buds, rising progressively from the 29th
days to submit its highest
rate of growth to the 67th
days, then drops to 144th
days, after which time the rate
of vegetative growth is virtually zero. In the case of lateral shoots the growth
occurs in a single period which spans from the 29th
to the 122th days, being its
intensity lower that the apical vegetative growth.
The temperature is the main factor responsible for the changes in the vegetative
phase to the reproductive phase. Subtropical avocados cultivars, that are
developed with success in the tropics at high altitudes and in the subtropics with
cold winters, can produce floral buds only if they are kept under regimes of cold
temperatures (Gazit and Degani, 2002), a requirement that is not, however,
essential to the cultivars of avocados that grow in cold climates, in semi-arid and
tropical and semi-tropical climates.

General introduction
24
Figure 7: Phenological growth stages of the avocado tree. Pink area (flowering), Green area
(vegetative development) and Curve (fruit development).
4. FLOWERING
4.1 Induction and floral differentiation
Little is yet known about the reproductive biology of this species. It has been
pointed out that the first anatomical signs of the floral initiation are detectable in
autumn or early winter, depending on the breed of avocado and on the locality
(Scholefield et al., 1985; Thorp et al., 1993), and the process of floral initiation
occurs only after the shoots enter a period of rest (Davenport, 1982, 1986).
However, recent studies suggest that the process of initiation begins long before
(Salazar-Garcia et al., 1998, 1999), so for Southern California, and for the cv.
Hass, the transition from the vegetative state to the reproductive in the sprouting
of summer takes place at the end of the expansion of sprouting, i.e. from the end
of July to August. Similarly, Calabrese (1992) said that the differentiation of the
floral buds takes place in November-December.
At the end of the growth of the summer sprouting (end of July to the HN), the axis
of the primary meristem form one or two secondary axes, in the armpits of the
bracts of the inflorescence, whose meristems can develop further and be
transformed into flowers, but in this state of development its transformation is not
yet irreversible. It has been suggested that under unfavourable environmental
conditions for the reproductive growth, the development of these meristems is
FE
BR
ER
O
MA
RC
H
AP
RIL
MA
Y
JU
NE
JU
LY
AU
GU
ST
SE
PT
EM
BE
R
OC
TO
BE
R
NO
VE
MB
ER
DE
CE
MB
ER
YA
NU
AR
Y
Fruit development
Final 1st physiological
fruit drop
Final 2st physiological
fruit drop

General introduction
25
penalized. About three months later, at the end of November, four secondary
floral meristems are already present, and we are able to appreciate macroscopic
signs of a partial senescence of the most external bracts of the apical buds. During
this state of development, the bud is irreversibly induced to flower. Two months
later, at the end of December, the bracts of the buds are separated, and the
flowering bud can be easily recognized by its external form. In this state of
development of the bud 10 meristems of secondary floral axes can be recognized
(Salazar-Garcia et al., 1998).
At the end of the process of induction there are no apparent macroscopic or
anatomical changes in the apical buds of Hass, which remain with two secondary
meristems (Salazar-Garcia et al., 1999). In the axillary buds, the situation differs
in respect of the apical. At the end of the period of induction, the axillary buds
only have two meristems of secondary axes floral, which constitutes the
irreversible condition of the differentiation of the bud to flower (Salazar-Garcia et
al., 1999).
The differentiation and floral development in the avocado generally occurs in
autumn and winter, when the duration of the day is less than 12 h and the
temperatures are relatively low.
The expansion of the inflorescence of the shoot is apparent in January, although
the floral initiation occurs several months before (Salazar-Garcia et al., 1998). The
carbohydrate reserves of the shoot could, in this way, be an important reserve for
the development of the panicles, very demanding on energy from carbohydrates
(Jackson and Sweet, 1972).
4.2 Reproductive biology
The avocado flower is bisexual having both functional male and female organs
although separated in time through a synchronous protogynous dichogamous
breeding system that prevents self-pollination and promotes outcrossing.
This mechanism prevents the autogamy (fusion of gametes formed in the same
flower), since the flower although morphologically hermaphroditic, acts as
unisexual.
Each perfect flower opens twice, the first functionally as a female flower with a
white receptive stigma; then the flower closes and the following day the flower

General introduction
26
reopens functionally as a male flower, with the stigmas no longer receptive, and
dehisced anthers.
The different avocado cultivars are classified in two groups (A or B) based upon
their flowering behaviour (Fig. 8).
In the type A cultivars, the flowers open in the morning in the female stage (Fig.
10), close at midday and reopen the afternoon of the following day in the male
stage (Fig. 9).
In the type B cultivars, the flowers open in the afternoon in the female stage, close
in the evening and reopen the following morning in the male stage. Both of a type
as the other remain closed during the night.
While some cultivars, as Waldin, Lula, Trapp, Taylor, among others, hold very
well to this dicogamy, most of them have an overlap of these cycles, more or less
extensive, making this phenomenon lose relevance.
For the case of the former, which bear or observe with accuracy the dicogamy, it
is necessary to intersperse cvr. both types of cvr to increase the percentage of
fertilization of the flowers.
It is really essential in the flowering of the Avocado the presence of pollinator
agents at the time of flowering, therefore it is advisable to have hives in the crop.
Floral type Morning Afternoon
Day 1 A closed
B closed
Day 2
A closed
B closed
Figure 8: Timing of flowering for “A” and “B” flowering avocado types.

General introduction
27
Figure 9: Male flower of avocado.
Figure 10: Female flower of avocado.
However, this floral behaviour is only observed under optimum climatic
conditions because the cycle may be disrupted due to it is extreme sensitivity to
environmental conditions particularly to cool temperatures (Stout, 1923; Lesley
and Bringhurst, 1951; Bergh, 1969, 1974; Sedgley and Annells, 1981).

General introduction
28
For a thermal regime 25/16° C the flower behaves as described above. But for
temperatures below 21° C and low light conditions, this floral behaviour can be
reversed (Calabrese, 1992). Aubert and Lossois (1972) described 13 phenological
stages in the phenology of shrub species, divided into three periods: 5 states for
the vegetative phase, 5 states for flowering and 3 states for fruiting. However,
such graphic scale does not clarify the evolution of such statements and does not
include the avocado dicogamic process. Salazar-Garcia et al. (1998) raised for
avocado macroscopic and a microscopic scale of 11 states from the closed bud to
flower anthesis, linking the external appearance of the buds with the degree of
development of the floral meristem. But even this scale reflects the evolution of
the masculine and feminine flower states or fruit set states. Finally, Cabezas et al.
(2003) conducted a state-type identification within the cycle of flowering and
fruiting of avocado, considering morphological aspects of buds and flowering
behavior regarding the presented dicogamia. The authors present a phenological
model with 10 states, from dormant bud until tender fruit, based on the proposal
of Aubert and Lossois (1972).
The flowering of this species is markedly prolonged, firstly because, the induction
process in autumn lasts between two and three months in areas where
environmental conditions are softer, and, secondly, that cold temperatures at the
beginning of spring prolong flowering (Wolstenholme et al., 1990).
5. FRUIT SET AND DEVELOPMENT OF FRUIT
5.1 Fertilization
One of the main limitations in avocado production worldwide is the massive
abscission of flowers and developing fruits, especially in the first two months
following flowering. Sedgley and Alexander (1983) mention that the avocado
trees can produce thousands of inflorescences, each of which may have more than
300 flowers, so that the total number of flowers per tree reaches over one million.
Flowering contributes with a 8% to the total production of dry biomass in a
complete growth cycle of an avocado tree and the process mobilizes nonstructural
carbohydrates, reserves, and nutrients from leaves (Gazit and Degani, 2002).
Romero (2011) found that in a year of high production, more than 100x103
flowers produced only 168 became a fruit. In other cases, such as adult trees

General introduction
29
Guatemalan race, fruit set barely reached between 0.001% and 0.23% of a total of
more than 1.5 x 10⁶ flowers (Gazit and Degani, 2002), and Lahav and Zamet
(1999) indicates, for the cultivar Fuerte, that only 0.015% of flowers become ripe
fruits. In short, the avocado is a species with very intense flowering in subtropical
conditions where it may exceed 2 x 10⁶ flowers of which only between 0.001%
and 0.1% reach the fruit set (Salazar-García and Lovatt, 1998; Dixon and Sher,
2002; Can-Alonzo et al., 2005; Cossio-Vargas et al., 2007b, Garner and Lovatt,
2008).
5.2 The physiological fruit drop
In the cv Fuerte, Garner and Lovatt (2008) found a rapid drop of reproductive
structures a few days after the greater part of the flowers had reached anthesis,
and this does not seem to depend on the climatic conditions of cultivation, this is,
tropical or subtropical (Romero, 2011; Zamet, 1999; Dixon et al., 2007a; Garner
and Lovatt, 2008; Alcaraz et al., 2011). This pace of abscission has also been
recorded in other species such as citrus, pear, mango, etc., which present a
maximum of abscission during the first month after the anthesis, followed by a
decline in the rate of abscission coinciding with the increase of fruit set.
Avocado fruit that fail to set can be divided into two groups: fruit resulting from
flowers in which pollination occurred, but subsequent fertilization failed to take
place (in some crops, pollination in the absence of fertilization is sufficient to
stimulate development of the ovary into a mature, seedless fruit; this rarely occurs
in avocado); and fruit resulting from flowers in which both pollination and
fertilization occurred, resulting in a normal embryo and seed (Lovatt, 1990).
Sedgley (1987) found that during the first week after the anthesis, 80% of the fruit
drop came from pollinated but not fertilized flowers, while a month after the
anthesis all fruit drops had been fertilized and showed a normal development of
the embryo and endosperm. It is the study of this fruit drop fertilized that has
deserved greater attention.
Under favourable conditions, avocado fruit set is very numerous, in these
conditions, the plant during the first three or four weeks, causes the fruit drop to
reduce the number of fruits. Later, during the summer, when the fruit has reached
between 10% and 40% of its final size, a second abscission occurs (Whiley et al.,

General introduction
30
1988; Wolstenholme et al., 1990).
The first abscission, i.e, which occurs once the fruits begin the fruit set, can be
attributed to fruits with faults in the development of the seed, embryo abortion or
death of the seed coat (Dixon and Sher, 2002; Kohne, 2004; Alcaraz et al., 2011),
and the effect of environmental stress, particularly cold or heat (Gazit and Degani,
2002). The second fruit drop has been attributed to rapid utilization of
carbohydrate reserves in the tree, so that the necessary photo-assimilated exceed
the photosynthetic capacity of leaves and sink growth is limited by availability of
metabolites (Gazit and Degani, 2002). Under these conditions only the fruits of
greater vigor may persist on the tree (Laskowski, 2006). This competition can also
be given between fruits development and vegetative growth (Bower y Cutting,
1988; Gazit and Degani, 2002). Fruit development strongly competes with roots
and new shoots, reducing the reserves and suffering its drop (Wolstenholme and
Whiley, 1995; Rosales et al., 2003). That is why Cossio-Vargas et al. (2007a)
suggest that fruit drop marks the competition periods between vegetative growth
and fruit development, directly affecting productivity.
Carbohydrate availability is considered a key factor in the fruit abscission. Thus, it
has been shown that techniques for increasing carbohydrate levels result in an
increased number of fruits and in bigger fruit (Wolstenholme et al., 1990; Lovatt,
1997). Conversely, young fruit abscission is the result of an insufficient supply of
photoassimilate to the fruits due to high competition among those who have
initiated development. This mechanism, however, is not incompatible with the
hormonal regulation by which the fruits are demanding carbohydrates to ensure
their survival (Paz-Vega, 1997; Lovat, 2006).
5.3 Vegetative development-fruit development relationship
This competition for carbohydrates can also occur between the growth of young
fruits and vegetative growth (Bower and Cutting, 1988; Gazit and Degani, 2002).
The development of the fruit strongly competes with roots and new shoots,
reducing the reserves to a minimum at the time of the fruits drop (Wolstenholme
and Whiley, 1995; Rosales et al., 2003). Cossio-Vargas et al., (2007a) have noted
a significant of fruits drop that mark the periods of competition between the
vegetative growth and the development of the fruit, directly affecting productivity.

General introduction
31
Previous studies (Paz-Vega, 1997; Salazar-Garcia et al., 1998; Salazar-Garcia and
Lovatt, 2002) demonstrate that an abundant harvest uses a large amount of energy
running out part of the reserves of the tree, so that the availability of resources is
limited, significantly decreasing the intensity of flowering and significantly
increasing the production of vegetative shoots. Lovatt (2006) found that the
presence of the fruit inhibits the development of floral shoots and promotes the
development of vegetative buds, increasing the number of buds that fail to sprout
the next cycle. This difference is considered to be a determining factor in the
establishment of the alternate bearing in the avocado (Dixon, 2007).
5.4 Alternate bearing
The low production of the avocado is the result of a series of events that occur
along the reproductive development. The determination of the states which are
sensitive to the abscission during the reproductive development is a prerequisite to
investigate the physiological bases of the low production of the avocado and the
development of agricultural strategies to increase its production. It has been
demonstrated that it can be increased in the abscission of flowers and fruits set as
a result of numerous factors, including extreme temperatures, nutritional
deficiencies and genetic factors. Even under optimal conditions, the abscission of
flowers and fruits in avocado is excessive.
Unfavourable climatic conditions during the critical period of flowering or fruit
set (damage by cold, low or high temperatures, water availability) result in loss of
flowers and fruits generating a low performance. In these conditions the reserves
of the tree are used to a lesser extent and are available for the next production
cycle in which the photoassimilatory system is greater, which is why it generates a
greatest flowering, fruits set and harvest, giving rise to the imbalance in the
production cycles (Lovatt, 2006). In Israel and California, this behaviour can be
the result of a stress by high temperatures (35-40ºC) accompanied by RH very
low and high winds (Lomas and Zamet, 1994).
In accordance with this, the productivity of many varieties of avocado, including
cv. Hass, is characterized by the alternate bearing, a year of high harvest (year
"on") is followed by another of low harvest (year "off") then another of high, and
so on (Paz-Vega, 1997; Lovatt, 2006). A year "on" is determined by an intense

General introduction
32
flowering, high percentage of fruit set and high performance, while a year "off" is
characterized by a low flowering, low percentage of fruit set and low performance
(Paz-Vega, 1997; Lahav and Zamet, 1999; Bruwer and Robbertse, 2003; Dixon et
al., 2007). Practices such as the maintenance of the fruits in the trees for long
periods with the aim of increasing the dry matter and the oil content, intensify the
alternation (Salazar-Garcia and Lovatt, 2000).
A study of Salazar-Garcia et al. (1998) showed that the reduction of the flowering
is associated to a decrease of inflorescences (13% of the total number of
buds/branch) and a high production of vegetative shoots (72% of total
buds/branch). Thus, the flows of vegetative growth occur to a lesser extent in the
year "on", while in the year "off" the growth is greater, and this difference is
determinant of the alternation of crops in the avocado (Dixon, 2007). Salazar-
Garcia et al. (2006) found that only 13% of the total vegetative shoots produce
floral shoots after a year "on", while after a year "off" 46% of them produces
floral shoots.
Two scenarios have been presented to explain why the development of the fruit in
a productive cycle inhibits the flowering and fruiting of the next cycle. The first is
based on the higher demand of mineral nutrients, water and carbohydrates
required for the processes of flowering, fruit set and ripening. A tree with a high
fruit load in the year "on" exhausts the available reserves due to the greater
extraction, and does not accumulate the necessary nutrients to sustain the
following year a high intensity of flowering and a suitable load while trees in a
year "off ", which presents a low harvest and higher production of vegetative
structures, accumulate more reserves than nutrients to produce an intense
flowering and a high performance in the next cycle (Paz-Vega, 1997).
It should be borne in mind that the magnitude of the alternation can vary, as
stocks of carbohydrates depend on the environmental conditions and the handling
of the crop. The second hypothesis is based on the reciprocity between the
development of floral shoots and vegetative shoots for trees in a year "on" vs.
trees in a year "off" is a clear indication that the growth regulators are playing an
important role in the alternation of production cycles in the avocado, more than
the availability of carbohydrates and nutrients (Paz-Vega, 1997; Lovatt, 2006).

General introduction
33
This hypothesis is based on the fact that the growth regulators which can be found
in the seed of the developing fruits during a year "on" are in greater quantity,
because a larger number of fruits is developed, favouring the vegetative growth
during the next production cycle or year "off " to the detriment of the production
of reproductive shoots (Paz-Vega, 1997).
Currently these hypotheses have been overtaken by the demonstration that in the
years "on" the fruit suppresses the expression of the gene ortholog FLOWERING
LOCUS T, PaFT (Ziv et al., 2014) from the end of October to the end of
November, and only in the buds of the trees "off" is an expression of the floral
identity transcripts PaAP1 and PaLFY, with significant variations detected since
October and November respectively, in a similar way as it was demonstrated in
the action of the fruit in the citrus fruits (Muñoz-Fambuena et al., 2011; 2012).
5.5 Stimulation techniques of fruit set
Under the hormonal point of view the application of gibberellins (gibberellic acid)
to the flowers has been developed as an effective technique to increase production
in species with difficulties of fruit set, as citrus fruits (El-Otmani et al. 2000). The
application of GA increases the number of fruits that initiate the development, but
if it is too high, the result an intense flowering, the not avoided abscission, is
postponed. On the contrary, if the number of flowers is reduced, competition is
low and the percentage of ovaries that begin their development, after the
application of GA, not only increases but persists until the harvest.
An alternative technique is the ringing, cultural practice consisting in marking a
complete ring of approximately 1 mm in width in the crust of the secondary
branches of the tree, without affecting the xylem or delete the crust. Although it
has been noted a hormonal effect derived from ringing, its priority action is
through an improvement in the availability of carbohydrates as a result of the
encouragement of the photosynthetic activity (Rivas et al., 2007).
As in the case of the applications of GA, the ringing in extreme conditions of high
flowering is incapable of promoting the fruit set of species or varieties with
parthenocarpic capacity, indicating that the high competition between bodies in
development and the problems of pollination is the cause of the low capacity of
the fruit setting of these plants. In these conditions, the availability of the fruit by

General introduction
34
carbohydrates is so committed that it is practically impossible to improve and that
is why the ringing may prove to be ineffective. Also in this case the reduction of
flowering it is necessary to increase the fruit set.
Finally, a pruning that can generate vegetative shoots that mature before the
period of floral induction could ensure this in new leaves, allowing a number of
buds to develop flowers even in conditions of high harvest (Mesejo et al. in
preparation).
6. THE ROLE OF CARBOHYDRATES IN SETTING AND FRUIT
DEVELOPMENT
In the avocado, soluble sugars of seven carbons (C7) are mostly the carbohydrate
reserves (Liu et al., 1999). These sugars of seven carbons are unusual sugars in
nature and have been found in only a few species of plants (Richtmyer, 1970).
Other fruit species, such as apple trees, pear trees, olive trees, etc. will produce
alcohol sugars of 6 carbons, as sorbitol and mannitol, which are mostly used for
its transport. The avocado also produces a sugar alcohol, perseitol, a polihidroxi
derivative of the reducing sugar D-manoheptulosa, also 7C (Liu et al., 1999),
which is transported by the plant. Large quantities of these C7 sugars have been
found in leaves, buds, trunks, and roots, and their concentration reaches higher
values than that of the starch (Liu et al,.1999a), carbohydrate of reserve also in the
avocado (Olivera and Priestley, 1988; Scholefield et al., 1985).
The fruit of avocado is characterized by a high respiratory rate during the
development and maturation postharvest (Blanke and Whiley, 1995; Bower and
cutting, 1988; Whiley et al., 1992), but little is known about the sugars that are
used as substrate (Eaks, 1990; Luza et al., 1990). The highest rates in the
respiratory avocado fruit have been observed during the early stages of the growth
of the fruit (up to 12 weeks after anthesis), period of greater cell division.
Subsequently, they decrease until reaching the lowest values just before the start
of the ripening (Whiley et al., 1992).
Liu et al. (1999b) show a decrease in the concentration of C7 sugars in the skin
and flesh of avocado after its storage at low temperature and after the maturation,
suggesting the existence of an enzymatic mechanism of metabolism of these.
The fruit of avocado does not mature in the tree (Bower and Cutting, 1988). The
General introduction
35
possibility that a reduction in the concentration of sugars is prerequisite for its
maturation has been raised. Only when the fruit is separated from the tree and the
contribution of this from the sources, therefore, stops and you can start the process
of maturation. The sugars of 7 C, D-mannoheptulose and perseitol, could thus
play a role in the control of the maturation, but the fact that the D-mannoheptulose
is a powerful inhibitor of the hexokinase and therefore of the respiratory
glycolytic processes complicates this interpretation (Board et al., 1995; Leon and
Sheen, 2003).
On the other hand, the mannoheptulose might be necessary in order to encourage
the export of sugars and its load in the phloem, thus ensuring the growth of the
fruit. Later, the metabolism of the mannoheptulose, in another place of the tree
can involve a ketoreductase and the formation of perseitol. Both the
mannoheptulose and the perseitol are products of the assimilation of CO2 in the
leaves, and a recent study suggests that in this body the mannoheptulose is formed
as a phosphorylated product of the sedoheptulose-1,7 diphosphate, track
condensation of the dihydroxyacetone phosphate and erythrose 4-phosphate (Liu
et al., 1999; 2002).
7. HORMONAL CONTROL OF FRUIT SET AND FRUIT
DEVELOPMENT
In the avocado, competition between young fruits in development and those with
the vegetative growth of spring has been related to the reduction of the fruiting
(Kalmar and Lahav, 1976; Köhne, 1987; Bower, 1990). At the same time, as said,
the fruits set reduce the intensity of vegetative development in the sprouting of
summer and autumn (Whiley et al., 1988). In addition, fruits compete for
resources among themselves affecting, this way, their final size (Wright, 1989).
All these processes of nutritional type are, however, hormonally regulated
(Naylor, 1984).
In some species of fruit of perennial leaf in which the intensity of flowering can
be reduced easily, the partial inhibition of flowering has been shown to be an
effective mechanism to reduce competition among flowers in development and
improve the fruit set, and this even for species/cultivars parthenocarpic. Thus, in
mangos, oranges, tangerines and lemons, the application of gibberellic acid (GA3)

General introduction
36
in autumn, during the time of floral induction, significantly reduces the intensity
of flowering favouring the fruit set (Monselise and Havely, 1964; Chacko et al,
1972; Nir et al, 1972; Guardiola et al, 1977; Oohata Iwahory, 1981; Nuñez-Elisea
and Davenport, 1991). This effect in citrus fruits has been associated with the
reduction of the gene expression of the gene FLOWERING LOCUS T (FT)
(Muñoz-Fambuena et al., 2012b) and with the reduction of the sprouting
(Guardiola et al., 1984, Garcìa-Luis et al, 1986; Muñoz-Fambuena et al, 2012b),
and leads to a redistribution of the sprouting increasing the percentage of
inflorescences with leaves and decreasing the leafless. Both results, reduction in
flowering and increase of inflorescences with leaves, as a whole, increase the
percentage of flowers that exceed the fruit set and the number of fruits that initiate
the development and reach the maturation.
In the avocado similar results have been achieved by inhibiting the flowering
(Salazar and Lovatt 2000), but its effect on the fruit set and the final harvest has
not been studied.
A recent research has shown that the GA3 altered the phenological stages and
morphology of the inflorescence (Salazar-Garcia and Lovatt, 1998). Implemented
in November, at the time of floral induction, gibberellic acid reduces the intensity
of flowering due to the production of inflorescences partially formed, each with a
smaller number of flowers, but with the development of an accelerated vegetative
shoot. The results suggest that the possibility of applying it in November in an
"off" year would equal the alternation by reducing the formation of secondary
axes of shoots of inflorescences. Subsequent applications (December or January)
would not affect the inflorescences or the number of flowers, but accelerate the
development of vegetative shoot in the apex of the indeterminate inflorescences.
Due to the advanced development caused by the implementation of GA3, the
leaves become sources of photo assimilates in fruit set, instead of sinks of
competition (Blanke and Lovatt, 1998). Therefore, the foliar applications of GA3,
both early and late, provide strategies for the handling of the productivity of the
avocado.

II. HYPOTHESIS

Hypothesis
38
II. HYPOTHESIS
In accordance with the foregoing, our working hypothesis is that in avocado
flowering intensity is responsible for fruit set and initial development of the
fruit.
To prove it, we have determined:
1. The influence of the flowering intensity in the time course of carbohydrate
content during the first flower drop.
2. The influence of number of flowers on the rate of fruitlet abscission.
3. Hormonal control of the process. Time course of auxin, gibberellins and
cytokinins.
4. Percentage of fruit set.
So we have designed a series of experiments in order to:
Reduce flowering.
Reduce competition between flowers and vegetative growth.
Promote fruit set.

III. MATERIALS AND METHODS

Materials and methods
40
III. MATERIALS AND METHODS
1. VEGETAL MATERIAL
The experiments were carried out in commercial orchards of avocado (Persea
americana Mill.) cv. Hass (group A flowering), located in Torrent and Llaurí
(Valencia), Spain, and in Caronia Marina (Messina), Italy. Adult trees (5-8 years),
planted at a distance of 5 x 6 m., appearing uniform, in good sanitary condition
and with proper agronomic management throughout the period of the experiment,
were used.
In Llaurí 8 trees arranged in random, 8-year-old grafted on rootstock 'Duke 7'
were used. In this plantation there were cv. Fuerte trees (group B flowering) in a
ratio of 1:10, to ensure pollination.
In Torrent 36 trees arranged randomly, 5 years old, grafted on rootstock 'Toro
Canyon' were used. In this plantation there were cv. Fuerte trees, in proportion
1:10, to ensure pollination.
In Caronia Marina 8 trees arranged randomly, 5 years old, grafted on rootstock
'Toro Canyon' were used. Also, here pollination was ensured with cv. Fuerte trees
in a ratio of 1:10.
2. EXPERIMENTAL DESIGN
2.1 Intensity of flowering vs. fruit set
The study was conducted in Torrent during the 2015-16 campaign. Dates of
treatments and sampling are presented in Table 1.
For this experiment 6 trees were selected randomly, during the time of floral
induction (phenological state 010 BBCH scale Alcaraz et al, 2013) foliar applied
GA3 at a concentration of 50 mg l-1
(5 l/tree), which a nonionic surfactant at a
concentration of 0.01% was added. The application was made with tank at a
pressure of 25-30 atm, wetting to dripping trees. Six Other trees with similar
conditions were selected as control.
Three branches of the same size, approximately, and two years old, were
randomly selected from each of the trees, south, northeast and northwest oriented,
in order to count their sprouting and flowering nodes at the time of floral

Materials and methods
41
differentiation (phenological stage 519 of BBCH scale). On each count date buds
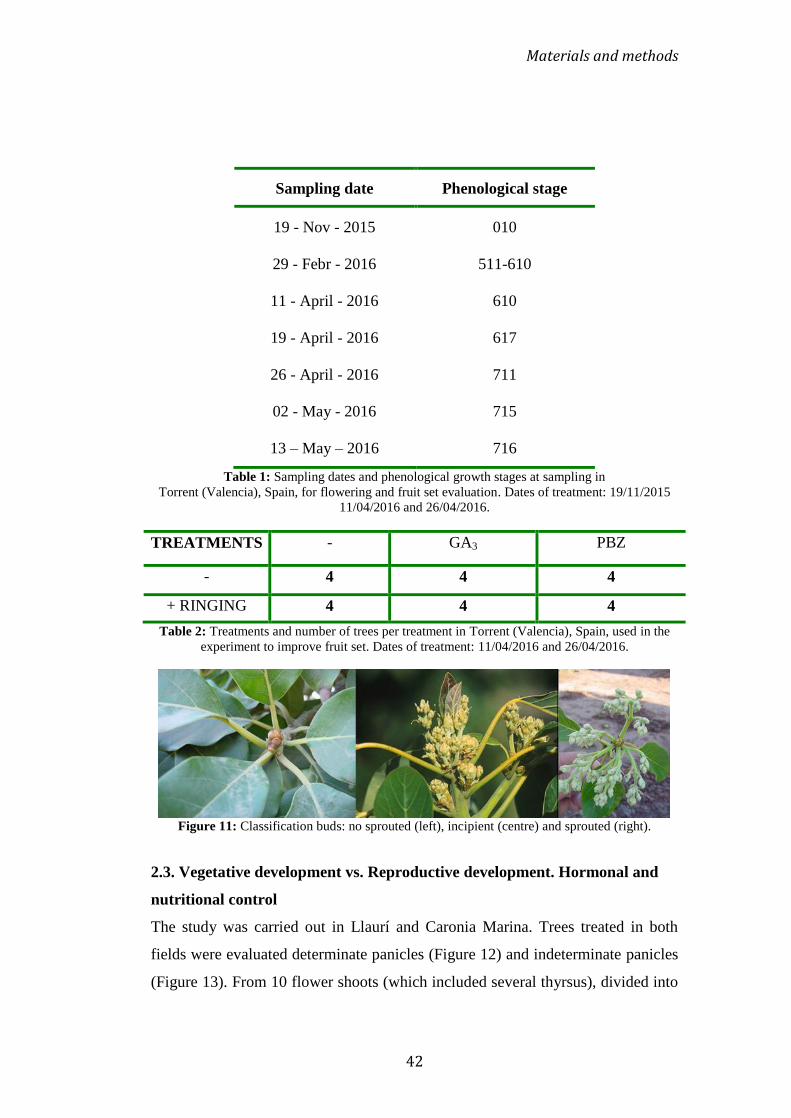
were classified as no sprouted (NS), incipient (I) and sprouted (S) (Figure 11).
In addition, 12 panicles were randomly selected in winter, before sprouting, from
each treatment, randomly distributed among the 6 trees, which were counted the
number of flowers.
At the time of anthesis (phenological stage 610 BBCH scale) the status of each
type of node was evaluated, and the number of flowers, as the result of
multiplying the number of knots that had been observed in a panicle, was
calculated by the average number of flowers per panicle. In this case the results
were also expressed by 100 nodes. In addition, from 12 panicles per treatment, the
evolution of the shoot developed length of vegetative terminal bud is periodically
evaluated.
2.2. The exogenous control of the abscission of reproductive organ
5 treatments (table 2) were conducted in anthesis: gibberellic acid (GA3) at a
concentration of 50 mg l-1
, paclobutrazol (PBZ) at a concentration of 50 mg l-1
,
ringing (RN), and combinations of gibberellic acid + ringing (RN + GA3, 50 mg l-
1) and paclobutrazol + ringing (RN + PBZ, 50 mg l
-1). In other trees the same
treatments were performed after 15 days, when the fruit had a diameter of 3 mm
(state 711 BBCH). For each treatment four trees were used. The experiments were
conducted for two consecutive years in Llaurí, Torrent and Caronia Marina. In
Llaurí and Caronia Marina treatments were performed individually at the
inflorescence; in Torrent on the entire tree.
Weekly fruit set was evaluated by counting the average number of fruits per
panicle of 8 panicles per treatment, and development of the average length of 10
shoots developed from vegetative terminal bud of the panicle.
At the same time fruits and shoots developed from treated panicles were sampled.
Materials and methods
42
Sampling date Phenological stage
19 - Nov - 2015 010
29 - Febr - 2016 511-610
11 - April - 2016 610
19 - April - 2016 617
26 - April - 2016 711
02 - May - 2016 715
13 – May – 2016 716
Table 1: Sampling dates and phenological growth stages at sampling in
Torrent (Valencia), Spain, for flowering and fruit set evaluation. Dates of treatment: 19/11/2015
11/04/2016 and 26/04/2016.
TREATMENTS - GA3 PBZ
- 4 4 4
+ RINGING 4 4 4
Table 2: Treatments and number of trees per treatment in Torrent (Valencia), Spain, used in the
experiment to improve fruit set. Dates of treatment: 11/04/2016 and 26/04/2016.
Figure 11: Classification buds: no sprouted (left), incipient (centre) and sprouted (right).
2.3. Vegetative development vs. Reproductive development. Hormonal and
nutritional control
The study was carried out in Llaurí and Caronia Marina. Trees treated in both
fields were evaluated determinate panicles (Figure 12) and indeterminate panicles
(Figure 13). From 10 flower shoots (which included several thyrsus), divided into

Materials and methods
43
two trees per treatment, the time course of the first physiological flower drop was
weekly evaluated (Tables 3 and 4). For this, the inflorescence is introduced into a
bag and minimally waved to collect all the flowers that had started the process of
abscission. The collected flowers, were carried to the laboratory at low
temperature (7° C), counted and frozen for lyophilization. Then they were
triturated for further analysis of carbohydrates and hormones.
In the latest dates, when no more flowers of the tirso were exuded, fruits set and
leaves were taken. They were taken to the laboratory and handled like flowers. At
the same time the length of the terminal shoot was measured.
Figure 12: Determinate panicle. Figure. 13. Indeterminate panicle.
Sampling date Phenological stage
31-March-15 518/113 BBCH
09 -April -15 610 BBCH
16 -April -15 617 BBCH
23 –April- 15 618 BBCH
28 -April -15 711 BBCH
04 -May -15 712 BBCH
11 -May -15 713 BBCH
15 -May -15 715 BBCH
29 -May -15 716 BBCH
08 -June -15 717 BBCH
13 -July -15 719 BBCH
Table 3. Sampling dates and phenological growth stages at sampling in
Llaurí (Valencia), Spain, for the evaluation of fruitlet abscission. Date of treatment: 09/04/2015.

Materials and methods
44
Sampling date Phenological stage
05-April-15 518/113 BBCH
04-May-15 617 BBCH
14-May-15 618 BBCH
25-May-15 711 BBCH
04-June-15 712 BBCH
26-june-15 715 BBCH
20-July-15 719 BBCH
Table 4: Sampling dates and phenological growth stages at sampling in
Caronia Marina (Messina), Italy, for the evaluation of fruitlet abscission.
Date of treatment: 25/05/2015.
Figure 14: Some of the primary and secondary phenological growth stages of avocado tree
according to BBCH-scale.

Materials and methods
45
3. ANALYSIS OF CARBOHYDRATES
Analysis of soluble sugars is performed according to the protocol Tesfayac et al.,
(2012) with certain modifications. Sugar determination, powdered samples [100
mg dry weight (DW)] were extracted with 1.0 ml 80% (v/v) ethanol. For recovery
purposes, a known amount of mannitol (Sigma Chemical Co., Madrid, Spain), a
sugar absent in the phloem sap, was added to the extracts as an internal standard.
The extracts were then incubated at 80° C for 5 min and centrifuged at 15,000 × g
for 10 min. The supernatant was removed and the pellet re-extracted twice, as
above. The supernatants were evaporated in vacuum at 45° C to 0.5 ml, and
residues were re-dissolved in 1.0 ml water and purified sequentially by cation
exchange Dowex 50×(8–100 mesh; Sigma Chemical Co., Madrid, Spain) and
anion exchange Dowex 1×(4–400 mesh; Sigma Chemical Co., Madrid, Spain)
chromatography. The 1.0-ml columns were pre-equilibrated with 2 M HCl and 1
M Na2CO3, respectively, and washed with 50 column volumes of water before
sample application. The elutes (1.0 ml extract and 2 ml water washings) were then
passed through a C18 Sep-Pak cartridge (Waters Millipore, Barcelona, Spain). An
aliquot of 0.5 ml was acidified with 25 μl of 0.1 M H2SO4 and filtered through a
0.45 μm membrane (Waters Millipore, Barcelona, Spain). Sugars were analysed
using a HPLC Spectra System® (Spectra, San Jose, CA, USA) connected to a
differential refractometer (Spectra R150), vacuum pump (Spectra P2000), and
ChromQuest® Chromatography Data System for Windows NT (Thermo Quest
Inc., San Jose, CA, USA). Twenty-microlitre aliquots of the filtered extracts were
injected into a Hypersil® APS-2 (250 × 4.6 mm) column (Thermo Quest Inc., San
Jose, CA, USA). The column was kept at 25° C, and pure mQ water was used as
the solvent at a flow rate of 0.5 ml min−1
. Glucose-6-phosphate, sucrose, glucose,
fructose and perseitol were identified according to their retention times. Sugar
quantification was performed using peak area calculation related to regression
curves for known concentrations of sugars (Sigma Chemical Co., Madrid, Spain),
taking into account the recovery of each sample. The effectiveness of the
extraction was ascertained by the amount of mannitol used as an internal standard.

Materials and methods
46
4. HORMONAL ANALYSIS
Hormonal analysis is performed from 50 mg of lyophilized material. Duplicate
aliquots of each sample (50 mg) were extracted with 80% methanol: acetic acid
1% (v/v) in the presence of specific internal standards (labeled hormones
deuterium to quantify losses of each hormone inherent extraction process)
[OlChemim Ltd - Olomouc, o Cambridge Isotope Lab - Andover]: [17,17-2H]
GAn, [2H5]-IAA y [
2H6]-ABA). These standards were added to quantify each of
different gibberellins (GA’s), indoleacetic acid (IAA) and abscisic acid (ABA). In
the case of the cytokinins, them forms deuteradas of the trans-zeatina (D-tZ),
dihidro-zeatina (D-DHZ) e 2-isopentenil-adenina (D-iP) are used as standards
internal.
To recover the acid fraction where the GA’s, el IAA and ABA are located,
extracts passed consecutively through columns HLB (Waters Cromatograf a, S.A.,
Barcelona, Spain) reverse phase, MCX (cation exchange) and WAX (ion
exchange) (Oasis 30 mg, Waters Cromatograf a S.A., Barcelona, Spain) as
described in Seo et al. (2011). For recovery of the basic fraction where cytokinins
are located, the samples passed first through an HLB cartridge (elution
CH3CN80: acetic acid 1%) and then through an MCX column. Samples were
taken to dryness in a rotary evaporator.
The dry residue was dissolved in 5% acetonitrile and 1% acetic acid, and
hormones were separated using ultra-chromatography in reverse phase (UPHL)
through a column RP-MS Accucore 2,6 μm (50 mm x 2,1 i.d.: Thermo Fisher
Scientific Inc., Waltham, MA, EEUU) with an acetonitrile gradient from 5 to
50%, after which they were detected and analyzed in a spectrometer mass/mass
(Q-exactive Orbitrap detector, Thermo Fisher Scientific Inc., Waltham, MA,
EEUU). The final hormone concentrations of the extracts were determined using
the calibration curves made previously. The interpretation of the results is
performed by they programs Xcalibur 2.2 SP1 build 48 and TraceFinder.

Materials and methods
47
5. STATISTICAL ANALYSIS
In all cases randomized experiments were designed, using the tree as a unit of
study and a tree repetition.
The analysis of variance with a level of confidence was applied to the results
(P≤0.05). For the analysis of interactions between treatments and dates analysis of
double factorial variance were made. For the separation of means the test of
Student-Newman-Keuls was applied using the computer program StatGraphics
Centurion. For the analysis of interactions between treatments and dates the
double factorial variance analysis were performed. When it was necessary the
transformation arc sen √p were applied to normalize the population.

Results
48
IV. RESULTS

Results
49
IV. RESULTS
1. INTENSITY OF FLOWERING-FRUIT SET
1.1 Reduction of the flowers number by applying GA3
Foliar application of GA3 at a concentration of 50 mg l-1
for the period of floral
induction (phenological stage 010 of BBCH scale), significantly delayed the
sprouting of cv. Hass. Thus, 91 days after treatment, control showed a
significantly higher percentage of buds in the most advanced state, fully
developed, that the treaty (50% and 30%, respectively) (Figure 15), and a lower
percentage of them no sprouted buds (35% and 50% respectively) (Figure 15).
However, the number of buds in the intermediate state (I), incipient, was not
influenced by the treatment.
Figure 15: The influence of GA3 (50 mg l
-1) applied in the floral bud inductive period on bud
development of avocado cv. Hass. Date of treatment: November 29, 2015. Evaluation 91 days
after treatment. The horizontal axis represents the phenological stage bud at the time of evaluation
(NS: no sprouted; I: incipient; S: sprouted). Values expressed in number of buds per 100 knots.
Vertical bars indicate standard error. Different letters for the same state of the bud indicate
significant differences (P≤0.05).
Subsequent evaluations showed a progressive decrease in the number of no
sprouted knots in both treatments, reaching zero in both cases 130 days after
treatment, in the vegetative development when, in addition, they had the same
number of fully developed buds (which on average was 50% in the case of trees
treated with GA and 54% in the control).
0
10
20
30
40
50
60
NS I S
N°
of
bu
ds/
10
0 k
no
ts
Control
GA
a
b
a
b

Results
50
These results reflect a temporary effect of GA in delaying sprouting, which is lost
over time.
The GA also modifies flowering. So, 130 days after treatment, the treated trees
have 48.3% fewer flowers than the control (Figure 16). Considering that in this
evaluation the number of developed shoots were not affected by the GA, the fewer
flowers obtained by the treatment was a consequence of reducing the number of
flowers per panicle. So while the panicles of control trees have, on average, 341
flowers per panicle, the treaty had only 267. In this case the direct effect of GA
reducing the number of flowers per panicle also reached statistical significance.
Figure 16: The influence of GA3 (50 mg l
-1) applied in the floral bud inductive period on flowers
number of avocado cv. Hass. Date of treatment: November 29, 2015. Values calculated from the
average number of flowers per panicle multiplied by the average number of knots developed per
100 knots. Vertical bars indicate standard error. Different letters indicate significant differences
(P≤0.05) between treatments.
Considering that in avocado panicle may have (or not, abortion) terminal
vegetative bud, the effect of GA also reached the development of the shoot
emerged from it. Thus, 140 days after treatment significant differences in the
length of these shoots were observed, which remained constant until the end of the
study period (Figure 17). At this time, while shoots of treated trees were 4.7 cm,
the controls barely reached 3.4 cm. Seven days after the first had grown by 32%,
while the second had done 15%. These differences remained virtually constant
over time, and at the end of the study (185 days after treatment) sprouts treated
trees were 2.25 cm longer than the controls (Figure 17).
0
2000
4000
6000
8000
10000
12000
14000
16000
18000
20000
GA Control
N°
of
flow
ers/
10
0 k
no
ts
Treatment
a
b

Results
51
Figure 17: The influence of GA3 (50 mg l
-1) applied in the floral bud inductive period (November
29, 2015) on the length of developed shoot from vegetative terminal bud of the panicle cv. Hass.
Each point is the average of 10 shoots. Vertical bars indicate standard error. The * indicates
significant differences for the same date (P≤0.05).
Fruit set was also temporarily altered by the treatment and 145 days after it, the
GA had increased the number of fruits per panicle by 90% compared to control.
These differences were more notable 152 days after treatment, when the first had
19 fruits per panicle, on average, the latter only had 2 (Figure 18).
Figure 18: The influence of GA3 (50 mg l
-1) applied in the floral bud inductive period on the
number of fruit set per panicle and its time course in cv. Hass. Date of treatment: November 29,
2015. Vertical bars indicate standard error. The * indicates significant differences for the same
date (P≤0.05).
It is notable that the largest number of fruits set per panicle during the first dates
3
4
5
6
7
8
9
10
11
4/19/16 4/25/16 5/2/16 5/13/16 6/3/16
Sh
oo
t le
ng
th (
cm)
Control
GA
*
*
*
* *
0
5
10
15
20
25
25/04/16 02/05/16 13/05/16 03/06/16
N°
fru
its/
pa
níc
le
Control
GA
* *
*

Results
52
on trees treated with GA corresponds to fewer flowers (Figure 16), and to a
further development of shoots from the terminal bud of the inflorescence (Figure
17).
It is also interesting to note that, while differences in the number of fruits set were
lost over time to match (Figure 18), those found along the length of the shoots
were kept until the end (Figure 17). These results therefore suggest that fruit set of
this species is not conditioned by phenomena of competition between the
vegetative development of the terminal bud of the panicle and its own
reproductive development.
2. VEGETATIVE DEVELOPMENT- REPRODUCTIVE DEVELOPMENT
RELATIONSHIP. HORMONAL AND NUTRITIONAL CONTROL
2.1 The time course of flower abscission
The time course of flowers abscission in avocado cv. Hass, under the conditions
of our experiment is presented in Figure 19. In the two localities, percentage
curves of flower abscission showed a similar pattern, differing only in magnitude.
Overcome anthesis, abscission rate was fast and progressive.
In Llaurí (Figure 19 A), 7 days after anthesis (DAA) (state 617 BBCH) flowers
drop was higher in indeterminate panicles (35.5%) than in determinate panicles
(17.5%). Fourteen DAA (state 618 BBCH) abscission was 82.7% and 75.8%,
respectively. Twenty DAA (state 711 BBCH) flowers drop was 100% in both
types of panicle.
In Caronia Marina (Figure 19 B), the May 4 (state 617 BBCH) abscission of
flowers was 73.4% in indeterminate panicles and 69.5% in determinate panicles,
without significant differences between them. In the phenological state 618
BBCH scale (May 14) abscission was 96.9% in the first and 98.9% in the second.
On May 25, corresponding to state 711 BBCH scale, as in the case of Llaurí,
flowers drop was 100% in the two types of panicle.
In view of this, the flowers abscission anticipated in Caronia Marina if compared
to Llaurí, especially in indeterminate panicles. Thus, in the state 617 BBCH scale,
while in Caronia Marina it had dropped 73.4% of flowers in Llaurí it had just
dropped 35.5%. In the determinate panicles abscission was 69.5% and 17.5%,
respectively (Figure 19).

Results
53
Figure 19. The time course of the percentage of flower abscission from indeterminate and
determinate panicles in avocado trees cv. Hass cultivated in Llaurí (Valencia, Spain) (A) and
Caronia Marina (Sicily, Italy) (B). Each point is the average of 10 thyrsi. Vertical bars indicate
standard error. In some cases the SE was smaller than the size of the symbols. Different letters
indicate significant differences (P≤0.05). The upper axis represents the phenological stages
according to the BBCH scale.
2.2 The time course of fruit abscission. Number of fruits per panicle.
Influence of the flowers number
The time course of fruit abscission in avocado cv. Hass, under the conditions of
our experiment is presented in Figure 20.
In Llaurí, percentage curves of fruit abscission of indeterminate panicles and
determinate panicles presented a similar behaviour. A week after fruit set (state
610 617 618 711
0
20
40
60
80
100
4/9/15 4/16/15 4/23/15 4/28/15
BBCH
Flo
wer
ab
scis
sio
n (
%)
Indeterninate panicle
Determinate panicle
a
a
a
b
a
a
a
a
610 617 618 711
0
20
40
60
80
100
04/05/15 14/05/15 25/05/15
BBCH
Flo
wer
ab
scis
sio
n (
%)
Indeterminate panicle
Determinate panicle
a
a
a
a
a a
A
B

Results
54
712 BBCH), abscission of the fruitlets was 92.2% in the indeterminate panicles
and 84.8% in the determinate panicles (Figure 20 A). The May 11 (state 713
BBCH) abscission reached 98.7% in the first and 96.6% in the second. May 15
(state 715 BBCH) almost 100% of the structures drop in both types of panicles
was reached.
In Caronia Marina (figure 20 B), however, June 5 (state 712 BBCH) presented a
37.3% drop in indeterminate panicles and 49.1% in determinate panicles. June 26
(state 715 BBCH) abscission in indeterminate panicles reached 71.5% of fruitlets,
while the determinate panicles 97.7%.
But unlike that the abscission of flowers, newly fruit set was delayed in Caronia
Marina. When the 43.2% of fruit, on average, had dropped in Caronia, Llaurí had
already dropped the 88.3% (Figure 20).
According to the behaviours detected in Llaurí and Caronia Marina, fruitlets
abscission in that species should not be controlled by nutritional competition
between fruitlets and shoots, but probably by aspects of climate type or problems
resulting from a lack of pollination.
711 712 713 715
0
20
40
60
80
100
4/28/15 5/4/15 5/11/15 5/15/15
BBCH
Fru
it a
bsc
issi
on
(%
)
Determinate panicle
Indeterninate panicle
a
a
a
a
a
a
a a
A

Results
55
Figure 20: The time course of the percentage of fruit abscission from indeterminate and
determinate panicles in avocado trees cv. Hass cultivated in Llaurí (Valencia, Spain) (A) and
Caronia Marina (Sicily, Italy) (B). Each point is the average of 10 thyrsi. Vertical bars indicate
standard error. In some cases the SE was smaller than the size of the symbols. Different letters
indicate significant differences (P≤0.05). The upper axis represents the phenological stages
according to the BBCH scale.
As a result of the massive abscission of reproductive organs, the number of fruits
per panicle that starts the growth is extremely low. Thus, 0.4 fruits per
indeterminate panicle and 0.9 fruits per determinate panicle remained, on average,
in Llaurí, and 0.4 and 2.8 fruits per panicle, respectively, in Caronia Marina
(Figure 21).
712 715 719
0
20
40
60
80
100
04/06/15 26/06/15 20/07/15
BBCH
Fru
it a
bsc
issi
on
(%
)
Indeterminate panicle
Determinate panicle a
b
a
b
a
a
0
0.1
0.2
0.3
0.4
0.5
0.6
0.7
0.8
0.9
1
7/13/15
N°
fru
its/
pa
nic
le
Indeterninate panicle
Determinate panicle
a
b
B
A
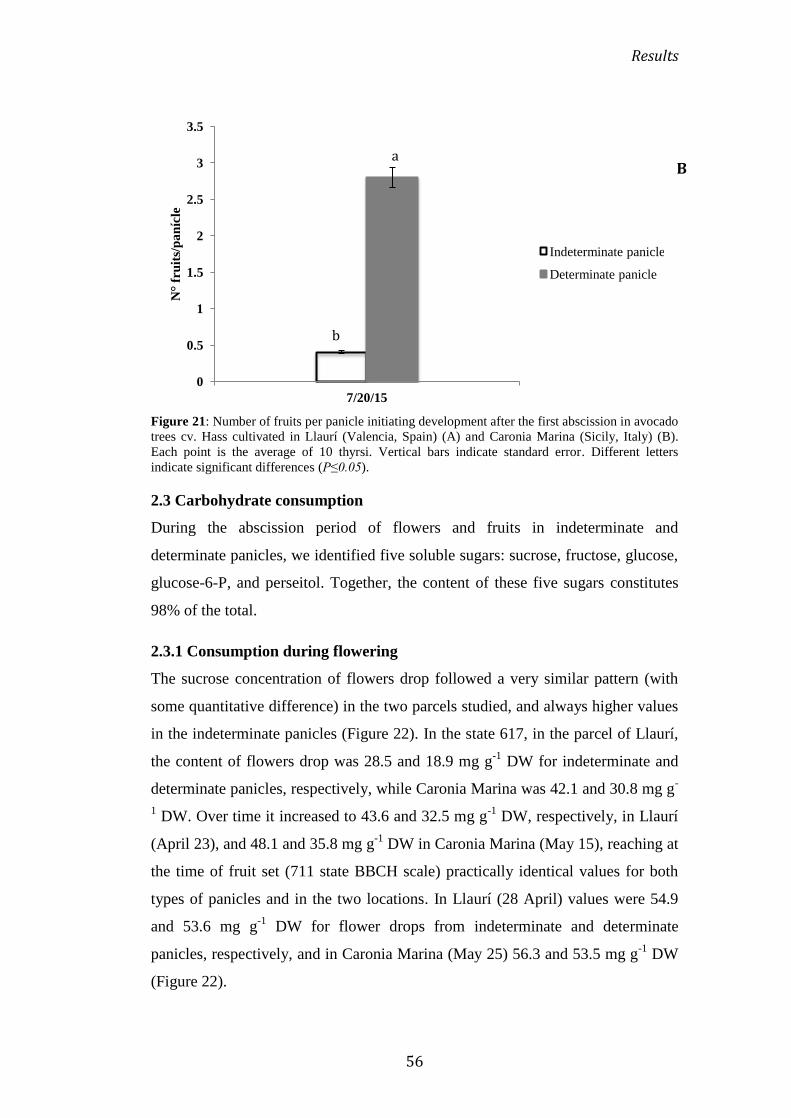
Results
56
Figure 21: Number of fruits per panicle initiating development after the first abscission in avocado
trees cv. Hass cultivated in Llaurí (Valencia, Spain) (A) and Caronia Marina (Sicily, Italy) (B).
Each point is the average of 10 thyrsi. Vertical bars indicate standard error. Different letters
indicate significant differences (P≤0.05).
2.3 Carbohydrate consumption
During the abscission period of flowers and fruits in indeterminate and
determinate panicles, we identified five soluble sugars: sucrose, fructose, glucose,
glucose-6-P, and perseitol. Together, the content of these five sugars constitutes
98% of the total.
2.3.1 Consumption during flowering
The sucrose concentration of flowers drop followed a very similar pattern (with
some quantitative difference) in the two parcels studied, and always higher values
in the indeterminate panicles (Figure 22). In the state 617, in the parcel of Llaurí,
the content of flowers drop was 28.5 and 18.9 mg g-1
DW for indeterminate and
determinate panicles, respectively, while Caronia Marina was 42.1 and 30.8 mg g-
1 DW. Over time it increased to 43.6 and 32.5 mg g
-1 DW, respectively, in Llaurí
(April 23), and 48.1 and 35.8 mg g-1
DW in Caronia Marina (May 15), reaching at
the time of fruit set (711 state BBCH scale) practically identical values for both
types of panicles and in the two locations. In Llaurí (28 April) values were 54.9
and 53.6 mg g-1
DW for flower drops from indeterminate and determinate
panicles, respectively, and in Caronia Marina (May 25) 56.3 and 53.5 mg g-1
DW
(Figure 22).
0
0.5
1
1.5
2
2.5
3
3.5
7/20/15
N°
fru
its/
pa
níc
le
Indeterminate panicle
Determinate panicle
a
b
B

Results
57
Figure 22: The time course of the sucrose concentration of flowers drop in Llaurí (Valencia,
Spain) (A) y Caronia Marina (Sicilia Italy) (B) from indeterminate and determinate panicles in
avocado trees cv. Hass. Each point is the average of 10 thyrsi. Vertical bars indicate standard error.
Different letters indicate significant differences (P≤0.05). The upper axis represents the
phenological stages according to the BBCH scale.
In growing flowers, which did not drop, the time course of their sucrose
concentration was also similar, although very noticeable quantitative differences.
Thus, in the state 617 of the BBCH scale, the sucrose concentration in flower of
indeterminate and determinate panicles was in Llaurí 57.5 and 49.1 mg g-1
DW,
610 617 618 711
0
10
20
30
40
50
60
70
4/9/15 4/16/15 4/23/15 4/28/15
BBCH
Su
cro
se (
mg
g-1
DW
)
Determinate panicle
Indeterminate panicle
A
a
b a
b
a
b
a
a
610 617 618 711
0
10
20
30
40
50
60
70
4/9/15 4/16/15 4/23/15 4/28/15
BBCH
Su
cro
se (
mg
g-1
DW
)
Indeterminate panicle
Determinate panicle
A
a
b a
b
a
b
a
a
617 618 711
0
10
20
30
40
50
60
5/4/15 5/15/15 5/25/15
BBCH
Su
cro
se (
mg
g-1
DW
)
Indeterminate panicle
Determinate panicle
B
a
b
a
b
a
a a

Results
58
respectively, and in Caronia Marina 17.7 and 11.3 mg g-1
DW (Figure 23). Seven
days later, this concentration increased in Llaurí to values of 76.9 and 67.6 for
flowers of indeterminate and determinate panicles, while in Caronia Marina 11
days later it was barely altered, with values of 18.0 and 10.8 mg g-1
DW
respectively. Finally, at the time of fruit set (state 711 BBCH) values decreased in
both parcels, keeping markedly higher values in Llaurí, with 48.9 and 45.0 mg g-1
DW in flowers of indeterminate and determinate panicles respectively, that in
Caronia Marina, with 6.8 and 5.1 mg g-1
DW, respectively (Figure 23).
Figura 23: The time course of the sucrose concentration of not-dropped flowers in Llaurí
(Valencia, Spain) (A) and Caronia Marina (Sicilia Italy) (B) from indeterminate and determinate
panicles in avocado trees cv. Hass. Each point is the average of 10 thyrsi. Vertical bars indicate
610 617 618 711
0
10
20
30
40
50
60
70
80
90
4/9/15 4/16/15 4/23/15 4/28/15
BBCH
Su
cro
se (
mg
g-1
DW
)
Not dropped flowers from indeterminate panicles
Not dropped flowers from determinate panicles
A
a
a
a
a
a
a a
a
617 618 711
0
5
10
15
20
25
5/4/15 5/15/15 5/25/15
BBCH
Su
cro
se (
mg
g-1
DW
)
Not dropped flowers from indeterminate panicles
Not dropped flowers from determinate panicles
B
a
b
a
b a
b

Results
59
standard error. Different letters indicate significant differences (P≤0.05). The upper axis represents
the phenological stages according to the BBCH scale.
In view of similar behaviour in both parcels, the remaining carbohydrates were
studied only in Llaurí, since it is where we also studied the fitohormonas content.
In this parcel, the concentration of perseitol in the flowers of indeterminate
panicles followed a similar evolution in dropped and not dropped flowers (Figure
24). Its concentration between 610 and 618 phenological stages of BBCH scale
ranged from 14 to 16 mg g-1
DW, and decreased to values of 11 mg g-1
DW in the
state 711. In flowers of determinate panicles the time course of the concentration
was also similar between them, but with statistically significant differences from
the flowers of indeterminate panicles. In this case, the concentration slightly
increased to phenological state 618, reaching values of 16.7 and 13.5 mg g-1
DW
in dropped and not dropped flowers, respectively, to decrease in both cases, a
week later, down to 10.2 and 6.3 mg g-1
DW, respectively (Figure 24). Also for
this carbohydrate, the concentration was always higher in the flower of
indeterminate panicles (Figure 24).
610 617 618 711
0
2
4
6
8
10
12
14
16
18
20
4/9/15 4/16/15 4/23/15 4/28/15
BBCH
Per
seit
ol
(mg
g-1
DW
)
Indeterminate panicle
Determinate panicle
A
a
b
a
b
a
a a
a

Results
60
Figure 24: The time course of the perseitol concentration in dropped (A) and not-dropped (B)
flowers from indeterminate and determinate panicles in avocado trees cv. Hass cultivated in
Llaurí. Each point is the average of 10 thyrsi. Vertical bars indicate standard error. Different letters
indicate significant differences (P≤0.05). The upper axis represents the phenological stages
according to the BBCH scale.
The time course of glucose and fructose is similar for both flowers of
indeterminate and determinate panicles or for dropped and not dropped flowers,
although there are quantitative differences (Figures 25 and 26). Their
concentration slightly increases between the phenological stages 610 and 617 of
the BBCH scale for flowers dropped from indeterminate panicles and between
610 and 618 for the flowers dropped from determinate panicles from which
decreases to fruit set (state 711 BBCH). For glucose, the concentration is 28-39
mg g-1
DW for the flowers dropped from indeterminate panicles, and 20-37 mg g-1
DW for the flowers dropped from determinate panicles (Figure 25 A). For
fructose concentrations are in the range 35-50 mg g-1
DW and 32-45 mg g-1
DW,
respectively (Figure 26 A).
For not dropped flowers, glucose concentration in indeterminate and determinate
panicles increased 2.5 and 6 times, respectively, from state 610 BBCH (19.4 and
8.3 mg g-1
DW, respectively) to the state 618 BBCH (51.7 and 49.9 mg g-1
DW,
respectively), falling below 13% and 27% (44.9 and 36.3 mg g-1
DW),
respectively (Figure 25B). For fructose, it increased between states 610 and 618 of
the BBCH scale and was 2.3 and 3.1 times for flowers of indeterminate and
determinate panicles respectively (20.7 to 48.5 mg g-1
DW, and 15.6 to 48.1 mg g-
610 617 618 711
0
2
4
6
8
10
12
14
16
18
4/9/15 4/16/15 4/23/15 4/28/15
BBCH
Per
seit
ol
(mg
g-1
DW
)
Not dropped flowers from indeterminate panicles
Not dropped flowers from determinate panicles
B
a
b
a a
b
a
b a
b

Results
61
1 DW, respectively), and the descent to the state 711 was just non-existent in the
first and 17% in the second (Figure 26 B).
Figure 25: The time course of the glucose concentration in dropped (A) and not-dropped (B)
flowers from indeterminate and determinate panicles in avocado trees cv. Hass cultivated in
Llaurí. Each point is the average of 10 thyrsi. Vertical bars indicate standard error. Different letters
indicate significant differences (P≤0.05). The upper axis represents the phenological stages
according to the BBCH scale.
610 617 618 711
0
5
10
15
20
25
30
35
40
45
50
4/9/15 4/16/15 4/23/15 4/28/15
Glu
cose
(m
g g
-1 D
W)
Indeterminate panicle
Determinate panicle
A
a
b
a
b
a
a
a
a
610 617 618 711
0
10
20
30
40
50
60
4/9/15 4/16/15 4/23/15 4/28/15
BBCH
Glu
cose
(m
g g
-1 D
W)
Not dropped flowers from indeterminate panicles
Not dropped flowers from determinate panicles
B
a a
b
a
b
a
a a
b

Results
62
Figure 26: The time course of the fructose concentration in dropped (A) and not-dropped (B)
flowers from indeterminate and determinate panicles in avocado trees cv. Hass cultivated in
Llaurí. Each point is the average of 10 thyrsi. Vertical bars indicate standard error. Different letters
indicate significant differences (P≤0.05). The upper axis represents the phenological stages
according to the BBCH scale.
2.3.2 Consumption during the initial development of fruit
The sucrose concentration of the fruit during the initial phase of development
(phenological state 711 to 715 of BBCH scale) followed a similar evolution in
indeterminate and determinate panicles and independence that had dropped or not
dropped (Figure 27). Thus among the states 711 to 715 BBCH kinetics was
similar for all the fruits, although with some quantitative differences. Between
711 and 712 BBCH states concentrations were barely disturbed, oscillating
610 617 618 711
0
10
20
30
40
50
60
4/9/15 4/16/15 4/23/15 4/28/15
BBCH
Fru
cto
se (
mg
g-1
DW
)
Indeterminate panicle
Determinate panicle
A
a a
a
a
b
a
a a
a
610 617 618 711
0
10
20
30
40
50
60
4/9/15 4/16/15 4/23/15 4/28/15
BBCH
Fru
cto
se (
mg
g-1
DW
)
Not dropped flowers from indeterminate panicles
Not dropped flowers from determinate panicles
B
a
a
a
b
a
a
a
b

Results
63
between 7.2 and 8.5 mg g-1
DW and 13.1 and 3.2 mg g-1
DW in the dropped and
not dropped fruits, respectively. These concentrations decreased over time until
reaching minimum values in the states 713-715 BBCH (4.8 and 2.1 for the
dropped fruits in indeterminate and determinate panicles, respectively, and 2.1
and 3.4 for the not dropped fruits) and subsequently the concentrations increased
very little in the dropped fruits. Logically, and dramatically in not dropped fruits
reached values of 18.9 and 17.3 mg g-1
DW in the state 716 BBCH in
indeterminate and determinate panicles, respectively, and 26.1 and 23.7 mg g-1
DW in 717 BBCH, but in any case the statistical significance was reached (Figure
27). The dropped fruits in 715 BBCH reached statistically different values of 4.8 y
2.1 mg g-1
DW, depending on their location in indeterminate and determinate
panicles (Figure 27). Beyond this state, no fruit drop was recorded, the
physiological fruit drop ended in the state 715 of the BBCH scale.
711 712 713 715
0
1
2
3
4
5
6
7
8
9
10
4/28/15 5/4/15 5/11/15 5/15/15
BBCH
Su
cro
se (
mg
g-1
DW
)
Indeterminate panicle
Determinate panicle
A
a
a
a
b
a
b
a
b

Results
64
Figure 27: The time course of the sucrose concentration in dropped (A) and not-dropped (B) fruits
from indeterminate and determinate panicles in avocado trees cv. Hass cultivated in Llaurí. Each
point is the average of 10 thyrsi. Vertical bars indicate standard error. Different letters indicate
significant differences (P≤0.05). The upper axis represents the phenological stages according to
the BBCH scale.
In fruits drop, the concentration of perseitol barely was altered between
phenological stages 711 and 715 BBCH scale, whether they were located in
indeterminate or determinate panicles, oscillating between 6 and 8 mg g-1
DW
(Figure 28).
711 712 713 715 716 717
0
5
10
15
20
25
30
28/04/15 04/05/15 11/05/15 15/05/15 29/05/15 08/06/15
BBCH
Su
cro
se (
mg
g-1
DW
)
Not dropped fruits from indeterminate panicles
Not dropped fruits from determinate panicles
B a
b
a
a
b
a
b
a
a
a
a
a
a
711 712 713 715
0
1
2
3
4
5
6
7
8
9
4/28/15 5/4/15 5/11/15 5/15/15
BBCH
Per
seit
ol
(mg
g-1
DW
)
Indeterminate panicle
Determinate panicle
A
a
a
a a
a
a
b
a
a

Results
65
Figure 28: The time course of the perseitol concentration in dropped (A) and not-dropped (B)
fruits from indeterminate and determinate panicles in avocado trees cv. Hass cultivated in Llaurí.
Each point is the average of 10 thyrsi. Vertical bars indicate standard error. Different letters
indicate significant differences (P≤0.05). The upper axis represents the phenological stages
according to the BBCH scale.
However, in the not dropped fruits, although similar developments between 711
and 713 BBCH states, i.e., oscillating in time, but without great temporal changes
(their concentration varied between 6.3 and 33.8 mg g-1
DW), after the fruit drop
(state 715 BBCH) perseitol concentration increased by 3.2 and 5.8 times in fruits
of indeterminate and determinate panicles acquiring the same value in both cases
93.2 mg g-1
DW (Figure 28).
As in the case of flowers, the evolution of the concentration of glucose and
fructose was very similar for both types of fruits, that is, from indeterminate and
determinate panicles. And, as in those, the differences were marked between the
values of the dropped and not dropped fruits (Figures 29 and 30). In fruits drop,
and regardless of the panicle type, glucose concentration between phenological
stages 711 and 715 BBCH ranged between 18.9 and 22.7 mg g-1
DW (Figure 29),
and fructose between 16.2 and 24.1 mg g-1
DW (Figure 30). At the end of the
physiological fruit drop, both monosaccharides concentration was significantly
higher in the fruit drop of indeterminate panicles.
The concentration of glucose and fructose in not dropped fruits was oscillating
between phenological stages 711 and 717 BBCH, with three peaks for glucose in
711 712 713 715 716 717
0
20
40
60
80
100
120
28/04/15 04/05/15 11/05/15 15/05/15 29/05/15 08/06/15
BBCH
Per
seit
ol
(mg
g-1
DW
)
Not dropped fruits from indeterminate panicles
Not dropped fruits from determinate panicles
B
a a a
a a
a
a
b a
a
b
b
a

Results
66
the states 711, 713 and 716, and two for fructose in the states 713 and 717
(Figures 29 and 30). The glucose concentration in the fruit from 715 BBCH, that
is, the end of physiological fruit drop, did not present significant differences
between indeterminate and determinate panicles (Figure 29). While the fructose
was significantly higher in the fruits from determinate panicles, increasing the gap
over time to be highest in the state 717 BBCH, 90.2 mg g-1
DW versus 67.7 mg g-
1 DW of fruits from indeterminate panicles.
Figure 29: The time course of the glucose concentration in dropped (A) and not-dropped (B) fruits
from indeterminate and determinate panicles in avocado trees cv. Hass cultivated in Llaurí. Each
point is the average of 10 thyrsi. Vertical bars indicate standard error. Different letters indicate
significant differences (P≤0.05). The upper axis represents the phenological stages according to
the BBCH scale.
711 712 713 715
0
5
10
15
20
25
4/28/15 5/4/15 5/11/15 5/15/15
BBCH
Glu
cose
(m
g g
-1 D
W)
Indeterminate panicle
Determinate panicle
A
a
a
a
a
a
b
a
b
711 712 713 715 716 717
0
10
20
30
40
50
60
28/04/15 04/05/15 11/05/15 15/05/15 29/05/15 08/06/15
BBCH
Glu
cose
(m
g g
-1 D
W)
Not dropped fruits from indeterminate panicles
Not dropped fruits from determinate panicles
B
a
b
a
b
a
b
a
b
a
a
a
a
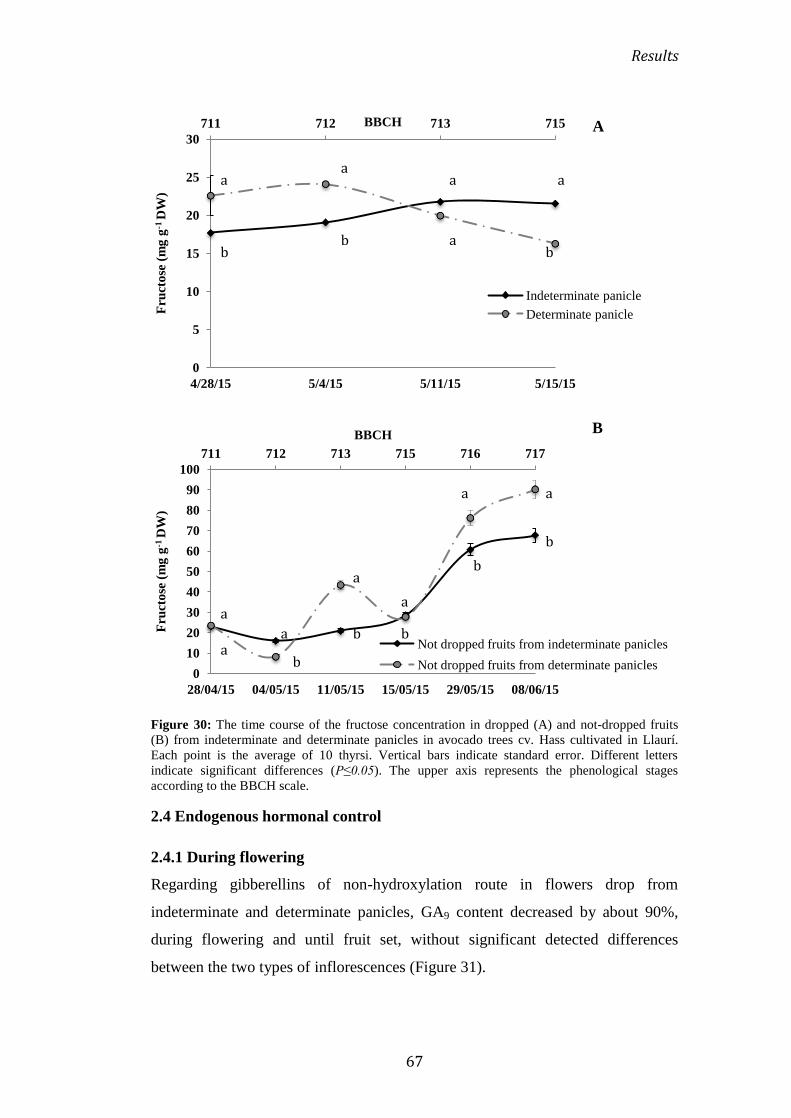
Results
67
Figure 30: The time course of the fructose concentration in dropped (A) and not-dropped fruits
(B) from indeterminate and determinate panicles in avocado trees cv. Hass cultivated in Llaurí.
Each point is the average of 10 thyrsi. Vertical bars indicate standard error. Different letters
indicate significant differences (P≤0.05). The upper axis represents the phenological stages
according to the BBCH scale.
2.4 Endogenous hormonal control
2.4.1 During flowering
Regarding gibberellins of non-hydroxylation route in flowers drop from
indeterminate and determinate panicles, GA9 content decreased by about 90%,
during flowering and until fruit set, without significant detected differences
between the two types of inflorescences (Figure 31).
711 712 713 715
0
5
10
15
20
25
30
4/28/15 5/4/15 5/11/15 5/15/15
BBCH
Fru
cto
se (
mg
g-1
DW
)
Indeterminate panicle
Determinate panicle
A
a
b
a
b
a
a
a
b
711 712 713 715 716 717
0
10
20
30
40
50
60
70
80
90
100
28/04/15 04/05/15 11/05/15 15/05/15 29/05/15 08/06/15
BBCH
Fru
cto
se (
mg
g-1
DW
)
Not dropped fruits from indeterminate panicles
Not dropped fruits from determinate panicles
B
a
a a
b
a
b
a
b
a
b
a
b
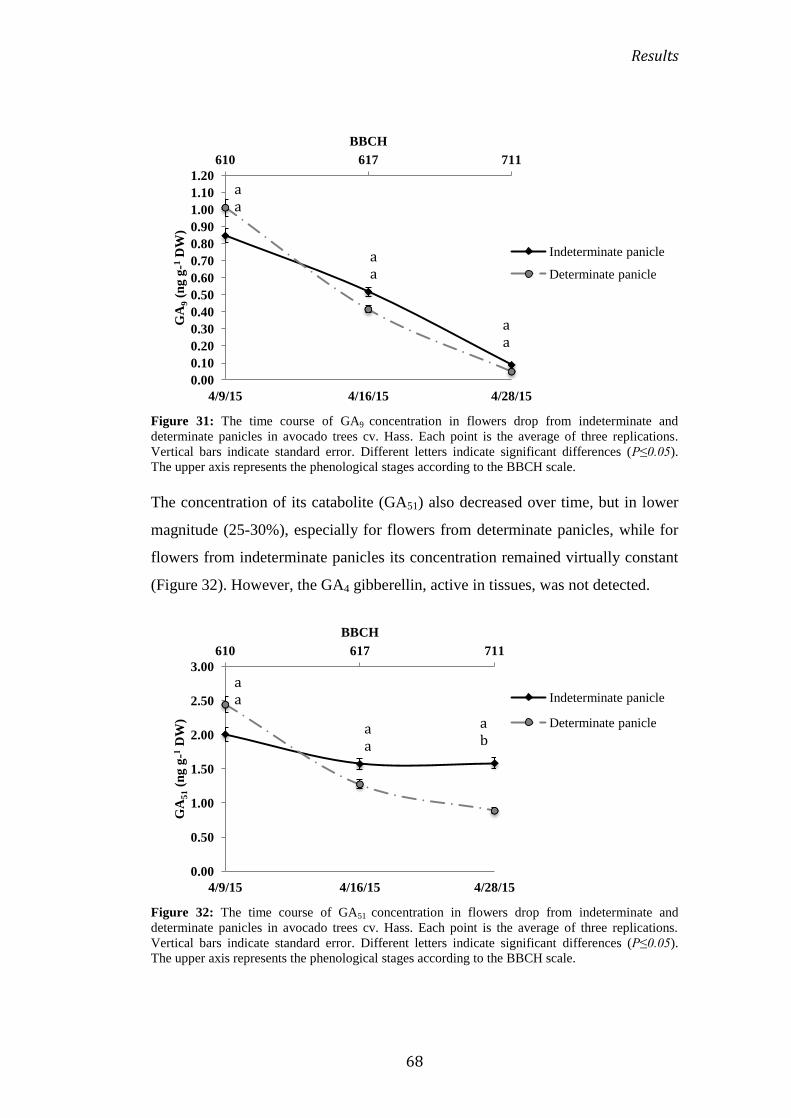
Results
68
Figure 31: The time course of GA9 concentration in flowers drop from indeterminate and
determinate panicles in avocado trees cv. Hass. Each point is the average of three replications.
Vertical bars indicate standard error. Different letters indicate significant differences (P≤0.05).
The upper axis represents the phenological stages according to the BBCH scale.
The concentration of its catabolite (GA51) also decreased over time, but in lower
magnitude (25-30%), especially for flowers from determinate panicles, while for
flowers from indeterminate panicles its concentration remained virtually constant
(Figure 32). However, the GA4 gibberellin, active in tissues, was not detected.
Figure 32: The time course of GA51 concentration in flowers drop from indeterminate and
determinate panicles in avocado trees cv. Hass. Each point is the average of three replications.
Vertical bars indicate standard error. Different letters indicate significant differences (P≤0.05).
The upper axis represents the phenological stages according to the BBCH scale.
610 617 711
0.00
0.10
0.20
0.30
0.40
0.50
0.60
0.70
0.80
0.90
1.00
1.10
1.20
4/9/15 4/16/15 4/28/15
BBCH
GA
9 (
ng
g-1
DW
)
Indeterminate panicle
Determinate panicle
a a
a a
a a
610 617 711
0.00
0.50
1.00
1.50
2.00
2.50
3.00
4/9/15 4/16/15 4/28/15
BBCH
GA
51 (
ng
g-1
DW
)
Indeterminate panicle
Determinate panicle
a a
a a a
a b
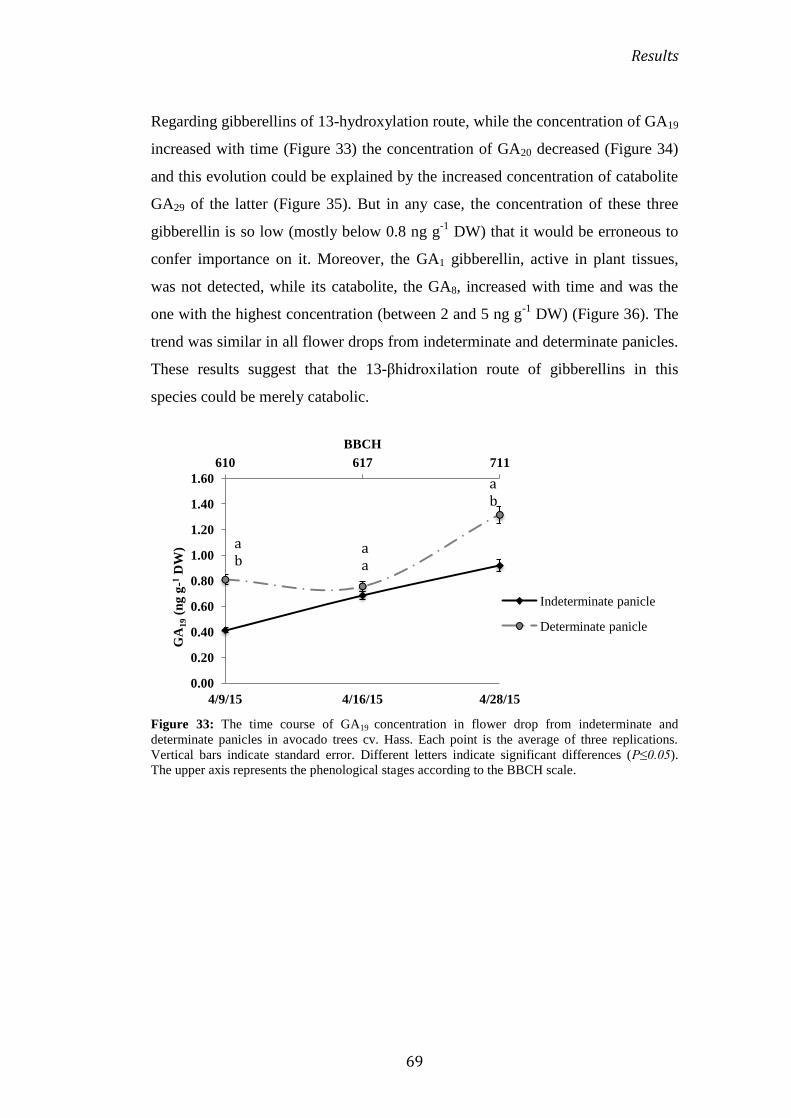
Results
69
Regarding gibberellins of 13-hydroxylation route, while the concentration of GA19
increased with time (Figure 33) the concentration of GA20 decreased (Figure 34)
and this evolution could be explained by the increased concentration of catabolite
GA29 of the latter (Figure 35). But in any case, the concentration of these three
gibberellin is so low (mostly below 0.8 ng g-1
DW) that it would be erroneous to
confer importance on it. Moreover, the GA1 gibberellin, active in plant tissues,
was not detected, while its catabolite, the GA8, increased with time and was the
one with the highest concentration (between 2 and 5 ng g-1
DW) (Figure 36). The
trend was similar in all flower drops from indeterminate and determinate panicles.
These results suggest that the 13-βhidroxilation route of gibberellins in this
species could be merely catabolic.
Figure 33: The time course of GA19 concentration in flower drop from indeterminate and
determinate panicles in avocado trees cv. Hass. Each point is the average of three replications.
Vertical bars indicate standard error. Different letters indicate significant differences (P≤0.05).
The upper axis represents the phenological stages according to the BBCH scale.
610 617 711
0.00
0.20
0.40
0.60
0.80
1.00
1.20
1.40
1.60
4/9/15 4/16/15 4/28/15
BBCH
GA
19 (
ng
g-1
DW
)
Indeterminate panicle
Determinate panicle
a b
a b
a a

Results
70
Figure 34: The time course of GA20 concentration in flower drop from indeterminate and
determinate panicles in avocado trees cv. Hass. Each point is the average of three replications.
Vertical bars indicate standard error. Different letters indicate significant differences (P≤0.05).
The upper axis represents the phenological stages according to the BBCH scale.
Figure 35: The time course of GA29 concentration in flower drop from indeterminate and
determinate panicles in avocado trees cv. Hass. Each point is the average of three replications.
Vertical bars indicate standard error. Different letters indicate significant differences (P≤0.05).
The upper axis represents the phenological stages according to the BBCH scale.
610 617 711
0.00
0.02
0.04
0.06
0.08
0.10
0.12
0.14
0.16
0.18
4/9/15 4/16/15 4/28/15
BBCH
GA
20 (
ng
g-1
DW
)
Indeterminate panicle
Determinate panicle
a a
a a
a b
610 617 711
0.00
0.02
0.04
0.06
0.08
0.10
0.12
0.14
4/9/15 4/16/15 4/28/15
BBCH
GA
29 (
ng
g-1
DW
)
Indeterminate panicle
Determinate panicle
a b
a a
a a

Results
71
Figure 36: The time course of GA8 concentration in flower drop from indeterminate and
determinate panicles in avocado trees cv. Hass. Each point is the average of three replications.
Vertical bars indicate standard error. Different letters indicate significant differences (P≤0.05).
The upper axis represents the phenological stages according to the BBCH scale.
IAA concentration decreased over the period of flower abscission, especially
those from determinate panicles. From anthesis until fruit set it decreased
continuously, by 55% to the value of 34.4 ng g-1
DW in the latter, while in flowers
from indeterminate panicles reduction was 17% from anthesis to 617 BBCH,
remaining constant until fruit set and reaching the value of 55.5 ng g-1
DW
(Figure 37).
610 617 711
0.00
1.00
2.00
3.00
4.00
5.00
6.00
4/9/15 4/16/15 4/28/15
BBCH
GA
8 (
ng
g-1
DW
)
Indeterminate panicle
Determinate panicle
a a
a a
a b

Results
72
Figure 37: The time course of IAA concentration in flower drop from indeterminate and
determinate panicles in avocado trees cv. Hass. Each point is the average of three replications.
Vertical bars indicate standard error. Different letters indicate significant differences (P≤0.05).
The upper axis represents the phenological stages according to the BBCH scale.
The concentration of cytokinin DHZ over period of flower abscission and even
fruit set significantly increased to maximum values of 0.20 and 0.16 ng g-1 DW
(Figure 38), while iP significantly decreased to minimum values of 0.87 and 0.83
ng g-1
DW (Figure 39). But as it happened with gibberellins, these concentrations
are extremely low as ascribe to significant importance in the development of
flowers or in regulating its abscission. tZ concentration, however, metabolically
showed high values over time and remained stable in the early stages of
development, after reaching the minimum values coinciding with fruit set (Figure
40). tZ concentration remained higher in the flower from determinate panicles
throughout the study period.
610 617 711
0.00
10.00
20.00
30.00
40.00
50.00
60.00
70.00
80.00
90.00
4/9/15 4/16/15 4/28/15
BBCH
IAA
(n
g g
-1 D
W)
Indeterminate panicle
Determinate panicle
a a
a a
a b

Results
73
Figure 38: The time course of DHZ (dihydrozeatin) concentration in flower drop from
indeterminate and determinate panicles in avocado trees cv. Hass. Each point is the average of
three replications. Vertical bars indicate standard error. Different letters indicate significant
differences (P≤0.05). The upper axis represents the phenological stages according to the BBCH
scale.
Figure 39: The time course of iP (2-isopentenyl-adenine) concentration in flower drop from
indeterminate and determinate panicles in avocado trees cv. Hass. Each point is the average of
three replications. Vertical bars indicate standard error. Different letters indicate significant
differences (P≤0.05). The upper axis represents the phenological stages according to the BBCH
scale.
610 617 711
0.00
0.05
0.10
0.15
0.20
0.25
4/9/15 4/16/15 4/28/15
BBCH
DH
Z (
ng
g-1
DW
)
Indeterminate panicle
Determinate panicle a a
a a
a b
610 617 711
0.00
0.50
1.00
1.50
2.00
2.50
3.00
4/9/15 4/16/15 4/28/15
BBCH
iP (
ng
g-1
DW
)
Indeterminate panicle
Determinate panicle
a a
a a
a a

Results
74
Figure 40: The time course of tZ (trans-zeatin) concentration in flower drop from indeterminate
and determinate panicles in avocado trees cv. Hass. Each point is the average of three replications.
Vertical bars indicate standard error. Different letters indicate significant differences (P≤0.05).
The upper axis represents the phenological stages according to the BBCH scale.
2.4.2 During the initial development of fruit
The time course of the concentration on the fruits of gibberellins during his
abscission was altered by the presence of the apical bud. In those located in
determinate panicles, during the early stages of development the concentration of
GA9 decreased (figure 41), as did that of his catabolite GA51 did (Figure 42).
However, in the fruits of indeterminate panicle the concentration of GA9
significantly increased (Figure 41) and GA51 remained constant (Figure 42).
Gibberellins of the 13-hydroxylation route also showed differences in the fruits as
they were in indeterminate or determinate panicles. The concentration of GA19
increased over time (Figure 43), and yet the concentration of its precursor, GA20,
decreased (Figure 44), being the values of the fruits of indeterminate panicles
superior to those of the determinate panicles in the first and lower in the second.
The concentration of catabolite of the latter, GA29, was barely altered over time
(Figure 45). Gibberellin GA1 was not detected in fruits, too, although its catabolite
GA8, yes (Figure 46), which suggests, also in this case, that the path of the 13-
hydroxylation of gibberellins in the avocado fruits should be catabolic. What is
more, its extremely low values, not exceeding 2.5 ng g-1
DW and almost always
lower than 1 ng g-1
DW, indicate a very little relevant role in the initial
development of their fruits.
610 617 711
0.00
1.00
2.00
3.00
4.00
5.00
6.00
7.00
8.00
4/9/15 4/16/15 4/28/15
BBCH
tZ (
ng
g-1
DW
)
Indeterminate panicle
Determinate panicle
a b
a b
a b

Results
75
Figure 41: The time course of GA9 concentration in fruit drops from indeterminate and
determinate panicles in avocado trees cv. Hass. Each point is the average of three replications.
Vertical bars indicate standard error. Different letters indicate significant differences (P≤0.05).
The upper axis represents the phenological stages according to the BBCH scale.
Figure 42: The time course of GA51 concentration in fruit drops from indeterminate and
determinate panicles in avocado trees cv. Hass. Each point is the average of three replications.
Vertical bars indicate standard error. Different letters indicate significant differences (P≤0.05).
The upper axis represents the phenological stages according to the BBCH scale.
712 713 715
0.00
0.50
1.00
1.50
2.00
2.50
5/4/15 5/11/15 5/15/15
BBCH
GA
9 (
ng
g-1
DW
)
Indeterminate panicle
Determinate panicle a a
a b
a b
712 713 715
0.00
0.20
0.40
0.60
0.80
1.00
1.20
1.40
1.60
1.80
5/4/15 5/11/15 5/15/15
BBCH
GA
51 (
ng
g-1
DW
)
Indeterminate panicle
Determinate panicle
a b a
b a a

Results
76
Figure 43: The time course of GA19 concentration in fruit drops from indeterminate and
determinate panicles in avocado trees cv. Hass. Each point is the average of three replications.
Vertical bars indicate standard error. Different letters indicate significant differences (P≤0.05).
The upper axis represents the phenological stages according to the BBCH scale.
Figure 44: The time course of GA20 concentration in fruit drops from indeterminate and
determinate panicles in avocado trees cv. Hass. Each point is the average of three replications.
Vertical bars indicate standard error. Different letters indicate significant differences (P≤0.05).
The upper axis represents the phenological stages according to the BBCH scale.
712 713 715
0.00
0.50
1.00
1.50
2.00
2.50
3.00
5/4/15 5/11/15 5/15/15
BBCH
GA
19 (
ng
g-1
DW
)
Indeterminate panicle
Determinate panicle
a a
a b a
b
712 713 715
0.00
0.02
0.04
0.06
0.08
0.10
0.12
0.14
0.16
0.18
0.20
5/4/15 5/11/15 5/15/15
BBCH
GA
20 (
ng
g-1
DW
)
Indeterminate panicle
Determinate panicle
a a
a a
a b

Results
77
Figure 45: The time course of GA29 concentration in fruit drops from indeterminate and
determinate panicles in avocado trees cv. Hass. Each point is the average of three replications.
Vertical bars indicate standard error. Different letters indicate significant differences (P≤0.05).
The upper axis represents the phenological stages according to the BBCH scale.
Figure 46: The time course of GA8 concentration in fruit drops from indeterminate and
determinate panicles in avocado trees cv. Hass. Each point is the average of three replications.
Vertical bars indicate standard error. Different letters indicate significant differences (P≤0.05).
The upper axis represents the phenological stages according to the BBCH scale.
The concentration of IAA increased steadily throughout the period of abscission
of the fruits of the indeterminate panicles, while that of the fruits from determinate
panicles remained constant (Figure 47). It is worth noting the relatively high
values of this hormone in comparison with those of gibberellins.
712 713 715
0.00
0.02
0.04
0.06
0.08
0.10
0.12
5/4/15 5/11/15 5/15/15
BBCH
GA
29 (
ng
g-1
DW
)
Indeterminate panicle
Determinate panicle
a a
a a
a a
712 713 715
0.00
0.20
0.40
0.60
0.80
1.00
1.20
1.40
5/4/15 5/11/15 5/15/15
BBCH
GA
8 (
ng
g-1
DW
)
Indeterminate panicle
Determinate panicle
a a
a b a
b

Results
78
Figure 47: The time course of IAA concentration in fruit drops from indeterminate and
determinate panicles in avocado trees cv. Hass. Each point is the average of three replications.
Vertical bars indicate standard error. Different letters indicate significant differences (P≤0.05).
The upper axis represents the phenological stages according to the BBCH scale.
The concentration of cytokinins DHZ significantly increased throughout the
abscission period of the fruits up to maximum values of 59.9 and 20.7 ng g-1
DW
in the fruits from indeterminate or determinate panicles, respectively (Figure 48).
The concentration of iP, however, decreased over the same period reaching
minimum values of 1 and 0.77 ng g-1
DW (Figure 49) in the fruits from
indeterminate and determinate panicles, respectively.
Finally the tZ had a similar behaviour to that of the DHZ throughout the studied
period, although with values markedly higher, reaching average values of 552.39
and 208.05 ng g-1
DW for those from indeterminate and determinate panicles,
respectively (Figure 50).
As in the case of the IAA, the concentration of the cytokinins DHZ and
particularly the tZ were markedly higher than those of gibberellins.
712 713 715
0.00
50.00
100.00
150.00
200.00
250.00
300.00
5/4/15 5/11/15 5/15/15
BBCH
IAA
(n
g g
-1 D
W)
Indeterminate panicle
Determinate panicle
a a
a b
a b

Results
79
Figure 48: The time course of DHZ concentration in fruit drops from indeterminate and
determinate panicles in avocado trees cv. Hass. Each point is the average of three replications.
Vertical bars indicate standard error. Different letters indicate significant differences (P≤0.05).
The upper axis represents the phenological stages according to the BBCH scale.
Figure 49: The time course of iP concentration in fruit drops from indeterminate and determinate
panicles in avocado trees cv. Hass. Each point is the average of three replications. Vertical bars
indicate standard error. Different letters indicate significant differences (P≤0.05). The upper axis
represents the phenological stages according to the BBCH scale.
712 713 715
0.00
10.00
20.00
30.00
40.00
50.00
60.00
70.00
5/4/15 5/11/15 5/15/15
BBCH
DH
Z (
ng
g-1
DW
)
Indeterminate panicle
Determinate panicle
a a
a b
a b
712 713 715
0.00
0.50
1.00
1.50
2.00
2.50
3.00
3.50
5/4/15 5/11/15 5/15/15
BBCH
iP (
ng
g-1
DW
)
Indeterminate panicle
Determinate panicle
a b
a a
a a
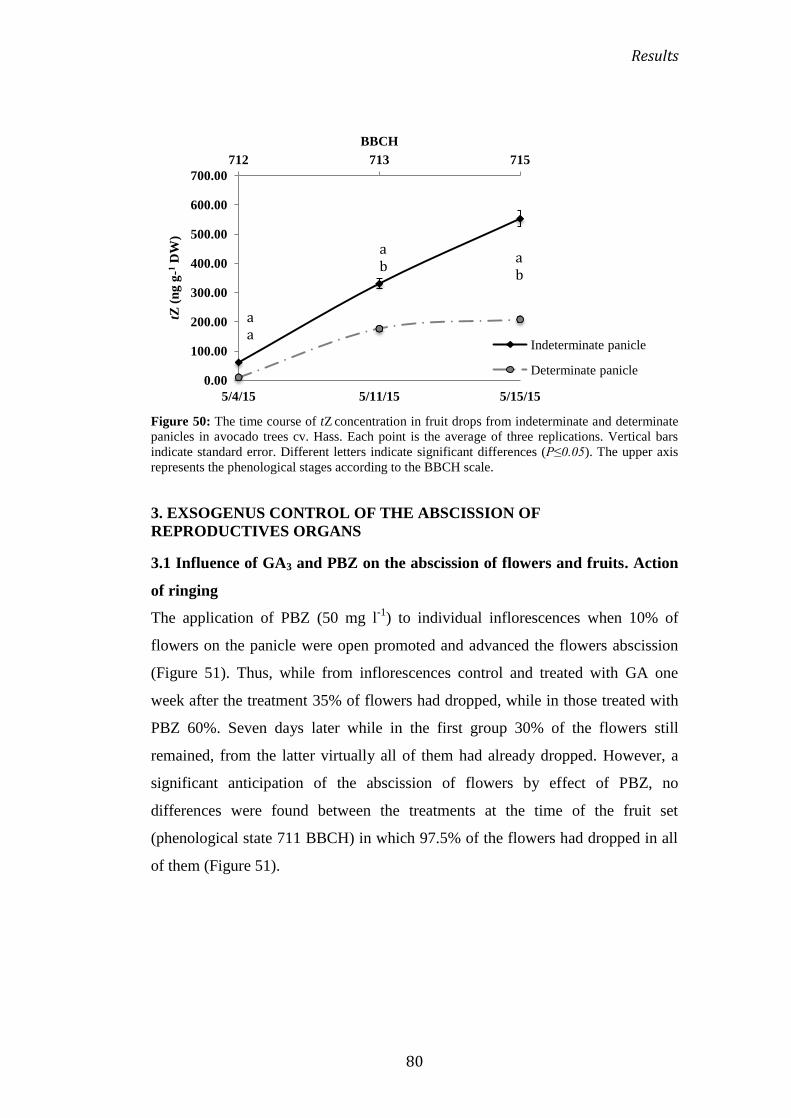
Results
80
Figure 50: The time course of tZ concentration in fruit drops from indeterminate and determinate
panicles in avocado trees cv. Hass. Each point is the average of three replications. Vertical bars
indicate standard error. Different letters indicate significant differences (P≤0.05). The upper axis
represents the phenological stages according to the BBCH scale.
3. EXSOGENUS CONTROL OF THE ABSCISSION OF
REPRODUCTIVES ORGANS
3.1 Influence of GA3 and PBZ on the abscission of flowers and fruits. Action
of ringing
The application of PBZ (50 mg l-1
) to individual inflorescences when 10% of
flowers on the panicle were open promoted and advanced the flowers abscission
(Figure 51). Thus, while from inflorescences control and treated with GA one
week after the treatment 35% of flowers had dropped, while in those treated with
PBZ 60%. Seven days later while in the first group 30% of the flowers still
remained, from the latter virtually all of them had already dropped. However, a
significant anticipation of the abscission of flowers by effect of PBZ, no
differences were found between the treatments at the time of the fruit set
(phenological state 711 BBCH) in which 97.5% of the flowers had dropped in all
of them (Figure 51).
712 713 715
0.00
100.00
200.00
300.00
400.00
500.00
600.00
700.00
5/4/15 5/11/15 5/15/15
BBCH
tZ (
ng
g-1
DW
)
Indeterminate panicle
Determinate panicle
a a
a b
a b

Results
81
Figure 51: Influence of the application of inhibitors (PBZ 50 mg l-1
) and promoters (GA 50 mg l-1
)
of development to individual inflorescences in the abscission of the flowers of cv. Hass avocado in
Llaurí (Valencia). The application was carried out in the state 610 BBCH scale (10% of the
flowers were open). Each value is the average of 10 thyrsi. The standard error was smaller than the
symbol. Different letters for a same date indicate significant differences (P≤0.05). The upper shaft
represents the phenological states according to the BBCH scale. PBZ: paclobutrazol; GA:
gibberellic acid. Date of treatments: April 9, 2015.
The effectiveness of these treatments on the abscission of fruits was null. Thus, in
Llaurí, one week after fruit set (phenological state 712 BBCH) almost 100% of
the fruits had already dropped independently from the treatment received (Figure
52). In Caronia Marina, ten days after fruit set 35% of the fruits had already
dropped, arriving at 72% a month later, without significant differences between
treatments (Figure 53). At the end of the period of abscission, the fruits that were
maintained in the plant were 1-2 per inflorescence, approximately, in both farms.
610 617 618 711
0
20
40
60
80
100
4/9/15 4/16/15 4/23/15 4/28/15
BBCH
Flo
wer
ab
scis
sio
n (
%)
GA
Control
PBZ
a
a
a
b
b
a
b
b
a
a
a

Results
82
Figure 52: Influence of the application of inhibitors (PBZ 50 mg l
-1) and promoters (GA 50 mg l
-1)
of development to individual inflorescences in the abscission of the fruits of cv. Hass avocado in
Llaurí (Valencia). The application was carried out in the state 610 BBCH scale (10% of the
flowers were open). Each value is the average of 10 thyrsi. The standard error was smaller than the
symbol. Different letters for a same date indicate significant differences (P≤0.05). The upper shaft
represents the phenological states according to the BBCH scale. PBZ: paclobutrazol; GA:
gibberellic acid. Date of treatments: April 9, 2015.
Figure 53: Influence of the application of inhibitors (PBZ 50 mg l
-1) and promoters (GA 50 mg l
-1)
of development to individual inflorescences in the abscission of the fruits of cv. Hass avocado in
Caronia Marina (Messina). The application was carried out in the state 711 BBCH scale. Each
value is the average of 10 thyrsi. The standard error was smaller than the symbol. Different letters
for a same date indicate significant differences (P≤0.05). The upper shaft represents the
phenological states according to the BBCH scale. PBZ: paclobutrazol; GA: gibberellic acid. Date
of treatments: May 25, 2015.
The application to the entire tree of both fitohormones, to the same concentration
and in the same phenological state (10% of open flowers), gave rise to a similar
711 712 713 715
0.00
20.00
40.00
60.00
80.00
100.00
4/28/15 5/4/15 5/11/15 5/15/15
BBCH
Fru
it a
bsc
issi
on
(%
)
Control
PBZ
GA a a
a a a
a a a
a a a
712 715 719
0
20
40
60
80
100
04/06/15 26/06/15 20/07/15
BBCH
Fru
it a
bsc
issi
on
(%
)
Control
GA
PBZ
a a a
a a a
a a a

Results
83
response. Thus, 15 days after the application the trees treated with PBZ had 5.7
fruits per panicle on average, while those treated with GA had an average close to
10 fruits per panicle, like control trees (Figure 54 A). A week later, while the trees
treated with GA and the control almost the same number of fruits per panicle
remained, while in those treated with PBZ it what significantly reduced until 1.2,
keeping it so until the end of the study.
The ringing, parallel to the PBZ, also significantly reduced the number of fruits
set up to 3 on this same date, and 10 days later both treatments had no significant
differences between themselves or with the control, while the trees treated with
GA still had 6 fruits per panicle. Twenty days later (50 days after treatment)
differences between treatments had disappeared (Figure 54 A) and all treatments
showed the same average number of fruits, 1 per panicle.

Results
84
Figure 54: Influence of the application of GA (50 mg l
-1) and PBZ (50 mg l
-1) and the ringing on
the time course of the number of fruits per panicle. Treatments were carried out in anthesis
11/04/2016 (phenological state 610 of BBCH scale) (A) and at the time of the fruit set 26/04/2016
(Ø 3mm, phenological state 711 of BBCH scale) (B). Each value is the average of 8 panicles. The
vertical bars indicate the standard error. Different letters or * for a same date indicate significant
differences (P≤0.05). GA= gibberellic acid, PBZ= paclobutrazol, RN= Ringing.
It is worth noting that the combination of treatments, that is the application of GA
or PBZ to previously ringed trees, did not significantly improve the response
(Figure 54 A). Only the first of them, to the 15 days of treatment, significantly
increased the number of fruits set (16 fruits per panicle) over the ringing, the GA
and control (10 fruits per panicle, on average), but these differences were lost in
time.
The same treatments made 15 days later, when 80% of the fruits of the panicle
had a diameter of 3 mm (phenological state 711 BBCH), obtained, however,
different answers (Figure 54 B). In this case it was immediate and 5 days after
treatment the GA and the ringing had significantly increased the number of fruits
set (29 and 25 respectively) concerning the PBZ (9 fruits per panicle) and control
(10 fruits per panicle). But ten days later the response to the treatments were
matched and all the panicles, regardless of treatment, presented 5 fruits per
average, value that was eventually reduced to 1 fruit per panicle (Figure 54 B).
Also in this case the combination of treatments, ringing + GA or ringing + PBZ,
managed to significantly improve the response.

Results
85
3.2 Influence of GA3 and PBZ on individual panicles.
3.2.1 On the vegetative development
The application of GA directly to the inflorescences of avocado cv. Hass with
vegetative bud terminal, significantly increased the length of the shoot compared
to those treated with PBZ and those of the control. Approximately 90 and 60 days
after the treatment, when the fruit had already reached 40% of its final size
(phonological states 715 and 719 BBCH scale), it measured 28.2 cm in Llaurí and
32.6 cm in Caronia Marina, while those treated with PBZ and control, both
measured in Llaurí 11.0 cm, and 26 and 21.8 cm in Caronia Marina, respectively
(Figures 55 and 56). The response to the GA was immediate and 7 days after
treatment the shoots were already practically double those treated with PBZ and
control. Contrary to what was expected, the PBZ did not reduce the length of the
shoot in respect of the control.
Figure 55: Influence of the application of inhibitors (PBZ 50 mg l
-1) and promoters (GA 50 mg l
-1)
of development to individual inflorescences in the vegetative growth of avocado cv. Hass
cultivated in Llaurí. The application was carried out in the state 610 BBCH, when 10% of the
flowers were open. Each point is the average of 10 shoots. The vertical bars indicate the standard
error. Different letters for a same date indicate significant differences (P≤0.05). The upper shaft
represents the phenological states according to the BBCH scale. Date of treatments: April 9, 2015.
610 617 618 711 712 713 715 716
0
5
10
15
20
25
30
35
BBCH
Sh
oo
t le
ng
th (
cm)
Control
PBZ
GA
a
a
a
a a
a a
a
b b b b b b b
b
b b
b
b b b b

Results
86
Figure 56: Influence of the application of inhibitors (PBZ 50 mg l
-1) and promoters (GA 50 mg l
-1)
of development to individual inflorescences in the vegetative growth of avocado cv. Hass
cultivated in Caronia Marina. The application was carried out in the state 711 BBCH. Each point is
the average of 10 shoots. The vertical bars indicate the standard error. Different letters for a same
date indicate significant differences (P≤0.05). The upper shaft represents the phenological states
according to the BBCH scale. Date of treatments: May 25, 2015.
The treatments made on the entire tree also affected the length of the shoot of the
terminal bud of the panicle regardless of the period in which they were performed.
Thus, 15 days after the treatment, shoots treated with GA and ringing were
already significantly longer (5.3 cm on average) than those treated with PBZ and
control (3.6 cm) (Figure 57 A). These differences were more significant a week
later, but in the case of ringing were lost in the following, in which only the trees
treated with GA maintained them. This difference remained significant until the
end of the study period, introducing shoots up to 4 cm longer, on average, than the
rest of the treatment (Figure 57 A). The combination of the treatments was also
ineffective in this case (data not shown).
The realization of the treatments 15 days later, when 80% of the fruit had a
diameter of 3 mm, barely changed the response. Thus, 7 days after the treatment
the trees treated with GA submitted longer shoots (7.2 cm), followed by the
ringing (5.4 cm), and those in turn of the control trees (5.1 cm) and treated with
PBZ (4.3 cm) (Figure 57 B). This trend was maintained throughout the study
period and at the end of the same (38 days after the treatment) shoots of the trees
treated with GA measured around 1 cm more than the controls and ringing and up
711 712 715 719
0
5
10
15
20
25
30
35
40
25/05/15 04/06/15 26/06/15 20/07/15
BBCH
Sh
oo
t le
ng
th (
cm)
Control
PBZ
GA
a
a
a
a
a
b b
b
c b
b b

Results
87
to 3 cm more than those treated with PBZ (Figure 57 B). In this case, only the
ringing + GA managed to increase in 1.5 cm, on average, the length of the shoot
developed from the terminal bud of the panicle in respect of GA applied in
solitaire (data not shown).
Figure 57: Influence of the application of GA (50 mg l
-1) and PBZ (50 mg l
-1) to entire the tree
and the ringing on the time course of the length of the shoot developed from the terminal bud of
the vegetative panicle. Treatments were carried out in anthesis 11/04/2016 (phenological state 610
of BBCH scale) (A) and at the time of the fruit set 26/04/2016 (Ø 3mm, phenological state 711 of
BBCH scale) (B). Each value is the average of 8 shoots. The vertical bars indicate the standard
error. Different letters for a same date indicate significant differences (P≤0.05). GA= gibberellic
acid, PBZ= paclobutrazol, Ringing.
In the light of the results, the time of treatment, whether it is the same or not, has
an impact on the final size of the shoot. Thus, shoots of trees treated in anthesis
0
2
4
6
8
10
12
4/19/16 4/25/16 5/2/16 5/13/16 6/3/16
Sh
oo
t le
ng
th (
cm)
Control
GA
PBZ
RINGING
a b b b
a a b b
a b c d
a b b
a b b c
A
4
4.5
5
5.5
6
6.5
7
7.5
8
8.5
9
5/2/16 5/13/16 6/3/16
Sh
oo
t le
ng
th (
cm)
Control
GA
PBZ
RINGING
B
a b b c
a b b c
a b b c

Results
88
(phenological state 610 of the BBCH scale) presented a greater length than the
treaties at the time of fruit set (phenological state 711 of the BBCH scale), with
the exception of those treated with PBZ and ringing (Figure 58).
Figure 58: Influence of the treatment time to the entire tree on the final length of the shoot
developed from the terminal bud of the vegetative panicle. Treatments performed in anthesis
11/04/2016 (phenological state 610 BBCH scale) (black bars) and at the time of the fruit set
26/04/2016 (Ø 3mm, phenological state 711 BBCH scale) (gray bars). GA= gibberellic acid (50
mg l-1
), PBZ= paclobutrazol (50 mg l-1
), RN= Ringing. Each value is the average of 10 shoots. The
vertical bars indicate the standard error. Different letters for a same treatment indicate significant
differences (P≤0.05).
It is worth noting that, also in this case, our results suggest that the fruit set is not
influenced by the growth of the shoot of the terminal bud of the panicle. So, for
example, approximately 15 days after treatment, when the number of fruits per
panicle in the control trees and treated with GA was the same, 10 fruits (Figure 54
A), the shoot of the second measured double the first (Figure 57 A). Therefore,
the fruit set of avocado does not seem to be regulated by competition phenomena
for the development.
3.2.2 On the carbohydrate content
The GA applied to individual panicles promoted the synthesis of transport sugars
in the leaves of the shoot from the terminal bud, at the same time that it
significantly reduced the concentration of sugars consumption (Figure 59). This
effect is consistent with the greater growth of shoots obtained by action of this
substance (see Figure 55). The decrease in the concentration of glucose-6-P in the
0
2
4
6
8
10
12
GA PBZ RN RN+GA RN+PBZ
Sh
oo
t le
ng
th (
cm)
Treatments
a b
a b b a
a b

Results
89
leaves treated with GA (Figure 59) ratifies the stimulus on the vegetative
development.
The PBZ, on the contrary, did not alter the balance of carbohydrates in the leaves.
Both the concentration of transport sugars and the reducers was almost equal to
that of the control trees (Figure 59). This is consistent with the results obtained in
the growth of the shoots, as both presented an identical growth until mid-June
(Figure 55), i.e. during the period of fruit set. Similar behaviour in the content of
glucose-6-P between both treatments, PBZ and control, indicates that both sheets
presented a similar metabolic activity despite the fact that the PBZ anticipated
significantly the abscission of flowers.
Figure 59: Influence of the application of inhibitors (PBZ 50 mg l
-1) and promoters (GA 50 mg l
-1)
of development to individual inflorescences in the concentration of carbohydrates in the leaves cv.
Hass avocado. The application was carried out in the state 610 BBCH, when 10% of the flowers
were open. Each point is the average of 10 thyrsi. The vertical bars indicate the standard error.
Different letters for a same date indicate significant differences (P≤0.05). PBZ: paclobutrazol, GA:
gibberellic acid. Date of treatments: April 9, 2015. Date of samples: July 13, 2015. State 719
BBCH.
3.3 Influence of Ringing, GA and PBZ on carbohydrate metabolism
3.3.1 Treatment on individual inflorescences
3.3.1.1 During flowering
The treatments with GA and PBZ to individual inflorescences altered the
metabolism of carbohydrates in flowers drops. Thus, approximately 15 days after
the treatment (April 23), flowers drops had a content of G-6-P significantly higher
in the trees treated with GA (5.88 mg g-1
DW) than in the rest of the treatments
0
5
10
15
20
25
30
35
Sucrose Glucose Fructose Perseitol
mg
g-1
DW
Control
PBZ
GA
a
b b
a a
b a
b ab
a
b b 0
10
20
30
Gluc-6-phos
a a b

Results
90
(3.52 and 3.52 mg g-1
DW for the control and PBZ, respectively) (Figure 60). In
all cases, however, its concentration diminished with time. This sugar is an
indicator of the cellular metabolic activity and its decline with the time indicates
that it is gradually increased, as corresponds to the process of fruit set.
Figure 60: Influence of the application of inhibitors (PBZ 50 mg l
-1) and promoters (GA 50 mg l
-1)
of development to individual inflorescences in the concentration of glucose-6-P of flowers drops
of avocado cv. Hass. The application was made to individual panicles in the phenological state 610
BBCH scale, when 10% of the flowers were open. Each value is the average of 10 thyrsi. The
vertical bars indicate the standard error. Different letters for a same date indicate significant
differences (P≤0.05). The upper shaft represents the phenological states according to the BBCH
scale. PBZ: paclobutrazol; GA: gibberellic acid. Date of treatments: April 9, 2015.
The behaviour of the transport carbohydrates, sucrose and perseitol, was different.
Although, in general, the highest content in both presented flowers drops of the
treated branches with GA and the lowest of the treated with PBZ (Figures 61 and
62), the sucrose content increased with time during the whole period of the
experiment, regardless of treatment, while the perseitol rose slightly during the
two weeks following the same to descend below so more marked by the action of
the PBZ (7.55 mg g-1
DW) and almost imperceptibly into the flowers treated with
GA (16.03 mg g-1
DW), leaving the controls in an intermediate position (11.68 mg
g-1
DW) (Figures 61 and 62).
The behaviour of transport sugars, mainly sucrose, is logical since it coincides
with two sink effects that occur at the same time, the flowering and the first
sprouting.
617 618 711
0
1
2
3
4
5
6
7
8
9
16/04/15 23/04/15 28/04/15
BBCH
Glu
cose
-6-P
(m
g g
-1 D
W)
Control
PBZ
GA
a
b
c a
b
b
a
a
b

Results
91
Figure 61: Influence of the application of inhibitors (PBZ 50 mg l
-1) and promoters (GA 50 mg l
-1)
of development to individual inflorescences in the concentration of sucrose of flowers drops of
avocado cv. Hass. The application was made to individual panicles in the phenological state 610
BBCH scale, when 10% of the flowers were open. Each value is the average of 10 thyrsi. The
vertical bars indicate the standard error. Different letters for a same date indicate significant
differences (P≤0.05). The upper shaft represents the phenological states according to the BBCH
scale. PBZ: paclobutrazol; GA: gibberellic acid. Date of treatments: April 9, 2015.
Figure 62: Influence of the application of inhibitors (PBZ 50 mg l
-1) and promoters (GA 50 mg l
-1)
of development to individual inflorescences in the concentration of perseitol of flowers drops of
avocado cv. Hass. The application was made to individual panicles in the phenological state 610
BBCH scale, when 10% of the flowers were open. Each value is the average of 10 thyrsi. The
vertical bars indicate the standard error. Different letters for a same date indicate significant
differences (P≤0.05). The upper shaft represents the phenological states according to the BBCH
scale. PBZ: paclobutrazol; GA: gibberellic acid. Date of treatments: April 9, 2015.
The concentration of glucose of flowers drop decreased with the time to reach the
lowest values at the time of the fruit set (Figure 63). At this time the flowers of the
617 618 711
10
20
30
40
50
60
70
4/16/15 4/23/15 4/28/15
BBCH
Su
cro
se (
mg
g-1
DW
)
Control
PBZ
GA a
b
c
a
b
c
a
a
a
617 618 711
5
10
15
20
16/04/15 23/04/15 28/04/15
BBCH
Per
seit
ol
(mg
g-1
DW
) Control
GA
PBZ
a
b
c
a
a
b
a
b
c

Results
92
control trees showed the highest concentration (32.1 mg g-1
DW) and the flowers
of the treated trees showed the lowest (27 mg g-1
DW). It should be noted that the
concentration of glucose from the flowers of treated branches with PBZ was the
lowest since the week after the treatments (32.84 mg g-1
DW vs. 39 mg g-1
DW
for the other two) thus keeping up to the time of the fruit set in that is matched
with the one treated with GA (Figure 63).
The fructose followed a similar trend, although with higher values for the whole
period and for all treatments and with a behaviour of the treated flowers with PBZ
similar to that of the rest of the treatment, except for the first date of analysis
(made a week after) (Figure 64). In this case the concentration at the time of the
fruit set was the same for all the flowers.
Figure 63: Influence of the application of inhibitors (PBZ 50 mg l-1
) and promoters (GA 50 mg l-1
)
of development to individual inflorescences in the concentration of glucose of flowers drops of
avocado cv. Hass. The application was made to individual panicles in the phenological state 610
BBCH scale, when 10% of the flowers were open. Each value is the average of 10 thyrsi. The
vertical bars indicate the standard error. Different letters for a same date indicate significant
differences (P≤0.05). The upper shaft represents the phenological states according to the BBCH
scale. PBZ: paclobutrazol; GA: gibberellic acid. Date of treatments: April 9, 2015.
617 618 711
20
25
30
35
40
45
4/16/15 4/23/15 4/28/15
BBCH
Glu
cose
(m
g g
-1 D
W)
Control
GA
PBZ
a
a
c
a
a
b
a
b b

Results
93
Figure 64: Influence of the application of inhibitors (PBZ 50 mg l
-1) and promoters (GA 50 mg l
-1)
of development to individual inflorescences in the concentration of fructose of flowers drops of
avocado cv. Hass. The application was made to individual panicles in the phenological state 610
BBCH scale, when 10% of the flowers were open. Each value is the average of 10 thyrsi. The
vertical bars indicate the standard error. Different letters for a same date indicate significant
differences (P≤0.05). The upper shaft represents the phenological states according to the BBCH
scale. PBZ: paclobutrazol; GA: gibberellic acid. Date of treatments: April 9, 2015.
3.3.1.2 During the initial development of fruit
The carbohydrates balance was also altered in the fruit drop by action of the
treatments to individual inflorescences, regardless of the time in which they were
conducted. Thus, approximately a month after the treatment (May 4), the fruit
drops had a content of g-6-P significantly higher in the trees treated with GA
(6.93 mg g-1
DW) than in the rest of the treatments (5.84 and 4.55 mg g-1
DW or
those treated with PBZ and control, respectively) (Figure 65). At the end of the
study period the differences between the control and PBZ disappeared, but the
content in the fruits of inflorescences treated with GA was higher (5.75 vs. 2.2 mg
g-1
DW of the other two treatments) (Figure 65). The downward trend of the
glucose-6-phosphate with the time, between the phenological states 712 to 715 of
the BBCH scale, was more pronounced in the fruit drop of the panicles treated
with PBZ and control than in those treated with GA.
617 618 711
30
40
50
60
16/04/15 23/04/15 28/04/15
BBCH
Fru
cto
se (
mg
g-1
DW
) Control
GA
PBZ
a
a
b
a
b
b
a
a
b

Results
94
Figure 65: Influence of the application of inhibitors (PBZ 50 mg l
-1) and promoters (GA 50 mg l
-1)
of development to individual inflorescences in the concentration of glucose-6-P of fruits drops of
avocado cv. Hass. The application was made to individual panicles in the phenological state 610
BBCH scale, when 10% of the flowers were open. Each value is the average of 10 thyrsi. The
vertical bars indicate the standard error. Different letters for a same date indicate significant
differences (P≤0.05). The upper shaft represents the phenological states according to the BBCH
scale. PBZ: paclobutrazol; GA: gibberellic acid. Date of treatments: April 9, 2015.
The behaviour of the transport carbs was also in this case, different. The fruits set
of the panicles treated with GA had the highest content of sucrose and perseitol.
In general the sucrose content decreased during the early development stages to
after increase between the phenological states 713 and 715 the BBCH scale
(Figure 66). In particular during the first phases (phenological states 712 and 715,
respectively), the fruit drop of panicles treated with GA had a greater
concentration of sucrose (8.33 and 4.96 mg g-1
DW), while in the last studied
phase (status 715 BBCH) the fruit drop from panicles treated with PBZ reached
the highest values (7.02 mg g-1
DW). The concentration of the fruits of the
panicles control is always maintained lower.
712 713 715
0
1
2
3
4
5
6
7
8
9
04/05/15 11/05/15 15/05/15
BBCH
Glu
cose
-6-P
(m
g g
-1 D
W)
Control
PBZ
GA
a
b
a
c
a
b
c
a
b
b
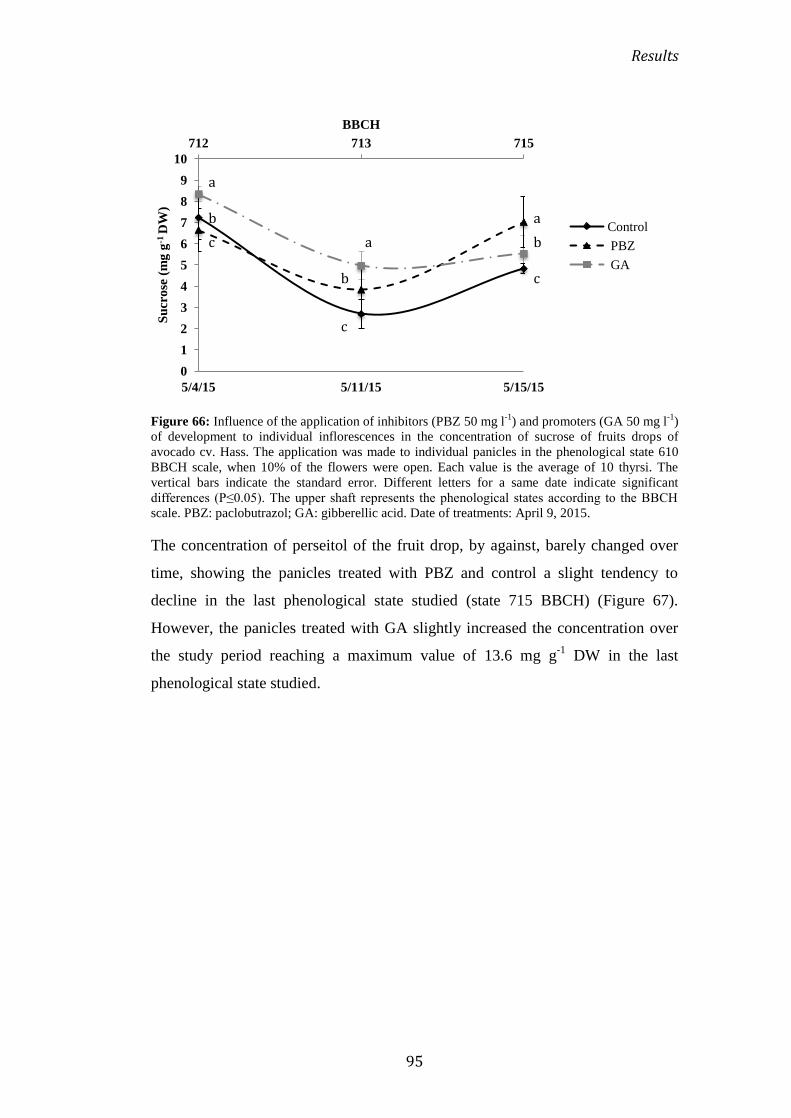
Results
95
Figure 66: Influence of the application of inhibitors (PBZ 50 mg l
-1) and promoters (GA 50 mg l
-1)
of development to individual inflorescences in the concentration of sucrose of fruits drops of
avocado cv. Hass. The application was made to individual panicles in the phenological state 610
BBCH scale, when 10% of the flowers were open. Each value is the average of 10 thyrsi. The
vertical bars indicate the standard error. Different letters for a same date indicate significant
differences (P≤0.05). The upper shaft represents the phenological states according to the BBCH
scale. PBZ: paclobutrazol; GA: gibberellic acid. Date of treatments: April 9, 2015.
The concentration of perseitol of the fruit drop, by against, barely changed over
time, showing the panicles treated with PBZ and control a slight tendency to
decline in the last phenological state studied (state 715 BBCH) (Figure 67).
However, the panicles treated with GA slightly increased the concentration over
the study period reaching a maximum value of 13.6 mg g-1
DW in the last
phenological state studied.
712 713 715
0
1
2
3
4
5
6
7
8
9
10
5/4/15 5/11/15 5/15/15
BBCH
Su
cro
se (
mg
g-1
DW
)
Control
PBZ
GA
a
b
c a
b
c
a
b
c

Results
96
Figure 67: Influence of the application of inhibitors (PBZ 50 mg l
-1) and promoters (GA 50 mg l
-1)
of development to individual inflorescences in the concentration of perseitol of fruits drops of
avocado cv. Hass. The application was made to individual panicles in the phenological state 610
BBCH scale, when 10% of the flowers were open. Each value is the average of 10 thyrsi. The
vertical bars indicate the standard error. Different letters for a same date indicate significant
differences (P≤0.05). The upper shaft represents the phenological states according to the BBCH
scale. PBZ: paclobutrazol; GA: gibberellic acid. Date of treatments: April 9, 2015.
The fruits drop showed a slight increase of the concentration of glucose during the
30 days after the treatment and a decline during the last phase of study, in
particular in those treated with GA and PBZ that reached the lowest values in the
phenological state 715 of the BBCH scale (12.3 and 9.5 mg g-1
DW, respectively)
(Figure 68). The concentration of the fruit drop of panicles control remained
almost constant during the whole period of study.
712 713 715
0
2
4
6
8
10
12
14
16
04-05-15 11-05-15 15-05-15
BBCH
Per
seit
ol
(mg
g-1
DW
)
Control
PBZ
GA
a a
a
b
b
b
b b
b

Results
97
Figure 68: Influence of the application of inhibitors (PBZ 50 mg l
-1) and promoters (GA 50 mg l
-1)
of development to individual inflorescences in the concentration of glucose of fruits drops of
avocado cv. Hass. The application was made to individual panicles in the phenological state 610
BBCH scale, when 10% of the flowers were open. Each value is the average of 10 thyrsi. The
vertical bars indicate the standard error. Different letters for a same date indicate significant
differences (P≤0.05). The upper shaft represents the phenological states according to the BBCH
scale. PBZ: paclobutrazol; GA: gibberellic acid. Date of treatments: April 9, 2015.
In regard to the fructose (Figure 69) the fruit drop showed a similar pattern in the
different treatments. During the first days, the concentration remained more or
less constant in the fruits of panicles treated with PBZ and of the control without
showing significant differences between them. In the last analysis, the same
concentration remained in the fruits of the panicles control (21.5 mg g-1
DW), and
lower in those treated with PBZ (13.29 mg g-1
DW). The fruits of the panicles
treated with GA showed a slight increase in the first week of evaluation, after
remaining stable until the last date of the analysis, when they reached the highest
value of all treatments (25.7 mg g-1
DW) (Figure 69).
712 713 715
0
5
10
15
20
25
30
35
40
04-05-15 11-05-15 15-05-15
BBCH
Glu
cose
(m
g g
-1 D
W)
Control
PBZ
GA a
a
a b
b
b
c
b
b

Results
98
Figure 69: Influence of the application of inhibitors (PBZ 50 mg l
-1) and promoters (GA 50 mg l
-1)
of development to individual inflorescences in the concentration of fructose of fruits drops of
avocado cv. Hass. The application was made to individual panicles in the phenological state 610
BBCH scale, when 10% of the flowers were open. Each value is the average of 10 thyrsi. The
vertical bars indicate the standard error. Different letters for a same date indicate significant
differences (P≤0.05). The upper shaft represents the phenological states according to the BBCH
scale. PBZ: paclobutrazol; GA: gibberellic acid. Date of treatments: April 9, 2015.
3.3.2 Treatments to the entire tree
The balance of carbohydrates in the fruits set was also altered by the treatments
made to the entire tree, regardless of the time in which they were made. Thus,
approximately 15 days after the treatment (April 25), the fruits set had a
significantly higher glucose content in the control trees (32 mg g-1
DW) than in
the rest of the treatments (23, 12 y 6 mg g-1
DW for those treated with GA,
ringing and treated with PBZ, respectively) (Figure 70 A). This effect, however,
was offset by the ringing, so that its combination with the application of GA or
PBZ increased the glucose content of the fruits of trees treated to similar
concentrations with control and did not statistically differ between them (Figure
70 A).
A double factorial analysis of the GA effect and ringing indicates that the
comparison between the content of the fruits of trees control and treated with GA
and PBZ, the latter as an inhibitor of the synthesis of gibberellins, shows no
statistically significant differences between their average, while the effect of
ringing, yes (P≤0.01). But what is really important is that the interaction GA x
ringing reached statistical significance (P≤0.01), indicating that the effect of the
712 713 715
0
5
10
15
20
25
30
04-05-15 11-05-15 15-05-15
BBCH
Fru
cto
se (
mg
g-1
DW
)
Control
PBZ
GA
a
a a
b
b b
b
b
c

Results
99
GA is mediated by ringing. What is more, the application of GA also improved
the effect of ringing by itself. The statistically significant interaction of GA x date
and ringing x date is logical because the values of glucose is altered over time, but
lacks importance in itself, except that derived from the comparative performance
between treatments, which is further analysed below.
On the contrary, in the fructose content no significant differences were found
between the control and the GA (Figure 70 B) and the application of AG or PBZ
to previously ringing trees decreased and increased, respectively, its concentration
with respect to the control (Figure 70 A and B). Also in this case, the interaction
GA x ringing reached statistical significance, in a similar manner to what
happened with the glucose.
The behaviour of the carbs of transport was not very different. In this case,
although most of the sucrose content and perseitol owned by the fruits set of
control and treated with GA, 63 and 10 mg g-1
DW and 74 and 18 mg g-1
DW,
respectively, the order was reversed and those treated the second, i.e., with GA,
presented a higher content of both carbohydrates in respect of the first (Figure 70
C and D). The combination of treatments decreased the sucrose content, and
increased the perseitol regarding the control in a 60% and 30% for ringing + GA
and ringing + PBZ, respectively. In both cases, only the GA factor was
statistically significant (P≤0.01), also achieving the interaction AG x scratched the
significance (P≤0.01), explaning thus the lower and higher sucrose content and
perseitol, respectively, in the fruits of the treated trees and ringing at a time
(Figure 70 C and D).
It is important to highlight that, in general terms, the treatments that 15 days after
they obtained a greater number of fruit sets, this is the control and the GA (10
fruits per panicle, on average) (see figure 54), obtained a higher content of sugars
consumption and transport, except the ringing that presented an intermediate
behaviour. In line with this, the PBZ was the treatment that got a smaller number
of fruit sets (5.8 fruits per panicle) and a lower concentration of sugars
consumption and transport, and the combination of ringing + GA the largest
number of fruits (up to 9 fruits + more per panicle), and the largest concentration
of carbohydrates (Figure 54 A and Figure 70).

Results
100
Figure 70: Influence of ringing and the application of GA (50 mg l-1
) and PBZ (50 mg l-1
) in
anthesis (phenological state 610 BBCH scale) to entire the tree of the glucose content (A), fructose
(B), sucrose (C) and perseitol (D) in fruit sets of cv. Hass avocado. Each value is the average of 4
samples. Treatment Date: 11/04/2016. The vertical bars indicate the standard error. GA:
gibberellic acid; PBZ: Paclobutrazol; RN: Ringing. Different letters for a same date indicate
significant differences (P≤0.05). DW = dry weight of the samples.

Results
101
A week later (May 2), while the control maintained the concentration of glucose
stable (34 mg g-1
DW) the fruits of trees treated with GA fell by 52%, while those
treated with PBZ and ringing increased by 241% and 89%, respectively (Figure
70 A). A similar behaviour between treatments occurred with the fructose,
although in this case the control decreased its content in a 50% compared to the
previous date (Figure 70 B). In any case, the combination of treatments improved
the response with respect to the control, although it was slowly, but erratically, in
respect of individual treatment (Figure 70 A and B). For example, while the
concentration of glucose in the fruits treated with GA was 13 mg g-1
DW, the
combination of the latter with the ringing improved up to 23 mg g-1
DW (Figure
70 A).
The trend of the sugars of transport, on the contrary, scarcely changed and in this
week (May 2), the fruits of trees treated with GA or ringing remained with the
highest content of sucrose and perseitol, closely followed by the control trees,
being treated with PBZ those that had the lowest concentration (Figure 70 C and
D). It is however noted a quantitative difference with the passage of time, as
evidenced by the interaction with the above mentioned dates of analysis,
especially in the sucrose content that in the fruits of the control trees and in those
treated with GA were reduced to 45% and 46%, respectively, while in the trees
treated with PBZ increased by 88% (Figure 70 C).
It is important to emphasize that the decline in the number of fruits per panicle
found on this date for the ringing, up to 7 fruits less with regard to the control
(Figure 54 A), coincided with the widespread increase in the concentration of
sugars consumption (Figure 70). However, the number of fruits set in the PBZ
was significantly lower (up to 2 fruits less than the ringing), and also what was
significant the carbohydrate content of consumption (4 and 13 mg g-1
DW less of
glucose and fructose, respectively) and transport (10 and 7 mg g-1
DW of sucrose
and perseitol, respectively) concerning the ringing. These differences persisted
over time and 30 days after treatment (May 13) still significant differences were
found in the content of carbohydrates in the fruit sets of different treatments. The
highest content of glucose recorded the control fruits (70 mg g-1
DW) and the PBZ
(67 mg g-1
DW), followed by the ringing (43 mg g-1
DW) and GA (25 mg g-1
DW)

Results
102
(Figure 70 A). In the case of fructose, the control fruits also that had the greatest
concentration, with values similar to those of the glucose (68 mg g-1
DW),
followed by those of the ringing trees (55 mg g-1
DW) and treated with PBZ (52
mg g-1
DW), without significant differences between them but yes with the fruits
of the control trees, and they are fruits of trees treated with GA which recorded, as
in the case of glucose, the lowest concentration (17 mg g-1
DW) (Figure 70 B). On
this date, unlike what can be observed in the previous two, the combination of
treatments, ringing + GA and ringing + PBZ, improved the concentration of both
carbohydrates. Thus, the concentration of glucose in the fruits increased compared
to control, 30 mg g-1
DW in ringing + GA, and 20 mg g-1
DW in ringing + PBZ.
The fructose did so in the same proportion, approximately (Figure 70 A and B).
It is to be noted that, with the exception of the GA, the highest content of
carbohydrates, was recorded in this date (May 13), arriving to be in some cases, as
in the case of the glucose, of more than double (2.3 times) than in the previous
dates. Minors contents of glucose and fructose in that date in the fruits of trees
treated with GA are correlated with the largest number of them in their panicles
(Figure 54 A).The balance of transport carbohydrates was also altered by the
treatments on this date. While the higher sucrose content was found in the fruit
sets of trees ringing (33%, 108% and 154% more than in the control, PBZ and
GA, respectively), perseitol was reached in the fruits of the control trees and
treated with PBZ indiscriminately, with average values of 48 mg g-1
DW and
being a 184% and 60% higher than those treated with GA or ringing, respectively
(Figure 70 C and D). Only in the case of perseitol it succeeded to increase its
contents with the combination of the treatments with respect to the control in 40
mg g-1
DW and 10 mg g-1
DW for the ringing + GA and ringing + PBZ,
respectively.
Particularly interesting is the progressive decline over time and the lowest value in
the sucrose content of the fruits treated with GA, alone or in combination with the
ringing, compared to the rest of treatments (Figure 70 C), since it is also this case
that correlates with the largest number of developing fruits (Figure 54).
The balance of carbohydrates from shoot originated from the terminal bud of the
panicle was also altered by the treatments made at the time of anthesis.

Results
103
Thus, 15 days after the treatment (April 25), the shoots of the trees ringing
together with those of the trees treated with GA, had more glucose (12 mg g-1
DW
and 11.76 mg g-1
DW, respectively) and fructose (6 mg g-1
DW and 11.76 mg g-1
DW respectively), than the rest of the treatments (Figure 71 A and B).
The shoots of the trees treated with PBZ were those who had lower content,
occupying the controls an intermediate position.
However, in relation to the transport sugars (sucrose and perseitol), the fruits of
trees ringing showed a lower content (45 mg g-1
DW) of sucrose than those treated
with GA or PBZ (67 mg g-1
DW and 61 mg g-1
DW respectively), and a similar
content of perseitol in fruits of trees ringing or treated with PBZ (12.8 and 12.1
mg g-1
DW, respectively) (Figure 71 C and D). In this case the GA effect,
understood as discussed in this study, did not reach statistical significance, but its
interaction with ringing. What is more, the content of all sugars in the leaves of
the branches ringing remained virtually constant, and even increased in some of
them, over time (Figure 71), highlighting its interactive effect with the treatments.

Results
104
Figure 71: Influence of ringing and the application of GA (50 mg l
-1) and PBZ (50 mg l
-1) in
anthesis (phenological state 610 BBCH scale) to the entire tree of the glucose content (A), fructose
(B), sucrose (C) and perseitol (D) in shoots developed from the terminal bud panicle of cv. Hass
avocado. Each value is the average of 4 samples. Treatment Date: 11/04/2016. The vertical bars
indicate the standard error. GA: gibberellic acid; PBZ: Paclobutrazol; RN: Ringing. Different
letters for a same date indicate significant differences (P≤0.05). DW = dry weight of the samples.
A week later (May 2), shoots of the control trees had just changed their sugar
content, with the exception of the sucrose (Figure 71). In the trees treated with

Results
105
GA, however, the glucose content of their shoots had decreased by 6 mg g-1
DW
while the fructose had increased by 6 mg g-1
DW. In the trees treated with PBZ
the content of glucose, fructose and sucrose from their shoots had decreased and
the combination GA + ringing had a positive effect on the glucose and fructose,
increasing its content in 4 and 3 mg g-1
DW, respectively (Figure 71 A and B),
and negative for the sugars of transport (Figure 71 B and C).
Approximately a month after the treatment (May 13), the concentration of glucose
from the shoots of control trees and ringing decreased, while that of those treated
with GA and PBZ increased, reaching values of 6.31 and 8.69 mg g-1
DW,
respectively. On this date the combination ringing + PBZ doubled the glucose
content in respect of the control. The fructose content of shoots was only
increased by the action of ringing, reaching 9.2 mg g-1
DW, this is 30% more than
that of the control trees. The highest content of transport sugars was detected in
the controls. While for sucrose the PBZ gave rise to minor content in shoots (42.3
mg g-1
DW), for the perseitol the shoots of the trees treated with GA reflected the
lowest value (16.73 mg g-1
DW) (Figure 71 C and D). The combination ringing +
PBZ increased its content of both sugars. It should be noted that the concentration
of sugars consumption (glucose and fructose) detected was less than the transport
sugars (sucrose and perseitol) having the sucrose the lowest concentration.
The realization of the treatments 15 days after the anthesis, in full process of fruit
set, when the fruits had a diameter of 3 mm, also altered the metabolism of
carbohydrates. After approximately 7 days of treatment (May 2), the fruits of the
control trees had a significantly higher content of glucose (35 mg g-1
DW) than in
the rest of treatments (which was on average 18.5 mg g-1
DW). In the case of
fructose, on the contrary, the fruits of the control trees and ringing presented a
significantly lower concentration (around 15 mg g-1
DW) than those treated with
GA or PBZ, (20 and 34 mg g-1
DW, respectively) (Figure 72 A and B). In the case
of the transport sugars, the concentration of sucrose was significantly higher in the
fruit sets of control and treated with GA (36 mg g-1
DW, on average) than in those
of the trees ringing or treated with PBZ (30 and 24 mg g-1
DW, respectively)
(Figure 72 C). Perseitol concentration was only altered by the GA who managed
to increase by 37%, on average, compared to the rest of treatments (Figure 72 D).

Results
106
However, 10 days later (May 13), there was a widespread tendency to
significantly increase the concentration of all sugars (except the sucrose),
regardless of treatment. As a whole, and on average, glucose increased its content
of 120%, fructose 200%, and sucrose and perseitol 57% and 150%, respectively
(Figure 72).
Figure 72: Influence of ringing and the application of GA (50 mg l-1
) and PBZ (50 mg l-1
) to the
entire tree when 80% of the fruit had a diameter of 3 mm (phenological state 711 BBCH scale), on
the glucose content (A), fructose (B) sucrose (C) and in perseitol (D) in fruit sets cv. Hass
avocado. Each value is the average of 4 samples. Date of treatments: 26/04/2016. The vertical bars
indicate the standard error. GA: gibberellic acid; PBZ: Paclobutrazol; RN: Ringing. Different
letters for a same date indicate significant differences (P≤0.05). DW = dry weight of the samples.

Results
107
As in previous cases the combination of the treatments showed erratic, improving
the concentration of glucose, fructose and perseitol only in the case of the
combination GA + ringing (Figure 72).
The analysis of variance revealed to the contents of glucose and fructose a
statistically significant effect (P≤0.01), both by the GA effect as by the ringing
effect, and their interaction. This is undoubtedly due to the synergistic effect of
the combination GA + ringing. Indeed, regardless of their individual action noted
above, ringing of trees treated with GA increased glucose and fructose content of
fruit in the two analysis dates (Figure 72 A and B). On the contrary, it failed in the
sucrose content (Figure 72 C).
The effect of the treatments during the fruit set also changed the carbohydrate
content of the leaves of the shoot of the panicle in growth. Thus, 7 days after
treatment the leaves of ringing trees presented the greatest concentration of
consumption sugars, glucose and fructose, with 16 and 14 mg g-1
DW,
respectively, while the rest of the treatment, control, GA and PBZ, was for the
glucose of 10, 7.5 and 5 mg g-1
DW, respectively, and 4.5 mg g-1
DW, on average,
for the fructose (Figure 73 A and B). Although the ringing effect was statistically
significant, its combined effect with the treatments only increased the contents in
the leaves of the trees treated in turn with GA, but its interaction did not reach
statistical significance.
The concentration of sucrose was only modified by the AG and ringing, which
reduced up to 25 mg g-1
DW with respect to the control. A week later, the effect
was lost reaching similar values (62 mg g-1
DW on average) for all treatments
(Figure 73 C). The sucrose content of the leaves of the trees treated with PBZ did
not differ from the control trees on any of the dates analysed (Figure 73 C). The
statistical analysis of the results reveals statistical significance for the GA and
ringing effects, as corresponds to the significantly lower values in these treatments
in the first date of the analysis, and also for their interaction. Indeed, leaves
treatment GA + ringing were the lowest concentration of sucrose presented at
both dates of analysis, and it correlates well with the fact that on May 13 we had
the treatment largest number of fruits kept on the tree (10 fruits per panicle)
(Figure 54 B).

Results
108
The perseitol content, on the contrary, increased in the leaves of the trees treated
with GA in respect of the control trees on both dates of analysis, 6 and 8 mg g-1
DW, respectively (Figure 73 D). In the ringing trees we also observed a decrease
in the concentration of perseitol on the first date of analysis (5 mg g-1
DW, with
respect to the control) (Figure 73 D). The PBZ did not alter the perseitol content
of leaves on control trees in any of the dates of the analysis. For this carbohydrate
no significant interactions were detected between the treatments.
Figure 73: Influence of ringing and the application of GA (50 mg l
-1) and PBZ (50 mg l
-1) to the
entire tree when 80% of the fruit had a diameter of 3 mm (phenological state 711 of the BBCH
scale), on the glucose content (A), fructose (B) sucrose (C) and perseitol (D) in the shoots
developed from the terminal bud of the panicle in cv. Hass avocado. Date of treatments
26/04/2016. Each value is the average of 4 samples. GA: gibberellic acid; PBZ: Paclobutrazol;
RN: Ringing. The vertical bars indicate the standard error. Different letters for a same date
indicate significant differences (P≤0.05). DW = dry weight of the samples.

Results
109
3.4 Influence of GA3 and PBZ during anthesis and fruit set in the hormonal
balance
The effect of the treatments also reached the hormonal balance of the fruit sets.
Thus, the gibberellins (GA1) content of the latter was only altered by the treatment
with GA. Fifteen days after the application to panicles in anthesis, the
concentration of GA1 on fruit set was significantly higher (39 ng g-1
DW) than the
controls and treated with PBZ (17 ng g-1
DW). What is more, a week later these
differences were more significant because while in the first case the content
increased dramatically up to 900 ng g-1
DW, in the second it did slightly, up to 45
ng g-1
DW, and the third was reduced to practically null values.
It is worth noting this action of GA applied exogenously to promote the synthesis
of gibberellins in the fruits set, although this does not succeed in reducing their
abscission and therefore increase the number of fruits per panicle (see figure 54
A).
The response in the rest of the analysed hormones was different. To the 15 days of
treatment, while the concentration of indolacetic acid (IAA) in the fruit sets of the
panicles treated with PBZ was very low (1 ng g-1
DW), in the controls or treated
with GA it was, on average, 67 ng g-1
DW (Table 5).
Treatments
Daa GA PBZ CNT GA PBZ CNT
IAA (ng g-1 DW ) tZ (ng g-1 DW )
15 66,9± 0,1 b 1,0± 0,1 a 67,9 ± b 50,2 ± 0,07 c 2,9 ±0,7 b 1,5 ±0,07 a
20 76,5±2 a 63,6±6,9 a 119,2 ±3,1 b 3,1 ± 0,046 b 1,6±0,1 a 32,7 ± 4,18 c
30 71,7 ±6,2 a 476,3 ±3 b 93,5±23 a 9,3±0,3 a 317,8±47b 392,5±51 b
Table 5: Influence of the application of gibberellic acid (GA 50 mg l-1
) and paclobutrazol (PBZ 50
mg l-1
) at anthesis (growth stage 610 BBCH scale) to the entire tree on the content of indoleacetic
acid (IAA) and trans-zeatin (tZ) of the fruit. Each value is the mean of 4 samples. GA= giberellic
acid; PBZ= Paclobutrazol; CNT= Control. Different letters in the same row indicate significant
differences (P≤ 0.05) for the same hormone.
Five days later all frits increased their IAA content, but while the control and
treated with PBZ did in 51.3 and 62.7 ng g-1
DW, respectively, those of GA3 only
did 9.5 ng g-1
DW (Table 5).
The application of GA3 also increased, significantly the content of the fruit in

Results
110
trans-zeatine (tZ), reaching values of 50.2 mg g-1
DW, compared to 1.5 and 2.9 of
the control fruits and treated with PBZ, respectively (Table 5). Five days later, and
in contrast with the IAA, its concentration was reduced by 93% by the action of
GA and 56% in the trees treated with PBZ, while increased 20 times in the
control.
Finally, after 30 days of treatment the response was completely different: while
those treated with GA maintained the concentration of IAA and slightly increased
the tZ, those treated with PBZ increased both concentrations dramatically, up to
7.5 times and 198 times more, respectively, and the controls decreased the IAA in
25.6 ng g-1
DW and increased the tZ up to 12 times, thus achieving the maximum
value (Table 5).
It is noteworthy that on this date the number of fruits per panicle in the trees
treated with PBZ (1 fruit per panicle) and in the control (1.2 fruits per panicle)
was significantly lower than in those treated with GA (6 fruits per panicle), which
suggests, in the view of the initial hormonal values (15 days after treatment) an
action governed by gibberellins and cytokinins on fruit set of this species. The
delay of the abscission of fruits evidenced it, since it necessarily implies a greater
number of initial fruit set.
When the application of GA was conducted 15 days later, the response in the
content in gibberellin was the same. The fruit sets of control trees and the panicles
treated with PBZ, a week after the treatment were, on average, 20 ng g-1
DW of
GA1 while those treated with GA had 1500 ng g-1
DW. These differences are
accentuated over time and 10 days later, while the concentration in the control
remained almost stable, in those treated with PBZ and GA decreased and
increased by 10% and 50%, respectively.
The trend in the rest of the analysed hormones was identical, although with
quantitative differences between them, and both the IAA and the tZ increased
their content over time, regardless of the treatment. However, there were
differences related to the treatments. Thus, a week after the application of GA and
PBZ, the concentration of IAA and tZ in the fruit set was higher than that of the
control, since in both cases the PBZ which registered higher values (59 ng g-1
DW
and 83.9 ng g-1
DW more IAA than the GA3 and control, respectively) and (1.8 ng

Results
111
g-1
DW and 7 ng g-1
DW more than tZ) (Table 6).
Treatments
Daa GA PBZ CNT GA PBZ CNT
IAA (ng g-1 DW ) tZ (ng g-1 DW )
7 93,8 ± 19,9 a 151,8 ± 0,7 b 67,9±0,2 a 6,7±0,86 b 8,5±1,21 b 1,5±0,07 a
15 712,3 ± 101,2 c 406,8 ± 16,3 a 528,9 ± 23,67 b 259,7 ± 35,3 b 200,9±7,17 a 392,5 ± 51,8 c
Table 6: Influence of application of gibberellic acid (GA 50 mg l-1
) and paclobutrazol (PBZ 50 mg
l-1
) to the entire tree when 80% of the fruit had a diameter of 3 mm (phenological state 711 BBCH
Scale), on content of indolacetic acid (IAA) and trans-zeatine (tZ) of the fruits. Each value is the
mean of 4 samples. GA= giberellic acid; PBZ= Paclobutrazol; CNT= Control. Different letters in
the same row indicate significant differences (P≤ 0.05) for the same hormone.
Twelve days later, when almost all treatments had the same number of fruit sets
(see Figure 54 B), the concentration of IAA in those treated with GA was
significantly higher, 712.3 ng g-1
DW, than the controls and treated with PBZ that
was 528.9 and 406.8 ng g-1
DW, respectively (Table 6). The concentration of tZ,
however, was significantly higher in the controls (392.5 ng g-1
DW) than in the
treaties, for which it reached an average value of 230.3 ng g-1
DW.
Jointly analysing the hormone content of the fruit sets in the different treatments
and time of realization of the same, quantitative notable significant differences are
observed. For example, 15 days after the treatment the content of IAA in the fruit
sets in the panicles treated with GA during anthesis was 66.9 ng g-1
DW, while in
those treated during fruit set it was 712.3 ng g-1
DW. For tZ the differences were
also remarkable and the concentration in the first case was of 50.2 ng g-1
DW and
in the second 259.7 ng g-1
DW (Tables 5 and 6). Something similar happened with
the treatment with the PBZ and control, it follows that the phenological state of
the plant at the time of the treatment influences in a remarkable way in its
effectiveness and in the hormonal response.

Discussion
112
V. DISCUSSION

Discussion
113
V. DISCUSSION
In many fruit tree species, as for avocado and some citrus varieties, tree
production is linked, among other factors, to flowering intensity. In some cases, as
when a negative relationship between flowering intensity and fruit production is
established, inhibition of flowering is requested to increase fruit production. In
avocado, Chandler (1958) reported that fruit set is usually less than 0.02% of the
total number of flowers produced.
Gibberellins are responsible for the sprouting in many fruit tree species (Faust,
1989) and are directly involved in the flowering process, interfering with it
(Goldschmidt et al., 1997). Accordingly, the application of GA3 during the floral
bud inductive period significantly reduces flowering intensity (Southwick and
Glozer, 2000) of some fruit tree species such as citrus (El-Otmani et al., 2000),
mango (Turnbull et al., 1996), pome fruit (McArtney and Li, 1998) and stone fruit
(González-Rossia et al., 2006; 2007). In ‘Hass’ avocado, our results show a
reduction of 50% of flowering by gibberellic acid when applied at a concentration
of 50 mg l-1
during the floral bud inductive period (phenological stage 010 of the
BBCH scale), coinciding with those obtained by Salazar-García and Lovatt
(1997).
The inhibitory effect of gibberellic acid on flowering of fruit species also takes
place through a reduction of bud sprouting, as reported for citrus (García-Luís et
al., 1986) and loquat (Reig et al., 2011), reducing the number of inflorescences
per tree (Reig et al., 2011). Our results agree with it, decreasing the number of
sprouted nodes and, thus, reducing the number of developed panicles. Gibberellic
acid (1000 ppm) also increased shoot growth of the indeterminate inflorescences
(Salazar-García and Lovatt, 1999) and increased the number of vegetative apical
shoots (Salazar-García and Lovatt, 1997).
In our experiments, especially in the orchard located at Caronia Marina,
determinate panicles set more fruits than indeterminate ones. These results
coincide with those reported by Wolstenholme and Whiley (1995), and Rosales et
al. (2003), who claim for a strong competition among fruits, roots, and new shoots
development. Cossio-Vargas et al., (2007) also reported a significant fruit drop in

Discussion
114
some periods in which vegetative growth and fruit development coincided,
showing that competition between them directly affected crop load.
In this way, early and vigorous shoot elongation might have an adverse effect on
fruit set. According to Schroeder (1944), in the cv. Fuerte, 5% to 20% of the
terminal buds may abort, the proportion increasing with increasing flowering.
Therefore, in this case, no competition with vegetative growth takes place and a
better fruit set and fruit size are reached (Whiley, 1994). Our results do not agree
with this behaviour as the number of fruit sets at the end of the first physiological
drop was identical regardless of the vigour of the shoot. Moreover, when PBZ was
applied at two phenological stages, anthesis and fruit set, shoot vigour was
significantly reduced, but fruit set was not, in contrast with Wolstenholm (1990)
and Whiley et al. (2007), who increased fruit set and size by applying PBZ to
reduce spring shoots growth.
Regarding the endogenous hormonal content, GA1 was not detected in our
analysis. However, the decline in content of the precursor GA20 paralleled a
significant increase, up to 3-folds, of the GA29 content, which justifies the absence
of GA1 in this process and suggests that the path of the 13-hidroxilation of the
gibberellin synthesis in this species could be merely catabolic. The higher content
of tZ in flowers during abscission, suggests that cytokinins might control the
process.
It is interesting to note that IAA content precedes that of tZ, suggesting that fruit
set in avocado might be determined by an interaction between both hormones. In
control trees an increase in IAA content precedes fruit set, and also the increase in
tZ content, suggesting an essential role regulating the process, i.e. the possibility
that fertilization would trigger an auxin-mediated promotion of tZ synthesis.
Similarly, interactions between auxins and gibberellins on early fruit set and
development are well documented, especially in herbaceous plant species such as
pea, tomato or arabidopsis (O´Neill and Ross, 2002; Ozga and Reinecke, 1999,
2003; Ollimpieri et al., 2007; Ozga et al., 2009; Serrani et al., 2008; Dorcey et al.,
2009). In these species, evidence indicates that both hormones act coordinatedly
inducing fruit set.

Discussion
115
Finazzo et al. (1994) studying the distribution and allocation of carbohydrates in
avocado, showed that the availability of carbohydrates in the tree was sufficient to
sustain the growth of developing fruitlets, leaves, and shoots during the early
stages of fruit set, therefore the fruitlet abscission must not be due to the shortage
of carbohydrates. It is in contrast with the results of Wolstenholme et al. (1990),
who confirmed that foliar applications of PBZ at full bloom, significantly reduced
shoot growth and increased crop load. However, for the avocado, it has been
suggested that competition for carbohydrates among developing fruits (Sedgley,
1987), or between them and vegetative growth (Biran, 1979), is responsible for
flowers/fruitlets. Nevertheless, Biran (1979), and Cutting and Bower (1990)
reported that spring pruning increased fruit set, but did not affect the number of
fruits harvested per tree, in agreement with our results. Furthermore, our results
for determinate and indeterminate panicles show an intense competition between
reproductive and vegetative organs at the early stages of flower development, but
after fruit set this kind of competition disappears.
Therefore, the number of fruits per panicle at the end of the physiological fruitlet
drop was the same, although the sugar content, reducing (glucose and fructose)
and translocating (sucrose and perseitol) sugars, was not. And also, regardless of
the treatment carried out and date of treatment. At the early stages of fruitlet
development, i.e. the period of high energy demand, treatments improved fruit set
and also increased carbohydrate content in the surviving fruitlet, suggesting a
close relationship between the availability of carbohydrates and fruit set.
However, this effect was lost over time and the differences in the carbohydrate
content of fruits from different treatments was not related to the final number of
developing fruits. Furthermore, in ringed branches, the delay of fruitlet abscission
coincided with an increase in the sugar content, suggesting that nutritional aspects
are not the primary responsible of the process. By contrast, trees treated with PBZ
reduced the number of developing fruitlets and also the sugars (reducing and
translocating) concentration. Since PBZ inhibits gibberellin synthesis, it suggests
a hormonal control over the nutritional one.
The source-sink relationships play a key role in carbohydrates translocation in the
tree. Sugars translocation is strongly influenced by developing sinks, so that the

Discussion
116
reproductive and vegetative organs compete for carbohydrates (Ho et al, 1989;
Patrick, 1989), the fruit being a stronger sink and, therefore, carbohydrate
translocation to the vegetative organs diminishes. Our results agree with it, as
evidenced by the lower content of glucose and fructose in leaves of the apical
shoot regarding those of the developing fruitlet. Up to 11 and 10-fold higher
content of glucose and fructose, respectively, were detected in fruitlets than in the
leaves of the longer shoots, which reflects the fruit sink strength. Not significant
differences in sucrose and perseitol content were detected.
Interestingly, while in the abscissed flowers the most abundant translocating sugar
was sucrose, in fruits newset it was perseitol. These results coincide with those of
Liu et al (2002) and show that this 7C sugar is a translocating sugar in this
species. The high concentration of glucose-6-P has been related to the energy
required for the synthesis of lipids (Gandolfo, 2008).
Gibberellic acid applied at anthesis does not modified leaf concentration of
glucose and fructose, but sucrose, that significantly increased.
In our experiments, gibberellic acid did not increased fruit set as, for example, it
occurs in citrus (El-Otmani et al., 2000). However, trees treated with PBZ set
significantly less fruits than the control and GA and ringed branches treated trees,
suggesting that, nevertheless, it must be regulated hormonally. Besides, ringing
branches did not compensate this PBZ depressive effect on fruit set, confirming
that fruit set is not a merely nutritional controlled process. Furthermore, in citrus,
ringing activates photosynthetic efficiency of photosystem II (ɸPSII) of young
leaves 30 days after it was performed (Rivas et al., 2007), explaining the higher
content in reducing carbohydrates in leaves and fruitlets in our experiment when
ringing is performed at 3 cm fruit diameter. Since at this date of treatment ringing,
and also GA, increased the number of developing fruitlets and their interaction
became statistically significant, fruit development at this phenological stage is
nutritionally dependent, as in other woody species (Faust, 1989).

Conclusions
117
VI. CONCLUSIONS

Conclusions
118
VI. CONCLUSIONS
1. Gibberellic acid applied during the floral bud inductive period delayed
sprouting, reduced the number of flowers per panicle, increased apical shoot
length, and delayed fruitlet abscission.
2. Gibberellic acid applied at anthesis enhanced fruit set and delayed fruitlet
abscission. It correlated with an immediate and temporary increase of GA1, IAA
and tZ content. But the GA1 immediately derived in its catabolite GA8.
3. Gibberellic acid applied at fruit set stage also enhanced fruit set, delayed
fruitlet abscission, and temporarily increased GA1 and GA8 content, IAA and tZ
showing an erratic behaviour.
4. Paclobutrazol applied at anthesis (610 BBCH scale) anticipated flower
abscission, but did not affect initial fruit set.
5. Accordingly, in avocado, fruit set is regulated by cytokinins that ensure
carbohydrate availability to the fruit for development. Since IAA synthesis
precedes fruit set and tZ increasing content, the possibility that fertilization would
trigger an auxin-mediated promotion of tZ synthesis cannot be discarded.

References
119
VII. REFERENCES

References
120
VII. REFERENCES
Alcaraz, M.L., Throp, T.G. Y Hormaza, J.I. 2013b. Phenological growth
stages of avocado (Persea americana) according to the BBCH scale. Scientia
Horticulturae 164, 434-439.
Alcaraz, M., J. Rodrigo and J. Hormaza. 2011. Implications of starch content
in the flower at anthesis on final fruit set in avocado. p 7. In: Proceedings VII
World Avocado Congress. Cairns, Australia.
Aubert, B. and Lossois, S. 1972. Considérations sur la phénologie des espèces
arbustives. Fruits 27(4): 269-286.
Bergh, B.O. 1969. Avocado (Persea americana Miller). In: Ferwerda, F.P. and
Wit, F (eds). Outlines of Perennial Crop Breeding in the Tropics.
Landbouwhogeschool, Wa- geningen, The Netherlands, pp. 23-51.
Bergh, B.O. 1974. The remarkable avocado flower. Calif. Avo. Soc. Yrbk.
57:40-41.
Bernal, J., and C. Díaz. 2005. Generalidades del cultivo. En: Tecnología para
el cultivo del aguacate, Bernal, J., y Diaz, C. (Eds.). Manual Técnico 5,
CORPOICA, Centro de Investigación. La Selva, Rionegro, Colombia. p. 11-84.
Biran, D. 1979. Fruitlet abscission and spring growth retardation – their
influence on avocado productivity. MSc thesis, The Hebrew University of
Jerusalem, Rehovot, Israel.
Blanke, M. and Whiley, A. 1995. Bioenergetics, respiration cost and water
relations of developing avocado fruit. Journal of Plant Physiology 145, 87-92.
Blanke, M. M.; Lovatt, C. J. 1998. Determinate versus indeterminate
inflorescences of the ‘Hass’ avocado. Proc. World Avocado Congr. III. Tel Aviv,
Israel. October 22-27, 1995. pp. 33- 36.
Board, M., Colquhoun, A. and Newsholme, E.A. 1995. Hight Km glucose-
phosporylating (glucokinase) activities in a range of tumor cell lines and
inhibition rates of tumor growth by the specific enzyme inhibitor mannoheptulose.
Cancer Res. 55:3278-3285.
Bower, J.P. and Cutting, J.G. 1988. Avocado fruit development and ripening
physiology. Horticultural Reviews, 113: 229-71.

References
121
Bower, J.P., Lovatt, C.J., Cutting, J.G.M. and Blanke, M.M. 1990.
Interaction of plant growth regulator and carbohydrate in flowering and fruit set.
Acta Horticulturae 275: 425 - 434.
Bruwer A, Robbertse P. 2003. Flowering of avocado (Persea americana
Mill.) as in uenced by gibberellic acid treatments. En: Proc V World Avocado
Congress. málaga, españa: Consejería de Agricultura y Pesca. pp. 227-230.
Cabezas, C., J. Hueso y J. Cuevas. 2003. Identificación y descripción de los
estados fenológicos y tipos de aguacate (Persea americana Mill) p. 237-242. En:
Proceedings V World Avocado Congress. Granada - Málaga, España.
Calabrese, F. 1992. El aguacate. Madrid. Ediciones Mundi-Prensa. 249 p.
Can-Alonzo C, Quezada-euán j, Xiu-Ancona P, moo-Valle H, Valdovinos-
núñez G, medina-Peralta s. 2005. Pollination of ‘criollo’ avocados (Persea
americana) and the behaviour of associated bees in subtropical mexico. j Apicult
Res 44(1):3-8.
Cerdas, M., M. Calderón and E. Díaz. 2006. Manual de Manejo Pre y
Poscosecha de Aguacate (Persea americana). MAG. San José, Costa Rica. 95 p.
Chacko, E. K., Singh, R. N., and Kachru, R. B. 1972. Studies on the
Physiology of Flowering and Fruit Growth in Mango (Mangifera Indica L). Vii.
Naturally Occurring Auxins and Inhibitors in the Shoots of Flowering (On) 1 and
Vegetative (Off) 2 Mango Trees. Indian Journal of Horticulture, 29(2), 115-125.
Chandler, W.H. 1985. Evergreen Orchards, 2nd end. Lea and Febiger,
Philadelphia, Pennsylvania, pp. 205-228.
Cossio-Vargas, L., S. Salazar-García, I. González-Duran and R. Medina-
Torres. 2007. Algunos aspectos reproductivos del aguacate ‘Hass’ en clima
semicálido. p. 11. En: Proceedings VI World Avocado Congress. Viña Del Mar,
Chile.
Cristoffanini, L. 1996. Caracterización de la floración en paltos (Persea
americana Mill.) cvs. Fuerte, Gwen, Whitsell and Esther. Universidad Católica de
Valparaíso. Facultad de Agronomía. Área Fruticultura. Quillota, Chile. 67 p.
Cutting, J.G.M. And Bower, J.P. 1990. Spring vegetative flush removal: the
effect on yield, size, fruit mineral composition and quality. South African Avocado
Growers Association Yearbook 13, 33-34.

References
122
Davenport T.L. 1982. Avocado growth and development. Proc. Fla. State
Hort. Soc. 95: 92-96.
Davenport, T.L. 1986. Avocado flowering. Horticultural Reviews 8, 257-289.
Dixon J. and D. Sher. 2002. Pollination of avocados. Annual Research Report
of New Zealand Avocado Growers Association 2: 31-40.
Dixon, J. 2007. Shoot growth of ‘Hass’ avocado trees in 'on' and 'off' flowering
years in the western bay of Plenty. Annual Research Report of New Zealand
Avocado Growers Association 7: 41-48.
Dorcey, E., Urbez, C., Blázquez, M. A., Carbonell, J., and Perez‐ Amador,
M. A. 2009. Fertilization‐ dependent auxin response in ovules triggers fruit
development through the modulation of gibberellin metabolism in Arabidopsis.
The Plant Journal, 58(2), 318-332.
Eaks, I. 1990. Change in the fatty acid composition of avocado fruit during
ontogeny, cold storage and ripening. Tropical Fruit in International Trade. Acta
Horticulturae 269: 141- 151.
El-Otmani, M., Coggins, C., Agustí, M. Y Lovatt, C.J. 2000. Plant Growth
Regulators in Citriculture: World current Uses. Crit. Rev. Plant Science. 19:5,
395-447.
F. Rivas, Gravina, A. and Agustí, M. 2007. Girdling effects on fruit set and
quantum yield efficiency PSII in two Citrus cultivars. Tree Physiology, 27: 527-
535.
Faust, M. 1989. Physiology of temperature zone fruit trees, Ed. John Wiley &
Sons, 1989 pp. x + 338 pp. NY, EEUU.
Finazzo, S.F., Davenport, T.L. And Schaffer, B. 1994. Partitioning of
photoassimilates in avocado (Persea americana Mill.) during flowering and fruit
set. Tree Physiology 14, 153-164.
Gandolfo, S.P., 2008. Factores cofisiol gicos Relacionados con el
Crecimiento egetativo, Floraci n y Desarrollo del Fruto del Aguacate. Tesis
doctoral. niversidad Polit cnica de alencia. Departamento de Producci n
Vegetal. 211 p.
Garcia‐ Luis, A., Almela, V., Monerri, C., Agustí, M., and Guardiola, J. L.
1986. Inhibition of flowering in vivo by existing fruits and applied growth
References
123
regulators in Citrus unshiu. Physiologia plantarum, 66(3), 515-520.
Gardiazabal, F. 2004. Riego y nutrición en paltos. En: Segundo Seminario
Internacional de Paltos. Sociedad Gardiazabal y Magdahl Ltda. Quillota, Chile. 21
p.
Garner, L.C. and C.J. Lovatt. 2008. The relationship between flower and fruit
abscission and alternate bearing of ‘Hass’ avocado. J. Amer. Soc. Hort. Sci.
133:3-10.
Gazit, S. and Degani, C. 2002. Reproductive biology. In: A.W. Whiley, B.
Schaffer and B.N. Wiolstenholme, Editors, The Avocado, CABI Publishing, Oxon
(2002), pp. 101–133.
Goldschmiidt, E., Tamim, M. and Goren, R. 1997. Gibberellins and
flowering in citrus and other fruit trees: A critical analysis. Acta Hortic. 463, 201-
208.
González-Rossia, D., Juan, M., Reig, C. and Agustí, M. 2006. The inhibition
of flowering by means of gibberellic acid application reduces the cost of hand
thinning in Japanese plums (Prunus salicina Lindl.). Scientia Horticulturae. 110,
319-323.
González-Rossia, D., Reig, C., Juan, M. and Agustí, M. 2007. Horticultural
factors regulating effectiveness of GA3 inhibiting flowering in peaches and
nectarines (Prunus persica L. Batsch) Scientia Horticulturae. 111, 352-357.
Guardiola, J. L., Acusri, M., and Garcia-Mar, F. 1977. Gibberellic Acid
And Flower Bud Development In Sweet. In Proc. Int. Soc. Citriculture (Vol. 2).
Guardiola, J. L., García‐ Marí, F., and Agustí, M. 1984. Competition and
fruit set in the Washington navel orange. Physiologia plantarum, 62(3), 297-302.
Gustafson, C.O., and B.O. Bergh. 1976. History and review of studies on
cross pollination of avocados. Calif. Avocado Soc. Yearb. 50:39-49.
Hernández, F. 1991. Aproximación al ciclo fenológico del palto (Persea
americana Mill.) cv. “Hass”. p. 103. Tesis Ingeniero Agr nomo. niversidad
Católica de Valparaíso, Facultad de Agronomía, Quillota, Chile.
Ho, L.C, Gange, R.I and Shaw, A.F. 1989. Source/sink regulations. In:
Transport of photoassimilates, Baker, D.A; Milburn, J.A. (Eds.), Longman
Scientific and Technical, Harlow, UK, pp.306-344.
References
124
Iwahori, S.; Oohata, J.T. 1981. Control of flowering of Satsuma mandarins
(Citrus unshiu Marc) with gibberellin. Proc. Int. Soc. Citricult. 1: 247-249.
Jackson, D.I. and Sweet, G.B. 1972. Flower initiation in temperate woody
plants. Hortic. Abstr. 42:9-24.
Kalmar, D. and Lahav, E., 1976. Water requirement of the avocado tree in the
Western Galilee (1968-1974). Div. Sc. Publ. Bet Dagan. Pamphlet No. 157.
Kohne, J. 2004. Flowering, fruit development and manipulation of yield in
avocado. p. 9. En: Memorias Segundo Seminario Internacional de Paltos.
Quillota, Chile.
Köhne, J.S. and Kremer-Kóhne, S. 1987. Vegetative growth and fruit
retention in avocado as affected by a new plant growth regulator (paclobutrazol).
South African Avocado Growers1 Assn. Yrbk. 10, 64-66.
Lahav, E., Zamet, D., 1999. Flowers, fruitlets and fruit drop in avocado trees.
In: Proc. IV World Avocado Congress, Mexico, pp. 95–100.
Laskowski, L. 2006. Características de la abscisión del fruto de naranja Citrus
sinensis (L.) Osbeck var. Salustiana. Bioagro 18(1): 25-30.
Leon, P. and Sheen, J. 2003. Sugar and hormone connections. Trends Plant
Sci 8 (3):110-6.
Lesley, J.W. and Bringhurst, R.S. 1951. Environmental conditions affecting
pollination of avocados. California Avocado Society Yearbook 1951, 169-173.
Reproductive Biology 129.
Liu, X., Robinson, P., Madore, M., Witney, G. and Arpaia, M. 1999a. Hass
avocado carbohydrate fluctuations. I. Growth and phenology. Journal of the
American Society for Horticultural Science 124: 671-675.
Liu, X., Robinson, P., Madore, M., Witney, G. and Arpaia, M. 1999b. Hass
avocado carbohydrate fluctuations. II. Fruit growth and ripening. Journal of the
American Society for Horticultural Science 124: 676-681.
Liu, X., Sievert, J., Arpaia, M. and Madore, M. 2002. Postulated
physiological roles of the seven-carbon sugars, mannoheptulosa and perseitol in
avocado. Journal of the American Society for Horticultural Science 127: 108-114.
Lomas j, Zamet Dn. 1994. Long term analysis and modelling of agroclimatic e
ects on national avocado yields in Israel. Agr Forest meteorol 71:315-336
References
125
Lovatt, C. 1990. Factors affecting fruit set/early fruit drop in avocado.
California Avocado Society Yearbook 74: 193-199.
Lovatt, C. 2006. liminating Alternate Bearing of the ‘Hass’ Avocado. pp.
127-142. In: Proceedings of the California Avocado Research Symposium.
University of California, Riverside, USA.
Luza, J.G.; Lizana, L.A. and Masson, L., 1990. Comparative lipids evolution
during cold storage of three avocado cultivars. Acta Horticulturae 269, Tropical
Fruit in International Trade.
Mcartney, S. J., and Li, S. H. 1998. Selective Inhibition of Flowering
onBraeburn'Apple Trees with Gibberellins. HortScience, 33(4), 699-700.
Monselise, S. P., Havely, A. H 1964. Chemical inhibition and promotion of
citrus flower bud induction. Proceedings of the American Society of the
Horticultural Science, Alexandria, v.84, p.141-6.
Muñoz-Fambuena, N., C. Mesejo, M.C. González-Mas, E. Primo-Millo, M.
Agustí and D.J. Iglesias. 2011. Fruit regulates seasonal expression of flowering
genes in alternate-bearing ‘Monacad’ mandarin. Annals of Botany, 108: 511-519.
Muñoz-Fambuena, N., Mesejo, C., González-Mas, M. C., Iglesias, D. J.,
Primo-Millo, E., and Agustí, M. 2012a. Gibberellic acid reduces flowering
intensity in sweet orange [Citrus sinensis (L.) Osbeck] by repressing CiFT gene
expression. Journal of Plant Growth Regulation, 31(4), 529-536.
Muñoz-Fambuena, N., Mesejo, C., González-Mas, M.C., Primo-Millo, E.,
Agustí, M. and Iglesias, D.J. 2012b. Fruit load modulates flowering-related gene
expression in buds of alternate bearing ‘Moncada’ mandarin. Annals of Botany,
110: 1109-1118.
Naylor, A.W., 1984. Functions of hormones at the organ level of organization.
In: Hormonal regulation of development II. Encyclopedia of plant physiology.
New series. vol. 10:172-218.
Nir, I., Goren, R., & Leshem, B. 1972. Effects of water stress, gibberellic acid
and 2-chloroethyltrimethylammoniumchloride (CCC) on flower differentiation
in'Eureka'lemon trees. J. Amer. Soc. Hort. Sci, 97, 774-8.
Núeñz-Elisea, R. and Davenport, T.L. 1991. Effect of low temperature
treatment on flowering of containerized ‘Tommy Atkins’ mango. HortScience 26,

References
126
751.
O'Neill, D. P., & Ross, J. J. 2002. Auxin regulation of the gibberellin pathway
in pea. Plant Physiology, 130(4), 1974-1982.
Olimpieri, I., Siligato, F., Caccia, R., Soressi, G. P., Mazzucato, A.,
Mariotti, L., and Ceccarelli, N. 2007. Tomato fruit set driven by pollination or
by the parthenocarpic fruit allele are mediated by transcriptionally regulated
gibberellin biosynthesis. Planta, 226(4), 877-888.
Oliveira, C.M. and Priestley, C.A.. 1988. Carbohydrate reserves in deciduous
fruit trees. Hort. Rev. 10:403–430.
Ozga, J. A., and Reinecke, D. M. 1999. Interaction of 4-chloroindole-3-acetic
acid and gibberellins in early pea fruit development. Plant growth regulation,
27(1), 33-38.
Ozga, J. A., and Reinecke, D. M. 2003. Hormonal interactions in fruit
development. Journal of Plant Growth Regulation, 22(1), 73-81.
Ozga, J. A., Reinecke, D. M., Ayele, B. T., Ngo, P., Nadeau, C., and
Wickramarathna, A. D. 2009. Developmental and hormonal regulation of
gibberellin biosynthesis and catabolism in pea fruit. Plant physiology, 150(1),
448-462.
Patrick, J.W. 1989. Asimílate partitioning in relation to crop productivity
HortScience. 23: 33-40.
Paz-Vega, S. 1997. Alternate bearing in the avocado (Persea americana Mill.).
California Avocado Society Yearbook 81: 117-148.
Reig, C., Farina, V., Volpe, G., Mesejo, C., Martinez-Fuentes, A., Barone,
F., Calabrese, F. and Agustí, M. 2011. Gibberellic acid and flower bud
development in loquat (Eriobotrya japonica Lindl.). Scientia Horticulturae 129,
27–31.
Richtmyer, N.K. 1970. The isolation of volemitol and other polyhydric
alcohols from avocado seeds. Carbohydrate Research 12: 135-138.
Rivas, F., Gravina, A. and Agustí, M. 2007. Girdling effects on fruit set and
quantum yield efficiency of PSII in two Citrus cultivars. Tree Physiol. 27, 527-
535.
Rocha-Arroyo, J., S. Salazar-García, A. Bárcenas-Ortega, J. González-
References
127
Durán y R. Medina-Torres. 2011. Crecimientos vegetativo y reproductivo del
aguacate ‘Hass’ en diversos climas de Michoacán, México. p 10. En: Memorias
VII World Avocado.
Rosales, J., G. Parodi and B. Carlini. 2003. Evaluación del ciclo fenológico
del palto (Persea americana Mill) cv. Hass para la zona de la irrigación Santa
Rosa, Perú. p. 311-316. En: Proceedings V World Avocado Congress. Granada -
Málaga, España.
Salazar-García, S., E.M. Lord and C.J. Lovatt. 1998. Inflorescence and
flower development of the ‘Hass’ avocado (Persea americana Mill.) during “on”
and “off” crop years. J. Amer. Soc. Hort. Sci. 123: 537-544.
Salazar-García, S., L. Cossio-Vargas, C. Lovatt, I. González-Duran and M.
Pérez- Barraza. 2006. Crop load affects vegetative growth flushes and shoot age
influences irreversible commitment to flowering of Hass avocado. HortScience
41(7): 1541- 1546.
Salazar-García, S., L. Cossio-Vargas, I. González-Durán y C. Lovatt. 2007.
Desarrollo floral del aguacate ‘Hass’ en clima semicálido. Parte I. Influencia de la
carga de fruto y edad de los brotes. Revista Chapingo Serie Horticultura. 13(1):
87-92.
Salazar-García, S., Lord, E.M. and Lovatt, C.J. 1999. Inflorescence
development of the ‘Hass’ avocado: commitment to flowering. J. Amer. Soc.Hort.
Sci. 124:478-482.
Salazar-García, S.; Lovatt, C. J. 2000. Use of GA3 to manipulate flowering
and yield of ‘Hass’ avocado. J. Amer. Soc. Hort. Sci. 125: 25-30.
Scholefield, P.B., Sedgley M. and Alexander, D.McE., 1985. Carbohydrate
cycling in relation to shoot growth, floral initiation and development and yield in
theavocado. Scientia Horticulturae 25, 99-110.
Schroeder, C.A. 1994. The avocado inflorescence. California Avocado Society
Yearbook 1944, 39-40.
Scora R, Wolstenholme B, Lavi u. 2007. El palto, botánica, producción y usos
Taxonomía y botánica. pp. 25-45. En: Whiley A, Scha er B, Wolstenholme B,
editores. Valparaíso, Chile: CABI; ediciones universitarias de Valparaíso.
Scora, R., B. Wolstenholme and U. Lavi. 2002. Chapter 2. Taxonomy and
References
128
Botany. p. 25- 45. En: Whiley, A., B. Schaffer y B. Wolstenholme (ed.). The
avocado, botany, production and uses. First Edition. CABI Publishing. Londres,
U.K.
Sedgley, M. 1987. Flowering, pollination and fruit-set of avocado. S. Afr.
Avocado Growers’ Assoc. Yrbk. 10:42-43.
Sedgley, M. and Alexander, D.M. 1983. Avocado breeding research in
Australia. Calif. Avocado Soc. Yrbk. 67:129-135.
Sedgley, M. and C.M. Annells. 1981. Flowering and fruit-set response to
temperatures during flowering on oral cycle and pollen tube growth in nine
avocado cultivars. Sci. Hort. 18:207-213.
Seo, Mitsunori, and Tomokazu Koshiba 2011. "Transport of ABA from the
site of biosynthesis to the site of action." Journal of plant research 124.4: 501-507.
Serrani, J. C., Ruiz‐ Rivero, O., Fos, M., & García‐ Martínez, J. L. 2008.
Auxin‐ induced fruit‐ set in tomato is mediated in part by gibberellins. The Plant
Journal, 56(6), 922-934.
Southwick, S.M. and Glozer, K. 2000. Reducing flowering with gibberellin to
increase fruit size in stone fruit trees: applications and implications in fruit
production. HortTchnology. 10, 744-751.
Stout, A.B. 1923. A study in cross-pollination of avocado in southern
California. Calif. Avoc. Association Ann. Report 8:29-45.
Tesfayac, S.Z., Berling, I., Bower J.P And Lovatt,C. 2012. The quest for the
function of Hass avocado carbohydrates: cleus from fruit and seed development as
well as seed germination. Australian Journal of Botany, 60, 79-86.
Thorp, T. G., Aspinall, D. and Sedgley, M. 1993. Influence of shoot age on
floral development and early fruit set in avocado (Persea americana Mill.) cv.
'Hass'. J.Hort. Sci. 68:645-651.
Turnbull, C.G., Anderson, K.L. and Winston, E.C. 1996. Influence of
gibberellin treatment on flowering and fruiting patterns in mango. Austr. J. Exp.
Agric. 36, 603-611.
Velásquez, J. 2006. Identificación del aguacate como un rubro importante de
grandes oportunidades comerciales, según los acuerdos de integración, los nuevos
tratados comerciales y el comercio mundial globalizado. Secretaría de

References
129
Productividad y Competitividad. Gobernación de Antioquia. Medellín,
Colombia.103 p.
Whiley A.W., Schaffer, B. and Lara, S.P. 1992. Carbon dioxide exchange of
developing avocado (Persea americana Mill.) fruit. Tree Physiology 11, 85-94.
Whiley, A., K. Chapman and J. Saranah. 1988. Water loss by floral
structures of avocado (Persea americana cv. Fuerte) during flowering. Aust. J.
Agric. Res. 39(3): 457-467.
Whiley, A.W. and Schaffer, B. 1994. Avocado. In: Schaffer, B. and Anderson,
P.C (eds) Handbook of Environmental Physiology of Fruit Crops, Vol. II, Sub-
Tropical and Tropical Crops. CRC Press, Boca Rton, Florida, pp. 3-35.
Whiley, A.W., Schaffer, B. Y Wolstenholme, B.N. 2007. El Palto. Botánica,
producción y usos. Ediciones Universitarias de Valparaíso. Chile.
Wolstenholme, B., A. Whiley and J. Saranah. 1990. Manipulating vegetative:
reproductive growth in avocado (Persea americana Mill.) with Paclobutrazol
foliar sprays. Scientia HorticuIturae 41: 315-327.
Wolstenholme, B.andy A. Whiley. 1995. Strategies for maximising avocado
productivity: An overview. p 61-70. In: Proceedings III World Avocado
Congress. Tel Aviv, Israel.
Wolstenholme, B.N. 1990. Resource allocation and vegetative reproductive
competition: opportunities for manipulation in evergreen fruit trees. Acta
Horticulturae 275, 451-459.
Wright, C.J., 1989. Interactions between vegetative and reproductive growth.
In: Manipulation of fruiting ed.: Wright, C.J., Butterworths, London, Boston,
Singapore, Toronto, Wellington, 15-27.
Zamet. 1999. Flower, fruitlets and fruit drop in avocado trees. Revista
Chapingo Serie Hort. 5:95-100.
Ziv, D., Zviran, T., Zezak, O., Samach, A., & Irihimovitch, V. 2014.
Expression Profiling of FLOWERING LOCUS T-Like Gene in Alternate Bearing
‘Hass' Avocado Trees Suggests a Role for PaFT in Avocado Flower Induction.
PloS one, 9(10), e110613.