Nutrition Support Ahmed Mayet, Pharm.D Associate Professor King Saud University.
118
Nutrition Support Nutrition Support Ahmed Mayet, Pharm.D Ahmed Mayet, Pharm.D Associate Professor Associate Professor King Saud University King Saud University
-
Upload
chloe-jemimah-bond -
Category
Documents
-
view
216 -
download
1
Transcript of Nutrition Support Ahmed Mayet, Pharm.D Associate Professor King Saud University.

Nutrition SupportNutrition Support
Ahmed Mayet, Pharm.DAhmed Mayet, Pharm.D
Associate ProfessorAssociate Professor
King Saud UniversityKing Saud University


QuestionsQuestions
What medical history support that What medical history support that the patient is “at risk” of the patient is “at risk” of malnutrition?malnutrition?
What physical findings support What physical findings support that the patient is “at risk” of that the patient is “at risk” of malnutrition?malnutrition?

NutritionNutrition
Nutrition—provides with all basic Nutrition—provides with all basic nutrients and energy required for nutrients and energy required for maintaining or restoring all vital maintaining or restoring all vital body functions from carbohydrate body functions from carbohydrate and fat and for building up body and fat and for building up body mass from amino acid.mass from amino acid.
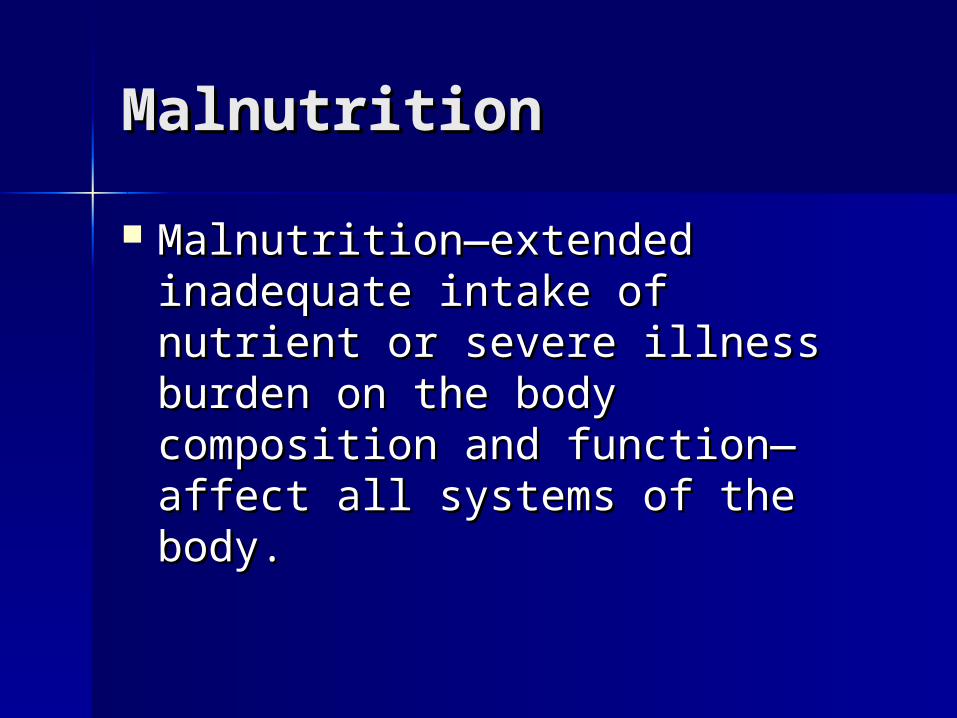
MalnutritionMalnutrition
Malnutrition—extended Malnutrition—extended inadequate intake of nutrient or inadequate intake of nutrient or severe illness burden on the body severe illness burden on the body composition and function—affect composition and function—affect all systems of the body.all systems of the body.
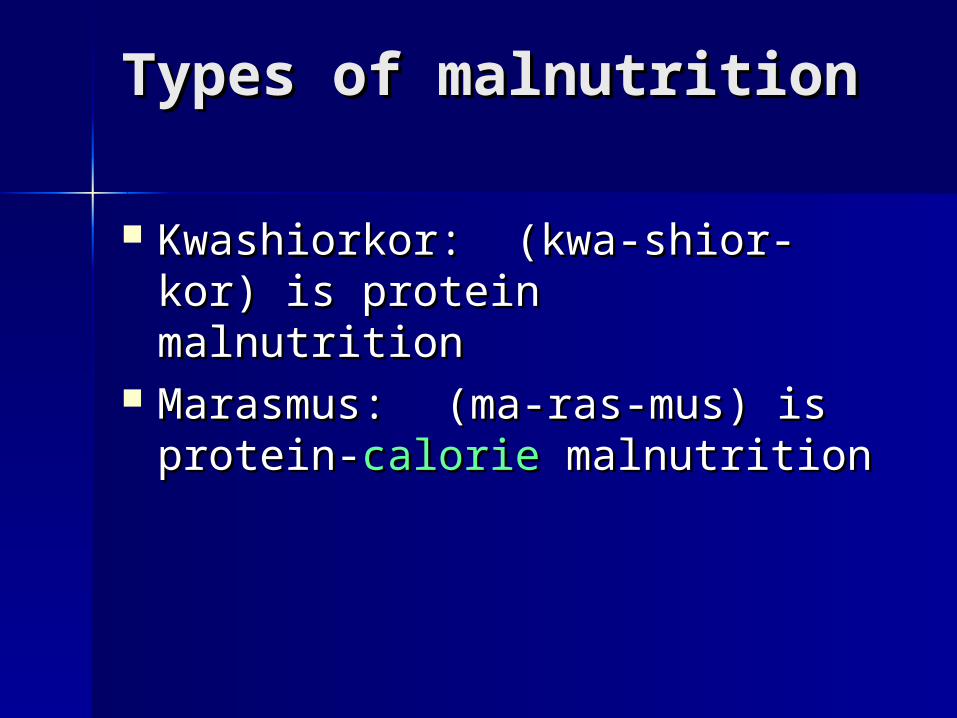
Types of malnutritionTypes of malnutrition
Kwashiorkor: (kwa-shior-kor) is Kwashiorkor: (kwa-shior-kor) is protein malnutritionprotein malnutrition
Marasmus: Marasmus: (ma-ras-mus) is (ma-ras-mus) is protein-protein-caloriecalorie malnutrition malnutrition

KwashiorkorKwashiorkor Protein malnutrition - caused by Protein malnutrition - caused by
inadequate inadequate proteinprotein intake in the intake in the presence of fair to good calories presence of fair to good calories intake in combination with the stress intake in combination with the stress responseresponse
Common causes - chronic diarrhea, Common causes - chronic diarrhea, chronic kidney disease, infection, chronic kidney disease, infection, trauma , burns, hemorrhage, liver trauma , burns, hemorrhage, liver cirrhosis and critical illness cirrhosis and critical illness

Clinical ManifestationsClinical Manifestations
Marked hypoalbuminemiaMarked hypoalbuminemia AnemiaAnemia EdemaEdema Muscle atrophyMuscle atrophy Delayed wound healingDelayed wound healing Impaired immune functionImpaired immune function
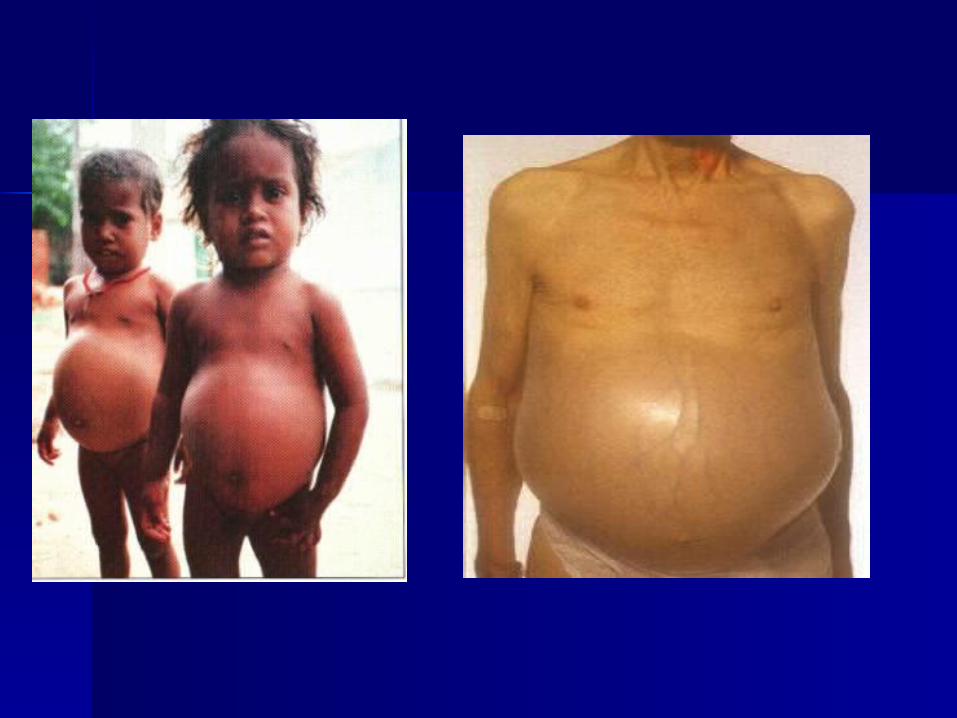

MarasmusMarasmus The patient with severe The patient with severe proteinprotein--
caloriecalorie malnutrition characterized malnutrition characterized by calories deficiency by calories deficiency
Common severe burns, injuries, Common severe burns, injuries, systemic infections, cancer etc systemic infections, cancer etc oror conditions where patient does not conditions where patient does not eat like anorexia nervosa and eat like anorexia nervosa and starvationstarvation

MarasmusMarasmus The patient with severe The patient with severe
malnutrition characterized by malnutrition characterized by calories deficiency calories deficiency
Common severe burns, injuries, Common severe burns, injuries, systemic infections, cancer etc systemic infections, cancer etc oror conditions where patient does not conditions where patient does not eat like anorexia nervosa and eat like anorexia nervosa and starvationstarvation
proteinprotein--caloriecalorie
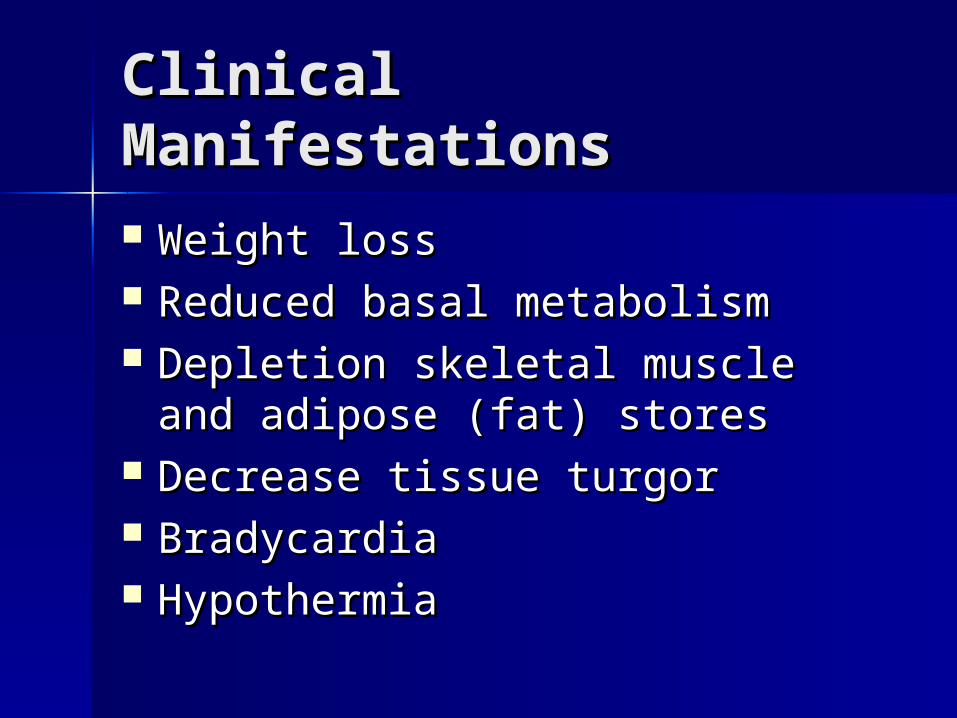
Clinical ManifestationsClinical Manifestations
Weight lossWeight loss Reduced basal metabolismReduced basal metabolism Depletion skeletal muscle and Depletion skeletal muscle and
adipose (fat) storesadipose (fat) stores Decrease tissue turgorDecrease tissue turgor BradycardiaBradycardia HypothermiaHypothermia


Risk factors for malnutritionRisk factors for malnutrition
Medical causesMedical causes Psychological and social causesPsychological and social causes

Medical causesMedical causes((Risk factors for malnutrition)Risk factors for malnutrition)
Recent surgery or traumaRecent surgery or trauma SepsisSepsis Chronic illnessChronic illness Gastrointestinal disordersGastrointestinal disorders Anorexia, other eating disordersAnorexia, other eating disorders DysphagiaDysphagia Recurrent nausea, vomiting, or diarrheaRecurrent nausea, vomiting, or diarrhea PancreatitisPancreatitis Inflammatory bowel diseaseInflammatory bowel disease Gastrointestinal fistulasGastrointestinal fistulas
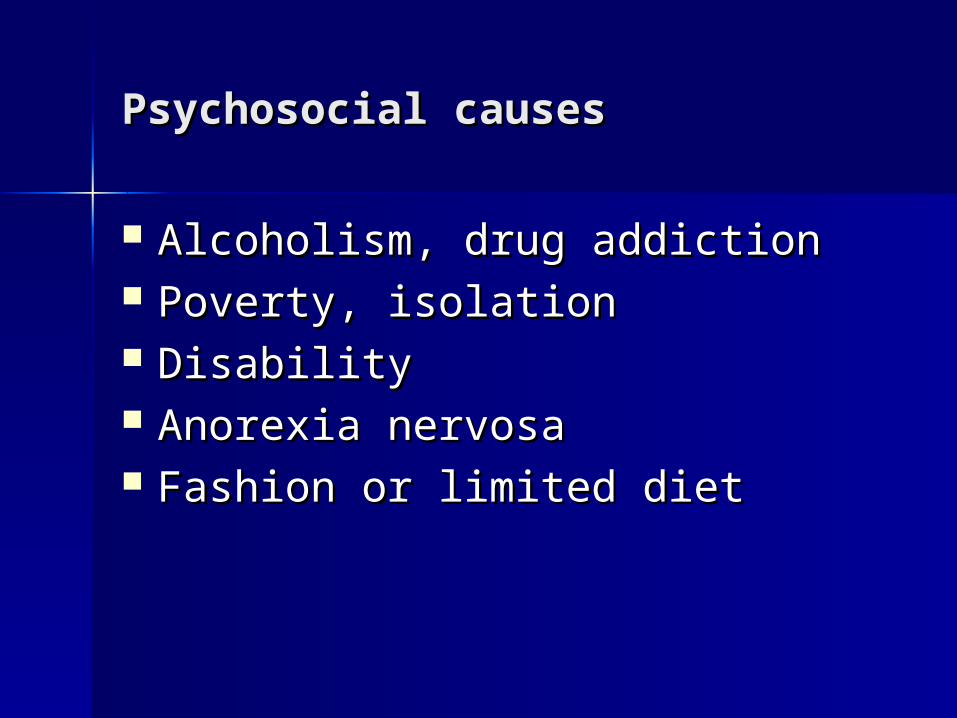
Psychosocial causesPsychosocial causes
Alcoholism, drug addictionAlcoholism, drug addiction Poverty, isolationPoverty, isolation DisabilityDisability Anorexia nervosaAnorexia nervosa Fashion or limited dietFashion or limited diet

Consequences of Consequences of MalnutritionMalnutrition
Malnutrition places patients at a Malnutrition places patients at a greatly increased risk for morbidity greatly increased risk for morbidity and mortalityand mortality
Longer recovery period from Longer recovery period from illnessesillnesses
Impaired host defensesImpaired host defenses Impaired wound healingImpaired wound healing Impaired GI tract functionImpaired GI tract function

Cont:Cont: Muscle atrophyMuscle atrophy Impaired cardiac functionImpaired cardiac function Impaired respiratory functionImpaired respiratory function Reduced renal functionReduced renal function mental dysfunctionmental dysfunction Delayed bone callus formationDelayed bone callus formation Atrophic skinAtrophic skin

Results: Of the 5051 study patients, 32.6% were defined as ‘at-risk’ At-risk’ patients had more complications, higher mortality and longer lengths of stay than ‘not at-risk’ patients.
International, multicentre study to implement nutritional risk screening and evaluate clinical
outcome
Sorensen J et al ClinicalNutrition(2008)27,340 349
“Not at risk” = good nutrition status
“At risk” = poor nutrition status

ClinicalNutrition(2008)27,340e349
International,multicentre study to implement nutritional risk screening and evaluate clinical outcome

Metabolic RateMetabolic Rate
60
80
100
120
140
160
180
0 10 20 30 40 50
Days
Resting m
eta
bolism
(%
of norm
al) Major burn Sepsis Trauma Partial starvation Total starvation
Long CL, et al. JPEN 1979;3:452-6
Normal range

Protein CatabolismProtein Catabolism
0
5
10
15
20
25
30
0 10 20 30 40
Days
Nitro
gen e
xcre
tion
Major burn Trauma Sepsis Partial starvation Total starvation
Long CL. Contemp Surg 1980;16:29-42
Normal range

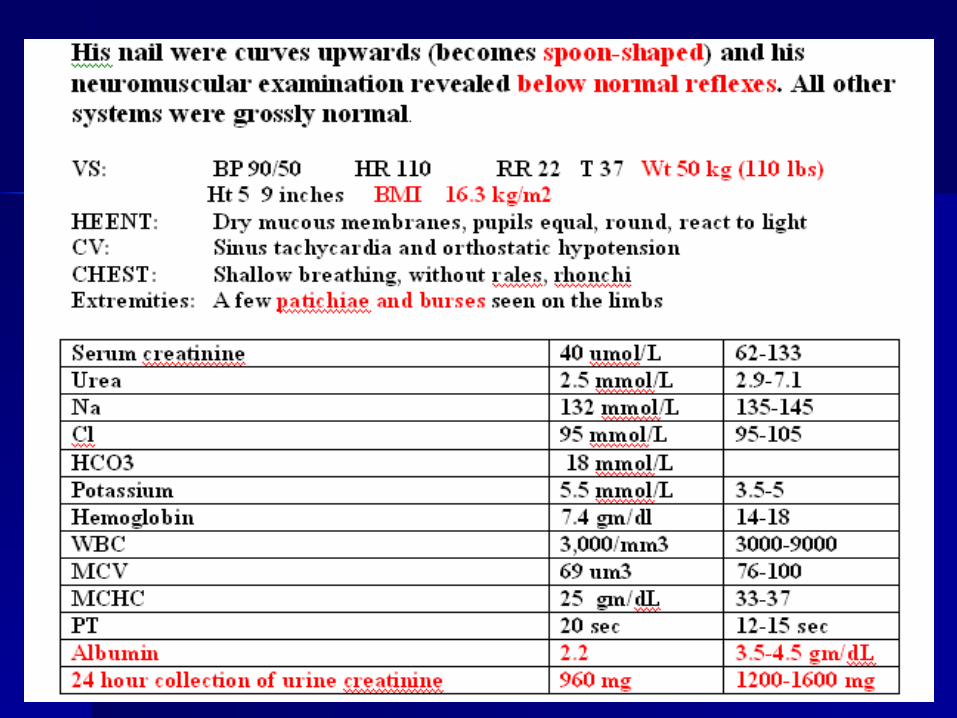
Answer Answer (medical history)(medical history)
What medical history support that What medical history support that the patient is “at risk” of the patient is “at risk” of malnutrition?malnutrition?
NauseaNausea Abdominal painAbdominal pain DiarrheaDiarrhea Loss of appetiteLoss of appetite Weight lossWeight loss

Answer Answer (physical finding)(physical finding)
What physical findings support that the patient is “at What physical findings support that the patient is “at risk” of malnutrition?risk” of malnutrition?
PalePale LethargicLethargic Muscle wastingMuscle wasting cachecxia cachecxia EdematousEdematous HypotensiveHypotensive TachycardiaTachycardia Burses and patichiae on the limbsBurses and patichiae on the limbs
Cont;


QuestionQuestion
What biochemical, What biochemical, anthropometric, indirect anthropometric, indirect calorimetric, and other testes are calorimetric, and other testes are suggesting that your patient is suggesting that your patient is malnourish?malnourish?

Cont:Cont:
The initial assessment of The initial assessment of nutritional status requires a nutritional status requires a careful careful
History History Physical examinationPhysical examination Laboratory and other testsLaboratory and other tests

Laboratory and other Laboratory and other teststests
WeightWeight BMIBMI Fat storage Fat storage Somatic and visceral proteinSomatic and visceral protein
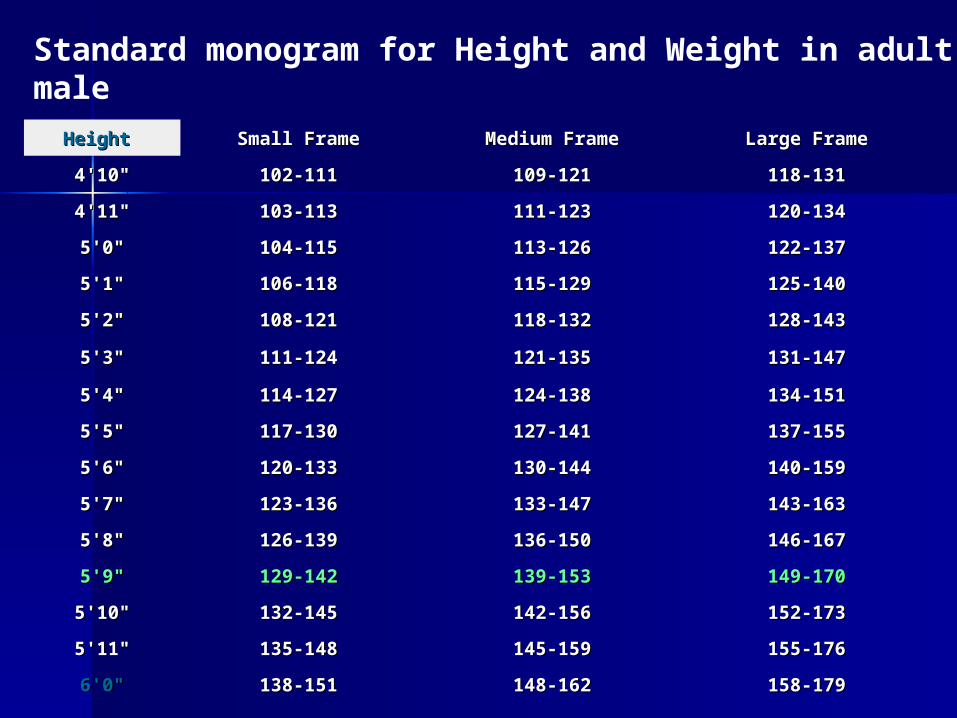
Height Height Small FrameSmall Frame Medium FrameMedium Frame Large FrameLarge Frame
4'10"4'10" 102-111102-111 109-121109-121 118-131118-131
4'11"4'11" 103-113103-113 111-123111-123 120-134120-134
5'0"5'0" 104-115104-115 113-126113-126 122-137122-137
5'1"5'1" 106-118106-118 115-129115-129 125-140125-140
5'2"5'2" 108-121108-121 118-132118-132 128-143128-143
5'3"5'3" 111-124111-124 121-135121-135 131-147131-147
5'4"5'4" 114-127114-127 124-138124-138 134-151134-151
5'5"5'5" 117-130117-130 127-141127-141 137-155137-155
5'6"5'6" 120-133120-133 130-144130-144 140-159140-159
5'7"5'7" 123-136123-136 133-147133-147 143-163143-163
5'8"5'8" 126-139126-139 136-150136-150 146-167146-167
5'9"5'9" 129-142129-142 139-153139-153 149-170149-170
5'10"5'10" 132-145132-145 142-156142-156 152-173152-173
5'11"5'11" 135-148135-148 145-159145-159 155-176155-176
6'0"6'0" 138-151138-151 148-162148-162 158-179158-179
Standard monogram for Height and Weight in adult-male

Percent weight lossPercent weight loss
129 lbs – 129 lbs – 110 lbs110 lbs = 19 lbs = 19 lbs
19/129 x 100 = 19/129 x 100 = 15%15%
139 lbs – 139 lbs – 110 lbs110 lbs = 29 lbs = 29 lbs
29/139 x 100 = 29/139 x 100 = 20%20%
Small frame
Medium frame
50kg x 2.2 = 110 50kg x 2.2 = 110 lbslbs

TimeTime Significant Weight Significant Weight Loss (%)Loss (%)
Severe Weight Loss Severe Weight Loss (%)(%)
1 week 1 week 1-2 1-2 >2>2
1 month 1 month 55 >5>5
3 months3 months 7.57.5 >7.5>7.5
6 months 6 months 1010 >10>10
Severe weight lost

Laboratory and other Laboratory and other teststests
WeightWeight BMIBMI Fat storage Fat storage Somatic and visceral proteinSomatic and visceral protein

Classification BMI (kg/m2) Obesity Class
Underweight <18.5
Normal 18.5-24.9
Overweight 25.0-29.9
Obesity 30.0-34.9 I
Moderate obesity 35.0-39.9 II
Extreme obesity >40.0 III
Average Body Mass Index (BMI) for Adult
Our patient BMI = 16.3 kg/m2

Laboratory and other Laboratory and other teststests
WeightWeight BMIBMI Fat storageFat storage Somatic and visceral proteinSomatic and visceral protein

FatFat
Assessment of body fat Assessment of body fat – Triceps skinfold thickness (TSF)Triceps skinfold thickness (TSF)– Waist-hip circumference ratioWaist-hip circumference ratio– Waist circumferenceWaist circumference– Limb fat areaLimb fat area– Compare the patient TSF to standard Compare the patient TSF to standard
monogrammonogram

Laboratory and other Laboratory and other teststests
WeightWeight BMIBMI Fat storage Fat storage Somatic and visceral proteinSomatic and visceral protein

Protein Protein (Somatic Protein)(Somatic Protein)
Assessment of the fat-free muscle Assessment of the fat-free muscle mass (mass (Somatic ProteinSomatic Protein))Mid-upper-arm circumferenceMid-upper-arm circumference (MAC)(MAC)Mid-upper-arm muscle Mid-upper-arm muscle circumference circumference Mid-upper-arm muscle area Mid-upper-arm muscle area
Compare the patient MAC to Compare the patient MAC to standard monogram standard monogram

Protein Protein (visceral protein)(visceral protein)
Assessment of Assessment of visceral protein visceral protein depletiondepletion
Serum albumin <3.5 g/dL Serum albumin <3.5 g/dL Serum transferrin <200 mg/dL Serum transferrin <200 mg/dL Serum cholesterol <160 mg/dL Serum cholesterol <160 mg/dL Serum prealbumin <15 mg/mL Serum prealbumin <15 mg/mL Creatinine Height Index (CHI) <75%Creatinine Height Index (CHI) <75%
Cont;
Our patient has albumin of Our patient has albumin of 2.2 2.2 g/dlg/dl
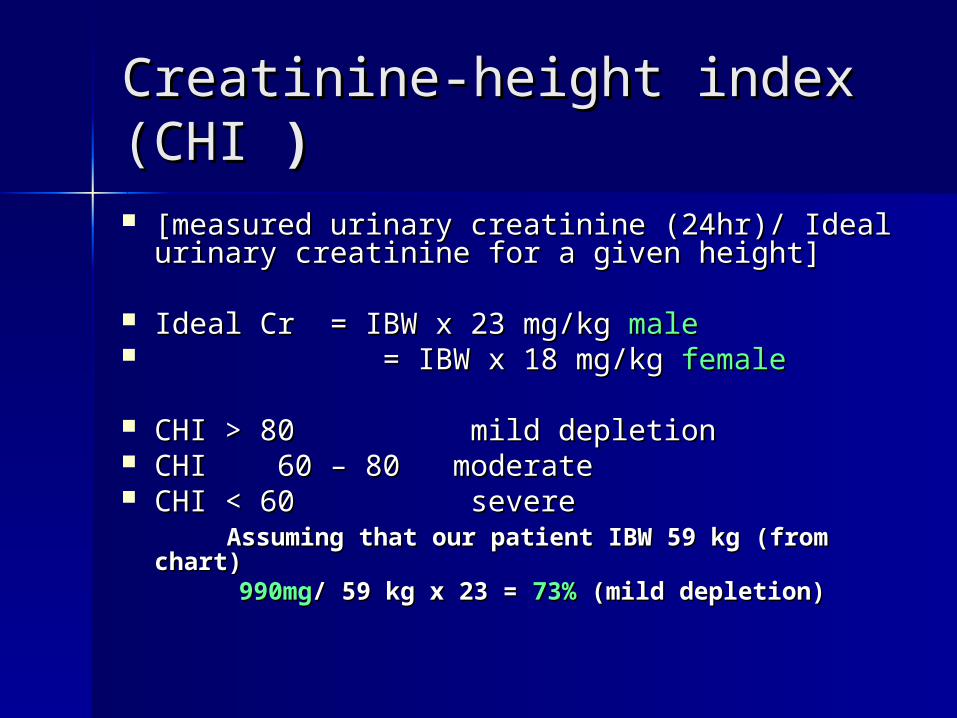
Creatinine-height index (CHICreatinine-height index (CHI )) [measured urinary creatinine (24hr)/ Ideal [measured urinary creatinine (24hr)/ Ideal
urinary creatinine for a given height] urinary creatinine for a given height]
Ideal Cr = IBW x 23 mg/kg Ideal Cr = IBW x 23 mg/kg malemale = IBW x 18 mg/kg = IBW x 18 mg/kg femalefemale
CHI > 80 mild depletionCHI > 80 mild depletion CHI 60 – 80 moderateCHI 60 – 80 moderate CHI < 60 severeCHI < 60 severe Assuming that our patient IBW 59 kg (from Assuming that our patient IBW 59 kg (from
chart)chart) 990mg990mg/ 59 kg x 23 = / 59 kg x 23 = 73% 73% (mild depletion)(mild depletion)

Vitamins deficiencyVitamins deficiency
Vitamin Bs (B1,B2, B6, B 9, B12, )Vitamin Bs (B1,B2, B6, B 9, B12, ) Vitamin CVitamin C Vitamin AVitamin A Vitamin D Vitamin D Vitamin K Vitamin K

Trace Minerals deficiencyTrace Minerals deficiency
Zinc Zinc CopperCopper ChromiumChromium ManganeseManganese SeleniumSelenium
IronIron

-- Clinical Sign or SymptomClinical Sign or Symptom NutrientNutrient
GeneralGeneral Wasted, thin Wasted, thin Calorie Calorie
-- Loss of appetiteLoss of appetite Protein-calorieProtein-calorie
SkinSkin Eczematous scalingEczematous scaling ZincZinc
--
-- Follicular hyperkeratosisFollicular hyperkeratosis Vitamin AVitamin A
--Flaking dermatitisFlaking dermatitis Protein-calorie, niacin, Protein-calorie, niacin,
riboflavin, zincriboflavin, zinc
--
-- Pigmentation changesPigmentation changes Protein-calorie, niacinProtein-calorie, niacin
-- Scrotal dermatosisScrotal dermatosis RiboflavinRiboflavin
*Our patient
*Pallor*Pallor Folate, iron, Folate, iron, vitamin B12, vitamin B12, coppercopper
*Bruising*Bruising Vitamin C, vitamin Vitamin C, vitamin KK

NeckNeck GoiterGoiter IodineIodine
--Parotid Parotid enlargementenlargement ProteinProtein
Thorax Thorax Thoracic rosaryThoracic rosary Vitamin DVitamin D
AbdomenAbdomen DiarrheaDiarrhea Niacin, folate, vitamin BNiacin, folate, vitamin B1212
-- DistentionDistention Protein-calorieProtein-calorie
-- HepatomegalyHepatomegaly Protein-calorieProtein-calorie
ExtremitiesExtremities
-- Bone tendernessBone tenderness Vitamin DVitamin D
-- Muscle wastingMuscle wasting Protein, vitamin D, seleniumProtein, vitamin D, selenium
--
-- AtaxiaAtaxia Vitamin BVitamin B1212
Nails Nails
-- TransverseTransverse ProteinProtein
*Edema*Edema Protein, thiamineProtein, thiamine
*Hyporeflexi*Hyporeflexiaa
ThiamineThiamine
*Spooning*Spooning IronIron

Estimating Estimating Energy/Calorie Energy/Calorie

BEEBEE
Basal Metabolic Rate (BMR) or Basal Metabolic Rate (BMR) or Basal Energy Expenditure (Basal Energy Expenditure (BEEBEE) ) accounts for the largest portion of accounts for the largest portion of total daily energy requirements total daily energy requirements

Total Energy Total Energy ExpenditureExpenditure
TEE (kcal/day) = BEE x TEE (kcal/day) = BEE x stress/activity factorstress/activity factor

BEEBEE
The Harris-Benedict equation is a The Harris-Benedict equation is a mathematical formula used to mathematical formula used to calculate calculate BEEBEE

Harris–Benedict Harris–Benedict EquationsEquations Energy calculationEnergy calculation
MaleMale BEE = 66 + (13.7 x actual wt in kg) + BEE = 66 + (13.7 x actual wt in kg) +
(5x ht in cm) – (6.8 x age in y) (5x ht in cm) – (6.8 x age in y)
FemaleFemale BEE = 655 + (9.6 x actual wt in kg) BEE = 655 + (9.6 x actual wt in kg)
+ (1.7 x ht in cm) – (4.7 x age in y) + (1.7 x ht in cm) – (4.7 x age in y)

A correlation factor that A correlation factor that estimates the extent of hyper-estimates the extent of hyper-
metabolismmetabolism 1.15 for bedridden patients 1.15 for bedridden patients 1.10 for patients on ventilator support 1.10 for patients on ventilator support 1.25 for normal patients 1.25 for normal patients The stress factors are:The stress factors are: 1.3 for low stress 1.3 for low stress 1.5 for moderate stress 1.5 for moderate stress 2.0 for severe stress2.0 for severe stress 1.9-2.1 for burn1.9-2.1 for burn

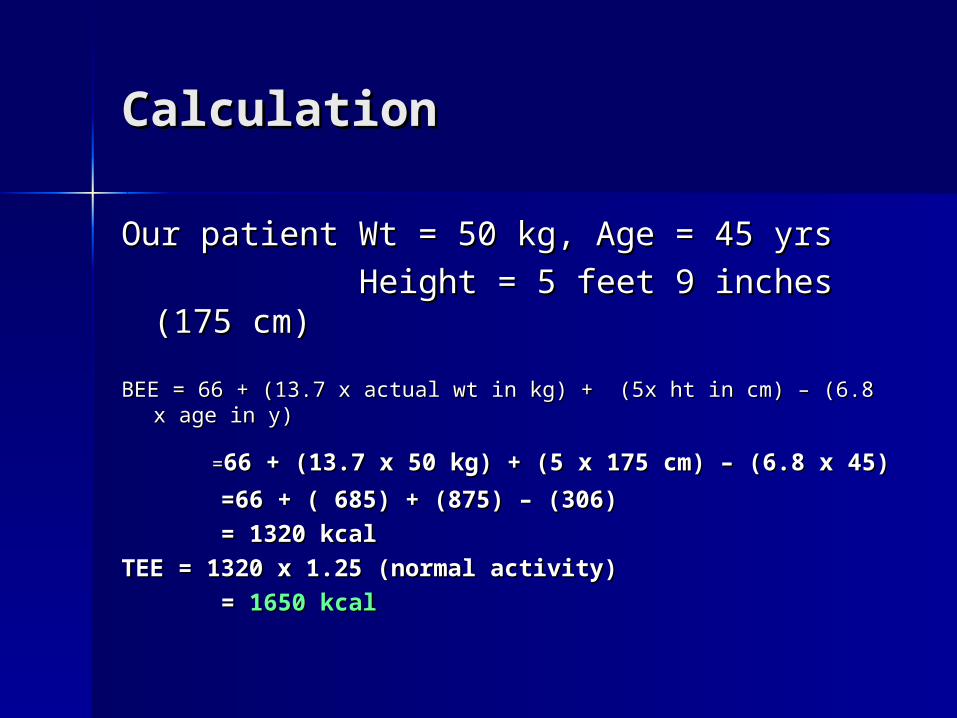
CalculationCalculation
Our patient Wt = 50 kg, Age = 45 yrsOur patient Wt = 50 kg, Age = 45 yrs
Height = 5 feet 9 inches (175 cm)Height = 5 feet 9 inches (175 cm)
BEE = 66 + (13.7 x actual wt in kg) + (5x ht in cm) – (6.8 x age BEE = 66 + (13.7 x actual wt in kg) + (5x ht in cm) – (6.8 x age in y)in y)
==66 + (13.7 x 50 kg) + (5 x 175 cm) – (6.8 x 45)66 + (13.7 x 50 kg) + (5 x 175 cm) – (6.8 x 45)
=66 + ( 685) + (875) – (306)=66 + ( 685) + (875) – (306)
= 1320 kcal= 1320 kcal
TEE = 1320 x 1.25 (normal activity)TEE = 1320 x 1.25 (normal activity)
= = 1650 kcal1650 kcal

Calorie sourcesCalorie sources

CaloriesCalories
60 to 80% of the caloric 60 to 80% of the caloric requirement should be provided requirement should be provided as as glucoseglucose, the remainder 20% to , the remainder 20% to 40% as fat 40% as fat
To include protein calories in the To include protein calories in the provision of energy is provision of energy is controversial controversial

Fluid RequirementsFluid Requirements

FluidFluid
The average adult requires The average adult requires approximately 35-45 ml/kg/dapproximately 35-45 ml/kg/d
NRC* recommends 1 to 2 ml of NRC* recommends 1 to 2 ml of water for each kcal of energy water for each kcal of energy expenditureexpenditure
*NRC= National research council
FluidFluid
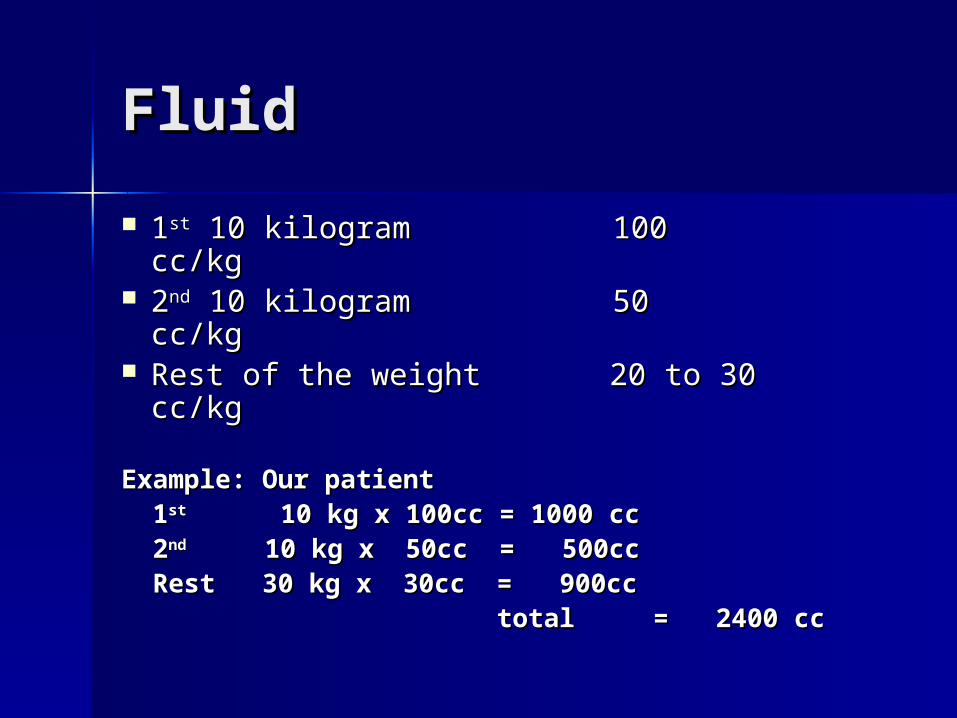
11stst 10 kilogram 100 cc/kg 10 kilogram 100 cc/kg 22ndnd 10 kilogram 50 cc/kg 10 kilogram 50 cc/kg Rest of the weight 20 to 30 cc/kgRest of the weight 20 to 30 cc/kg
Example: Our patientExample: Our patient 11stst 10 kg x 100cc = 1000 cc 10 kg x 100cc = 1000 cc 22ndnd 10 kg x 50cc = 500cc 10 kg x 50cc = 500cc Rest 30 kg x 30cc = 900ccRest 30 kg x 30cc = 900cc total = 2400 cctotal = 2400 cc

FluidFluid
Fluid needs are altered by the Fluid needs are altered by the patient's functional cardiac, patient's functional cardiac, hepatic, pulmonary, and renal hepatic, pulmonary, and renal status status
Fluid needs increase with fever, Fluid needs increase with fever, diarrhea, hemorrhage, surgical diarrhea, hemorrhage, surgical drains, and loss of skin integrity drains, and loss of skin integrity like burns, open wounds like burns, open wounds

Protein NeedsProtein Needs

ProteinProtein
The average adult requires about The average adult requires about 1 to 1.2 gm/kg 0r average of 70-1 to 1.2 gm/kg 0r average of 70-80 grams of protein per day80 grams of protein per day

ProteinProtein
The initial protein goals are The initial protein goals are estimated according to the estimated according to the following general guidelinesfollowing general guidelines

ProteinProtein
Stress or activity level Initial Stress or activity level Initial protein requirement (g/kg/day)protein requirement (g/kg/day)
Baseline 1.4 g/kg/dayBaseline 1.4 g/kg/day Little stress 1.6 g/kg/dayLittle stress 1.6 g/kg/day Mild stress 1.8 g/kg/dayMild stress 1.8 g/kg/day Moderate stress 2.0 g/kg/dayModerate stress 2.0 g/kg/day Severe stress 2.2 g/kg/daySevere stress 2.2 g/kg/day

Nitrogen Balance Nitrogen Balance CalculationCalculation

Nitrogen Balance (NB) Nitrogen Balance (NB) CalculationCalculation
NB is an important calculation for NB is an important calculation for assessing nutritional response assessing nutritional response
NB is used to evaluate the NB is used to evaluate the adequacy of protein intake as well adequacy of protein intake as well as to estimate current protein as to estimate current protein requirementsrequirements

CalculationsCalculations
NB = N intake – N losses NB = N intake – N losses N intake = Protein intake (g/day) / N intake = Protein intake (g/day) /
6.25gm 6.25gm N losses = UUN (g/day) + 4g* N losses = UUN (g/day) + 4g* UUN is determined from a 24 hour UUN is determined from a 24 hour
urine collection urine collection *4g is a "fudge factor" to account for *4g is a "fudge factor" to account for
miscellaneous nitrogen lossesmiscellaneous nitrogen losses

Cont:Cont:
Positive NB indicates an anabolic state, Positive NB indicates an anabolic state, with a net gain in body proteinwith a net gain in body protein
Negative NB indicates a catabolic Negative NB indicates a catabolic state, with a net loss of protein state, with a net loss of protein
With adequate feeding With adequate feeding NB 0 –5 g/day indicates moderate NB 0 –5 g/day indicates moderate
stressstress NB > –5 g/day indicates severe stressNB > –5 g/day indicates severe stress

Routes of Nutrition Routes of Nutrition SupportSupport

The nutritional needs of patients The nutritional needs of patients are met through either are met through either parenteralparenteral or or enteralenteral delivery route delivery route
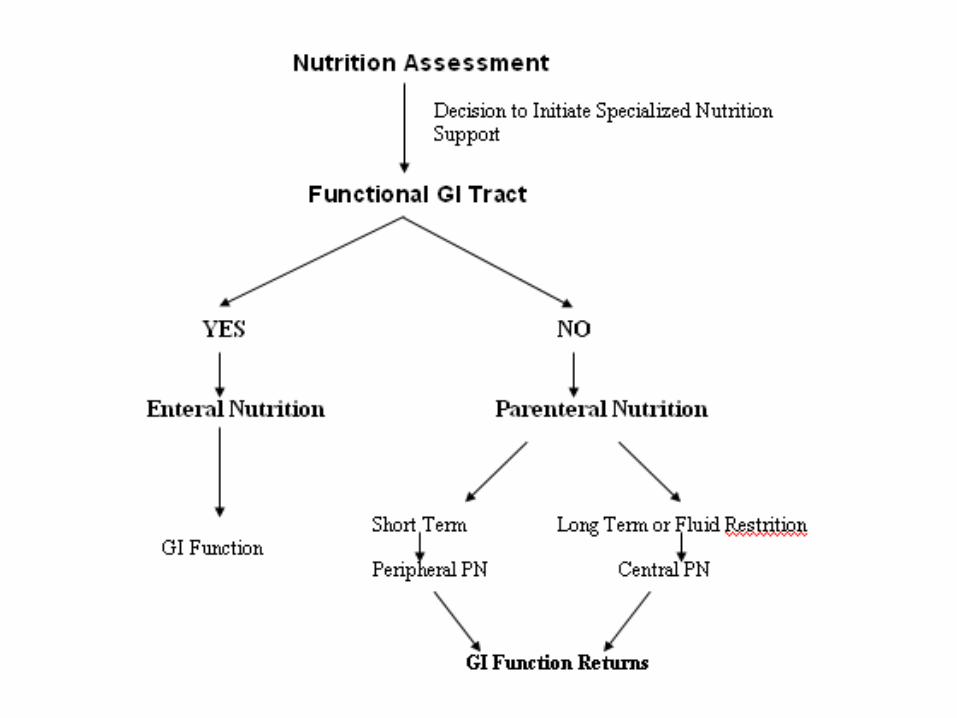

Enteral NutritionEnteral Nutrition

Enteral Enteral
The gastrointestinal tract is always The gastrointestinal tract is always the preferred route of support the preferred route of support (Physiologic)(Physiologic)
““If the gut works, use it”If the gut works, use it” EN is safer, more cost effective, and EN is safer, more cost effective, and
more physiologic that PNmore physiologic that PN

Potential benefits of EN over Potential benefits of EN over
PNPN Nutrients are metabolized and Nutrients are metabolized and
utilized more effectively via the utilized more effectively via the enteral than parenteral routeenteral than parenteral route
Gut and liver process EN before Gut and liver process EN before their release into systemic their release into systemic circulation circulation
Gut and liver help maintain the Gut and liver help maintain the homeostasis of the AA pool and homeostasis of the AA pool and skeletal muscle tissueskeletal muscle tissue

EN EN (Immunologic)(Immunologic)
Gut integrity is maintained by Gut integrity is maintained by enteral feeding and prevent the enteral feeding and prevent the bacterial translocation from the bacterial translocation from the gut and minimize risk of gut gut and minimize risk of gut related sepsisrelated sepsis

SafetySafety
Catheter sepsis Catheter sepsis Pneumothorax Pneumothorax Catheter embolism Catheter embolism Arterial lacerationArterial laceration

Cost (EN)Cost (EN)
Cost of EN formula is less than PNCost of EN formula is less than PN Less labor intensive Less labor intensive
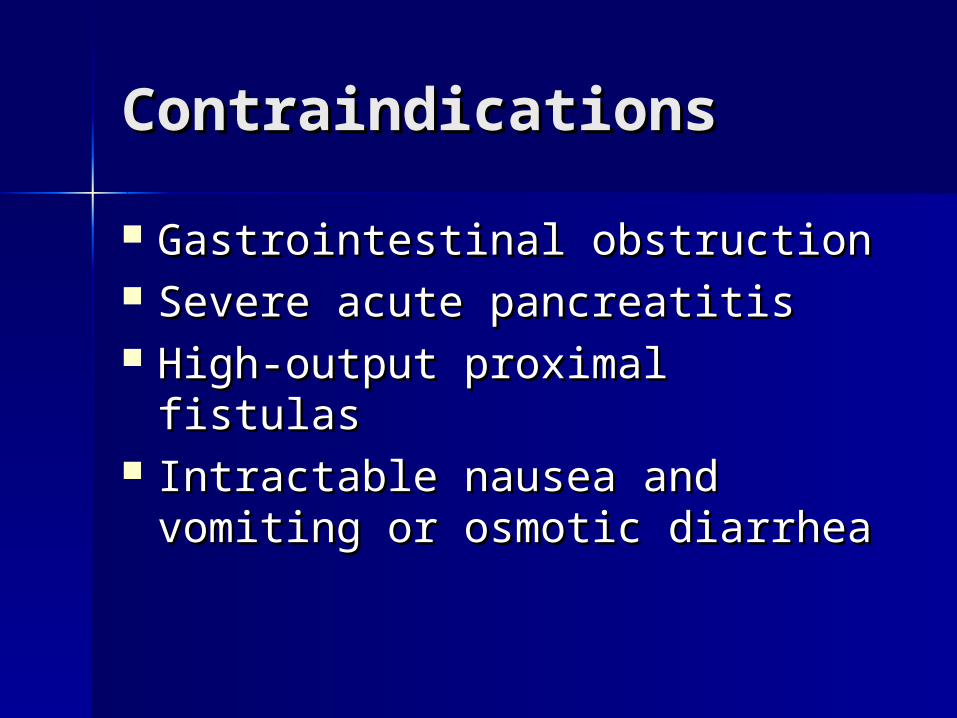
ContraindicationsContraindications
Gastrointestinal obstructionGastrointestinal obstruction Severe acute pancreatitis Severe acute pancreatitis High-output proximal fistulasHigh-output proximal fistulas Intractable nausea and vomiting Intractable nausea and vomiting
or osmotic diarrheaor osmotic diarrhea

Enteral nutrition (EN)Enteral nutrition (EN)
Long-termLong-term nutrition: nutrition: Gastrostomy Gastrostomy Jejunostomy Jejunostomy Short-termShort-term nutrition: nutrition: Nasogastric feedingNasogastric feeding Nasoduodenal feeding Nasoduodenal feeding Nasojejunal feeding Nasojejunal feeding


Parenteral nutrition Parenteral nutrition (PN)(PN) Peripheral Parenteral Nutrition Peripheral Parenteral Nutrition
(PPN)(PPN) Total Parenteral Nutrition (TPN) Total Parenteral Nutrition (TPN)

Cautious use of PN:Cautious use of PN:
AzotemiaAzotemia Congestive heart failureCongestive heart failure Diabetes MellitusDiabetes Mellitus Electrolyte disordersElectrolyte disorders Pulmonary diseasePulmonary disease

Intact food
Predigested food

TF = tube feeding

Total Parentral Total Parentral NutritionNutrition

PurposePurpose
To maintain positive nitrogen To maintain positive nitrogen balance through the intravenous balance through the intravenous administration of required administration of required nutrient such as glucose, IL, AA, nutrient such as glucose, IL, AA, electrolytes, vitamins, minerals electrolytes, vitamins, minerals and trace elements and trace elements

Patient SelectionPatient Selection

General Indications General Indications
Requiring NPO > 5 - 7 daysRequiring NPO > 5 - 7 days Unable to meet all daily Unable to meet all daily
requirements through oral or requirements through oral or enteral feedings enteral feedings
Severe gut dysfunction or inability Severe gut dysfunction or inability to tolerate enteral feedings.to tolerate enteral feedings.
Can not eat, will not eat, should Can not eat, will not eat, should not eat not eat

Special Indications (can not eat)

Cont:Cont:
When enteral feeding can’t be When enteral feeding can’t be established established
After major surgeryAfter major surgery Pt with hyperemesis gravidarumPt with hyperemesis gravidarum Pt with small bowel obstruction Pt with small bowel obstruction Pt with enterocutaneous fistulas Pt with enterocutaneous fistulas
(high and low)(high and low)

Cont:Cont:
Hyper-metabolic states:Hyper-metabolic states: Burns, sepsis, trauma, long bone Burns, sepsis, trauma, long bone
fracturesfractures Adjunct to chemotherapyAdjunct to chemotherapy Nutritional deprivationNutritional deprivation Multiple organ failure:Multiple organ failure: Renal, hepatic, respiratory, cardiac failureRenal, hepatic, respiratory, cardiac failure Neuro-traumaNeuro-trauma ImmaturityImmaturity

Calorie sourcesCalorie sources
60 to 80% of the caloric 60 to 80% of the caloric requirement should be provided requirement should be provided as as glucoseglucose, the remainder 20% to , the remainder 20% to 40% as fat40% as fat
CalculationCalculation
Our patient Wt = 50 kg, Age = 45 yrsOur patient Wt = 50 kg, Age = 45 yrs
Height = 5 feet 9 inches (175 cm)Height = 5 feet 9 inches (175 cm)
BEE = 66 + (13.7 x actual wt in kg) + (5x ht in cm) – (6.8 x age BEE = 66 + (13.7 x actual wt in kg) + (5x ht in cm) – (6.8 x age in y)in y)
==66 + (13.7 x 50 kg) + (5 x 175 cm) – (6.8 x 45)66 + (13.7 x 50 kg) + (5 x 175 cm) – (6.8 x 45)
=66 + ( 685) + (875) – (306)=66 + ( 685) + (875) – (306)
= 1320 kcal= 1320 kcal
TEE = 1320 x 1.25 (normal activity)TEE = 1320 x 1.25 (normal activity)
= = 1650 kcal1650 kcal

total calculated calorie = 1650 kcaltotal calculated calorie = 1650 kcal
80% from glucose 1650 x 80 80% from glucose 1650 x 80 =1320kcal=1320kcal
20% from fat (IL) 1650 x 20 = 20% from fat (IL) 1650 x 20 = 330kcal330kcal
Protein 1.2gm/kg/dayProtein 1.2gm/kg/day
1.2 x 50 = 60 gm1.2 x 50 = 60 gm

Protein requirementProtein requirement
150 kcal to 6.25 gm of protein150 kcal to 6.25 gm of protein
1650 kcal/150 x 6.25 gm = 68.8 or 1650 kcal/150 x 6.25 gm = 68.8 or 70gm70gm

GlucoseGlucose
Maximum oxidized rate for glucose Maximum oxidized rate for glucose is is 4 - 7mg/kg/min 4 - 7mg/kg/min (adult)(adult)
Exp: our patient is 50 kgExp: our patient is 50 kg
5mg x 50kg x 60min x 24 hr =360 5mg x 50kg x 60min x 24 hr =360 gmgm
360gm x 3.4 kcal/gm = 1224 kcal360gm x 3.4 kcal/gm = 1224 kcal
Maximum cal from glucose = Maximum cal from glucose = 1224kcal1224kcal
Cont;

Fat emulsionFat emulsion
Maximum recommended allowance Maximum recommended allowance 2.5 grams/kg/day2.5 grams/kg/day
Exp: 2.5 x 50 kg = 125 gm Exp: 2.5 x 50 kg = 125 gm
125gm x 9 kcal/gm = 1125 125gm x 9 kcal/gm = 1125 kcalkcal

Calorie calculationCalorie calculation
Total calorie requirement = 1650 Total calorie requirement = 1650 kcalkcal
calorie from glucose = 1224 calorie from glucose = 1224 kcalkcal
______________
form lipid 436 form lipid 436 kcalkcal


Intralipid Intralipid contraindications:contraindications: HyperlipdemiaHyperlipdemia Acute pancreatitis Acute pancreatitis Previous history of fat embolismPrevious history of fat embolism Severe liver diseaseSevere liver disease Allergies to egg, soybean oil or Allergies to egg, soybean oil or
safflower oilsafflower oil

DiabeticDiabetic
DM is not contraindication to TPNDM is not contraindication to TPN Use sliding-scale insulin to avoid Use sliding-scale insulin to avoid
hyperglycemiahyperglycemia

AdministrationAdministration

Central PN (TPN)Central PN (TPN)
Central PN (TPN) is a Central PN (TPN) is a concentrated formula and it can concentrated formula and it can delivered large quantity of delivered large quantity of calories via subclavian or jugular calories via subclavian or jugular vein onlyvein only


Continuous vs Cyclic Continuous vs Cyclic AdministrationAdministration

Continuous vs Cyclic Continuous vs Cyclic administrationadministration
It is given overnight and the patient It is given overnight and the patient is free during the day from the PN is free during the day from the PN solution and associated solution and associated administration paraphernalia (long-administration paraphernalia (long-term care)term care)
Continuous administration is Continuous administration is preferred in hospitalized patients as preferred in hospitalized patients as they often have fluid and electrolyte they often have fluid and electrolyte disturbancesdisturbances

MonitoringMonitoring
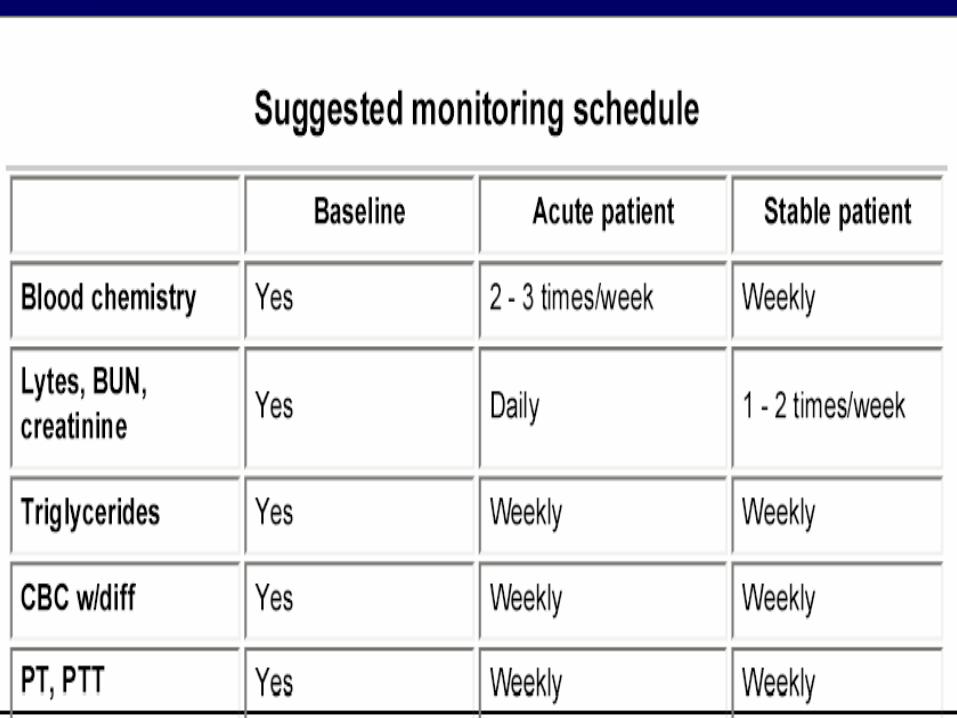


Complications of TPNComplications of TPN
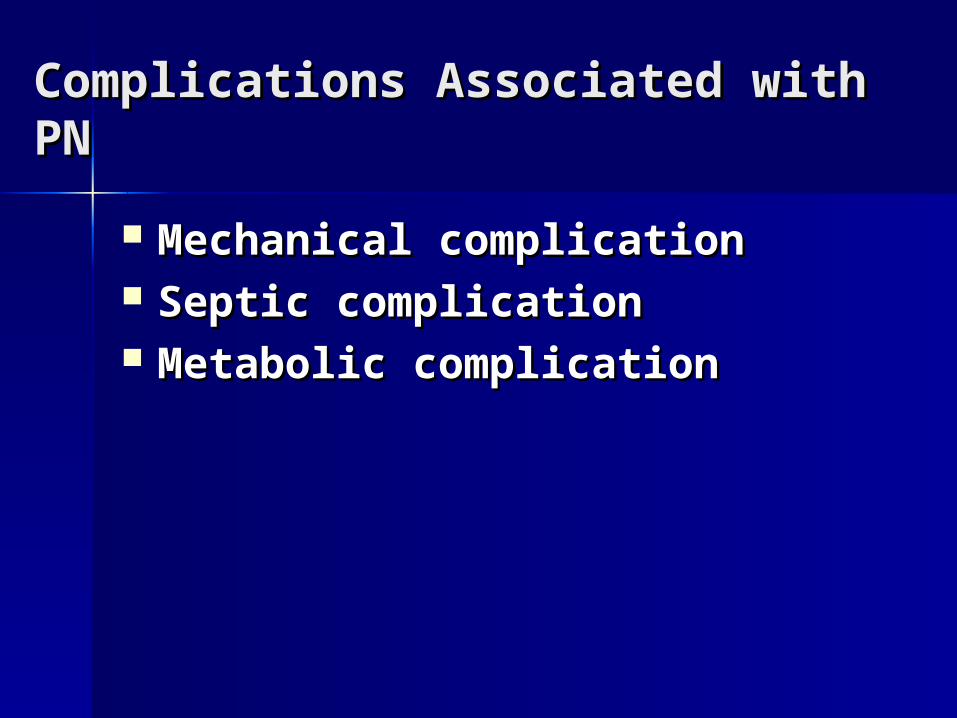
Complications Associated with Complications Associated with PNPN
Mechanical complicationMechanical complication Septic complicationSeptic complication Metabolic complicationMetabolic complication

Mechanical Mechanical ComplicationComplication Improper placement of catheter Improper placement of catheter
may cause pneumothorax, may cause pneumothorax, vascular injury with hemothorax, vascular injury with hemothorax, brachial plexus injury or cardiac brachial plexus injury or cardiac arrhythmiaarrhythmia
Venous thrombosis after central Venous thrombosis after central venous accessvenous access

Infectious Infectious ComplicationsComplications
PN imposes a chronic breech in PN imposes a chronic breech in the body's barrier systemthe body's barrier system
The mortality rate from catheter The mortality rate from catheter sepsis as high as 15%sepsis as high as 15%
Inserting the venous catheterInserting the venous catheter Compounding the solutionCompounding the solution Care-giver hanging the bagCare-giver hanging the bag Changing the site dressing Changing the site dressing

Metabolic Metabolic ComplicationsComplications Early complicationEarly complication -early in the -early in the
process of feeding and may be process of feeding and may be anticipatedanticipated
Late complicationLate complication - caused by not - caused by not supplying an adequate amount of supplying an adequate amount of required nutrients or cause required nutrients or cause adverse effect by solution adverse effect by solution composition composition


IronIron
Iron is not included in TPN Iron is not included in TPN solution and it can cause iron solution and it can cause iron deficiency anemiadeficiency anemia
Add 100mg of iron 3 x weekly to Add 100mg of iron 3 x weekly to PN solution or give separatelyPN solution or give separately

Vitamin KVitamin K
TPN solution does not contain TPN solution does not contain vitamin K and it can predispose vitamin K and it can predispose patient to deficiencypatient to deficiency
Vitamin K 10 mg should be given Vitamin K 10 mg should be given weekly IV or IM if patient is on weekly IV or IM if patient is on long-term TPN long-term TPN

Thank youThank you