Nutrition screening tools and the prediction of clinical ...
75
Syracuse University Syracuse University SURFACE SURFACE Theses - ALL 6-2014 Nutrition screening tools and the prediction of clinical outcomes Nutrition screening tools and the prediction of clinical outcomes among Chinese hospitalized gastrointestinal disease patients among Chinese hospitalized gastrointestinal disease patients Fang Wang Syracuse University Follow this and additional works at: https://surface.syr.edu/thesis Recommended Citation Recommended Citation Wang, Fang, "Nutrition screening tools and the prediction of clinical outcomes among Chinese hospitalized gastrointestinal disease patients" (2014). Theses - ALL. 34. https://surface.syr.edu/thesis/34 This Thesis is brought to you for free and open access by SURFACE. It has been accepted for inclusion in Theses - ALL by an authorized administrator of SURFACE. For more information, please contact [email protected].
Transcript of Nutrition screening tools and the prediction of clinical ...

Syracuse University Syracuse University
SURFACE SURFACE
Theses - ALL
6-2014
Nutrition screening tools and the prediction of clinical outcomes Nutrition screening tools and the prediction of clinical outcomes
among Chinese hospitalized gastrointestinal disease patients among Chinese hospitalized gastrointestinal disease patients
Fang Wang Syracuse University
Follow this and additional works at: https://surface.syr.edu/thesis
Recommended Citation Recommended Citation Wang, Fang, "Nutrition screening tools and the prediction of clinical outcomes among Chinese hospitalized gastrointestinal disease patients" (2014). Theses - ALL. 34. https://surface.syr.edu/thesis/34
This Thesis is brought to you for free and open access by SURFACE. It has been accepted for inclusion in Theses - ALL by an authorized administrator of SURFACE. For more information, please contact [email protected].

Abstract
Background/Objective: Nutritional Risk Screening 2002 (NRS-2002) and Subjective Global
Assessment (SGA) are widely used screening tools, but there is no gold standard for
identifying nutritional risk. The purpose of this study was to assess the nutritional risk among
hospitalized gastrointestinal disease patients, the agreement between NRS-2002 and SGA,
and to compare the clinical outcome predicting capacity of them.
Subjects/Method: This study was an analysis of secondary data including 332 patients
collected by gastrointestinal department of Peking Union Medical College Hospital
(PUMCH). All questions of NRS-2002 and SGA, complications, length of hospitalization
stay (LOS), cost, and death were collected. To assess the agreement between the tools, κ
statistic was adopted. Before assessing the performance of NRS-2002 and SGA in predicting
LOS and cost using linear regression, full and saturated model was compared via the global
f-test. The complications and death predicting capacity of tools was assessed using receiver
operating characteristic curves.
Results: NRS-2002 and SGA identified nutritional risk at 59.04% and 45.18%. The
agreement between two tools was moderate (κ index >0.50) for all age groups except

individuals aged ≤ 20, which was slight agreement (κ index 0.087). The saturated model did
not improve the outcomes of LOS and cost. There was no significant difference in the
association of one step of NRS-2002 and LOS (B=2.127, p=0.002) and the association of one
step of SGA and LOS (B=2.296, p=0.001). One step of SGA was associated with a relatively
large increase in cost (B=0.272, p=0.001) compared to one step of NRS-2002 (B=0.086,
p=0.000), but the difference was not significant. There was no difference of NRS-2002
(infectious complications: 0.615, death 0.810) and SGA (infectious complications: 0.600,
death: 0.846) in predicting infectious complication and death, but NRS-2002 (0.738) had
larger areas under ROC curve than SGA (0.552) in predicting non-infectious complications.
Conclusion: The prevalence of nutritional risk of hospitalized patients was high. There was
moderate agreement between NRS-2002 and SGA for all ages except ≤ 20 age group.
NRS-2002 and SGA have similar capacity to predict LOS, cost, infectious complications and
death, but NRS-2002 seems to perform better in predicting non-infectious complications.

Nutrition Screening Tools and the Prediction of Clinical Outcomes among Chinese
Hospitalized Gastrointestinal Disease Patients
by
Fang Wang
B.S., Tianjin Medical University, 2012
Thesis
Submitted in partial fulfillment of the requirements for the degree of
Master of Science in Nutrition Science
Syracuse University
June 2014

Copyright 2014 Fang Wang
All rights Reserved

v
Table of Content
Chapter I: Introduction 1–3
Chapter II: Literature review 4–26
Chapter III: Method 27–36
Chapter V: Results 37-41
Chapter VI: Discussion 42–53
Appendix 54
Tables and figures 55–60
Reference 61-68
VITA 69

1
Chapter I: Introduction
Introduction
Malnutrition occurs due to energy imbalance either from overnutrition or undernutrition.
Undernutrition results from energy, protein and other macro- and micronutrient deficiencies
due to decreased nutrient intake or increased nutrient demand of diseases. Undernutrition is a
common problem in hospitals and other health care centers, with prevalence ranging from
10% to 60% among patients (Bruun et al., 1999; Edington et al., 2000; Waitzberg et al., 2001;
Valero et al, 2005). In gastrointestinal wards prevalence of malnutrition tends toward the
higher range due to the complications of eating and nutrient absorption caused by
gastrointestinal diseases. Malnutrition is related to poor clinical outcomes for both individual
patients and clinical units, including longer length of hospital stay (LOS), increased cost,
complication incidence, and death rate (Baldwin and Parson, 2004; Winter et al., 2001;
Holmes 2007; Kubrack and Jensen, 2007). Appropriate and effective nutrition intervention
could decrease risk and prevalence of malnutrition and prevent its related complications.
Conversely, inappropriate nutrition support results in wasted medical resources and an
increased burden on health care providers (Xiaokun et al., 2009). To improve clinical

2
outcomes and save medical resources, it is important to identify patients at risk for
malnutrition. As the pre-step of nutrition care process (NCP), nutrition screening aims to
detect nutritional risk, allowing dietitians to provide nutrition intervention for at risk patients
in order to improve clinical outcomes. A good nutrition screening tool is positively correlated
with clinical outcomes, and has clinical outcome predicting capacity. However, there is no
gold standard for nutritional risk screening.
Among many nutrition screening tools the Nutrition Risk Screening 2002 (NRS-2002)
and Subjective Global Assessment (SGA) are two in wide spread use. They assess a patient’s
risk of nutrition depending upon weight and dietary changes, a patient’s disease state, and
physical examination (waist circumference, edema, muscle wasting, etc.) The NRS-2002,
introduced by European Society for Parenteral and Enteral Nutrition (ESPEN), has been
applied and reported among Chinese patients (Chen, et al, 2005). The SGA application is not
as well studied and there is limited data comparing SGA and NRS-2002 among Chinese
gastrointestinal patients.
Specific Aims
The objectives of this study are to assess prevalence of nutritional risks determined by

3
NRS-2002 and SGA among patients in a gastrointestinal ward, and then compare the
agreement between these two screening tools. Additionally, this study examines the
association between results of the two screening tools and the clinical outcomes of death,
complication incidence, cost and LOS, according to different age groups in order to assess
determine accuracy for determining nutritional risk. Findings could benefit health care
providers such as nurses and clinical dietitians to choose the most appropriate screening tool
for gastrointestinal inpatients.

4
Chapter II: Literature review
Background
Malnutrition is a broad term that can be used to describe imbalance between energy
intake and output, from over-nourishment, which is often seen in developed countries, to
under-nourishment, which is seen in many developing countriess. Undernourishment also
occurs in hospitals and residential care facilities in developed nations, due to increased
nutrient requirement of disease(s) and reduced nutrient intakes. Malnutrition causes
functional impairment or organ damage, and is associated with negative outcomes for
patients, such as higher infection and complication rates (Chandra and Kumary, 1994;
Baldwin and Parker, 2004), increased muscle loss (Chandra and Kumary, 1994; Winter, 2001),
delayed wound healing (Chandra and Kumary, 1994; Baldwin and Parker, 2004; Winter et al.,
2001), longer length of stay (Braunschweig et al., 2000; Gout et al., 2009), and increased
morbidity and mortality (Holmes, 2007; Kubrack and Jensen, 2007; Allison, 2000; Middleton
et al., 2001). Despite its high occurrence, the nutritional status of hospitalized patients is
seldom assessed by most medical professionals due to a lack of medical awareness of
malnutrition and its importance (Waitzberg, et al., 2001; Gout et al., 2009; Middleton et al.,

5
2001; O’Flynn et al., 2005).
Although medical, surgical, nursing and nutrition support services continue to improve
in quality, malnutrition and lack of awareness of it are still reported as significant problems
all over the world (Gout et al., 2009; Middleton, et al., 2001; O’Flynn et al., 2005).
Depending on the population, pathology and test used, the prevalence of malnutrition ranges
from 10% to 60% among hospitalized patients (Bruun et al., 1999; Edington et al., 2000;
Waitzberg et al., 2001; Cereceda, et al., 2003; Van Bokhorst-de van der Schueren et al., 2004;
Valero et al., 2005; Barker et al., 2011).
When an individual becomes sick, the immune system gets activated, and chemical
messengers (eg. cytokines) and inflammatory factors are produced and secreted, which
increase nutrient needs. Digestive organs including the oral cavity, esophagus, stomach, small
and large intestine, liver and pancreas are responsible for nutrient digestion, absorption and
utilization. In the gastroenterology department, patients usually have functional disorders of
digestion, absorption and utilization. Therefore patients who have had gastrointestinal
problems and who have undergone gastrointestinal surgery constitute an important risk group
for malnutrition (Tian and Chen, 2005). In addition to the increased nutrient requirements of

6
disease, patients with stomach or esophageal cancer have reduced oral nutrient intake, due to
blockage and encroachment of tumor. When a patient has liver, gallbladder or pancreatic
disease (e.g. inflammation, gall bladder stones, cancer, etc.), nutrient digestion is impaired
due to decreased secretion of bile and various digestive enzymes. Intestinal diseases (e.g.
inflammatory bowel disease, cancer, etc.) damage absorptive function since intestines are the
major area for nutrient absorption. The Romanian Society for Gastrointestinal Patients
conducted a multicenter prospective cohort study to assess prevalence of malnutrition, and
showed that around 19% of patients referred to gastroenterology tertiary center in Romania
had malnutrition or were at risk of it (Gheroghe, et al., 2010).
In China, gastrointestinal diseases remain the most prevalent leading cause of
hospitalization (Zhang, et al., 2006). However, there is limited data on the prevalence of
hospital malnutrition in Chinese gastroenterology departments. One of the objectives of this
study is to access the prevalence of nutrition risk and undernutrition in gastroenterology
department of a Chinese hospital.
Etiology of Malnutrition
Malnutrition can develop as a consequence of increased requirements from the

7
disease(s), complications of underlying illness, such as poor absorption and excessive
nutrient losses, or from a combination of these factors (Naber et al.,1997; Sorensen et al.
2008), which may explain the high occurrence rate of malnutrition in hospital. In addition to
a patient’s disease, various risk factors for malnutrition include social segregation, age,
psychological factors, economic status, lack of medical awareness and longer hospitalizations
(Waitzberg, et al, 2001; Jeejeebhoy, 2000). Personal contributors to malnutrition include age,
pathy/depression, disease (e.g. cancer, diabetes, cardiac, gastrointestinal), inability to buy,
cook or consume food, inability to chew or swallow, limited mobility, sensory loss (taste,
smell), treatment (ventilation, surgery, drain tubes), drug therapy, etc. Organizational
contributors to malnutrition include failure to recognize malnutrition, lack of nutritional
screening or assessment, lack of nutritional training, failure to record height and weight,
failure to record patient intake, lack of adequate intake, lack of staff to assist with feeding,
and lack of recognition of the importance of nutrition (Kubrack and Jensen, 2007;
Butterworth, 1974; Buzby et al., 1980). Additinally, confusion regarding responsibility for a
patient’s nutritional status if often unclear within hospitals.
Consequences

8
Malnutrition has often been referred to as the ―skeleton in the hospital closet‖, because
it is often neglected, undiagnosed and untreated (Butterworth, 1974; McKee, 2006; Ferguson
and Capra, 2001). The negative consequences of malnourishment have been well
demonstrated in the studies. Many studies have demonstrated that malnutrition is one of the
main factors influencing clinical outcomes (Mariana et al., 2010; Velasco et al., 2011). In a
study by Ottery (1994), about 20% of cancer patients died from malnutrition or its relative
complications rather than the direct effects of malignant disease. Malnutrition is related to
higher rates of infectious and non-infectious complications, organ failure, decreased wound
healing, and increased LOS (Chima et al., 1997; Robinson et al., 1987), augmented morbidity
and mortality and suboptimal response to regular medical treatment (VATPNCSG, 1991),
both in acute and chronic diseases. (Norman et al., 2008; Sorensen et al., 2008). Generally,
consequences of malnutrition can be separated into two main categories: consequences for
patients, and consequences for the health care facility.
Consequences for the patient
Malnutrition causes impairment at cellular, physical and psychological levels (Holmes,
2007; Kubrack and Jensen, 2007; Allison, 2000). The impairment is influenced by many

9
factors, including the patient’s age, gender, severity of illness, and current food intake. On a
cellular level, malnutrition impairs the body’s ability to generate the effective immune
response to infection, which makes infection harder to detect and treat (Scrimshaw and
DanGiovanni, 1997). For instance, impaired immune function leads to infectious
complications in malnourished patients, because of decreased humoral and cellular
immunological response (Chandra and Kumary, 1994; Van Der Hulst el al., 1998).
On a physical level, malnutrition causes the loss of muscle and fat mass. Muscle
dysfunction, in particular, thoracic muscles, may explain the high incidence of pneumonia
among malnourished patients (Efthimiou, et al, 1988). Bouchard et al. (2007) also reported
the association between aspiration pneumonia and malnutrition in patients - patients with
weakened respiratory and thoracic muscles cannot cough out sputum that contains bacterial
materials. The guts of patients with malnutrition exhibit impaired digestion and absorption
functions (Chandra and Kumary, 1994; Van Der Hulst et al, 1998). Wound recovery is also
adversely affected by malnutrition (Hill and Haydock, 1989), since the wound healing
process requires protein and other significant micronutrients, including zinc, vitamin C and
others. to participate in tissue regeneration. Anemia is widely known to be caused by iron,

10
B12 or folate deficiency. Malnutrition also increases the risk of pressure ulcers, increases
infection risk, decreases nutrient intestinal absorption, alters thermoregulation and
compromises renal function (Naber et al. 1997; Holmes, 2007; Allison, 2000).
On the psychological level, malnutrition is related to fatigue, apathy, depression, and
poor appetite, which will delays recovery, increase anorexia and convalescent time (Kubrack
and Jensen, 2007).
It is widely verified in the literature that LOS is significantly longer in malnourished
patients (Norman et al., 2008; Braunschweig et al., 2000; Thomas et al., 2002; Kruizenga et
al., 2005), because malnutrition influences almost every organ and/ or system of the human
body. An Australian study indicated that malnourished patients have 5 days longer LOS than
well-nourished patients, which is a significant difference (Middleton et al., 2001). A study
conducted in the United States showed that patients who were admitted with some degree of
malnutrition, and those patients who had a decline in nutritional status during their
hospitalization, had significantly longer hospital stays (by an average of 4 days) than patients
both admitted and discharged as well nourished (Braunschweig et al., 2000).
In addition to longer LOS, patients with malnutrition have higher risk of suffering

11
complications during their period of hospitalization than patients who are in a well-nourished
state (Braunschweig et al, 2000). Complications can occur when an unexpected accident or
disease adds to a pre-existing illness without being specifically related to the illness (Naber et
al., 1997). Malnourished patients had significantly higher risks of both infectious and
non-infectious complications (Kuzu et al., 2006), and thus had augmented mortality rates
(Allison, 2000; Middleton et al., 2001; Gallagher-Allred et al., 1996). Non-infectious
complications, like respiratory failure, cardiac arrest and atrophy of visceral organs (Chandra,
1994; Holmes, 2007; Kubrack and Jensen, 2007), are related to decreased muscular
functional capacity together with contractility dysfunction of the respiratory muscles and loss
of cardiac function, resulting from malnutrition (Isabel et al., 2003).
Consequences for the health care facility
Malnutrition leads to additional stress for health care facilities. Due to higher rates of
infections and pressure ulcers, malnourished patients often need more intensive nursing care,
more medications, and are less independent due to muscle loss, which lead to longer lengths
of hospital stay, when compared to well- nourished patients (Middleton et al., 2001; Pirlich et
al., 2006; Waitzberg et al., 2001; Funk, 1995). All these issues combined indirectly increase

12
hospital costs related to treating the patient, secondary to the management of their primary
medical reason for admission (Allison, 2000; Chima et al., 1997). A Brazilian study found
that malnourished patients represented a mean daily expense of US $ 228.00/patient
compared to the US$ 138.00/patient in the well nourished, which represented a higher cost of
60.5% for malnutrition.
Malnutrition Intervention
In order to prevent or reverse the related negative clinical outcomes, it is imperative to
provide nutritional support and therapy to patients with nutritional risk. Lack of appropriate
nutritional support during hospitalization may worsen patients’ nutritional status (Brown,
1991).
Nutritional support and intervention, including oral nutritional supplements, enteral and
parenteral feeding, have a positive correlation with clinical outcomes (Odelli et al., 2005;
O’Flynn et al., 2005; Stanga et al., 2007) by reducing complication rates, hospital LOS and
costs (Elia et al., 2005; Kruizenga et al., 2005). In the gastroenterology department,
perioperative nutrition support is beneficial for moderately and severely malnourished
gastrointestinal cancer patients so as to reduce surgical complications and mortality (Guohao

13
et al., 2006).
Some studies have indicated the benefits of nutritional interventions for malnourished
patients. A study of 19 U.S. hospitals showed that hospital LOS was influenced by the degree
of nutritional care received by malnourished patients (Smith, 1997). Patients who received
both early nutrition intervention and frequent high quality nutrition services, averaged a 2.2
day shorter LOS than those who received medium quality nutritional care (defined as early
intervention OR frequent use of nutrition services). Patients who received low quality
nutritional care (later or no intervention and/or infrequent or no use of nutrition services) had
the longest average LOS.
Hospital length of stay and cost are widely used indicators for clinical outcome
measurements (Seehusen, 2010). Appropriate, effective and efficient clinical pathways and
treatment could reduce LOS and cost. Patients in China have to pay for the extra services and
health care in hospital, such as feeding assistance, nursing care, etc. because government and
insurance only pay for a small part of the cost. Therefore the longer they stay, the higher the
costs incurred. Complication occurrence increases the difficulties of treatment, postpones
recovery, and also increases LOS and cost. Physicians spare no efforts to prevent and control

14
complications for inpatients. The aim of medical treatment is to prevent death, so death rate is
commonly used to assess clinical outcomes, and effectiveness of clinical treatment. Because
hospital LOS, cost, infectious and non-infectious complication rate, and death rate are
associated with nutritional status, and they are often regarded as measurements of medical
treatment effectiveness, they are defined as clinical outcomes in this study.
Nutrition screening
Nutrition screening precedes the nutrition care process (NCP, including assessment,
diagnosis, intervention, and monitoring and evaluation). It is a significant part of the design
of a nutritional plan during admission (Velasco et al., 2011). The occurrence of malnutrition
among patients is based not only on the patient population being surveyed, but also on the
different nutritional screening tools being used. For the same group of subjects, the reported
prevalence of malnutrition varied by different assessment methods. There was a study
conducted in Berlin, the nutritional status detected among 287 patients during admission to
hospital showed that 26.1% patients were detected with malnutrition according to the
Subjective Global Assessment (SGA) and only 3.8% patients had a BMI<18.5, which was the
diagnostic criteria for malnutrition when using BMI alone (Norman et al., 2005). In China,

15
Wu et al. (2005) investigated the nutritional status of 4012 patients via using different kinds
of nutritional assessment methods. The prevalence of malnutrition in their study was 50.6%,
38.8%, 35.4%, 24.4%, or 21.3% according to triceps skinfold thickness (TSF), SGA,
prealbumin (PA), albumin (ALB), and BMI, respectively (Wu et al., 2005). Thus, the choice
for nutritional assessment is quite subjective, controversial, and subject to much confusion.
Importance of screening
Nutritional status is known to worsen during hospital stay partly due to poor recognition
by the medical staff and adverse clinical routines (Norman et al., 2008). Although
malnutrition undeniably promotes morbidity, and appropriate nutritional therapy is available
in affluent countries, only a small percentage of malnourished patients receive nutritional
support, including oral nutrient supplements, enteral or parenteral nutrition therapy (Correia
and Campos, 2003; McWhirter and Pennington, 1994; Rasmussen et al., 2004). The reasons
are lack of awareness and adverse hospital routines (McWhirter and Pennington, 1994).
The World Health Organization describes screening as a simple test to identify the
patients who have disease but do not have symptoms. In 2002, ESPEN defined nutrition
screening as a rapid and simple method conducted by admitting staff to accurately identify

16
those patients who are malnourished or at risk of malnutrition, and who could benefit from
nutritional therapy and support (Kondrup et al., 2002). Nutrition screening can be performed
by any trained health professional, but is usually conducted by nursing or nutrition assistant
staff. When the patient is found to be malnourished or at risk, the full NCP, including
assessment, diagnosis, nutrition therapy as well as monitoring and evaluation is provided. It is
important to distinguish screening from the nutritional assessment, which provides the
clinician additional data on patient nutritional status through a detailed detection of metabolic,
nutritional or functional aspects by a clinician, dietitian or other health providers (Kondrup et
al., 2002).
Generally, patients are referred to a dietitian by medical and other health providers to
provide further NCP and nutrition intervention if it is necessary, and little time is left for these
health providers to screen additional patients (Ferguson and Capra, 1998). Therefore many
malnourished patients in hospital are not identified as such, and thereby not referred for
nutrition assessment and intervention. In some countries, such as the United Kingdom,
United States, the Netherlands and some parts of Denmark, nutrition screening on patient
admission is mandatory, with satisfactory hospital accreditation dependent on this being

17
carried out (Elia et al.,2005). In China, however, this is currently not the case. Few hospitals
whose dietitians participated in a survey carried out routine nutrition risk screening, unless
required by hospital policy.
On one hand, nutrition intervention could bring benefits for malnourished patients, such
as less complication, shorter LOS, less medical cost, etc. On the other hand, unnecessary
nutrition intervention is a waste of money, time and medical resources. Inappropriate use of
nutritional support was observed among inpatients (Xiaokun et al. 2009). A randomized
control trial (RCT) indicated that in order to avoid wasting of resources, the precondition of
achieving benefit from nutritional support is that the patients are already diagnosed as
malnourished or at risk of malnutrition (VATPNCSG, 1991; Johansen et al., 2004).
Considering that China is currently facing a shortage of medical resources, as well as
enormous pressures on health care providers, a screening method which could best reflect the
nutritional status of patients is one of the most crucial challenges in nutritional support
practice.
Because proper nutritional support can reduce the prevalence of hospital malnutrition
and costs, nutritional risk screening is needed for early identification of malnutrition and risk

18
of malnutrition, initiation of further nutrition assessment, nutrition therapy and support, and
to prevent unnecessary medical cost. Many validated tools for nutrition risk screening and
nutrition assessment exist for the clinician to use in assisting with accurate identification,
referral and treatment of patients who are malnourished or at risk of malnutrition. The
Academy of Nutrition and Dietetics, formerly known as the American Dietetic Association,
defines nutrition risk screening as ―The process of identifying patients with characteristics
commonly associated with nutritional problems who may require comprehensive nutrition
assessment‖ (ADA, 1994).
According to Resolution ResAp (2003) of the Council of Europe on food and nutritional
care in hospitals (Council of Europe, 2003), the nutritional risk of all patients should be
routinely assessed either before or at admission, so that a nutritional intervention can be
provided (Velasco et al., 2011). This assessment should be repeated regularly, with intervals
depending on the level of nutritional risk, during the hospital stay. If nutritional status and
disease have influences on patient outcomes, it is crucial both to treat the disease and nourish
the patient. Therefore, it is fundamental to understand the significance of nutritional therapy
in improving the clinical outcomes of those who have trouble to get enough nutrients and

19
calories during their disease process, and function of nutrition support is similar to what left
ventricular assistant device (LVAD) shows to patients with heart failure, or ventilator support
to patients with respiratory failure (Isabel, 2003).
Screening tools
Numerous nutrition screening tools exist to identify risk of malnutrition, all of which
include the consideration of disease, age, recent weight changes, and dietary changes. The
risk should be assessed by tools routinely used at admission in an attempt to reduce
nutrition-related complications.
A good nutritional screening tool is regarded as being sensitive, specific and applicable
(Anthony, 2008), because it uses the criteria to identify patients who need nutritional support
and could benefit from it. Depending on different screening methods and tools, the
malnutrition incidence of inpatients from different countries ranges from 10%-60%. Over 70
nutritional screening tools have been described in various populations (Green and Watson,
2006), but they present differences in validity, reliability, ease of use and acceptability (Elia et
al., 2005). Most screening tools are based on variables such as recent weight loss, food intake,
body mass index and severity of disease.

20
Subjective global assessment (SGA)
As reported, SGA was one of the most widely used tools among all the screening tools
for its subjective characteristic allowing dietitians to catch subtle changes in clinical variables
(Lisa, 2011). SGA is a questionnaire covering the medical history of patient (including weight
loss, recent changes in food intake, gastrointestinal tract symptoms, changes in functional
capacity in relation to malnutrition and underlying diseases), and brief physical examination
(including muscle, subcutaneous fat, edema and ascites), and also the overall judgment of the
patient’s status from clinicians. A high degree of inter-rater reproducibility has been shown
for SGA, with 91% of surgical patients classified by SGA having two clinicians agreeing on
SGA classification (Detsky et al., 1987). In 2002, the American Society of Parenteral and
Enteral Nutrition (ASPEN) recommended SGA as a nutrition screening tool for malnutrition
risk and degree. Patients are classified as well nourished (A), suspected malnourished (B),
and severely malnourished (C).
NRS-2002
In 2002, the European Society of Parenteral and Enteral Nutrition (ESPEN) published a
new screening tool—Nutrition risk screening (NRS-2002), which was based on interpretation

21
of retrospective nutrition risk screening of 128 randomized control trial (RCT) studies.
NRS-2002 measures four aspects including anthropometry (BMI), recent weight loss, recent
nutrient intake changes, and also the subjective assessment of disease severity (based on
increased nutrition requirements and/or metabolic stress), to generate a nutrition risk score
(Anthony, 2008). The NRS score also evaluates the degree of malnutrition risk. A score at or
above 3 indicates that the patient is at risk of malnutrition, and patients with scores less than 3
are classified as no at risk (Kondrup et al., 2003). The subjective grading of illness severity
may not definitively reflect current nutritional status and the tool cannot be used to diagnose
malnutrition. But the NRS-2002 has, been recommended for use in hospitalized patients by
ESPEN and may be useful for prompting the initiation of nutrition support (Kyle et al., 2003;
Kondrup et al., 2003).
From 2003 to 2006, a survey was conducted by the Chinese Medical Association in
order to access the application of NRS for over 15,000 patients in 12 cities through the
country, and it showed that NRS was an appropriate method for Chinese inpatients. However,
as a screening tool, NRS only determines nutrition risk, but cannot determine the degree of
malnourishment (Chen et al., 2005).

22
Association between SGA and NRS-2002
SGA and NRS are two screening tools based on different theories, and they have their
own advantages and disadvantages. Even though there is no gold standard for nutrition
screening, SGA is often used as a criterion method to evaluate the sensitivity, specificity and
predictive values of other screening tools (Velasco et al., 2011). A recently published study
(Velasco et al., 2011) has indicated that when compared with SGA, NRS-2002 has high
specificity, sensitivity, and good positive and negative predictive values. A nutritional
screening tool is expected to accurately indicate nutritional status, and there is an association
between malnutrition and clinical outcomes, so the malnutrition screening tool should
generate results that are consistent with clinical outcomes. In other words, when a patient is
determined as malnourished or at risk of malnutrition, the probability of occurrence of
adverse clinical outcomes should be significantly higher than for other patients. Thus
dietitians could use the result generated by the screening tool to determine the necessity of
nutrition intervention, because unnecessary nutrition intervention may waste money and
medical resources. NRS-2002 has been shown to be able to discriminate malnourished from
well nourished patients, and non-malnourished patients were classified as not being at

23
nutritional risk (Velasco et al., 2011). Moderate agreement was observed between NRS-2002
and SGA (Velasco et al., 2011).
Because nutrition screening tools detect malnutrition, it is important to determine the
appropriate, sensitive and subjective tool that can be used for patients, but there is limited
data comparing use of NRS-2002 and SGA among Chinese gastrointestinal patients.
To choose a screening tool for use in a hospital setting, it is helpful to verify its
performance by comparing nutritional risk with clinical outcomes (Stratton et al., 2005).
Even though it is hard to predict malnutrition markers, many researchers are dedicated to
finding or establishing desirable prediction measurements associated with nutritional status.
As a result, the association between different nutritional screening and assessment tools and
unfavorable clinical outcome has been studied (Sungurtekin et al, 2004; Bauer et al, 2005;
Kyle et al, 2005).
Several studies have demonstrated the effect of nutritional status on the development of
infectious and non-infectious complications (Sorensen et al., 2008; Lobo et al., 2009). The
validity of a screening tool is dependent on its ability to predict outcomes. The association
between nutritional status and increased morbidity/ mortality in at-risk patients has long been
24
studied (Buzby et al., 1980; Smith and Hartemink, 1988; McWhirter, 1994). These days,
many studies use nutritional screening and nutritional assessment tools to predict unfavorable
clinical outcomes (Amaral et al, 2007; Sungurtekin et al, 2004; Bauer et al, 2005).
Present study
Malnutrition prevalence among hospitalized gastrointestinal patients has not been
previously reported in China, this study examined the prevalence in gastrointestinal
department of a hospital. Different populations have different characteristics, values, beliefs,
and the perceptions of health conditions, thus one screening tool might not be appropriate for
all patients. Also a single screening tool may not be applicable to patients with different
diseases. Sensitivity and specificity of NRS-2002 and SGA were significantly different when
the results were stratified by age (Velasco et al., 2011). In Velasco’s study, all the screening
tools identified more elderly patients at nutritional risk (Velasco et al., 2011). It could be
explained by the fact that elderly patients are at increased nutritional risk compared with
younger people. Moreover, the difference was particularly relevant with NRS-2002, since this
tool has an age adjustment for patients over 70 years old. Therefore, it is necessary to
compare sensitivity, specificity, positive predicted value and negative predicted value of each

25
test according to patients of different age and gender subgroups.
NRS-2002 has been applied among Chinese patients (Weiping et al., 2009), but SGA
has not been fully investigated. Therefore this study compared the two screening tools by
testing the agreement between them on malnutrition screening. The negative impact of
malnutrition on patient outcomes is well established. Unfortunately, disease and nutrition
influence each other. In other words, the underlying disease can cause secondary malnutrition,
and malnutrition may adversely influence current diseases (Jeejeebhoy, 2000). Thus it is
difficult to conclude that malnutrition alone contributes to poor patient outcomes. However,
evidence getting from hunger strikers that did not suffer from any disease, demonstrated that
when people suffer more than 38% of weight loss, one-third of those people died (Allison,
2000). Even short periods of fasting may lead to metabolic dysfunctions. An overnight fast in
well-nourished individuals, scheduled for surgery, led to peripheral insulin resistance, with
simultaneous negative nitrogen balance in the post-operative period (Ljungqvist et al., 2000).
The Minnesota semi-Starvation Experiment documented the physical and psychologic effects
of malnutrition (Keys, 1950). In that experiment, 36 healthy young men were enrolled and
were subjected to semi-starvation in which most lost >25% of their weight. The results of the

26
experiment indicated that diet itself have a significant influence on body functions, such as
blood temperature, blood pressure, serum cholesterol level, heart rate, immune function
deficient, anemia, apathy, irritability, neurological deficits and lower extremity edema
(Williamson., 2004).
Besides nutrition, many other factors influence clinical outcomes (hospital LOS,
morbidity, mortality, complications, and hospital costs), including presence of cancer and
infection, age above 60 years old whether patients are undergoing clinical treatment or not
(Velasco et al., 2011). NRS-2002 and SGA include questions related to disease, age, weight
changes, dietary changes, etc., which can cover almost all factors, so it can predict clinical
outcomes. This study tested the clinical outcome predicting power of NRS-2002 and SGA in
different age and gender groups. Findings can be used by health providers to determine which
tool best identifies nutritional risk of the patients.

27
Chapter III: Methods
Objectives:
1. To assess the prevalence of nutritional risk in gastroenterology department of
a Chinese hospital.
2. To assess the agreement between two widely used nutrition screening tools in
clinical practice, NRS-2002 and SGA, for patients in different age groups.
3. To compare the clinical outcome predicting capability of NRS-2002 and
SGA, so as to select the appropriate screening tool for Chinese patients in different
age groups with gastrointestinal diseases.
Method: A secondary data analysis
The clinical investigation was carried out in gastrointestinal wards, and the
original data was collected by Peking Union Medical College Hospital (PUMCH).
The original data included age, gender, nutritional screening, and complications,
which were achieved through interview by clinical dietitians at PUMCH. Death, LOS
and cost information was also collected from the medical records of patients. The
investigation was approved by Institutional Review Board of PUMCH in China in

28
2008 (Registration No. S-203). The present data analysis was approved by the
Institutional Review Board of Syracuse University in 2013 (IRB# 13-283).
Data collection:
The age of recruitment started from 18 years old, because the study was
conducted in an adult department. The inclusion criteria were: 1. Gastro-enterology
patients aged between 18 and 90 years old; 2. Scheduled to stay at least one night in
hospital; 3. No surgery planned before 8 a.m. on the following day; 4. Voluntary
participation; 5. Ability to communicate for interviewing and answering questions.
Patients with less than one day LOS and surgery planned for the following day were
excluded in the study due to the limited time schedule for screening, one day was too
short a time to complete any documented report. Patients who were sent to intensive
care unit (ICU) directly or had critical illness were not included in the study because
there was not possible to complete nutrition assessment within 24 hours of admission.
Additionally, patients in those situations cannot be interviewed for nutrition screening.
Women who were pregnant, breast feeding, or gave birth within the past six months
were also excluded.

29
Open enrollment occurred through the 2008, all patients who met the criteria and
wanted to participate in the research voluntarily were included in the sample. The goal
was to recruit approximately equal numbers of men and women in order to decrease
gender bias, and to cover people of all ages, since the objective of the study was to
find the appropriate nutrition screening tool for patients from different age groups. All
participants provided informed consent forms that were approved by the Institutional
Review Board of PUMCH. Within one year from enrollment, between January 2008
and December 2008, 334 inpatients who were admitted and managed in the
Gastrointestinal Department of PUMCH and agreed to participate in the research were
studied. However, two subjects were excluded due to incomplete data (one patient
missed SGA and NRS-2002, and the other patient miss SGA).
Study enrollment led to 191 males and 141 females (proportion of 1.35:1). Ages
ranged from 18 to 86 years (median age was 47 years). For convenience, age groups
were broken down into cohorts of 15 years starting from the age of 20. Therefore,
there were ≤20, 21-35, 36-50, 51-65, 66-80, ≥81 years old groups.
Nutritional risk assessment was performed within 24 hours of admission using the

30
NRS-2002 and SGA screening tools. Simultaneously, anthropometric parameters
(height, fasting weight, BMI), age, and the diagnosis were collected for each patient.
The dietitians weighed and measured the participants wearing a hospital gown with
shoes off, with the same standard scale, and before meals in the morning. The height
of the patient was measured to the nearest 0.5 cm, and weight was measured to the
nearest 0.5 kg. The other related information, such as the complications or morbidities
diagnosed on admission was collected from the patients’ medical record. The
dietitians continued to visit patients and collected the complication incidence, LOS,
cost and death when patient discharge. Inpatients were reassessed every 7+/-1 days
when their LOS was more than one week. After screening, participants with
nutritional status as malnutrition or at risk of malnutrition determined by any or both
of NRS-2002 and SGA were referred to clinical dietitians for further nutritional care
using the Nutrition Care Process (NCP), including nutrition assessment, diagnosis,
intervention, and monitoring or evaluation. When patients were diagnosed as being
malnourished, they received nutritional support, including oral nutrient supplement,
enteral or parenteral nutrition if necessary, and nutrition education or counseling.

31
In order to control the quality of data, all the surveys were completed within 24 hours
by clinical dietitians. In order to limit the subjective variability of dietitians,
nutritional screening was completed by the same dietitian for a single patient.
Moreover, Case Report Forms (CRFs) were double checked one day before the
patient left in order to secure the integrity and authenticity of the forms.
Screening tools:
NRS-2002 and SGA were used for nutrition screening for all participants by
clinical dietitian in hospital. For NRS-2002, three factors (BMI, weight loss and
nutritional intake) were all considered in the nutritional evaluation. A total score
exceeding 3 suggests nutritional risk, whereas less than 3 suggests no nutritional risk
temporarily, except for patients with ascites or pleural fluid in accordance with the
diagnosis by physicians.
SGA included medical history and physical examination sections. The medical
history section evaluated the patient’s answers to questions about four aspects,
including recent weight change, dietary intake, gastrointestinal symptoms and
functional impairment. Patients were rated as nourished (A), mildly and moderately

32
malnourished (B), or severely malnourished (C) relying on the results and evaluation
about weight and dietary changes, gastrointestinal symptoms and functional problems.
During physical examinations, a patient’s loss of subcutaneous fat, muscle wasting,
edema and ascites of patients were examined and recorded by dietitians. Depending
on the results of the physical examination, patients were rated as well, moderately
malnourished or severely malnourished. After both the survey and physical
examination were performed, the dietitians provided an overall SGA classification
corresponding to his or her opinion of the patient’s nutritional status by clinical
judgment.
Patients with a score of 3 or above on the NRS-2002 were considered
malnourished according to the NRS-2002. Patients scoring B (suspected malnourished)
or C (malnourished) on the SGA were considered malnourished according to the
SGA.
Outcomes:
LOS, incidence of complication, including infectious- and non-infectious ones
(any or none), cost of hospitalization, and death were selected as indicators of clinical

33
outcomes because they are influenced by nutrition status, and they can reflect the
effectiveness and efficiency of medical and nutritional intervention. The infectious
complications included wound infection, abdominal infection, perianal abscess,
tuberculosis, systemic inflammatory response syndrome (SIRS), positive culture test,
pneumonia, urinary tract infection, abdominal fistula infection, pressure sores, fungal
infection, and oral infections. Non-infectious complications included anemia,
myocardial infarction, upper gastrointestinal bleeding, and organ failure. Any new
onset diseases mentioned above were considered as complications.
Analysis:
Objective 1. To assess the prevalence of nutritional risk in gastroenterology
department of a Chinese hospital.
The prevalence of nutritional risk detected by NRS-2002 and SGA was calculated
for the total patient population and for categorized age groups.
Objective 2. To assess the agreement between NRS-2002 and SGA for patients in
different age groups.
Cohen’s (kappa) was run to assess the agreement between classifying patients as

34
malnourished with NRS-2002 and classifying patients as malnourished with SGA
with 95% confidence intervals (CI). The results were interpreted as follows: <0, no
agreement; 0 to 0.19, poor agreement; 0.20 to 0.39, fair agreement; 0.40 to 0.59,
moderate agreement; 0.60 to 0.79, substantial agreement; and 0.80 to 1.00, almost
perfect agreement (Landis, 1977).
Objective 3. To compare the clinical outcome predicting capability of NRS-2002 and
SGA.
In order to compare the association of NRS-2002 or SGA and clinical outcome
(LOS and cost), scores or levels were adopted. Linear regression was used for
assessing the performance of NRS-2002 and SGA in predicting LOS and cost. Five
patients who died during hospitalization were excluded from LOS analysis, so the
performance of NRS-2002 and SGA was assessed for 327 subjects. LOS and cost
were not normally distributed, so the outcomes were log-transformed. Age was
categorized as four groups and was included as a categorical variable because the
relationship between age and the outcomes was assumed to be nonlinear. Gender and
the presence of infectious and non-infectious complications were included as
35
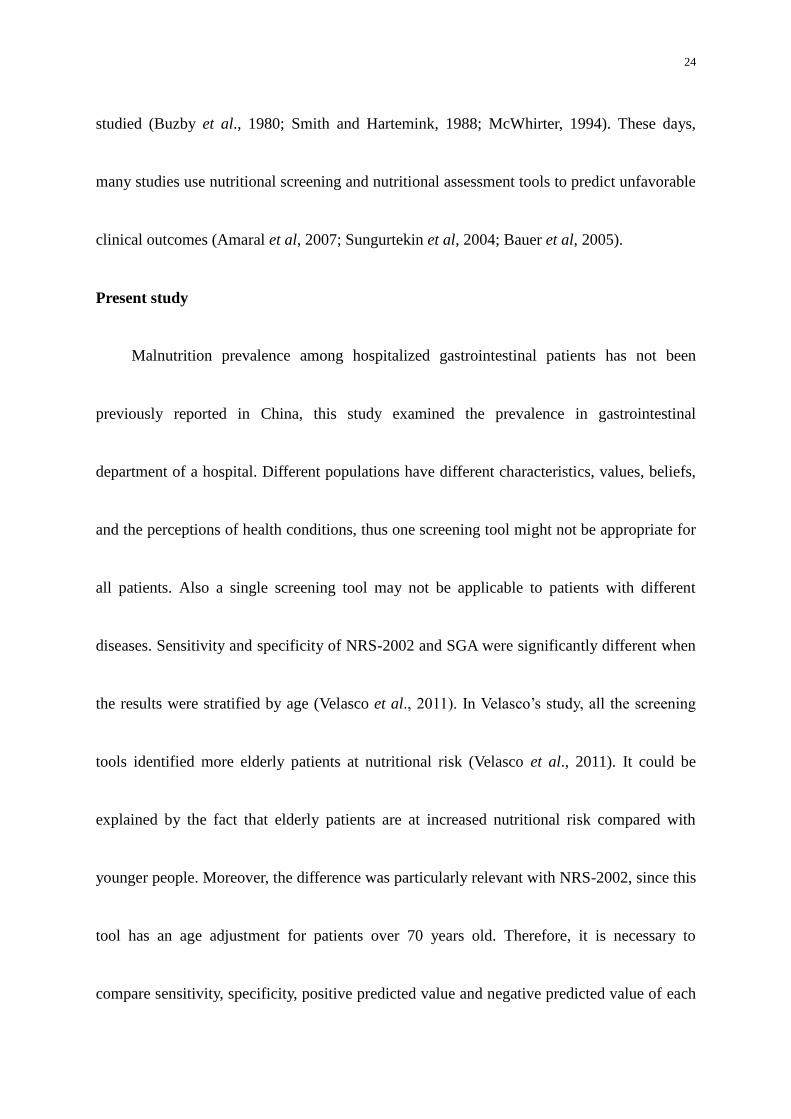
covariates. To test whether the NRS-2002/SGA predicted better or worse for different
age groups, a global f-test (Equation 1) was used to compare a full model for LOS and
cost with a saturated model including the interaction between NRS-2002/ SGA and
categorized age. The accuracy of NRS-2002 and SGA could be compared through R
square comparison, as well as determining the amount of variance each screening tool
accounted for in the model.
Equation 1: Global F test for determining if interaction term improves the linear model.
SS: sum of square; df: degree of freedom.
Considering that complications and death are categorical variables, Receiver
operating characteristic (ROC) curve (Zou et al, 2007; Zweig, 1993) was applied to
assessing the predicting capacity of NRS-2002 and SGA for clinical outcomes of
infectious, non-infectious complications, and death. Specificity and sensitivity could
be achieved from the ROC curve analysis, and accuracy of the diagnostic test was
evaluated by the area under the ROC curve. The results were interpreted as follows:
0.9-1, excellent; 0.80-0.90, good; 0.70-0.80, fair; 0.60-0.70, poor; 0.50-0.60, fail. The
F=(SS1-SS2)/(df1-df2)
SS2/df2

36
ROC curve analysis of LOS excluded the patients who died during hospitalization, so
the performance of NRS-2002 and SGA was assessed in 327 patients.
For all analyses, statistical significance was set at P≤0.05. Data was analyzed by
using the statistical package IBM SPSS Statistics (IBM Corp., USA) version 20 for
Windows.

37
Chapter IV: Results
Demographic data
A total of 334 patients were enrolled into the study throughout the course of the
year from the gastrointestinal department of PUMCH. However, the data of two
subjects were incomplete, and those two subjects were excluded from any analyses.
Therefore, there were 332 patients (99.40% of total patients recruited) with complete
data. Of these patients, 141 (42.47 %) were female and 191 (57.53 %) were male.
Ages ranged from 18 to 86 years old. The mean age was 53.0 years old (SD 17.99
years), and median age was 47 years old. Among patients, 14 subjects were aged ≤ 20,
54 subjects were aged 21-35, 68 subjects were aged 36-50, 94 subjects were aged
51-65, 90 subjects were aged 66-80, and 12 subjects were aged ≥ 80 years old.
The prevalence of nutritional risk
The nutritional risk rates differed depending on the screening tool used. The
prevalence of nutritional risk among all patients was 59.04% according to the
NRS-2002, and 45.18% according to SGA. The detailed nutritional risk determined
by NRS-2002 and SGA according to different age groups is shown in figure 1. Among

38
the different age groups upon admission, the highest prevalence of nutritional risk was
in ≥ 81 years old group detected either by NRS-2002 or SGA, and the lowest
prevalence of nutritional risk was in 51-65 years old group. The prevalence of
nutritional risk in those patients older than 65 years old was 62.75%, which was much
higher than that of patients younger than 65 years (57.40%).
Agreement between NRS-2002 and SGA
Cohen’s κ (kappa) was performed to determine the agreement between NRS-2002
and SGA on whether 332 individuals exhibited malnutrition. There was moderate
agreement between these two screening tools, κ=0.514 (95% CI, 0.428 to 0.604),
p<0.0005. When stratifying by age, moderate agreement was observed for all age
groups with the exception of individuals aged ≤20. Among individuals ≤20 years,
only slight agreement was observed. Detailed nutritional risk and κ-index for each age
group is shown in Table 2.
Association between nutritional risk screening and clinical outcomes
Five patients died (1.51%) during the hospitalization, one in ≤20 age group, and
two in the 51-65 and 66-80 age groups, respectively, resulting in 327 patients for LOS

39
analyses. The mean LOS from admission to discharge was 23.43 days (SD 19.38
days). The mean cost of hospitalization was 25106.00 Chinese Yuan (4030.37 USD)
(SD 30985.46 Chinese Yuan, 4976.23 USD). Detailed clinical outcome data,
including LOS, cost, death rate, infectious and non-infectious complications for
different age groups are shown in Table 2 for the patients identified by the NRS-2002
and SGA tools as being nutritionally at risk.
Eighty-one (24.40%) patients had infectious complications, which included
among other conditions wound infection, abdominal fistula infection, SIRS, positive
blood culture test, pneumonia, urinary tract infection, and abdominal infection.
Among the 81 participants with an infectious complication, 60 (74.07%) and 47
(58.02%) were detected as having nutritional risk by NRS-2002 and SGA,
respectively.
Twelve (3.31%) patients experienced non-infectious complications, including
among other conditions anemia and myocardial infarction. Among the 12 patients
with a non-infectious complication, 9 of them (75%) were classified as nutritional risk
by NRS-2002, while 5 of them (41.67%) were classified as nutritional risk by SGA.

40
The patients’ infectious, non-infectious complications and death are presented in the
Appendix for the patients identified by the NRS-2002 and SGA tools as being
nutritionally at risk. Inclusion of the interaction between the screening tool
(NRS-2002 or SGA) and categorized age did not improve the model for the outcomes
of LOS and cost (Table 3).
For the outcome of cost, there was no significant difference in the association of
one step of NRS-2002 and cost (B=0.127, p=0.002) and the association of one step of
SGA and cost (B=0.296, p=0.001). For the outcome of LOS, one step of SGA was
associated with a relatively large increase in LOS (B=0.272, p=0.001) compared to
one step in NRS-2002 (B=0.086, p=0.000). There were not large differences in the
predictive ability of the models with NRS-2002 or SGA for either outcome of LOS
and cost (Table 4).
The results of area under ROC curve analysis showed that the unfavorable
clinical outcome predicting capacity of NRS-2002 and SGA was generally better than
random guessing (Figure 2, Table 5). The comparison between the area under the
ROC curve values for the NRS-2002 and SGA indicated that NRS-2002 was not

41
different from SGA for predicting infectious complications and death. Depending on
the cut point guide for classifying the accuracy of a diagnostic test, NRS-2002 and
SGA had poor predicting capacity for infectious complications (0.60-0.70), and good
predicting capacity for death (0.80-0.90). For non-infectious complications,
NRS-2002 had fair predicting capacity (0.70-0.80), whereas SGA had poor predicting
capacity (0.50-0.60).

42
Chapter V: Discussion
Suitability of NRS-2002 and SGA
In contradiction to some misgivings about the routine use of SGA (Panwadee,
2004) nearly all the patients in PUMCH could complete the NRS-2002 (99.7%) and
SGA (99.4%) screening processes. Other studies have also found the vast majority of
patients capable and willing to complete the NRS-2002 and SGA (Chen et al.,2005;
Xiaokun et al., 2008; Kyle, 2003). The NRS-2002 can be completed in a few minutes,
but examiner training may be required to improve competency before using SGA
properly due to the subjective nature of the SGA including brief physical examination.
Further studies will assess and compare the amount of time spent on each tool, the
feedback about the questions from patients, and the preference for using either
screening tool from clinical dietitians or other related health providers.
Prevalence of nutritional risk
Nutritional risk among patients was high, measured at 59.04% for the NRS-2002
and 45.18% for the SGA, which was consistent with other studies, but in the upper
level of the nutritional risk ranges of 10-60% depending on the tool used (Bruun et al.

43
1999; Edington et al., 2000; Waitzberg et al., 2001; Cereceda et al., 2003; Van
Bokhorst-de van der Schueren et al., 2004; Valero et al., 2005; Xiaokun et al., 2009;
Mariana et al., 2010; Gout, 2009; Pirlich et al., 2006; Rasmussen, 2004). A possible
reason for the high prevalence of malnutrition might be the fact that PUMCH was a
referral hospital dealing with the most difficult diseases, so health condition of
patients who went there may have been more severe with higher levels of malnutrition
than patients with less severe conditions. Comparatively, Johns Hopkins Hospital in
US reported that the prevalence of nutritional risk was 51.0%, and the highest
nutritional risk was often observed in gastrointestinal department (Xiaokun et al.,
2008). Gastrointestinal diseases often cause decreased food intake and many patients
experience weight loss. Moreover, a Danish study showed a 57% malnutrition rate in
gastro-surgery departments, which was the highest among all hospital departments
(Rasmussen et al., 2004). Higher rates of malnutrition and nutritional risk in
gastrointestinal are logical as gastrointestinal diseases often decrease food intake and
experience weight loss. Another possible reason that the prevalence of malnutrition
risk was so high might be that gastrointestinal patients are more likely to self-report

44
their weight loss and reduced food intake when admitted to hospitals than patients
with other conditions (Xiaokun et al., 2009), therefore perhaps biasing a comparison
between GI and patients from other wards. Additionally, the inclusion of surgery
patients might be a reason for the high prevalence of nutritional risk. The high
prevalence of nutritional risk demonstrates the need for including nutrition screening
as a part of the admission process in Chinese hospitals, particularly among GI disease
patients.
A higher prevalence of nutritional risk was observed in older aged patients (>66
years), which was in agreement with previous studies (Marshall et al., 1999; Sullivan
et al., 1999; Velasco et al., 2011). Age is known to be a powerful contributor to the
development of malnutrition (Velasco et al., 2011). Surprisingly, higher malnutrition
rate was observed among patients ≤ 35 years compared to 36-50 and 51-65 years old
groups by both NRS-2002 and SGA, particularly in the ≤ 20 year old group. No data
was available in this study on known risk factors for malnutrition such as social
segregation, psychological factors, economic status, and lack of medical awareness
which may have played a role in this age group (Matthias et al., 2006, Waitzberg et al.,

45
2001). Moreover, an objective of the current study was to assess the prevalence of
nutritional risk and not the severity of malnutrition (Chen et al., 2005). It is possible
that the frequency of nutritional risk among younger adults was high, but their extent
of malnutrition was not as high as for older adults. Further study is needed to refine
screening instruments that assess malnutrition severity.
The nutritional risk prevalence detected by NRS-2002 was higher than that
detected by SGA for the total population and patients of different age groups. The
SGA focuses more on chronic or established nutrition risk instead of acute nutritional
changes compared to the NRS-2002, which may explain the discrepancy. For example,
the physical examination of SGA includes the changes of subcutaneous fat and
muscles, which are long term results of malnutrition. Acute cases of malnutrition may
not be recognized by the SGA (Christensson et al., 2002), which has been recognized
as an index of sickness instead of nutrition (Jeejeebhoy, 1990).
Selection bias in this study may have lead to an underestimate of the prevalence
of nutritional risk. Children, pregnant and breast-feeding women were excluded
because the aim of the study was to evaluate the application of nutritional screening

46
tool in an adult population, and those populations require specific nutritional
assessment tools. Patients with critical illness, those admitted directly to ICU, or those
who were unable to communicate were not included in the present study because there
was limited opportunity to interview them. Therefore, the nutritional risk as evaluated
in this study may not accurately reflect the overall situation of patients in
gastrointestinal department of PUMCH, most likely underrepresenting the nutritional
risk of the populations excluded from the current study.
Agreement of NRS-2002 and SGA
Moderate agreement was observed in this study between NRS-2002 and SGA
for the total population (κ statistic, 0.514), which was similar to results of previous
studies conducted by Kyle et al. (2006) and Velasco et al. (2011) with κ statistics of
0.48 and 0.620, respectively. When categorizing into age groups, the subgroups with
the population at and above 36 years old had moderate agreement between NRS-2002
and SGA. However, there was poor agreement between the two screening tools for
population less than 35 years old, which was driven by the ≤ 20 year old group. There
was slight agreement between NRS-2002 and SGA for ≤ 20 years old group. A small

47
sample of 14 patients ≤ 20 years old however limits much interpretation of the κ
statistic of that age group. Currently, there was no gold standard for nutritional risk
screening for adults of any age groups.
Clinical outcome predicting capacity
The objective of nutritional screening is to accurately identify those patients
who are more likely to experience malnourishment or risk of malnutrition and who
could benefit from nutritional therapy. This study evaluated the ability of the
NRS-2002 and SGA to predict clinical outcomes (LOS, death, infectious and
non-infectious complications) in Chinese patients with gastrointestinal disease, and
these widely used screening tools were significantly associated with clinical outcomes.
This study included hospitalized adult patients with a variety of diseases that were
treated both via non-surgical and surgical methods. To our knowledge, this is the first
study to evaluate the application of SGA among Chinese hospitalized patients.
In this study, positive relationships were demonstrated among nutritional risk
detected by NRS-2002 and SGA and LOS, and hospitalization cost. In other words,
patients with higher nutritional risk were more likely to experience more infectious

48
and non-infectious complications, longer LOS, higher cost, and death rate. NRS-2002
and SGA had generally good clinical outcome predicting capacity for death, infectious
and non-infectious complications (area under ROC curve > 0.50). There was not a
significant interaction between age and NRS-2002 and SGA, suggesting that
NRS-2002 or SGA did not perform much differently according to ages. However, the
R-square of each model was small, so it is possible that the relationship between
NRS-2002 or SGA and clinical outcome was non-linear and needs to be further
explored. Future studies, researchers should try other analysis methods to assess the
relationship among NRS-2002 or SGA and clinical outcomes. The association among
nutritional status, LOS, and cost is not necessarily a causal relationship; rather LOS
and cost might be a reflection of the severity of the underlying disease, economic
status, and even educational status of the patients and their families. Other factors
influencing clinical outcomes were not included in the data collection, such as the
severity of disease and types of nutritional support provided for patients. However,
because the purpose of this study was to compare the performance of NRS-2002 and
SGA, the failure to consider the severity of disease would not influence the

49
comparison of the two screening tools. The inclusion of disease severity greatly
complicates modeling approaches with many independent variables all at great risk of
colinearity. Some researchers have taken the severity of disease into account, by
classifying disease into different levels (Xiaokun et al., 2009), or just classifying as
severe disease and non-severe disease (Panwadee, 2005). Moreover, people who
found to have nutritional risk would get further NCP and nutrition intervention if
needed, which would influence the clinical outcomes. Therefore, it is possible that the
failure to consider the further nutrition intervention lead to the low R-square.
The linear regression for the association among screening tools and LOS and
cost showed that there were not large differences in the predictive capacity of the
models with NRS-2002 or SGA for either LOS or hospitalization cost. Even though
compared to NRS-2002, one step of SGA was associated with a relatively large
increase in cost, there were not large differences in the predictive ability of the models
with NRS-2002 or SGA for either outcome of LOS or cost. This could be explained
by the fact that NRS-2002 was designed for people from all age groups. In addition,
NRS-2002 took the influence of age into account in that when a patient was over 70

50
years old, the score would add 1.
The area under ROC for the association between screening tools and
complications and death revealed that both NRS-2002 and SGA had generally good
predictive capacity for complications (>0.500), and especially for death (>0.800). The
two screening tools did not perform differently for predicting infectious complications
and deaths, but NRS-2002 was more accurate than SGA to predict non-infectious
complications.
It is worth noting that NRS-2002 had identified a higher portion of patients at
nutritional risk compared to SGA (59.04%:45.18%). NRS was also more efficient
than SGA in predicting non-infectious complication. Previous studies conducted by
Mariana (2010) and Kyle et al. (2005) indicated that NRS-2002 had a good predictive
capacity for clinical outcomes even though it detects the lowest rate of nutritional risk.
The screening tools they compared were NRS-2002, Malnutrition Universal
Screening Tool (MUST), Nutritional Risk Index (NRI). even Kyle et al. (2005) study
included SGA, using it as gold standard to assess the specificity and sensitivity of the
other screening tools. The finding of this study corroborated those studies that

51
NRS-2002 might provide a best yield at the current criteria for nutritional risk
detection, even though further studies are needed to verify it.
Since inflammation is regarded as a significant factor which increase the
nutritional risk, and may influence the response to nutrition intervention and clinical
outcomes (National Alliance for Infusion Therapy and the ASPEN Public Policy
Committee and Board of Directors, 2010; Jensen et al., 2009; 2010). Failure to
recognize and address the inflammation problem is likely to progress to a severely
malnourished state (Cruz-Jentof, 2010; Han, 2011; Benton, 2011; Jensen et al., 2009;
2010). However, current screening tools fail to take inflammation into consideration,
which may increase the risk of unrecognized nutritional risk.
Conclusion
Although health care providers are starting to pay attention to the nutrition
problem of patients, the prevalence of nutritional risk was still high among
hospitalized GI disease patients (59.04% by NRS-2002, 45.18% by SGA), particularly
elder people at and above 65 years old (62.75% by NRS-2002, 50.00% by SGA).
Therefore, among Chinese patients, in particular GI disease patients, nutritional

52
screening should be provided when admission in order to improve the nutritional risk.
Clinical outcomes are influenced by malnutrition, and appropriate nutritional supports
are important to improve the unfavorable clinical outcomes. Both the NRS-2002 and
SGA worked well in this population of GI patients in China, and they did not perform
differently for patients of different ages. However, the relationship between
malnutrition and clinical outcomes should be further explored, since many other
factors including social factors, severity of diseases and nutrition intervention,
influence the clinical outcomes. There was a significant association between clinical
outcomes (LOS, hospitalization cost, complications and death) and nutritional risk by
NRS-2002 and SGA. There was no significant difference of LOS, cost, infectious
complications and death predicting capacity of NRS-2002 and SGA, however
NRS-2002 performed better in predicting non-infectious complications. As a result, in
the practice, dietitians could use either NRS-2002 or SGA for nutrition screening in
order to predict LOS, cost, infectious complications and death, and also provide
further NCP and nutrition intervention based on the result of nutrition screening.
However, if the health providers would like to predict non-infectious complications,

53
NRS-2002 is a better tool.
Since the role of inflammation plays in malnutrition and clinical outcomes,
researchers should take inflammation into consideration. Depending on the consensus
statement of the Academy of Nutrition and Dietetics/ ASPEN (Jane, 2012), the
following six factors is recommended for nutritional risk identification, including
insufficient energy intake, weight loss, muscle mass loss, subcutaneous fat loss, fluid
accumulation that may sometimes hide the underlying weight loss, and impaired
functional status which can be measured by hand grip strength. Moreover, when
making nutrition screening, the dietitians should recognize the degree of inflammatory
response that a patient may experience during illness, and find the appropriate
laboratory marker for inflammation.

54
Appendix
Table. Type of complications and nutritional risk
Patient characteristic/
Outcome
Tool used for nutritional assessment
n NRS-2002, % (n) SGA, % (n)
Infection complication 81 74.07% (60) 58.02% (47)
Wound infection 1 100% (1 ) 100% (1)
Abdominal fistula infection 1 0% (0) 0% (0)
SIRS 62 80.64% (50) 62.90% (39)
Blood culture examination 31 67.74% (21) 61.29% (19)
Pneumonia 21 66.67% (14) 61.70% (13)
Urinary tract infection 19 63.16% (12) 47.37% (9)
Abdominal infection 15 66.67% (10) 60.00% (9)
Others1 15 93.33% (14) 66.67% (10)
Non-infection complication 12 75% (9) 41.67% (5)
Anemia 3 66.67% (2) 33.33% (1)
Myocardial infarction 4 100% (4) 25% (1)
Others2
5 60% (3) 60% (3)
NRS-2002, Nutritional Risk Screening 2002; SGA, Subjective Global Assessment.
1. Other infection complications include fungal infections (n=1), oral (n=6), intestine (n=1), bile conduct
infections (n=1), blood infection (n=1), perianal abscess (n=1), tuberculosis (n=2), catheter infection (n=1),
and pressure sores (n=1).
2. Other non-infection complications include fistula (n=1), upper gastrointestinal bleeding (n=1), peritoneal
drainage (n=1), and renal failure (n=1), not clear (n=1).

55
Tables and Figures
Figure 1. Prevalence of nutritional risk for different age groups.
prevalence of nutritional risk
0.71420.7407
0.5588
0.468
0.588888889
0.916666667
0.5714
0.4814
0.4118 0.3936
0.466666667
0.75
0
0.1
0.2
0.3
0.4
0.5
0.6
0.7
0.8
0.9
1
≤20 21-35 36-50 51-65 66-80 81-95
age
prevalence
NRS-2002
SGA
NRS-2002, Nutrition Risk Screening 2002; SGA, Subjective Global Assessment

56
Table 1. Agreement between NRS-2002 and SGA: κ-index
Age
group n
Nutritional risk
detected by
NRS-2002 (%)
Nutritional risk
detected by
SGA (%)
κ-index
≤20 14 71.42 57.14 0.087
21-35 54 74.07 48.14 0.418
36-50 68 55.88 41.18 0.539
51-65 94 46.80 39.36 0.590
66-80 90 58.89 46.67 0.495
81-95 12 91.67 75.00 0.429
total 332 59.04 45.18 0.514
NRS-2002, Nutrition Risk Screening 2002; SGA, Subjective Global Assessment

57
Table 2. Detailed clinical outcomes for different age groups.
Age
group
n Nutritional risk
detected by NRS-2002
n(%)
Nutritional risk
detected by SGA
n(%)
LOS
(days)
Cost
(USD)
Death rate
(%)
Infectious
Complications
(%)
Non-infecti
ous
Complicatio
ns
≤20 14 10 (0.7142) 8 (0.5714) 31.23 4475.02 1 (7.14) 5 (35.71)
1 (7.14)
21-35 54 40 (0.7407) 26 (0.4814) 24.78 3801.31 0 35 (64.81) 2 (3.70)
36-50 68 38 (0.5588) 28 (0.4118) 26.90 4180.18 0 17 (25.00) 0
51-65 94 44 (0.4680) 37(0.3936) 24.41 4101.90 2 (2.13) 21 (22.34) 2 (2.13)
66-80 90 53 (0.5889) 42 (0.4667) 18.55 4106.66 2 (2.22) 21 (23.33) 7 (7.78)
81-95 12 11 (0.9167) 9 (0.7500) 17.58 2564.63 0 3 (25.00) 0
total 332 196 (0.5904) 150 (0.4518) 23.56 4030.51 5 (1.51) 81 (24.40) 12 (3.61)
LOS, length of hospital stay; NRS-2002, Nutritional Risk Screening 2002; SGA, Subjective Global Assessment.
Cut points: NRS-2002, at nutritional risk when the score is ≥3; SGA, at nutritional risk when the level is B or C.

58
Table 3. Model comparison and f-test.
Withdrawal assessment outcome Sum of
square
Degree of
freedom
F-test
NRS-2002, Full model LOS 28.678 7 0.366
NRS-2002, Saturated model LOS 32.212 10
SGA, full model LOS 30.798 7 0.289
SGA, Saturated model LOS 33.720 10
NRS-2002, Full model COST 69.954 7 0.234
NRS-2002, Saturated model COST 75.229 10
SGA, full model COST 67.084 7 0.289
SGA, Saturated model COST 74.167 10
Full model included categorized age, gender, infectious and non-infectious complications.
NRS-2002: Nutrition risk screening 2002; SGA: Subjective global assessment; LOS: Length of stay
Table 4. Relationship between nutritional risk and LOS and cost.
Outcome assessment B t p-value R square
LOS NRS-2002 0.086 3.061 0.002 0.130
SGA 0.272 3.613 0.001 0.140
Cost NRS-2002 0.127 3.788 0.000 0.198
SGA 0.296 3.309 0.001 0.190
NRS-2002: Nutrition risk screening 2002; SGA: Subjective global assessment; LOS: Length of stay

59
Figure 2. Nutritional screening tools and evaluated clinical outcomes including
infectious and non-infectious complications, and death.
Infectious complications: NRS-2002 SGA
Non-infectious complications: NRS-2002 SGA
Death: NRS-2002 SGA
The most effective tool in predicting unfavorable clinical outcomes is that with the largest area under the receiver
operating characteristic curve. NRS-2002, Nutritional Risk Screening 2002; SGA, Subjective Global Assessment.
0.615
0.783
0.810 0.846
0.552
0.600

60
Table 5. Clinical outcomes and area under ROC curve values of the two nutritional
screening tools according to evaluated outcomes
Screening
tool
Clinical outcomes (area under ROC curve)
Infectious
complications
Non-infectious
complications
Death
NRS-2002 0.615 0.738 0.810
SGA 0.600 0.552 0.846
NRS-2002, Nutritional Risk Screening 2002; SGA, Subjective Global Assessment.

61
61
Reference:
ADA’s definition for nutrition screening and assessment. JADA. 1994;94:838-839.
Allison SP. Malnutrition, disease and outcome. Nutrition. 2000;16:590-593.
American Society for Parenteral and Enteral Nutrition (ASPEN). Guidelines for the use of
parenteral and enteral nutrition in adult and pediatric patients. JPEN. 2002;26(I Suppl):
1SA-9SA, 18SA-24SA.
Amaral TF, Matos LC, Trvares MM, Subtil A, Martins R, Nazare M, et al. The economic
impact of disease-related malnutrition at hospital admission. Clin Nutr. 2007;26:778-84.
Anthony PS. Nutrition screening tools for hospitalized patients. Nutr Clin Pract. 2008;
23:373-382.
Barker LA, Gout BS, Crowe TC. Hospital malnutrition: Prevalence, identification and impact
on patients and the healthcare system. International Journal of Environmental Research
and Public Health. 2011;8(2), 514-527.
Baker JP, Detsky AS, Wesson DE, et al. Nutritional assessment: a comparison of clinical
judgement and objective measurements. New Engl J Med. 1991;306:969-72.
Baldwin C, Parson T J. Dietary advice and nutrition supplements in the management of
ilness-related malnutrition: a systematic review. Clin Nutr. 2004;23:1267-1279.
Bauer JM, Vogl T, Wicklein S, Trogner J, Muhlberg W, Sieber CC. Comparison of the Mini
Nutritional Assessment, Subjective Global Assessment, and Nutritional Risk Screening
(NRS-2002) for nutritional screening and assessment in geriatric hospital patients. A
Gerontol Geriatr. 2005;38:322-327.
Benton MJ, Whyte MD, Dval BW. Sarcopenic obesity: Strategies for management. Am J
Nurs. 2011;111(12):38-46.
Bouchard J, Presse N, Ferland G. Association between aspiration pneumonia and malnutrition
in patients from active geriatric units. Can J Diet Pract Res. 2009;70(3): 152-154.
Braunschweig, C, Gomez, S, Sheean, PM. Impact of declines in nutritional status on
outcomes in adult patients hospitalized for more than 7 days. Journal of the American
Dietetic Association.2000;100(11),1316-1322.
Brown K. Improving intakes. Nurs Times. 1991;87:64-68.
Bruun L, Bosaeus I, Bergstad I, Nygaard K. Prevalence of malnutrition in surgical patients:
evaluation of nutritional support and documentation. Clin Nutr.1999;18, 141-147.
Butterworth C E. The skeleton in the hospital closet. Nutrition Today.1974;9:4-8.

62
62
Buzby G P, Mullen J L, Mathews D C, Hobbs C L, Rosato E F. Prognostic nutritional index
in gastrointestinal surgery. Am J Surg. 1980;139:160-167.
Cereceda C, Gonzalez I, Antolin FM, Garcia Figueiras P, Tarrazo Espineira R, Suarez Cuesta
B, et al. Detection of malnutrition on admission to hospital. Nutr Hosp.
2003;28:95-100.
Chandra R K, Kumary S. Effects of nutrition on the immune system. Nutrition.
1994;207-210.
Chen W, Jiang Z, Zhang Y. Evaluation of European nutritional risk screening method in
Chinese hospitalized patients practices. J Clin Nutr. 2005;13:137-41.
Chima CS, Barco K, Dewitt JLA, Maeda M, Teran JC, Mullen KD. Relationship of
nutritional status to length of stay, hospital costs, and discharge status of patients
hospitalized in the medicine service. Aliment Pharmacol Ther. 1997;11:975-978.
Christensson L, Unosson M, Ek AC. Evaluation of nutritional assessment techniques in
elderly people newly admitted to municipal care. Eur J Clin Nutr. 2002;56:810-8.
Committee of Ministers. Resolution ResAP(2003)3 on Food and Nutrition Care in Hospitals.
Strasbourg: Counsel of Europe, 2003.
Correia, MI, Campos, A C L. Prevalence of hospital malnutrition in Latin America: Nutrition.
2003;19(10), 823-825.
Cruz-Jentoft AJ, Baeyens JP, Bauer JM, et al. Sarcopenia: Consensus on definition and
diagnosis. Report of the European Working Groups on sarcopenia in older people. Age
and Aging. 2010;39(4):412-423.
Detsky AS, Mclaughlin JR, Baker JP, Johnston N, Whittaker S, Mendleson RA, et al. Whagt
is subjective global assessment of nutrition status? J Parenter Enteral Nutr.
1987;11:8-13.
Edington J, Boorman J, Durrant ER, Perkins A, Giffin CV, James R, et al. Prevalence of
malnutrition on admission to four hospitals in England. The malnutrition prevalence
group. Clin Nutr. 2000;19,191-195.
Efthimiou J, Fleming J, Gomes C, Spiro SG. The effect of supplementary oral nutrition in
poorly nourished patients with chronic obstructive pulmonary disease. Am Rev Resp Dis.
1988;137:1075-1082.
Elia M, Zellipour L, Stratton RJ. To screen or not to screen for adult malnutrition? Clin Nutr.
2005;24,867-884.

63
63
Ferguson M, Capra S. Nutrition screening practices in Australian hospitals. Aust J Nutr Diet.
1998;55:157-159.
Funk CL, Ayton CM. Improving malnutrition documentation enhances reimbursement. J Am
Diet Assoc. 1995;95:468-475.
Gallagher-Allred CR, Voss AC, Finn SC, McCamish MA. Malnutrition and clinical outcomes:
the case for medical nutrition therapy. J Am Diet Assoc. 1996;96(4):361-366.
Gheroghe C, Vadan R, Saftoiu A, Fraticiu, Bancila I, Diculescu M, et al. Prevalence of
malnutrition in patients referred to tertiary gastroenterology assistant in Romanial: A
multicentric study. Clinical Nutrition Supplements. 2010;5(2),166.
Gout BS., Barker LA., Crowe C. Malnutrition identification, diagnosis and dietetic referrals:
Are we doing a good enough job? Nutr Diet. 2009;66:206-211.
Green SM, Watson R. Nutrition screening and assessment tools for older adults: literature
review. J Adv Nurs. 2006;54,447-490.
Guohao W, Zhonghua L, Zhaohan W, Zhaoguang W. Perioperative artificial nutrition in
malnourished gastrointestinal cancer patients. World J Gastroenterol. 2006;12
(15):2441-2444.
Han TS, Tajar A, Lena MF. Obesity and weight management in the elderly. Br Med Bull.
2011;97:169-196.
Hill GL, Haydock DA. Impaired wound healing in surgical patients with varying degrees of
malnutrition. J Parenter Enteral Nutr. 1989;10:550-554.
Holmes S. The effects of undernutrition in hospitalized patients. Nurs Stand. 2007;22:35-38.
Isabel C, Dan L. Waitzberg. The impact of malnutrition on morbidity, mortality, length of
hospital stay and costs evaluated through a multivariate model analysis. Clin Nutr.
2003;22:235-239.
Jane VW, Peggi G, Gordon J, Ainsley M, Marsh S, the Academy Malnutrition Work Group,
the A.S.P.E.N. Malnutrition Task Force, and the A.S.P.E.N. Board of Directors.
Consensus Statement of the Academy of Nutrition and Dietetics/ American Society for
Pareteral and Enteral Nutrition: Characteristics recommended for the identification and
documentation of adult malnutrition (undernutrition). Journal of the Academy of
Nutrition and Dietetics. 2012;2212-2272.
Jeejeebhoy K N. Nutritional assessment. Nutrition. 2000;16:585-589.
Jeejeebhoy KN. Assessment of nutritional status. Philadelphis: Saunders, W.B. 1990.

64
64
Jensen GL, Bistrian B, Roubenoff R, Heimburger DC. Malnutrition syndromes: A conundrum
vs continuum. JPEN J Patenter Enteral Nutr. 2009;33(6):710-716.
Jensen GL, Mirtallo J, Compher C, et al. Adult starvation and disease-related malnutrition: A
rational approach for etiology-based diagnosis in the clinical practice setting from the
International Consensus Guideline Committee. JPEN J Patenter Enteral Nutr.
2010;34(2):156-159.
Jiang ZM, Chen W, Zhan WH, Jiang H, Cai W, Zhang ST, et al. Parenteral and enteral
nutrition application in west, middle and east China: A multi-center investigation for
15098 patients in 13 metropolitans using Nutrition Risk Screening 2002 tool (abstract).
Clin Nutr. 2007;2 (supplement 2):133-134.
Johansen N, Kondrup J, Plum LM, Bak L, Norregaard P, Bunch E, et al. Effect of nutritional
support on clinical outcome in patients at nutritional risk. Clin Nutr. 2004;23:539-50.
Keys, A., Brozek, J., Henschel, A., Mickelsem, O. & Taylor, H.L. The biology of Human
Starvation, Vols. I-II. University of Minnesota Press, Minnesota, MN.1950.
Kondrup J, Allison SP, Elia M, Vellas B, Pauth M ESPEN guidelines for nutrition screening
2002. Clin Nutr. 2003;22:415-421.
Kondrup J, Johansen N, Plum LM, Bak L, Larsen IH, Martinsen A, et al. Incidence of
nutritional risk and causes of inadequate nutritional care in hospitals. Clin Nutr. 2002;
21:461-468.
Kondrup J, Rasmussen H H, Hamberg O, Stanga Z. Nutritional risk screening (NRS-2002): A
new method based on analysis of controlled clinical traials. Clin Nutr. 2003;22:321-336.
Kruizenga HM, Van Tulder MW, Seidell JC, Thijs A, Ader HJ, Van Bokhorst-de van der
Schueren MA. Effectiveness and cost-effectiveness of early screening and treatment of
malnourished patients. Am J Clin Nutr. 2005;82:1082-1089.
Kubrack C, Jensen L. Malnutrition in acute care patients. Int J Nurs Stud.
2007;44:1036-1054.
Kuzu MA, Terzioglu H, Cenc V, Erkek AB, Ozban M, Sonyurek P, et al. Preoperative
nutritional risk assessment in predicting postoperative outcome in patients undergoing
major surgery. World J Surg. 2006;30:378-390.
Kyle UG, Pirlich M, Scheutz T, Luebke H J, Lochs H, Pichard C. Prevalence of malnutrition
in 1760 patients at hospitial admission: a controlled population study of body
composition. Clin Nutr. 2003;22:473-481.

65
65
Kyle UG, Genton L, Pichard C. Hospital length of stay and nutritional status. Curr Opin Clin
Nutr Metab Care. 2005;8:397-402.
Landis JR, Koch GG. The measurement of observer agreement for categorical data.
Biometrics. 1977;33:159-74.
Lisa AB, Belinda SG, Timothy CC. Hospital malnutrition: Prevalence, identification and
impact on patients and the healthcare system. Int J Environ Res Public Health.
2011;8(2):514-527.
Ljungqvist O, Nygren J, Thorell A. Insulin resistance in elective surgery, Surgery.
2000;128:757-760.
Lobo G, Ruiz MD, Perez de la Cruz AJ. Hospital malnutrition: relation between the hospital
length of stay and the rate of early readmissions. Med Clin (Barc). 2009;132: 377-384.
Marshall JA, Lopez TK, Shetterly SM, Morgenstern NE, Baron A, Swenson C, et al.
Indicators of nutritional risk in a rural elderly Hispanic and non-Hispanic white
population: San Luis valley health and aging study. J Am Diet Assoc. 1999;99:315-22.
Matthias P, Tatjana S, Kristina N, Sylvia G, Heinrich JL, Stephan CB, et al. The German
hospital malnutrition study. Clinical Nutrition. 2006;25(4):563-572.
Mariana R, Maria CG, Maria CD, Mariana N, Melina C, Patricia M, et al. Comparison of
nutritional risk screening tools for predicting clinical outcomes in hospitalized patients.
Nutrition. 2010;26(7):721-726.
McKee JS. Protein-caloric malnutrition: The skeleton in the litigation closet. J Legal Nurse
Consult. 2006;17: 12-16.
McWhirter. J P., & Pennington C R. Prevalence of patients at nutritional risk in Danish
hospitals. BMJ. 1994; 308, 945-948.
Middleton MH, Nazarenko G, Nivison-Simith I, Smerdely P. Prevalence of malnutrition and
12-month incidence of mortality in two Sydney teaching hospitals. Int Med J.
2001;31:455-461.
Naber, T H; Schermer, T, deBree, A; Nusteling, K; Eggink, L; Kruimel, JW; Bakkeren, J; van
Heereveld, H; Katan, M.B. Prevalence of malnutrition in nonsurgical hospitalized
patients and its association with disease complications. Am J Clin Nutr.
1997;66,1232-1239.
National Alliance for Infusion Therapy and the American Society for Parenteral and Enteral
Nutrition Public Policy Committee and Board of Directions. Disease- related

66
66
malnutrition and enteral nutrition therapy: A significant problem with a cost-effective
solution. Nutr Clin Pract. 2010;25(5):548-554.
Norman K, Pichard C, Lochs H, Pirlich M. Prognostic impact of disease-related malnutrition.
Clin Nutr. 2008;27:5-15.
Norman K, Schutz T, Keps M J, Lubke H, Lochs H, Pirlich M. The subjective global
assessment reliably identifies malnutrition-related muscle dysfunction. Clin Nutr,
2005;24(1), 143-150.
Odelli C, Burgess D, Bateman L, Hughes A, Achkand S, Gillies J, et al. Nutrition support
improves patient outcomes, treatment tolerance and admission characteristics in
esophageal cancer. Clin Oncol (R Coll Radiol). 2005;17,639-645.
O’Flynn J, Opeake H, Hickson M, Foster D, Frost G. The prevalence of malnutrition in
hospitals can be reduced: Results from three consecutive cross-sectional studies. Clin
Nutr. 2005;24,1078-1088.
Ottery D. Cancer cachexia: prevention, early diagnosis and management. Cancer Practice.
1994; 2(2):123-131.
Panwadee P, Pinmanee R, Yupapin S, Panuwat L, Kanit S. Nutrition screening tools and the
prediction of postoperative infectious and sound complications: comparison of methods
in presence of risk adjustment. Nutrition. 2005;21:691-697.
Pirlich M, Schutz T, Norman K, Gastell S, Lukbe H J, Guldenzoph H, Hahn K, et al. The
German hospital malnutrition study. Clin Nutr. 2006;25:563-572.
Rasmussen H H., Kondrup M, Staun M, Ladefoged K, Kristensen H., & Wengler A.
Prevalence of patients at nutritional risk in Danish Hospitals. Clin Nutr.
2004;23:1009-1015.
Robinson G, Goldstein M, Levin GM. Impact of nutritional status on DRG length of stay. J
Parenter Enteral Nutr.1987;11:49-51.
Scrimshaw NS, DanGiovanni JP. Synergism of nutrition, infection and immunity, an
overview. J Nutr. 1997;133: 316-321.
Smith P E, Smith A E. High-quality nutritional interventions reduce costs. Healthc Financ
Manage. 1997;51:66-69.
Smith RC, Hartemink R. Improvement of nutritional measures during preoperative parenteral
nutrition in patients selected by the prognostic nutritional index: a randomized
controlled trial. JPEN. 1988;12:587-91.

67
67
Seehusen A. Clinical pathways: effects on practice, outcomes, and costs. Am Fam Physician.
2010;82(11):1338-1339.
Sorensen J, Kondrup J, Prokopowicz J, Schiesser M, Krahenbuhl L, Meier R, et al.
EuroOOPS: an international multicenter study to implement nutritional risk screening
and evaluate clinical outcome. Clin Nutr. 2008;27:340-349.
Stanga Z, Field J, Iff S, Stucki A, Lobo DN, Allison SP. The effect of nutritional management
on the mood of malnourished patients. Clin Nutr. 2007; 26,379-382.
Stratton RJ, Hackston A, Longmore D, Dixon R, Price S, Stroud M, et al. Malnutrition in
hospital outpatients and inpatients: prevalence, concurrent validity and ease of use of
the ―malnutrition‖ universal screening tool‖ (MUST) for adults. Br J Nutr.
2004;92:799-808.
Sullivan DH, Sun S, Walls RC. Protein-energy undernutrition among elderly hospitalized
patients: a prospective study. J Am Diet Assoc. 1999;281:2013-9.
Sungurtekin H, Sungurtekin U, Hanci V, Erdem E. Comparison of two nutrition assessment
techniques in hospitalized patients. Nutrition. 2004;20:428-32.
Tian J, Chen JS. Nutritional status and quality of life of the gastric cancer patients in Changle
County of China. World J Gastroenterol. 2005;11:1582-1586.
Thomas DR, Zdrowski CD, Wilson MM, Conright KC, Lewis C, Tariq S, Morley JE.
Malnutrition in subacute care. Am J Clin Nutr. 2002,75(2):308:313.
Valero MA, Diez L, El Kadaoui N, Jimenez AE, Rodriguez H, Leon M. Are the tools
recommended by ASPEN and ESPEN comparable for assessing the nutritional status?
Nutr Hosp. 2005; 20:259-267.
Van Der Hulst R R, Von Meyenfeldt M F, Van Kreel B K. Gut permeability, intestinal
morphology, and nutritional depletion. Nutrition. 1998;14: 1-6
Van Bokhorst-de van der Schueren MA, Klinkenberg M, Thije A. Profile of the malnourished
patient. Eur J Clin Nutr. 2004;59,1129-1135.
Velasco, C., García, E., Rodríguez, V., Frias, L., Garriga, R., Álvarez, J., et al. Comparison of
four nutritional screening tools to detect nutritional risk in hospitalized patients: A
multicentre study. European Journal of Clinical Nutrition. 2011;65(2):269-74.
Veterans Affairs Total Parenteral Nutrition Cooperative Study Group (VATPNCSG).
Perioperative total parenteral nutrition in surgical patients. New Engl J Med.
1991;324:525-32

68
68
Waitzberg DL, Caiaffa WT, Correia MI. Hospital malnutrition: the Brazilian national survey
(IBRANUTRI): a study of 4000 patients. Nutrition. 2001;17,573-580.
Weiping G, Guangsheng O, Xi L, Jianglong H, Jiangpei L, Hongbo W. Screening of the
nutritional risk of patients with gastric carcinoma before operation by NRS 2002 and its
relationship with postoperative results. Journal of Gastroenterology and Hepatology.
2010;25:800-803.
Williamson DA, White MA, York-Crowe E, Stewart, TM. Congnitive-behavioral theories of
eating disorders. Behav. Modif. 2004;28:711-738.
Winter T A; Lemmer E; O’Keefe J; Ogden J M. The effect of severe undernutrition, and
subsequent refeeding on digestive function in human patients. Eur J Gastroenterol
Hepatol. 2001;12:191-196.
Wu GH, Liu ZH, Zheng LW, Quan YJ, Wu ZH. Prevalence of malnutrition in general surgical
patients: evaluation of nutritional status and prognosis. ZhonghuaWaiKeZaZhi. 2005;43
(11) 693-696.
Xiaokun L, Zhuming J, Marie TN, Xinjuan W, Haiyan Z, Yining Z, et al. Nutritional risk,
malnutrition (undernutrition), overweight, obesity and nutrition support among
hospitalized patients in Beijing teaching hospitals. Asia Pac J Clin Nutr.
2009;18(1):54-62.
Xiaokun L, Zhuming J, Nolan MT, Efron DT, Kondrup J. Comparative survey on nutritional
risk and nutritional support between Beijing and Baltimore teaching hospitals. Nutrition.
2008;24:969-76.
Zhang S, Chen W, Kong L, Li L, Lu F. Analysis of cancer incidence and mortality from 30
cancer registries in China, 1998-2002. Bulletin of Chinese Cancer. 2006;7(15):430-448.
Zou KH, O’Malley AJ, Mauri L. Receiver-operating characteristic analysis for evaluation
diagnostic tests and predictive models. Circulation. 2007;115(5):654-657.
Zweig MH, Campbell G. Receiver-operating characteristic (ROC) plots: a fundamental
evaluation tool in clinical medicine. Clin Chem. 1993; 39:561-77.

69
69
VITA
Name of author: Fang Wang
Place of birth: Tianjin, China
Date of birth: May 23, 1988
Graduate and undergraduate schools attended:
Tianjin Medical University, Tianjin, China
Degrees Awarded:
Bachelor of Medicine, 2012, Tianjin Medical University
Professional experience:
Internship, Peking Union Medical College Hospital, 2013
Tianjin the Third Hospital, 2011-2012