NUTRIENT METABOLISM IN FISH IN ELEVATED WATER … · concentratie van 3-hydroxyisovalerylcarnitine,...
48
GHENT UNIVERSITY FACULTY OF VETERINARY MEDICINE Academic year 2015 – 2016 NUTRIENT METABOLISM IN FISH IN ELEVATED WATER TEMPERATURE by Katrien QUINTELIER Promoters: F. Geda Research Report as a part Prof. G. Janssens of the Master’s Dissertation © 2016 Katrien Quintelier
-
Upload
nguyenthuan -
Category
Documents
-
view
215 -
download
0
Transcript of NUTRIENT METABOLISM IN FISH IN ELEVATED WATER … · concentratie van 3-hydroxyisovalerylcarnitine,...
GHENT UNIVERSITY
FACULTY OF VETERINARY MEDICINE
Academic year 2015 – 2016
NUTRIENT METABOLISM IN FISH IN ELEVATED WATER TEMPERATURE
by
Katrien QUINTELIER
Promoters: F. Geda Research Report as a part
Prof. G. Janssens of the Master’s Dissertation
© 2016 Katrien Quintelier


Universiteit Gent, its employees and/or students, give no warranty that the information provided in this
thesis is accurate or exhaustive, nor that the content of this thesis will not constitute or result in any
infringement or third-party rights.
Universiteit Gent, its employees and/or students do not accept any liability or responsibility for any use
which may be made of the content or information given in the thesis, nor for any reliance which may
be placed on any advice or information provided in this thesis.
GHENT UNIVERSITY
FACULTY OF VETERINARY MEDICINE
Academic year 2015 – 2016
NUTRIENT METABOLISM IN FISH IN ELEVATED WATER TEMPERATURE
by
Katrien QUINTELIER
Promoters: F. Geda Research Report as a part
Prof. G. Janssens of the Master’s Dissertation
© 2016 Katrien Quintelier
ACKNOWLEDGEMENTS – DANKWOORD
Firstly, I would like to thank my promoters Fikremariam and professor Janssens. They suggested the
subject and I am grateful that I was able to learn more about this. I also want to thank them for the
guidance and the correction of the final work.
Secondly, I would like to express my thanks to Andrea to give me the trust and skills to contribute to
her research.
Mama en papa, bedankt voor alles. Bedankt voor de warme thuis, bedankt voor de onvoorwaardelijke
steun, bedankt voor élke aanmoediging bij élk examen. Zonder jullie zou ik nooit de (bijna) dierenarts
zijn die ik nu ben.
Lieve meter, dankjewel dat je er altijd voor mij bent. Als het even niet meer lukte met blokken of
schrijven, waren er jouw telefoontjes, bezoekjes, koffiemomentjes en verwennerij om me weer
erbovenop te krijgen.
Thomas en Joris, grote broers, ik ben zo blij dat ik jullie heb. Merci dat jullie mij verdragen in
examenperiodes en er voor mij zijn als ik jullie nodig heb.
Tot slot zou ik graag mijn vrienden willen bedanken, Lise en Wendy in het bijzonder, voor alle steun
de afgelopen jaren. Samen hebben we ondervonden wat het is om student te zijn. We hebben zware
perioden beleefd, maar ik ben ervan overtuigd dat vooral de mooie herinneringen die we samen
gemaakt hebben ons zullen bijblijven.
TABLE OF CONTENTS
1. LIST OF ABBREVIATIONS ............................................................................................................1
2. SAMENVATTING ............................................................................................................................2
3. ABSTRACT .....................................................................................................................................4
4. INTRODUCTION – LITERATURE REVIEW ...................................................................................64.1. FOOD CRISIS ...............................................................................................................................64.2. STATUS OF GLOBAL AQUACULTURE...............................................................................................84.3. GLOBAL WARMING .....................................................................................................................104.4. IMPORTANCE OF CLIMATE CHANGE ON AQUATIC ORGANISMS.........................................................11
4.4.1. Increased temperature......................................................................................................114.4.2. Decreased dissolved oxygen............................................................................................124.4.3. Increased toxicity of pollutants..........................................................................................13
4.5. NUTRIENT METABOLISM IN FISH IN ELEVATED WATER TEMPERATURE .............................................144.5.1. Factors in the diet .............................................................................................................144.5.2. Effect of the species .........................................................................................................17
5. MATERIALS AND METHODS ......................................................................................................195.1. EXPERIMENTAL ANIMALS ............................................................................................................195.2. TEST FACILITY AND HOUSING ......................................................................................................195.3. FEEDING PROTOCOL AND FEED COMPOSITION..............................................................................195.4. MONITORING OF THE WATER AND SET-UP OF ELEVATED TEMPERATURE.........................................205.5. FEED INTAKE MEASUREMENT......................................................................................................215.6. SAMPLING .................................................................................................................................215.7. ANALYSIS..................................................................................................................................225.8. STATISTICAL ANALYSIS...............................................................................................................22
6. RESULTS ......................................................................................................................................24
7. DISCUSSION.................................................................................................................................30
8. REFERENCES ..............................................................................................................................33
1
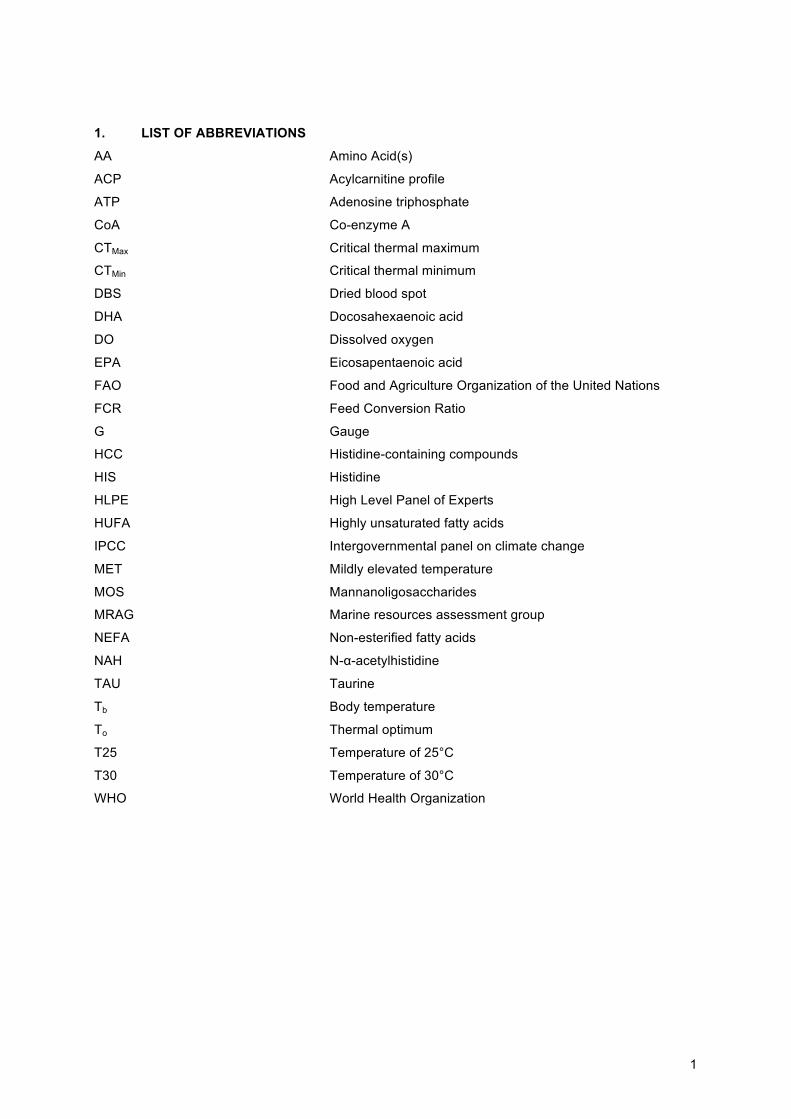
1. LIST OF ABBREVIATIONS
AA Amino Acid(s)
ACP Acylcarnitine profile
ATP Adenosine triphosphate
CoA Co-enzyme A
CTMax Critical thermal maximum
CTMin Critical thermal minimum
DBS Dried blood spot
DHA Docosahexaenoic acid
DO Dissolved oxygen
EPA Eicosapentaenoic acid
FAO Food and Agriculture Organization of the United Nations
FCR Feed Conversion Ratio
G Gauge
HCC Histidine-containing compounds
HIS Histidine
HLPE High Level Panel of Experts
HUFA Highly unsaturated fatty acids
IPCC Intergovernmental panel on climate change
MET Mildly elevated temperature
MOS Mannanoligosaccharides
MRAG Marine resources assessment group
NEFA Non-esterified fatty acids
NAH N-α-acetylhistidine
TAU Taurine
Tb Body temperature
To Thermal optimum
T25 Temperature of 25°C
T30 Temperature of 30°C
WHO World Health Organization

2
2. SAMENVATTING
INLEIDING – LITERATUURSTUDIE: Er wordt verwacht dat de wereldpopulatie tegen 2050 zal
toenemen tot ongeveer 9 miljard inwoners en dat de hongersnood die er vandaag al is, nog verder zal
toenemen. Men stelt vast dat de landgebonden voedselproductie gelimiteerd is en dat men zich voor
extra productie zal moeten wenden tot het water dat men ter beschikking heeft. Aquatische producten
zijn gekend voor hun hoge voederomzettingsefficiëntie en hun nutritionele waarde. Dit alles maakt van
aquacultuur een veelbelovende voedingsindustrie. Naast een dreigende hongersnood is
klimaatverandering ook een grote bedreiging voor de mensheid. Sterker nog: klimaatverandering zal
de hongersnood ook nog eens negatief beïnvloeden. Klimaatverandering beïnvloedt aquatische
organismen via verschillende wegen. Ten eerste is er de verhoogde temperatuur van het water op
zich. Tot een bepaald niveau is opwarming voordelig voor het organisme : het verbetert de prestaties.
Maar temperaturen hoger dan de optimale temperatuur zijn nadelig voor de vissen op vele
verschillende manieren. Ten tweede is er een verlaagde zuurstofconcentratie in het water. Dit is het
gevolg van de inverse relatie tussen temperatuur van het water en concentratie opgeloste zuurstof.
Onvoldoende zuurstofvoorziening zal een impact hebben op verschillende fysiologische processen in
de vis, onder andere een verminderd zwemvermogen en immunosuppressie. Ten derde zal
klimaatopwarming leiden tot een verhoogde toxiciteit van verontreinigingen. Dit gebeurt door enerzijds
de opname te verhogen, onrechtstreeks door het boosten van het metabolisme, en anderzijds door de
toxiciteit van de verontreinigingen zelf te verhogen. De impact van klimaatopwarming op vissen hangt
af van twee grote factoren. Aan de ene kant is er de samenstelling van het dieet met vetten,
koolhydraten en eiwitten als belangrijkste ingrediënten. Aan de andere kant blijkt ook de soort van de
vis van belang te zijn. Verschillen in stapeling van aminozuren en imidazole-houdende moleculen in
spieren tussen verschillende vissoorten wijzen op verschillen in de respons van het metabolisme.
Onze hypothese was dat de verschillen in de stapeling van aminozuren en imidazole-houdende
moleculen in spieren een verband heeft met de vetopslag en met de verschillen in reactie op een
verhoogde watertemperatuur bij vissoorten. Door middel van het experiment wilden we evalueren hoe
de hoge concentraties aminozuren en imidazole-houdende moleculen die in de spieren opgeslagen
zijn een invloed zouden kunnen hebben op het metabolisme in een situatie waarbij het
aminozuurkatabolisme wordt gestimuleerd, namelijk bij een verhoogde watertemperatuur.
MATERIAAL EN METHODE: Zeventien Nijltilapia (Oreochromis niloticus) en dertien karpers
(Cyprinus carpio) werden individueel en willekeurig toebedeeld aan een aquarium. Deze aquaria
werden gehouden op ofwel een referentietemperatuur (25°C) (“T25”) of een licht verhoogde
temperatuur (30°C) (“T30”). Alle vissen werden hetzelfde experimenteel dieet gevoederd, 1,5% van
het lichaamsgewicht, verdeeld over twee voedermomenten per dag. De vissen werden na de
veertiendaagse experimentele periode geëuthanaseerd door middel van een overdosis benzocaine.
Er werden bloedstalen genomen om de gehaltes van acylcarnitines en niet-veresterde verzuren te
bepalen. N-α-acetylhistidine, histidine, afzonderlijke vrije aminozuren en de totale vrije aminozuren
3
concentraties werden gemeten in stalen spierweefsel. Alle berekeningen, statistische analyses en
grafieken kwamen tot stand door gebruik van SPSS versie 20.
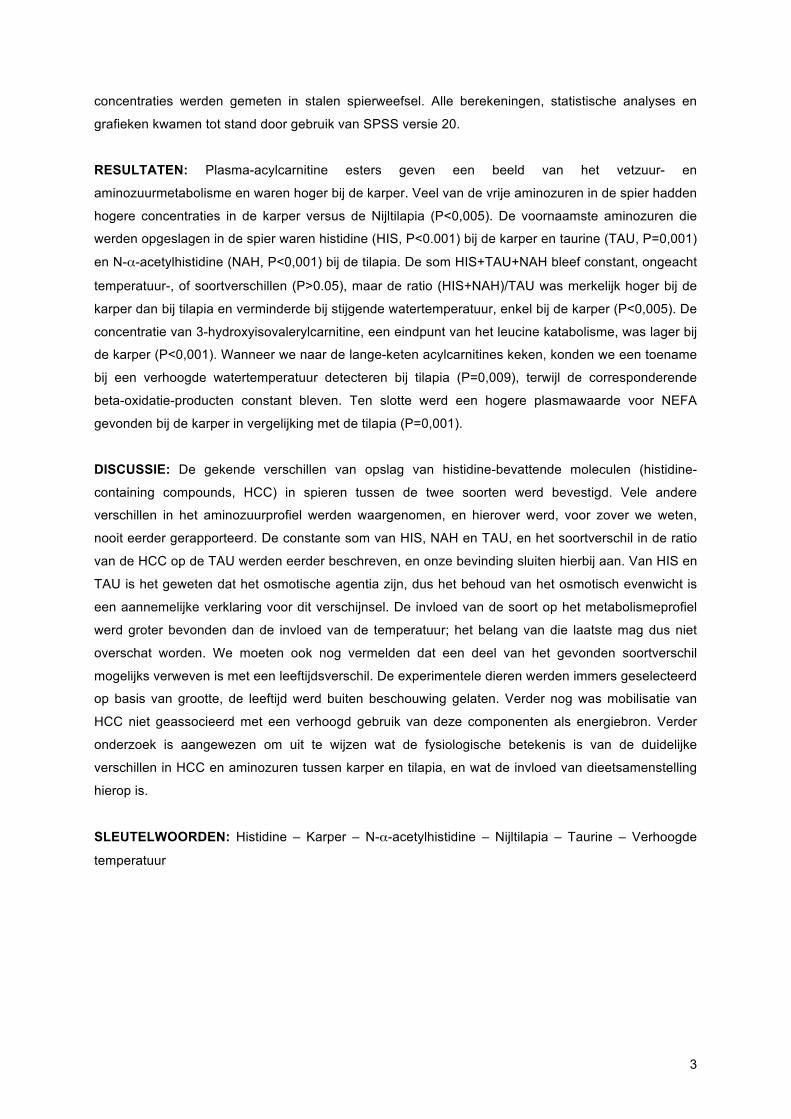
RESULTATEN: Plasma-acylcarnitine esters geven een beeld van het vetzuur- en
aminozuurmetabolisme en waren hoger bij de karper. Veel van de vrije aminozuren in de spier hadden
hogere concentraties in de karper versus de Nijltilapia (P<0,005). De voornaamste aminozuren die
werden opgeslagen in de spier waren histidine (HIS, P<0.001) bij de karper en taurine (TAU, P=0,001)
en N-α-acetylhistidine (NAH, P<0,001) bij de tilapia. De som HIS+TAU+NAH bleef constant, ongeacht
temperatuur-, of soortverschillen (P>0.05), maar de ratio (HIS+NAH)/TAU was merkelijk hoger bij de
karper dan bij tilapia en verminderde bij stijgende watertemperatuur, enkel bij de karper (P<0,005). De
concentratie van 3-hydroxyisovalerylcarnitine, een eindpunt van het leucine katabolisme, was lager bij
de karper (P<0,001). Wanneer we naar de lange-keten acylcarnitines keken, konden we een toename
bij een verhoogde watertemperatuur detecteren bij tilapia (P=0,009), terwijl de corresponderende
beta-oxidatie-producten constant bleven. Ten slotte werd een hogere plasmawaarde voor NEFA
gevonden bij de karper in vergelijking met de tilapia (P=0,001).
DISCUSSIE: De gekende verschillen van opslag van histidine-bevattende moleculen (histidine-
containing compounds, HCC) in spieren tussen de twee soorten werd bevestigd. Vele andere
verschillen in het aminozuurprofiel werden waargenomen, en hierover werd, voor zover we weten,
nooit eerder gerapporteerd. De constante som van HIS, NAH en TAU, en het soortverschil in de ratio
van de HCC op de TAU werden eerder beschreven, en onze bevinding sluiten hierbij aan. Van HIS en
TAU is het geweten dat het osmotische agentia zijn, dus het behoud van het osmotisch evenwicht is
een aannemelijke verklaring voor dit verschijnsel. De invloed van de soort op het metabolismeprofiel
werd groter bevonden dan de invloed van de temperatuur; het belang van die laatste mag dus niet
overschat worden. We moeten ook nog vermelden dat een deel van het gevonden soortverschil
mogelijks verweven is met een leeftijdsverschil. De experimentele dieren werden immers geselecteerd
op basis van grootte, de leeftijd werd buiten beschouwing gelaten. Verder nog was mobilisatie van
HCC niet geassocieerd met een verhoogd gebruik van deze componenten als energiebron. Verder
onderzoek is aangewezen om uit te wijzen wat de fysiologische betekenis is van de duidelijke
verschillen in HCC en aminozuren tussen karper en tilapia, en wat de invloed van dieetsamenstelling
hierop is.
SLEUTELWOORDEN: Histidine – Karper – N-α-acetylhistidine – Nijltilapia – Taurine – Verhoogde
temperatuur

4
3. ABSTRACT
INTRODUCTION – LITERATURE REVIEW: The world population is expected to increase to
approximately 9 billion people by 2050, and the hunger that already exists today will increase. It is
predicted that land-based food production systems are limited and additional food production has to
come mainly from water. Aquatic products are known for their high feed conversion ratio and their
nutritional value. All this makes aquaculture a promising food industry. Besides food insecurity, climate
change is also a major global challenge that humanity is facing, even more; climate change will
complicate the obtention of food security. Climate change reflects on aquatic organisms through
different pathways. Firstly, there is the increased temperature in itself. Up to a certain level, elevation
of the water temperature is advantageous for fish, favoring its performance. However, temperatures
beyond the thermal optimum disadvantage the health of the animal in many different ways. Secondly,
because of the inverse relationship between the solubility of oxygen and the temperature of water, the
concentration of dissolved oxygen in the water is decreased. Insufficient dissolved oxygen will have an
impact on different physiological processes in fish, such as a decreased swimming performance and
immunosuppression. Thirdly, climate change will result in an increase of the toxicity of pollutants. This
happens by increasing the uptake due to an increased metabolism, and by increasing the toxicity
itself. The impact on fish depends on two main factors. On the one hand the composition of the diet
matters, with lipids, carbohydrates and proteins as major ingredients. On the other hand, also the fish
species turns out to be of great importance. Differences in muscular amino acid and imidazole
compound storage between the species indicate various metabolic response patterns. We
hypothesized that the difference in imidazole and amino acid storage in muscles correlates with fat
storage and with the difference in response to an elevated water temperature between species. In the
experiment, we wanted to evaluate how the large concentrations in the muscle might affect nutrient
metabolism when creating a situation where changes in amino acid catabolism are triggered, e. g. at
elevated water temperature.
MATERIALS AND METHODS: Seventeen Nile tilapia (oreochromis niloticus) and thirteen carp
(Cyprinus carpio) were individually and randomly assigned to an aquarium. These aquariums were
maintained at either a reference temperature (25°C) (“T25”) or a MET (30°C) (“T30”). All fish were fed
the same experimental diet at a 1.5% feeding rate, spread over two feeding moments per day. After
the fourteen-day experimental period, the fish were euthanized by an overdose of benzocaine. Blood
samples were taken to determine acylcarnitines and non-esterified fatty acids. NAH, HIS, free basic
amino acids and total free amino acid concentrations were measured in muscle samples. All
calculations, statistical analyses and graphs were performed using SPSS version 20.
RESULTS: Plasma acylcarnitine esters reflect the fatty acid metabolism and tended to be higher in
carp. Many of the muscle free amino acids had higher concentrations in carp versus Nile tilapia
(P<0.05) The muscular amino acid storages were histidine (HIS, P<0.001) in carp and taurine (TAU,
P=0.001) and N-α-acetylhistidine (NAH, P<0.001) in tilapia. The sum HIS+TAU+NAH remained

5
constant over temperature and species differences (P>0.05), but the ratio (HIS+NAH)/TAU was
markedly higher in carp than in tilapia and decreased with elevated temperature only in carp
(P<0.005). The concentration of 3-hydroxyisovalerylcarnitine, a sink of leucine catabolism, was lower
in carp (P<0.001). Regarding the plasma longer-chain acylcarnitines, we detected an increase in
tilapia at elevated temperature (P=0,009), while their corresponding beta-oxidation products remained
constant. Finally, a higher plasma NEFA was detected in carp versus tilapia (P=0.001).
DISCUSSION: The known differences in storage of muscular histidine-containing compounds (HCC)
between the two species were confirmed. Many other marked differences in amino acid profile were
observed, which to our knowledge, have not been reported yet. The constancy of the HIS, NAH and
TAU sum, and the species difference in the HCC to TAU ratio were described previously, and were
confirmed by our findings. HIS and TAU are known as osmotic agents, and the maintenance of
osmotic homeostasis may be a plausible explanation. The interspecies differences of the metabolic
profile were found to be greater than the temperature effect; the importance of the latter should
therefore not be overestimated. Also, it must be noticed that part of the species effect might be due to
a difference in physical age, there the experimental fish were selected on same size, disregarding
age. Further, mobilization of HCC was not associated with an increased use of these compounds as
energy source. It remains for further research to reveal whether the distinct differences in HCC and
amino acid between carp and tilapia arise from meaningful species differences and to identify their
subsequent effects on the diet.
KEY WORDS: Carp – Elevated temperature – Histidine – N-α-acetylhistidine – Nile tilapia – Taurine

6
4. INTRODUCTION – LITERATURE REVIEW
4.1. Food crisis
‘Without food, nothing else matters’ has been said by Warwick and Legates in the twentieth century
(1979). According to the Food and Agricultural Organization (FAO), 795 million people worldwide were
undernourished between 2014 and 2016. This means that just over one in nine people were unable to
acquire enough food to meet dietary energy requirements. The majority of them, 780 million people,
live in developing countries (FAO et al., 2015).
The world population is expected to increase to approximately 9 billion people by 2050 and stagnate
there. The challenge for the food producing industry that already exists today will increase in
importance. There is a need for a socially and environmentally sustainable approach to food
production that can provide sufficient food for the increasing population and also cover the food
shortages in the world’s poorest people (Godfray et al., 2010). Not only will the feed demand increase,
it will also change as a result of rising incomes and urbanization of the population (FAO, 2016). From
2000 to 2030, meat production will have to increase by 85 percent and cereal production by nearly 50
percent to meet the demand (The World Bank, 2008).
Previously, an increased food production was obtained by increasing the area for agriculture and
exploiting new fish stocks. Since the competition for land for various purposes and the awareness of
the depletion of fish stocks, new approaches need to be done. For years, scientists and farmers have
been working together to develop high yielding crops, like ‘magic rice’ and ‘magic wheat’. These
innovations were of great importance in the fight against world hunger. It may be said that we are now
at the peak of the golden age in terms of food supply. A drop in the food production in the near future
is likely because of over-utilization of cultivated lands, increasing area of non-productive land and
deserts, deforestation and consequences of global warming like drought and extremely hot weather
(Liao, 2009). Kutty (2010) argues that the land-based food production systems, even with the possible
expansion, are limited. Additional food production has to come mainly from water, and not too much
land-based, through available sustainable technologies and evolving new innovations, which would
ensure food security.
The production of some important grains like corn, wheat and rice is increasing; meanwhile, the
production of other important grains like sorghum, soybeans, barley and oil crops stagnates (Figure
1). Notwithstanding the slight increment in worldwide livestock, in particular poultry and swine,
aquaculture appears an important source of animal protein (Figure 2). Knowing that seventy-one
percent of the surface of the earth is covered with oceans, aquatic products seem an ideal food
source. Their nutritional value, which will be explained later, is receiving more attention, leading to an
increased demand (Liao, 2009). Capture fishery production tends to drop slightly, mainly because of
biodiversity loss which is, in turn, the result of direct pollution, exploitation and habitat destruction or
indirect through climate change and its consequences (Worm et al., 2006). Aquaculture as a source

7
for animal protein will play an important role in the overall aquatic production and therefore in the total
food security.
Figure 1. Global production of major grains from 1961 to 2007 (Liao 2009).
Figure 2. Global production of major animal proteins from 1961 to 2007 (Liao, 2009).

8
Aquaculture is defined by the FAO (1988) as ‘The farming of aquatic organisms including fish,
mollusks, crustaceans and aquatic plants with some sort of intervention in the rearing process to
enhance production, such as regular stocking, feeding and protection from predators, etc.’. Aquatic
products are known for their low feed conversion ratio and their nutritional value. They have high
values of high-quality proteins, phospholipids, highly unsaturated fatty acids (HUFA’s) like
eicosapentaenoic acid (EPA) and docosahexaenoic acid (DHA) and other nutrients like iron, iodine,
calcium, phosphate and vitamin A (Liao, 2009; Liao and Chao, 2009). In human health, improved
cardiac health, reduced blood pressure and risk of stroke and aid in the management of many
psychological disorders, like attention deficit and hyperactivity disorder, schizophrenia and depression
have been shown as a result of EPA and DHA (Duo, 2003).
Furthermore, there are other benefits of aquaculture versus farming terrestrial animals. Firstly,
aquaculture fish have a lower feed conversion ratio (FCR) than terrestrial animals, i.e. they can
convert their feed mass efficiently into body mass. For example, the production of 1 kg beef, pork and
fish requires respectively 61, 38 and 13 kg of grain. Secondly the carbon footprint per kilogram output
is lower in aquatic animal production systems. And finally, nitrogen and phosphorus emissions are
much lower than beef and pork, although it is even lower in poultry (HLPE, 2014).
One hundred fifty grams of fish can meet fifty to sixty percent of the adult’s daily protein requirements.
In 2010, almost 20 percent of the animal protein intake was provided by fish in more than 2.9 billion
people and about 15 percent of the animal protein intake in 4.3 billion people. In that year, 16.7
percent of the global animal protein intake was derived from fish (FAO, 2014). Extremes can be found
in West African and Asian coastal countries where fisheries are a central element in local economies;
the proportion of total dietary protein from fish ranges from fifty to more than sixty percent (HLPE,
2014).
4.2. Status of global aquaculture Aquaculture is probably the fastest growing food-producing sector (FAO, 2014). Over the last decade,
fish and shellfish production has grown by an average of 7.7 percent per year, not matched by any
other food production sector (Gjedrem et al., 2012). Fish culture was first documented in 475 BC in
China and today it is done all over the world (Liao and Chao, 2009). ‘Aquaculture’ is a collective term
that involves many possible systems for the production of plants and animals. It can be done in both
salt, brackish an fresh water, ranging from intensive, semi-intensive to intensive culture systems
(Edwards et al., 1988). There is aquaculture for subsistence, whether on family-level, artisanal
aquaculture, producing for the market on a small-scale, specialized aquaculture in which different
farmers carry out the various production stages and finally there is industrial-scale aquaculture
(Lazard et al., 1991).

9
In 2012, 158 million tons of aquatic products were produced, of which 66.6 million tons by aquaculture
and 91.3 million tons by capture. The proportion of aquaculture in the total aquatic production differs
between the continents. In Asia, the contribution of aquaculture counts for 54 percent in 2012,
compared to 18 percent in Europe and less than 15 percent in Africa (Figure 3) Both globally and in
all the different continents, the contribution of aquaculture keeps rising. In 2012, the top five
aquaculture producing countries of the world were located in Asia, with China on top. Asia as a whole
produced almost 59 million tons in 2012, which is approximately equal to 91 percent of the worldwide
production (FAO, 2014).
Figure 3. Share of aquaculture in total fish production, 1990-2012 (FAO, 2014)
The sector is a source for both health and wealth; it provides jobs to tens of millions and supports the
sustenance of hundreds of millions. An estimated 660 to 820 million people (both workers and their
family) depend partly or totally on fisheries, aquaculture and related industries as a source of income
and support (HLPE, 2014). Average annual fish consumption per capita increased from 9.9 kilogram in
1960 to 19.2 kilogram in 2012. This evolution is the result of rising incomes, urbanization and
population growth and is possible by fish production expansion and better distribution channels (FAO,
2014).
10
4.3. Global warming
Besides food insecurity, climate change is also a major global challenge that humanity is facing. Even
more, climate change is perceived as one of the greatest challenges for food security (HLPE, 2012).
Predicting trends in the Earth’s climate is difficult, but it is clear that the climate is changing more
rapidly than ever. Since the 1950s, many of the observed climate changes are unprecedented over
decades to millennia. The sea level has risen, the amounts of snow and ice have diminished and the
atmosphere and – particularly important for this study – ocean have warmed. It is expected that the
global ocean will continue to warm during the twenty first century, with the greatest warming for the
surface in tropical and Northern Hemispere subtropical regions (IPCC, 2014).
According to the Intergovernmental Panel on Climate Change (2007), most of the contemporary
increase in global average temperatures is very likely due to the observed increase in anthropogenic
greenhouse gas concentrations. The contribution of agriculture to global warming is both directly and
indirectly for example by deforestation (HLPE, 2012).
Today, the challenge of food security is already huge because of the many resources needed for
sustainable food security that are already stretched. Climate change will make it even harder. The
productivity of most existing food systems shall be reduced and the livelihoods of those already prone
to food insecurity will be harmed (HLPE, 2012). Existing risks will be amplified and new risks will be
created by climate change. These risks are unevenly distributed and are generally greater for
disadvantaged people and communities (IPCC, 2014). There are two geographic regions where
climate change is likely to be especially pronounced, namely Sub-Saharan Africa and South Asia, but
food insecurity is even reported in the richest countries (HLPE, 2012). Impacts of climate change in a
poverty perspective are the following: sustained economic growth, more challenging reduction of
poverty, further erosion of food security and prolongation of existing and creating of new poverty traps
(IPCC, 2014).
Climate change calls for a realignment of the food industry. Complex economic, social and biophysical
adjustments to food production, processing and consumption should be made. Although these
modifications require effort for everyone, it will be the hardest for the poorest and the most vulnerable
regions and populations. Moreover, it is predicted that the gravest effects of climate change will be felt
in tropical regions, where many of the poorest countries are found (HLPE, 2012). The majority of the
world’s fisher folk and fishery-dependent men live in regions that are sensitive for anthropological
induced climate change or they depend on resources whose distribution and productivity are
influenced by climate variation (MRAG, 2005). This implies that the countries facing the most
nuisances are also the countries that are the least able to cope (HLPE, 2012).
11
4.4. Importance of climate change on aquatic organisms Climate change will provide fishes with new environments through different mechanisms. These
mechanisms do not stand alone but interact with each other (Ficke et al., 2007). Nevertheless they will
be discussed separately to preserve the overview.
4.4.1. Increased temperature
Temperature was identified as the abiotic master factor for fishes by Brett (1971). The temperature
influences almost all biochemical and physiological activities of fishes (Chatterjee et al., 2004). Over
20 000 fish species are described and the body temperature of most of them is a direct result of the
water temperature (Beitinger et al., 2000). Their body temperature is on average between 0.1 and 1
degrees Celsius above water temperature (Clausen, 1934; Gunn, 1942; Fry, 1967; Stevens and Fry,
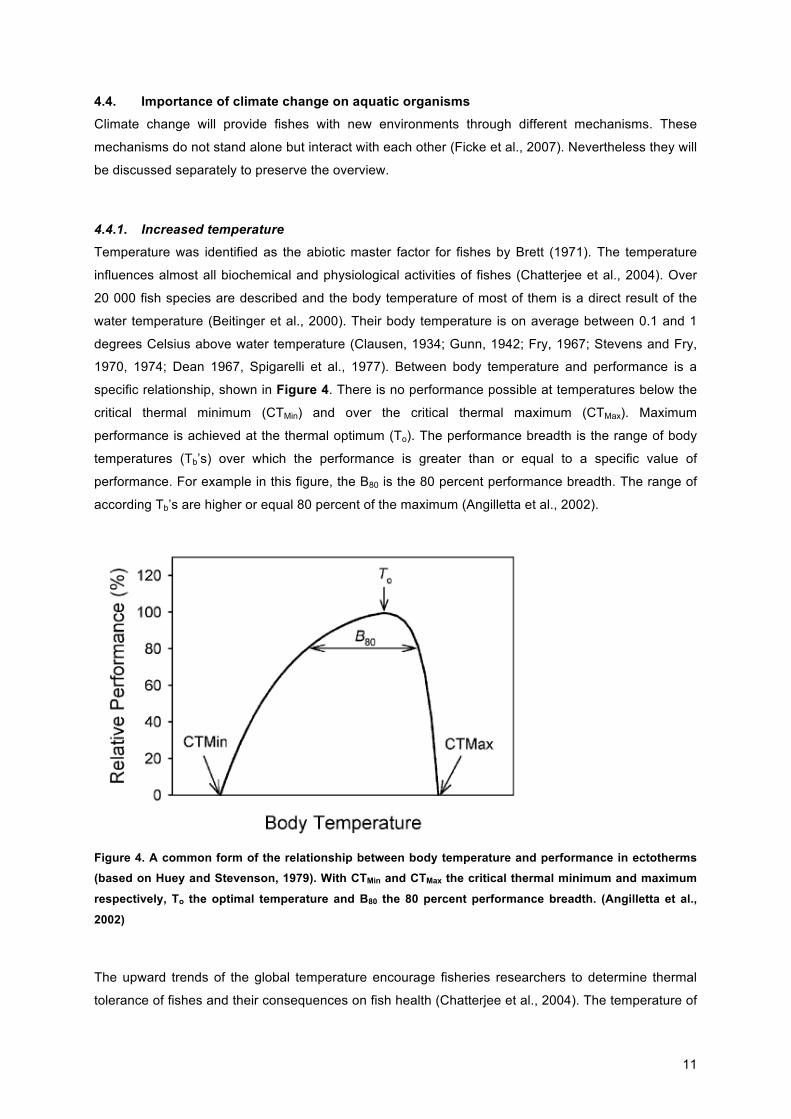
1970, 1974; Dean 1967, Spigarelli et al., 1977). Between body temperature and performance is a
specific relationship, shown in Figure 4. There is no performance possible at temperatures below the
critical thermal minimum (CTMin) and over the critical thermal maximum (CTMax). Maximum
performance is achieved at the thermal optimum (To). The performance breadth is the range of body
temperatures (Tb’s) over which the performance is greater than or equal to a specific value of
performance. For example in this figure, the B80 is the 80 percent performance breadth. The range of
according Tb’s are higher or equal 80 percent of the maximum (Angilletta et al., 2002).
Figure 4. A common form of the relationship between body temperature and performance in ectotherms (based on Huey and Stevenson, 1979). With CTMin and CTMax the critical thermal minimum and maximum
respectively, To the optimal temperature and B80 the 80 percent performance breadth. (Angilletta et al.,
2002)
The upward trends of the global temperature encourage fisheries researchers to determine thermal
tolerance of fishes and their consequences on fish health (Chatterjee et al., 2004). The temperature of

12
the sea will increase just as the air temperature, although not to the same extent, the warming will be
slower because of the high heat storage capacity of water (Rijnsdorp et al., 2009). In aquaculture, a
rising temperature favors the performance up to a certain limit by reducing the time to reach the adult
stage and increasing growth rate (Chatterjee et al., 2004). As a result, the marketable size is reached
more quickly and more generations per year can be produced (Das et al., 2004) However,
temperatures over this limit disadvantage the health of the animal. Metabolic rates and consequently
oxygen demand will increase, bacteria and other pathogens could proliferate and invade more easily
(Wedemeyer et al., 1999).
When poikilotherms are transferred from one thermal environment to another, their body compensates
for the temperature change through physiological and biochemical changes through different
mechanisms (Hazel and Prosser, 1974). Costas et al. (2012) performed a study to determine the
effects of temperature on sole metabolic status. The Senegalese sole (Solea senegalensis) was
maintained at either cold or warm environmental temperatures and plasma concentrations of free
amino acids, triglycerides, proteins, cortisol, lactate and glucose were measured. In comparison with
the control treatment, both treatments caused a difference in plasma concentrations and there was
also a mutual difference. The conclusion of the study was that acclimation to different temperatures
leads to several metabolic changes and that amino acids may be important for thermal acclimation.
At the level of the individual fish’s physiology, changes as a result of an elevated water temperature
have been observed. For example an increased body temperature as mentioned before. A boost of
the metabolism has been seen also, resulting in a higher feed demand (Brett, 1971; Specziár, 2002;
Elliot, 1975). Daily maintenance will require a higher feed intake, thereby the feed conversion ratio will
augment and the performance or weight gain will decrease. Reduction of the reproductive output is a
consequence of global warming as well. Indeed, successful reproduction often requires low overwinter
temperatures altered with warm summer temperatures. As a result of climate change, the seasonal
rhythm is disturbed (Langford, 1983; Gerdaux, 1998; Boyd and Tucker, 1998; Webb et al., 2001).
Also at the species level changes have been registered due to climate change. Perry et al. (2005)
showed that nearly two-thirds of the North Sea fish species respond to the recent increase in sea
temperature by shifting in mean latitude, depth or both over twenty five years. The species with
shifting distributions also have smaller body sizes and faster life cycles than the nonshifting species.
This migration and its consequences are detrimental to the fishing industry, both by displacement of
the fish stocks as reduction of the quality of the product.
4.4.2. Decreased dissolved oxygen
In water, the oxygen concentration (dissolved oxygen, DO) is lower than in air (Moyle and Cech,
2004). Via photosynthetic production and diffusion from the atmosphere, oxygen enters the water,
what is potentiated by mixing and turbulence (Kalff, 2000; Stickney 2000). DO concentrations from 5
mg/l or more are sufficient for most aquatic species, less than 2 to 3 mg/l is called hypoxic (Doudoroff
13
and Warren, 1965; Kalff, 2000; Stickney 2000). There is an inverse relationship between the solubility
of oxygen and the temperature of water; thus the higher the temperature, the less dissolved oxygen
(Ficke et al, 2007). Note the contrast at an elevated water temperature: on the one hand there is a
reduced oxygen concentration and on the other hand there is an increased biological oxygen demand
to maintain the boosted metabolism (Kalff, 2000). “Oxygen squeeze” is the result of an inadequate
oxygen supply to meet the increased demand.
Hypoxia, or insufficient dissolved oxygen to support aerobic metabolism in fish (Moyle and Cech,
2004) will decrease swimming performance, fitness of emerging larvae (Doudoroff and Warren, 1965)
and feeding activity (Stickney, 2000). It will make fish less tolerant of environmental stress like food
limitation, thermal stress, toxins and diseases (Langford, 1983). Low dissolved oxygen levels have
also been linked to immunosuppression (Boyd and Tucker, 1998; Stickney, 2000), diminished growth
and to a reduced reproductive ability.
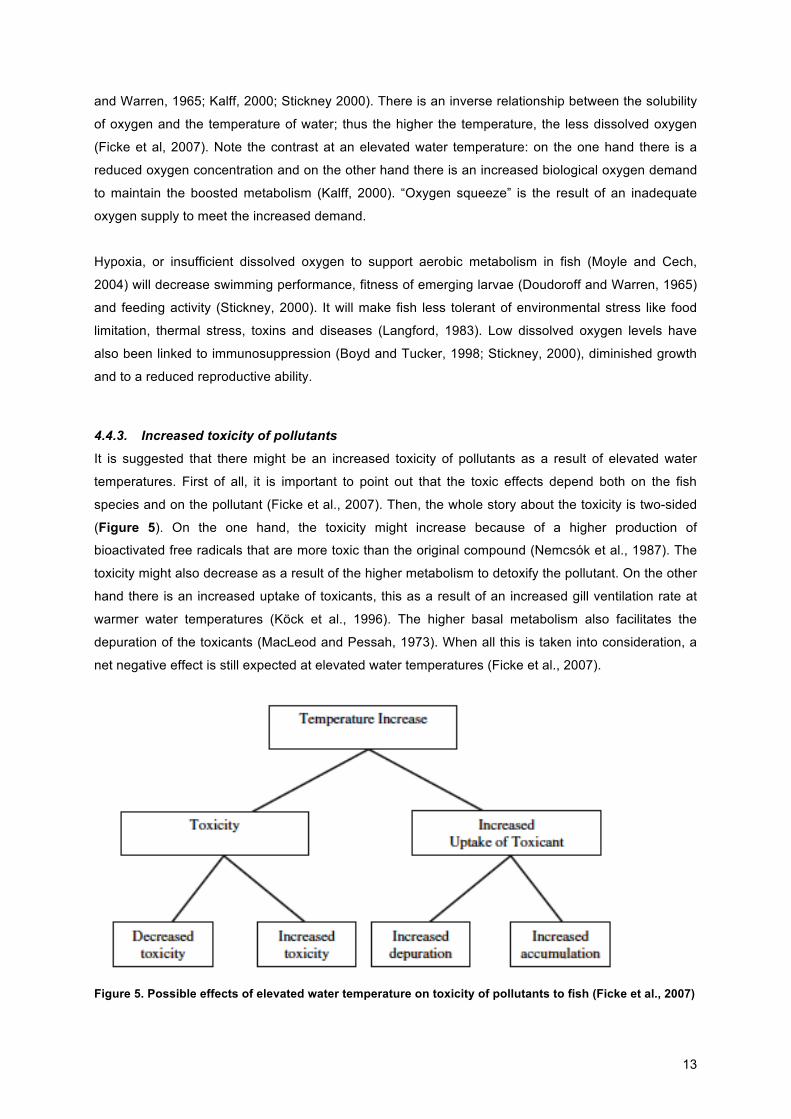
4.4.3. Increased toxicity of pollutants
It is suggested that there might be an increased toxicity of pollutants as a result of elevated water
temperatures. First of all, it is important to point out that the toxic effects depend both on the fish
species and on the pollutant (Ficke et al., 2007). Then, the whole story about the toxicity is two-sided
(Figure 5). On the one hand, the toxicity might increase because of a higher production of
bioactivated free radicals that are more toxic than the original compound (Nemcsók et al., 1987). The
toxicity might also decrease as a result of the higher metabolism to detoxify the pollutant. On the other
hand there is an increased uptake of toxicants, this as a result of an increased gill ventilation rate at
warmer water temperatures (Köck et al., 1996). The higher basal metabolism also facilitates the
depuration of the toxicants (MacLeod and Pessah, 1973). When all this is taken into consideration, a
net negative effect is still expected at elevated water temperatures (Ficke et al., 2007).
Figure 5. Possible effects of elevated water temperature on toxicity of pollutants to fish (Ficke et al., 2007)
14
4.5. Nutrient metabolism in fish in elevated water temperature
An increase in temperature causes an upregulation of the metabolism, leading to a rise in the amount
of energy needed. When enough time has passed and acclimatization occurs, fishes are able to
compensate for some of the temperature-related rise in metabolic rate, although the general trend is
upwards (Ficke et al., 2007).
Specific diets can be composed based on, inter alia, the species, breed, age and the reproduction
status to maximize the performance. In addition, modifications of the diet can be done to tackle the
detrimental effects of climate change (Mujahid, 2011). Heat production in animals is a result of the
basal metabolism, the digestion of foods and metabolism of the nutrients derived from them and
voluntary muscular activity (McDonald et al., 2011). The purpose of nutritional strategies could be to
decrease the food associated heat-production, increase nutrient intake, reduce heat-induced oxidative
stress and decrease energy wastage. These nutritional strategies are feeding good quality feed with
high nutrient density and digestibility, provision and balancing of additional amino acids, adding fat as
an energy source and supplementation of glucose, minerals and vitamins (Mujahid, 2011).
Dietary and species-related effects will be discussed in the section below. The three main energy
sources will be generally presented first and for each, the situation with increased temperatures will be
discussed in more detail.
4.5.1. Factors in the diet
4.5.1.1. Lipids and fatty-acids
Dietary lipid composition and content are of great importance because lipids, fatty acids and their
derivates are part of virtually every physiological process that occurs in vivo. They represent the
primary sources of metabolic energy, because finfish are intolerant of high dietary carbohydrate
content, as explained below. Both dietary concentration and ratio are important. For example, there is
a physiological demand for certain fatty acids, which are then converted endogenously into other
necessary products. An example of an important ratio is the n-3 to n-6 fatty acids, this ratio is
considered as an indicator of fish health status (Trushenski et al., 2006).
Little is known about the metabolism of lipids in fish at elevated water temperatures. To my
knowledge, no study has been done yet to determine any changes in the absorption or processing of
lipids and fatty-acids at higher water temperatures. At sub-optimal, reduced temperatures, metabolic
responses such as depletion of lipid depots, remodeling of membrane lipids and alterations in the fatty
acid profile have been demonstrated in fish (Alhazzaa et al., 2013).

15
4.5.1.2. Carbohydrates
Carbohydrates are the least expensive component with energy value in the diet of man and domestic
animals (Wilson, 1994). Fish do not require carbohydrates in their diets, as they are not able to
efficiently digest and utilize complex carbohydrates (Trushenski et al., 2006). However, it is
recommended to provide carbohydrates in the diet, otherwise other nutrients like protein and lipids will
be catabolized for energy purposes and to provide intermediates for the synthesis of other biologically
important compounds. The utilization of carbohydrates is influenced by many parameters, among
others the fish species and the complexity of the carbohydrate. In general, herbivorous, omnivorous,
freshwater and warm-water fish tolerate a higher level of digestible carbohydrates than carnivorous,
marine and cold-water fish (Wilson, 1994; Moreira et al., 2008).
Data on the effect of temperature on carbohydrate utilization by fish is scare. A universal mechanism
concerning the use of carbohydrates by fish can not be found (Enes et al., 2008a,b; Moreira et al.,
2008). Médale et al. (1999) demonstrated an improved starch digestibility in carp at elevated water
temperatures while in lower temperatures enzyme activities were higher (Shikata et al., 1995). In
rainbow trout, both starch digestibility and utilization as energy source improved at higher water
temperature (Médale et al., 1991). A strategy to cope with elevated temperatures concerning
carbohydrates is an increased uptake. An increased mucosal capacity to take up sugars is
demonstrated in chickens by Garriga et al (2006). Studies were performed with red drum (Sciaenops
ocellatus) (Zhou et al., 2010) and common carp (Cyprinus carpio carpio) (Geda et al., 2012) providing
dietary mannanoligosaccharides (MOS) to modulate the effect of mildly elevated water temperatures
through changes in intestinal morphology. In both studies, there was an absence of a MOS effect on
the fold height of the gut, thus supplementation of MOS does not seem to have an impact on the
absorption under elevated water temperature conditions.
4.5.1.3. Proteins
Proteins, composed of amino acids (AA), are the largest component in the diet, but also the most
expensive. Most vertebrates have the highest protein requirement when they are young, during the
growth. Finfish on the other hand, exhibit high protein requirements regardless of life stage because
they are indeterminant growers; this means that they grow lifelong (Trushenski et al., 2006). Amino
acids are a third energy source, besides lipids and, to a lesser extent in fish, carbohydrates. Amino
acids are energetically weak; compared to lipids and carbohydrates; the oxidation of AA is less
efficient for ATP production (Wu, 2009).
As mentioned before, Costas et al performed a study to assess the effects of temperature on
Senegalese sole metabolic status by acclimatization to either cold or warm environmental
temperatures. The acclimatization to the different temperatures resulted in increments and
decrements of some free amino acid concentrations. This suggests that certain amino acids are
important in osmoregulatory processes, antioxidant defenses and/or energetic purposes (Costas et al.,
2012).
16
One of the three contributing factors of heat production in animals, namely the digestion of foods and
metabolism of the nutrients derived from them, can be minimized by either a reduced feed intake or a
reduced nutrient absorption. Both strategies have been demonstrated in fish (Geda et al., 2012;
Katersky and Carter, 2005). Anywise, the result is a reduced supply of dietary energy. This means that
the required energy will have to come from body reserves. Lipid stores can be metabolized to provide
the necessary acetyl CoA for the Krebs or citric acid cycle. Acetyl CoA together with oxaloacetate,
forms citrate, the Krebs cycle will be completed and ATP will be gathered. The source of oxaloacetate
can be either glucose or certain amino acids. Glucose is less available because of the reduced
nutrient absorption, so amino acids from body reserves will be the main source (Geda et al., 2012). An
elevated catabolism of amino acid is indeed demonstrated by Woo (1990), Squires et al. (1979),
Costas et al. (2012) and Geda et al. (2012).
4.5.1.4. Dietary strategies to promote performance
Nutraceuticals
There are different ongoing definitions of nutraceuticals, but they all have some common
characteristics. A nutraceutical must be a naturally substance (possibly purified) that can likely be
found in the natural diet of the organism, it must be taken in orally and must have some nutritional
value to itself. Some functional categories of nutraceuticals have been extensively studied in the
aquaculture nutrition industry, especially probiotics, essential fatty acids, plant derivates and vitamins
(Trushenski et al., 2006). Probiotics are the most researched nutraceuticals in aquaculture, and this
will be the only category discussed in this literature review.
Similar to nutraceuticals, many definitions circulate. The following definition was given by an expert
with the Joint Food and Agriculture Organization of the United Nations/World Health Organization
(FAO/WHO, 2001): “live microorganisms, which when consumed in adequate amounts, confer a
health effect on the host”. One of the criticisms of aquaculture is the overuse of antibiotics, which are
used as a preventive measure, promoting antimicrobial resistance. Probiotics are viewed as an
alternative to antibiotic treatment, since they can control pathogens through a variety of mechanisms.
All mechanisms have not yet been discovered, but these are some of the clarified ones: competitive
exclusion, influence on water quality and source of nutrients and enzymatic contribution to digestion
(Balcázar et al., 2006). Results vary among the culture species, however an increased appetite, a
decreased need for antibiotics and an enhanced growth were observed by Irianto and Austin (2002).
Increased protein to energy ratio
As mentioned before, climate change affects physiological and biochemical processes in the
organism. A reduction in protein digestibility, a decrease in endogenous protein synthesis and an
increment in endogenous protein turnover in heat stress conditions were also described by Carter et
al. (2006). The raised protein turnover during heat stress may indicate that an increased dietary offer

17
of proteins could improve the fish’s performance in that situation (Barnes et al., 2006). Glencross and
Rutherford (2010) performed a study showing that providing a diet with an increased protein to energy
ratio has significant benefits concerning lowering growth retardation at elevated temperature.
A study with the objective to determine whether fish can be made more resistant to an increased water
temperature by modification of the diet was designed and carried out, this by a 2x2 factorial design
with two different protein energy ratios at two different temperatures. Unfortunately, the results of this
study were not available in time to incorporate in this research report.
4.5.2. Effect of the species
Different fish species have a different metabolism and will each respond in their own manner on any
changes in their environment. This occurs at many levels and in order to limit the literature review up
to the range of this study only the differences in amino acid metabolism will be discussed. Mohanty et
al. (2014) performed a study to generate information on amino acid composition and protein content of
important food fishes with a variety of amino acid profiles as a result.
The high storage of free amino acids and imidazole compounds in the muscles in fish is widely
researched, but the purpose of this is not yet fully clarified (Shiau et al., 1996). Especially histidine
(HIS), characterized by an imidazole ring (Figure 6), and histidine-derived dipeptides are represented
in the muscle. ß-alanylhistidine (called carnosine), ß-alanyl-1-methylhistidine (called anserine), ß-
alanyl-3-methylhistidine (trivial names ophidine and balenine) and are the most frequently occurring
peptides together with N-α-acetylhistidine (NAH) (Van Waarde,1988; Yamada et al., 2009).
Figure 6. Histidine with the characteristic imidazole side chain.
It has been demonstrated that these imidazole compounds play a role as intracellular buffer (Abe et
al., 1985; Van Waarde, 1988; Sewell et al., 1992), osmoregulator (Van Waarde, 1988), ion regulator
(Baran, 2000), anitoxidant (Boldyrev et al., 1988), blood glucose regulator (Nagai et al., 2003;
Sauerhöfer et al., 2007), neurotransmitter (Boldyrev, 2001; Petroff et al., 2001) and non-enzymatic
free-radical scavenger (Kohen et al., 1988; Guiotto et al., 2005). We suggest that free amino acids and
imidazole compounds also serve as an energy reserve, since they are not able to store high amounts
of body fat like many terrestrial animals do.
18
Different distribution patterns have been revealed in different species (Van Waarde, 1988; Yamada et
al., 2009). Skeletal muscle of Nile tilapia for example, has high levels of NAH (Yamada et al., 1992)
and in the skeletal muscle of carp is HIS the main representative (Van Waarde, 1988). It is not yet fully
understood why this difference between species exists, and to our knowledge it has not been
determined whether the different muscular storage of free amino acids and imidazole compounds
would influence the metabolic response of fish to elevated temperature.
Our hypothesis is that the difference in muscle imidazole and amino acid storage between species
and their reaction to an increased water temperature relates to the species difference in body fat
storage, as Abdelghany and Ahmad (2002) demonstrated the tendency to store more fat in carp than
in tilapia. Therefore, we performed a laboratory experiment with two model fish, Nile tilapia and carp,
to evaluate the metabolic reaction of the two fish species to a mildly elevated water temperature.

19
5. MATERIALS AND METHODS
5.1. Experimental animals
Seventeen Nile tilapia (Oreochromis niloticus) and thirteen carp (Cyprinus carpio) with the same size
were purchased (Figure 7). They were transported from the fish farmer in either Belgium or the
Netherlands to the test facility in double and oxygenated polyethylene bags. Upon arrival at the lab,
salt amelioration was performed in all the fish by fifteen grams of sodium chloride per liter of water for
ten minutes. During two weeks, they were acclimated to laboratory conditions in 2 batches; the first
with six tilapia and six carp, the second with eleven tilapia and seven carp. After this acclimatization
period, the fishes were fasted for twenty-four hours and weighted to determine their initial body weight
(average initial body weight: 119 ± 4 g tilapia, 123 ± 9 g carp). The housing as well as the
experimental and ethical procedures performed in this experiment were approved by the Ethics
Committee of Laboratory Animals, Faculty of Veterinary Medicine, Ghent University, Belgium.
Figure 7. Nile tilapia (left) and carp (right).
5.2. Test facility and housing
The experiment was performed at the Laboratory of Animal Nutrition, Faculty of Veterinary Medicine,
Ghent University, Heidestraat 19, 9820 Merelbeke, Belgium, from April until June 2013. After the
acclimatization and fasting, the fish were individually and randomly allocated into 63 liter aquaria
(JUWEL Aquarium, Rekord® 600, Rotenberg, Germany), size 60cm x 30cm x 36cm, with continuously
aerated recirculating tap water trough a biological filter. Then, the aquaria were randomly assigned to
either the control group (“T25”) or the treatment group (“T30”). During the entire trial, a 12:12 hour
light-dark photoperiod with fluorescent lights by timers was applied to all 30 aquaria.
5.3. Feeding protocol and feed composition During the fourteen-day trial period, the fish were fed twice a day with the experimental diet (feed:
Benelux NV, Wielsbeke – Ooigem, Belgium) (Table 1), at 10am and 3pm. The feeding rate was 1.5%
of the average wet body weight per fish per day. The diet was manually given by slowly opening the
top automatic feeder window of each aquarium.

20
Table 1. Chemical composition of the experimental dieta
Proximate composition (g/kg) Dry matter 922.00 Moisture 78.00 Crude protein 326.20 Crude ash 54.40 Crude fat 55.80 Crude fibre 31.30 NFEb 454.30
Amino acid composition (g/kg)
Alanine 19.98 Arginine 19.90 Aspartic acid + Asparagine 31.62 Cysteine 5.46 Glutamic acid + Glutamine 67.55 Glycine 13.98 Histidine 8.11 Isoleucine 15.44 Leucine 34.21 Lysine 16.85 Methionine 6.28 Phenylalanine 18.46 Proline 21.18 Serine 16.51 Threonine 13.23 Tryptophan 3.56 Tyrosine 12.52 Valine 17.06
a Aqua-KI feed, manufactured by Benelux NV, Wielsbeke – Ooigem, Belgium. Vitamin and mineral premix added per kg feed (as given in the commercial feed technical sheet): retinol, 3 mg; vitamin C, 100 mg; cholecalciferol, 0.025 mg; vitamin E, 33 mg; calcium, 6 g; phosphorus, 6 g; sodium, 0.8 g; iron, 100 mg; copper, 2.5 mg; manganese, 15 mg; zinc, 50 mg; selenium, 0,25 mg. List of ingredients reported in Aqua-KI in decreasing order of inclusion: Fish products, products and by-products of oil seeds, vegetal products and by-products, algae, amino acids, vitamins, minerals, calcium propionate, antioxidants, oils and fats. b Nitrogen-free extract: %NFE = 100% - (% moisture + % crude protein + % crude fat + % crude fiber + % crude ash).
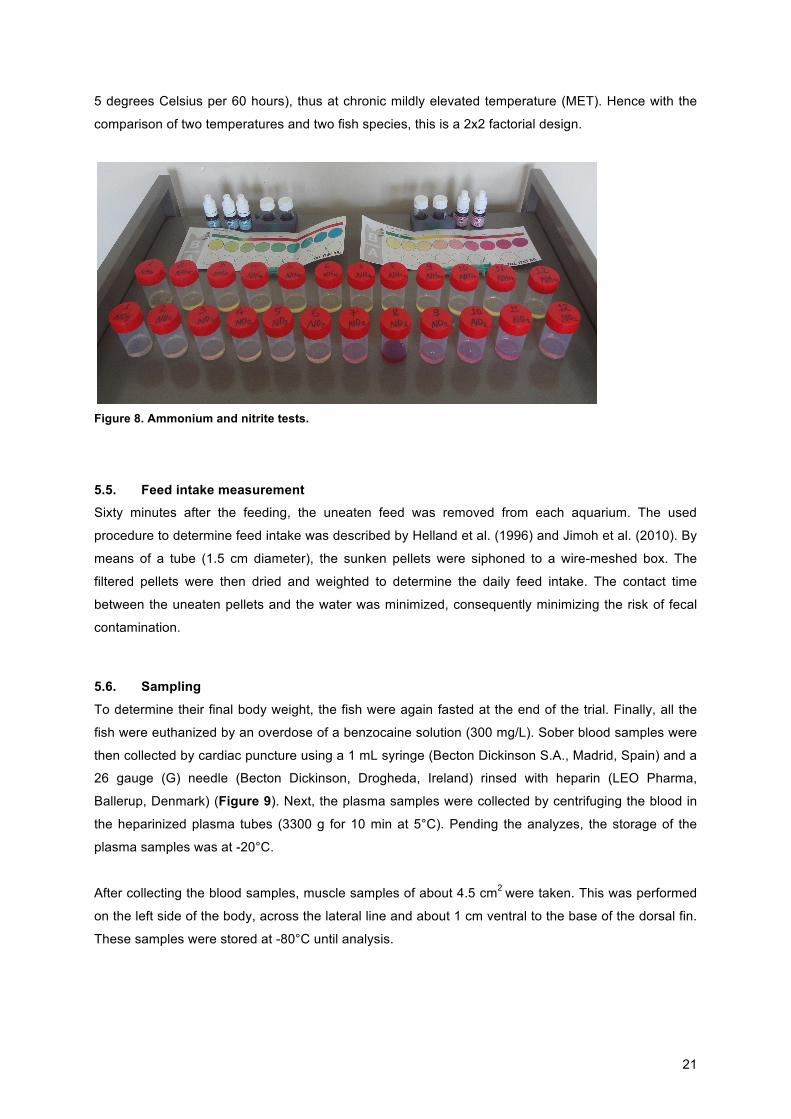
5.4. Monitoring of the water and set-up of elevated temperature
The water quality was monitored daily. Daily water pH (8.2) (Merck KGaA, Darmstadt, Germany),
ammonium (<0.10 mg/L) (JBL GmbH and Co KG, Neuhofen/Pfals, Germany), nitrite (0.13 mg/L) (JBL
GmbH and Co KG, Neuhoffen/Pfalz, Germany) and dissolved oxygen (5.7 mg/L for T25, 5.3 mg/L for
T30) (Hanna Instruments Srl, Nufalau, Romania) were measured and recorded during the entire
experimental period and found to be optimal (Figure 8). The control or T25 group was maintained at
25 degrees Celsius and the treatment or T30 group was kept at 30 degrees Celsius (set-up at a rate of
21
5 degrees Celsius per 60 hours), thus at chronic mildly elevated temperature (MET). Hence with the
comparison of two temperatures and two fish species, this is a 2x2 factorial design.
Figure 8. Ammonium and nitrite tests.
5.5. Feed intake measurement Sixty minutes after the feeding, the uneaten feed was removed from each aquarium. The used
procedure to determine feed intake was described by Helland et al. (1996) and Jimoh et al. (2010). By
means of a tube (1.5 cm diameter), the sunken pellets were siphoned to a wire-meshed box. The
filtered pellets were then dried and weighted to determine the daily feed intake. The contact time
between the uneaten pellets and the water was minimized, consequently minimizing the risk of fecal
contamination.
5.6. Sampling
To determine their final body weight, the fish were again fasted at the end of the trial. Finally, all the
fish were euthanized by an overdose of a benzocaine solution (300 mg/L). Sober blood samples were
then collected by cardiac puncture using a 1 mL syringe (Becton Dickinson S.A., Madrid, Spain) and a
26 gauge (G) needle (Becton Dickinson, Drogheda, Ireland) rinsed with heparin (LEO Pharma,
Ballerup, Denmark) (Figure 9). Next, the plasma samples were collected by centrifuging the blood in
the heparinized plasma tubes (3300 g for 10 min at 5°C). Pending the analyzes, the storage of the
plasma samples was at -20°C.
After collecting the blood samples, muscle samples of about 4.5 cm2 were taken. This was performed
on the left side of the body, across the lateral line and about 1 cm ventral to the base of the dorsal fin.
These samples were stored at -80°C until analysis.

22
Figure 9. Cardiac puncture blood collection
5.7. Analysis The plasma was analyzed for both acylcarnitines and non-esterified fatty acids (NEFA). The latter by
means of spectrophotometry (EZ Read 400 Microplate Reader, Biochrom Ltd., Cambridge, United
Kingdom) by adding acyl-CoA synthetase, acyl-CoA oxidase and peroxidase (Randox NEFA, Randox
Laboratories Ltd., Crumlin, United Kingdom).
NAH, HIS, free basic amino acids and total free amino acid concentration in the muscle samples were
determined. NAH and His were measured by use of the reversed-phase HPLC (Waters Corporation)
method (O’Dowd et al., 1990) with a slight modification (Breck et al., 2005). Determination of the free
basic amino acid and total free amino acid concentrations was done by ninhydrin detection with
Biochrom 20 plus (Biochrom Limited), using the amino analyzer ninhydrin method (Amersham
Pharmacia Biotech) (Breck et al., 2005).
5.8. Statistical analysis Statistical analysis was performed using SPSS version 20. The data were evaluated for normality
using boxplot graphs, analyzed with Linear Mixed Model (LMM), and are expressed as means and
standard error of the means. A Bonferroni correction was applied as confidence interval adjustment
because of increased Type I error rate due to multiple comparisons of the main effects. Statistical
significance was accepted at P-value lower than 0.05. P-values between 0.05 and 0.10 were
considered as tendency.
The effects of species, temperature and their interactions were managed as fixed factors; random
effects of batch and aquarium nested within the batch were analyzed in the LMM: Yijklm = µ + Ti + Sj +
(TS)ij + Bk + (AB)l(k) + εijklm. With µ = the overall mean, Ti = ith effect of temperature, Sj = jth effect of

23
species, (TS)ij = ijth interaction effect between temperature and species, Bk = kth effect of batch,
(AB)l(k) = klth interaction effect between batch and aquarium in which the effect of the aquarium is
nested within that of the batch, and εijklm = the random error. For those amino acids that had no normal
distribution of data (due to detection limit), Wilcoxon Rank Test was used to evaluate difference
between the groups.

24
6. RESULTS
Plasma acylcarnitine esters were determined and are shown in Table 2. Acylcarnitines correspond
with the respective acyl-COA esters and they reflect the fatty acid metabolism. With the exception of a
few, acylcarnitines were higher in carp as indication of a higher fatty acid metabolism in carp
compared to tilapia. This difference manifests itself mainly in the short-chain fatty acids. For the fatty
acid metabolism, the temperature had no influence.
Table 2. Selected plasma acylcarnitine in tilapia (n=17) and carp (n=13) at MET (mean, pooled SEM)
Carnitine ester T25 T30 Pooled P-value (µmol/L) Carp Tilapia Carp Tilapia SEM T S T×S Free 6.686 4.766 6.912 4.880 0.388 0.818 0.012 0.940 Acetyl 3.617 1.312 3.575 1.173 0.282 0.816 <0.001 0.901 Propionyl 0.256 0.041 0.263 0.063 0.245 0.660 <0.001 0.834 Butyryl 0.207 0.126 0.173 0.090 0.016 0.242 0.008 0.976 3OH-butyryl 0.047 0.016 0.047 0.029 0.004 0.368 0.001 0.334 Hexanoyl 0.037 0.031 0.037 0.024 0.003 0.510 0.118 0.562 Octanoyl 0.457 0.033 0.032 0.024 0.003 0.039 0.073 0.685 Decanoyl 0.026 0.046 0.022 0.035 0.003 0.222 0.009 0.581 Dodecanoyl 0.037 0.034 0.035 0.040 0.003 0.817 0.876 0.602 3OH-dodecanoyl 0.013 0.009 0.010 0.006 0.001 0.323 0.169 0.968 Tetradecanoyl 0.026 0.036 0.018 0.048 0.003 0.654 0.001 0.066 3OH-tetradecanoyl 0.006 0.008 0.008 0.006 0.001 0.813 0.997 0.373 Tetradecenoyl 0.037 0.033 0.022 0.039 0.003 0.418 0.287 0.099 3OH-tetradecenoyl 0.011 0.010 0.010 0.008 0.001 0.205 0.205 0.726 Hexadecanoyl 0.054 0.066 0.040 0.095 0.006 0.404 0.001 0.021 3OH-hexadecanoyl 0.010 0.008 0.007 0.009 0.001 0.606 0.976 0.350 Hexadecenoyl 0.037 0.032 0.023 0.036 0.003 0.493 0.574 0.216 3OH-hexadecenoyl 0.011 0.007 0.007 0.008 0.001 0.337 0.337 0.175 Octadecanoyl 0.019 0.033 0.013 0.049 0.003 0.271 <0.001 0.031 3OH-octadecanoyl 0.004 0.004 0.005 0.003 0.001 0.750 0.545 0.492 Octadecenoyl 0.111 0.083 0.060 0.130 0.010 0.895 0.253 0.011 3OH-octadecenoyl 0.006 0.006 0.005 0.006 0.001 0.996 0.783 0.722
SEM, standard error of the mean; T, temperature; S, species; TxS, T and S interaction
The measured concentrations of the free amino acids in the muscles of both fish species with both
treatments are given in Table 3. HIS (P<0.001) was the abundant amino acid in the muscle of carp,
while it were NAH (P<0.001) and TAU (0.001) in tilapia. The use of amino acids as energy source was
higher in carp than in tilapia, as measured through the urea concentration (P<0.001). The difference in
storage between the two species was, with a few exceptions, significant. Here again, the temperature
had no influence. There are some significant interactions between species and temperature, but
because some values approach the detection limit of some compounds, this should be interpreted with
caution.

25
Table 3. Skeletal muscle free AA in tilapia (n=17) and carp (n=13) at MET (mean, pooled SEM)
Amino acids T25 T30 Pooled P-value (µmol/g) Carp Tilapia Carp Tilapia SEM T S T×S NAH 0.006 1.260 0.056 1.319 0.148 0.784 <0.001 0.982 Histidine (HIS) 9.148 1.147 7.424 0.779 0.733 0.065 <0.001 0.223 Taurine (TAU) 8.962 16.537 11.907 16.763 0.972 0.337 0.001 0.409 Glutamate (Glu) 0.784 0.607 0.785 0.623 0.038 0.918 0.032 0.919 Glutamine (Gln) 1.076 1.176 0.772 1.161 0.066 0.224 0.067 0.272
Glu:Gln 0.787 0.538 1.012 0.573 0.055 0.168 0.001 0.311 Glycine 4.399 8.328 2.816 7.876 0.480 0.047 <0.001 0.257 Alanine 2.615 2.277 2.147 2.461 0.121 0.573 0.963 0.203 Proline 1.837 1.816 0.640 0.642 0.166 <0.001 0.972 0.966 Lysine 1.694 0.102 1.345 0.135 0.148 0.283 <0.001 0.196 Ornithine 0.091 0.062 0.078 0.054 0.009 0.555 0.139 0.902 Phenylalanine 0.066 0.025 0.068 0.033 0.005 0.508 <0.001 0.694 Isoleucine 0.075 0.046 0.079 0.064 0.004 0.131 0.003 0.315 Leucine 0.165 0.087 0.161 0.118 0.008 0.180 <0.001 0.097 Valine 0.104 0.063 0.099 0.091 0.005 0.209 0.010 0.079 Arginine 0.852 0.052 0.503 0.044 0.091 0.217 <0.001 0.238 Asparagine 0.305 2.905 0.165 1.851 0.275 0.119 <0.001 0.228 Aspartate 0.209 0.968 0.157 0.704 0.083 0.178 <0.001 0.362 Hydroxyproline 0.177 0.745 0.070 0.488 0.062 0.032 0.000 0.360 Serine 0.687 0.177 0.469 0.159 0.051 0.086 <0.001 0.143 Threonine 0.931 0.668 0.552 0.580 0.040 0.001 0.074 0.029 Tryptophan 0.021 0.009 0.013 0.011 0.002 0.275 0.007 0.077 Tyrosine 0.068 0.030 0.062 0.038 0.005 0.865 0.001 0.418 Urea 9.340 3.482 7.400 2.402 0.814 0.268 <0.001 0.749 AMM CL 1.243 1.385 1.270 1.398 0.070 0.892 0.366 0.963 PEA 0.031 0.029 0.039 0.025 0.003 0.659 0.175 0.286 Methionine 0.049a 0.003c 0.052a 0.003c Ethanolamine 0.111a 0.014c 0.071a 0.015c Cystathionine 2* 0.065a NDc 0.028a NDc 1-Methylhistidine* 0.019a NDc 0.029b NDc 3-Metylhistidine* 0.009a NDc 0.011a NDc AABA 0.019a 0.002c 0.015a 0.002c GABA 0.017a 0.007a 0.015a 0.008a NDAA** - - - - - - - -
SEM, standard error of the mean; T, temperature; S, species; TxS, T and S interaction; NAH, N-α-acetylhistidine; AMM CL, ammonium chloride; PEA, phosphoethanolamine; AABA, α-aminobutyric acid; GABA, γ-aminobutyric acid. a,b,cMean values within a row with unlike superscript letters were significantly different (P<0.05). *Non-detected free amino acids (for tilapia). **Non-detected free amino acids (for carp and tilapia): anserine, β-alanine, carnosine, citrulline, cysteine, cystathionine 1, phosphoserine, sarcosine, α-aminoadipic acid, β-aminoisobutyric acid, hydroxylysine1, hydroxylysine 2.

26
In Figure 10, the relation between NAH, HIS and TAU is given as a box plot. The sum of the tree is
neither significantly different for the species, nor for the temperatures (A). But when NAH and HIS are
taken together, since they are skeletal muscle imidazole compounds, and the ratio of them to taurine
is visualized, we see differences between carp at 25°C and carp at 30°C and between carp and tilapia,
both significant (B). For the ratio, a significant interaction effect with temperature and species can also
be observed.
Figure 10. Mean skeletal muscle imidazole (NAH and HIS) and TAU in carp (n=13) and tilapia (n=17) at ideal (25°C) and mildly elevated water temperature (30°C): (A) sum of imidazole and taurine: temperature,
species and interaction effects, P>0.05; (B) imidazole to taurine ratio: temperature effect, P=0,012;
species effect, P<0.001; interaction effect, P=0.049. a,b,cMean values with different letters were significantly different (P<0.05).
In Figure 11, valerylcarnitine, isovalerylcarnitine and 3-hydroxyisovalerylcarnitine are shown, the three
of them are metabolites of the amino acid leucine. Valerylcarnitine and isovelerylcarnitine are
intermediates, while 3-hydroxyisovalerylcarnitine is an end product (sink), result of an incomplete
catabolism. The concentration of 3-OH-isovalerylcarnetine showed an interaction, a species effect and

27
a tendency for a temperature effect (A). Eventual differences in valerylcarnitine, and isovalerylcarnitine
were not discerned due to high variability (B). When the ratio of 3-OH-valerylcarnitine to
(iso)valerylcarnitine was taken, a species effect was observed (C).
Figure 11. Mean plasma 3-hydroxyisovalerylcarnitine, valerylcarnitine and their ratios in carp (n=13) and tilapia (n=17) at ideal (25°C) and mildly elevated water temperature (30°C): (A) 3-hydroxyvalerylcarnitine:
28
temperature effect, P=0.070; species effect, P<0.001; interaction effect, P=0.009; (B) valerylcarnitine:
temperature effect, P=0.717; species effect, P=0.007; interaction effect, P=0.724; (C) ratio of 3-
hydroxyvalerylcarnitine to valerylcarnitine: temperature effect, P=0.209; species effect, P<0.001; interaction effect, P=0.090. a,bMean values with different letters were significantly different (P<0.05).
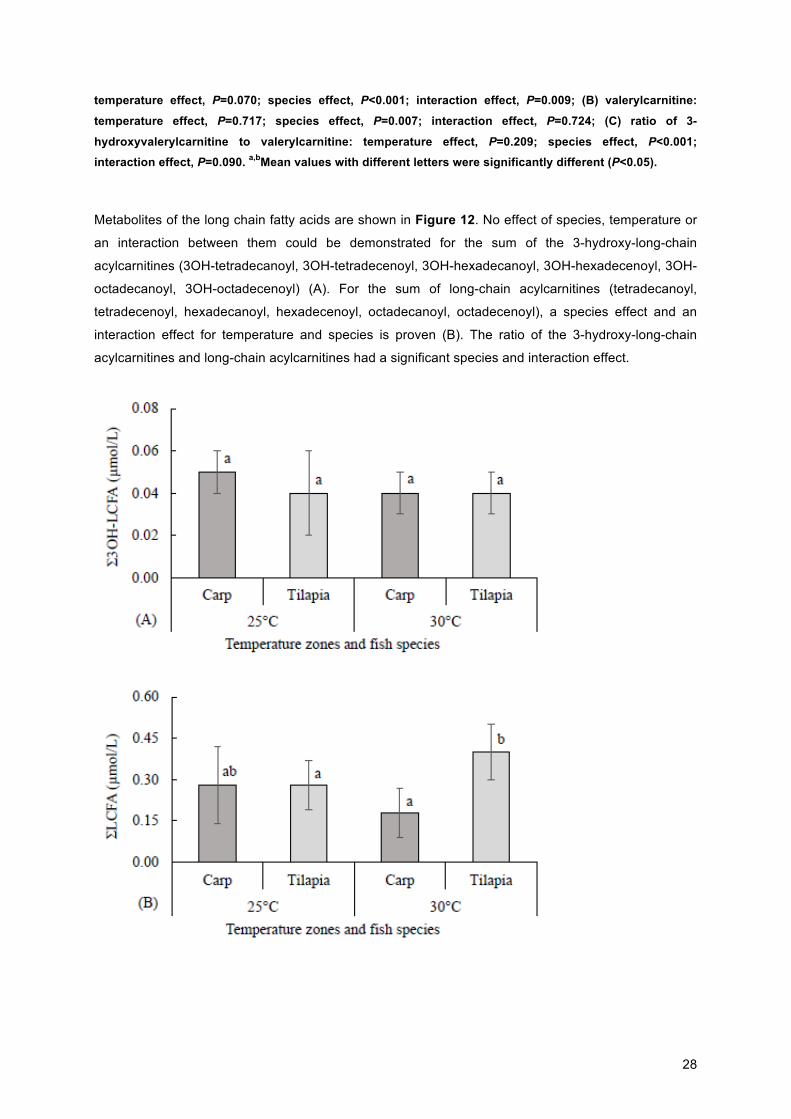
Metabolites of the long chain fatty acids are shown in Figure 12. No effect of species, temperature or
an interaction between them could be demonstrated for the sum of the 3-hydroxy-long-chain
acylcarnitines (3OH-tetradecanoyl, 3OH-tetradecenoyl, 3OH-hexadecanoyl, 3OH-hexadecenoyl, 3OH-
octadecanoyl, 3OH-octadecenoyl) (A). For the sum of long-chain acylcarnitines (tetradecanoyl,
tetradecenoyl, hexadecanoyl, hexadecenoyl, octadecanoyl, octadecenoyl), a species effect and an
interaction effect for temperature and species is proven (B). The ratio of the 3-hydroxy-long-chain
acylcarnitines and long-chain acylcarnitines had a significant species and interaction effect.

29
Figure 12. Mean plasma 3-hydroxy-long-chain acylcarnitine and long-chain acylcarnitine and their ratios
in carp (n=13) and tilapia (n=17) at ideal (25°C) and mildly elevated water temperature (30°C): (A) sum of 3-hydroxy-long-chain acylcarnitines (3OH-tetradecanoyl, 3OH-tetradecenoyl, 3OH-hexadecanoyl, 3OH-
hexadecenoyl, 3OH-octadecanoyl, 3OH-octadecenoyl): temperature, species, and interaction effects,
P>0.05); (B) sum of long-chain acylcarnitines (tetradecanoyl, tetradecenoyl, hexadecanoyl, hexadecenoyl, octadecanoyl, octadecenoyl): temperature effect, P=0.946; species effect, P=0.009; interaction effect,
P=0.009; (C) ratio of (A) to (B): temperature effect, P=0.407; species effect, P=0.001; interaction effect,
P=0.036. a,bMean values with different letters were significantly different (P<0.05).
Mean plasma concentration of non-esterified fatty acids (NEFA) was higher in carp than in tilapia and
there were neither temperature effects, nor interactions (Figure 13).
Figure 13. Mean plasma non-esterified fatty acid (NEFA) in carp (n=13) and tilapia (n=17) at ideal (25°C)
and mildly elevated water temperature (30°C): temperature effect, P=0.765; species effect, P=0.009;
interaction effect, P=0.536. a,bMean values with different letters were significantly different (P<0.05).
30
7. DISCUSSION Imidazole compounds such as histidine, N-α-acetylhistidine and other dipeptides play an important
role in many chemical and physiological processes in organisms, for example as blood glucose
regulator (Nagai et al., 2003) and intracellular buffer (Abe et al., 1985; Van Waarde, 1988; Sewell et
al., 1992). A range of levels was determined in different species by Van Waarde (1988) and Yamada
et al. (2009). We hypothesized that the difference in imidazole storage in muscles correlates with fat
storage and with the difference in response to an elevated water temperature between species. In this
study, we wanted to evaluate how the large concentrations in the muscle might affect nutrient
metabolism when creating a situation where changes in amino acid catabolism are triggered, e. g. at
elevated water temperature. A mildly elevated temperature of 30°C and a reference temperature of
25°C were applied on two fish species: carp (Cyprinus carpio) and Nile tilapia (Oreochromis niloticus).
These two species were chosen because of their differences in metabolism and amino acid storage
(Abe, 1983; Abelghany and Ahmad, 2002; Boldyrev et al., 2013; Geda et al., 2014).
A difference in storage of muscular histidine-containing compounds (HCC) between the two species
was previously described (Abe, 1983; Boldyrev et al., 2013; Geda et al., 2014) and indeed, we can
confirm this can by our findings. Furthermore, we identified many other marked differences in amino
acid profile, as for example asparagine, serine, aspartate and lysine. To our knowledge, this has not
been reported yet. The circulation of free amino acids in blood usually indicates an increased
mobilization as a result of a need in the metabolism. However, the exact motivation behind the amino
acid metabolism variation between different species remains unknown and it is an interesting topic for
further research.
From the HCC (histidine and N-α-acetylhistidine) to taurine ratio, we were able to detect that taurine
replaces HCC when they are metabolized. This was also described previously in milkfish (Chanos
chanos) by Shiau et al. (1997). The total relative amounts of histidine, N-α-acetylhistidine and taurine
remained about the same, although the individual contributions varied considerably between the
species. A plausible reason is the requirement to maintain osmotic homeostasis in the muscle of these
fish, with metabolisation of HCC in a greater or lesser extent. Indeed, it has been demonstrated that
free histidine functions as an osmoeffector and also taurine has been described previously as an
osmolyte (Zhang et al., 2006; Fiess et al., 2007). Osmosis is of major importance in every organism,
but especially for organisms in an aquatic environment it is a challenge.
Even within the normal temperature range, the metabolic profiles of the two fish species are different.
Yet, the interspecies differences were found to be substantially greater than the size of the
temperature effect. The relative contribution of water temperature on amino acid metabolism might
therefore be overruled by species differences, but future studies should clarify the physiological
meaning of the observed temperature effects. Interestingly, the interaction between species and
temperature on HCC mobilization shows that species react differently to changes in water
temperature. It is however important to acknowledge that part of the species effect might be due to

31
differences in physiological age. It is known from studies in milkfish that muscular storage of HCC and
other amino acids can vary with age within the same species (Shiau et al., 1997). For the set-up of this
experiment, fish were selected based on their size and it cannot be ruled out that there was a
difference in the age of the fish.
It has been demonstrated that histidine and HCC are released from the muscle during starvation
(Shiau et al., 1997). Because of this and the higher histidine-dipeptide mobilization in tilapia and the
difference in fat storage between tilapia and carp, respectively about three and six percent
(Abdelghany and Ahmad, 2002), we thought that the histidine-dipeptides were metabolized to use as
an energy source. For example NAH; the hydrolyzed product would not only provide HIS, but would
also release an acetyl moiety that could serve as source for acetyl-CoA. However, the mobilization of
HCC was not associated with an increased use of these compounds as energy source. This was
demonstrated by the changes in leucine catabolites (leucine sink) and the change in long-chain
acylcarnitines. Therefore, our initial hypothesis was not supported by the present data. It is thus more
likely that the mobilized HCC rather serve the antioxidant potential of the fish during elevated water
temperature. It is known from other species such as poultry that increased environmental temperature
induces oxidative stress (Mujahid, 2011). It is therefore possible that oxidative stress also occurs in
fish and that HCC are mobilised to cope with it. However, complete clarification requires further
research.
Also noteworthy are our findings about the longer-chain acylcarnitines, which represent the use of fatty
acids. They were higher in tilapia than in carp, which seems strange at first sight knowing that carp
has the highest fat storage (Abelghany and Ahmad, 2002) and the highest plasma NEFA
concentration. However, the 3-hydroxy-acylcarnitines of the corresponding fatty acids were unaltered.
This suggests that the fatty acids might accumulate because they are not pushed into fatty acid
combustion to generate acetyl-CoA. Therefore, we consider this metabolic profile as a reduced use of
fatty acids, especially given the distinctly higher concentrations of short-chain acylcarnitines in carp
versus tilapia.
When the water temperature is left out of consideration, the comparison of the metabolic profile
between both species suggests that the metabolic rate is lower in tilapia than in carp. Tilapia has a
lower leucine catabolism, lower fatty acid combustion rate, lower concentrations of many
acylcarnitines, and so on. Yet, tilapia is considered to be an ideal fish for aquaculture, despite these
signs of lower metabolic rate. This might be explained by a lower rate of physical activity. Tilapia, as a
herbivorous fish, is usually not intensely active, whereas carp, a rather omnivorous fish, might spend
more time in acceleration to chase prey. Thus, the metabolism of tilapia mainly provides energy for
maintenance and growth.

32
The distinct differences in amino acid profile between carp and tilapia might point at substantial
differences in metabolism, and warrant further investigation in view of their meaning for nutrient
requirements.
In conclusion, this study demonstrates that carp and Nile tilapia, and fish species in general, differ in
their metabolic response to a mild elevation in water temperature. Even more, we demonstrated that
this is associated with species-dependent changes in muscle imidazole to taurine ratio. It remains for
further research to reveal whether the differences in amino acid and imidazole metabolism arise from
meaningful species differences and to identify their subsequent effects on dietary requirements.
33
8. REFERENCES
Abdelghany A. E., Ahmad M. H. (2002). Effects of feeding rates on growth and production of Nile
tilapia, common carp and silver carp polycultured in fertilized ponds. Aquaculture Research
33, 415-423.
Abe H. (1983). Distribution of free L-histidine and related dipeptides in the muscle of fresh-water
fishes. Comparative Biochemistry and Physiology, Part B 76, 35-39.
Abe H., Dobson G. P., Hoeger U., Parkhouse W. S. (1985). Role of histidine-related compounds to
intracellular buffering in fish skeletal muscle. American Journal of Physiology 249, 449-454.
Alhazzaa R., Bridle A. R., Nichols P. D., Carter C. (2013). Coping with sub-optimal water temperature:
Modifications in fatty acid profile of barramundi as influenced by dietary lipid. Comparative
Biochemistry and Physiology, Part A 156, 243-253.
Angilletta Jr. M. J., Niewiarowski P. H., Navas C. A. (2002). The evolution of thermal physiology in
ectotherms. Journal of Thermal Biology 27, 249-268.
Balcázar J. L., de Blas I., Ruiz-Zarzuala I., Cunningham D., Vendrell D., Múzquiz J. L. (2006). The role
of probiotics in aquaculture. Veterinary Microbiology 114, 173-186.
Baran E. J. (2000). Metal complexes of carnosine. Biochemistry (Moscow) 65, 789-797.
Barnes J. C., Hauer R. C., Carter C. G. (2006). The effect of protein : energy ratio on the growth and
protein synthesis of Atlantic salmon (Salmo salar) at 19°C. In: Proceedings of the International
Society for Fish Nutrition and Feeding, p. 57, Biarritz, France, 28 May – 1 June. INRA, St Pee
Sur Nivelle, France. Cited by Glencross and Rutherford, 2010.
Beitinger T. L., Bennett W. A., McCauley R. W. (2000). Temperature tolerances of North American
freshwater fishes exposed to dynamic changes in temperature. Environmental Biology of
Fishes 58, 237-275.
Boldyrev A. A. (2001). Carnosine as a modulator of endogenous Zn2+ effects. Trends in Pharmalogical
Science 22, 112-113.
Boldyrev A. A., Dupin A. M., Pindel E. V., Severin S. E. (1988). Antioxidative properties of histidine
containing dipeptides from skeletal muscles of vertebrates. Comparative Biochemistry and
Physiology – Part B 89, 245-250.
34
Boldyrev A. A., Aldini G., Derave W. (2013). Physiology and pathofysiology of carnosine. Physiological
Reviews 93, 1803-1845.
Breck O., Bjerkås E., Campbell P., Sanderson J., Waagbø R. (2005). Histidine nutrition and genotype
affect cataract development in Atlantic salmon, Salmo salar L. Journal of Fish Diseases 28,
357-371.
Brettt J. R. (1971). Energetic responses of salmon to temperature. A study of some thermal relations
in the physiology and freshwater ecology of Sockeye salmon (Oncorhynchus nerka). American
Zoologist 11, 99-113.
Boyd C. E., Tucker C. S. (1998). Pond aquaculture water quality management. Kluwer Academic
Publishers, Norwell, Massachuttetts. Cited by Ficke et al., 2007.
Carter C. G., Bridle A. R., Ketersky R. S., Barnes J. C., Hauler R. C. (2006). Influence of nutrition and
thermal stress on protein synthesis and degradation in fish. In: Proceedings of the
international society for fish nutrition and feeding, p. 57, Biarritz, France, 28 May – 1 June.
INRA, St Pee Sur Nivelle, France. Cited by Glencross and Rutherford, 2010.
Chatterjee N., Pal A. K., Manush S. M., Das T. Mukerjee S. C. (2004). Thermal tolerance and oxygen
consumption of Labeo rohita and Cyprinus carpio early fingerlings acclimated to three different
temperatures. Journal of Thermal Biology 29, 265-270.
Clausen R. G. (1934). Body temperature of freshwater fishes. Ecology 15, 139-144.
Costas B., Aragão C., Ruiz-Jarabo I., Vargas-Chacoff L., Arjona F. J., Mancera J. M., Dinis M. T.,
Conceição L. E. C. (2012). Different environmental temperatures affect amino acid
metabolism in the eurytherm teleost Senegalese sole (Solea senegalensis Kaup, 1858) as
indicated by changes in plasma metabolites. Amino Acids 43, 327-335.
Das T., Pal A. K., Chakraborty S. K., Manush S. M., Chatterjee N., Mukherjee S. C. (2004). Thermal
tolerance and oxygen consumption of Indian Major Carps acclimated to four temperatures.
Journal of Thermal Biology 29, 157-163.
Dean J. M. (1976). Temperature of tissues in freshwater fishes. Transactions of the American
Fisheries Society 105, 709-711. Cited by Beitinger et al., 2000.
Douderoff P., Warren C. E. (1965). Environmental requirements of fishes and wildlife: dissolved
oxygen requirements of fishes. Oregon Agricultural Experiment Station Special Report, 40 pp.
Cited by Ficke et al., 2007.

35
Duo L. 2003. Omega-3 fatty acids and nonsommunicable diseases. Chinese medical Journal 116,
453-458.
Edwards P., Pullin R. S. V., Gartner J. A. (1988). Research and education for the development of
integrated crop-livestock-fish farming systems in the tropics. ICLARM Studies and Reviews
16, 53 p. International Centre for Living Aquatic Resources Management, Manila, Philippines,
53 pp.
Elliot J. M. (1975). The energetics of feeding, metabolism and growth of brown trout (Salmo trutta) in
relation to body weight, water temperature, and ration size. Journal of Animal Ecology 45,
923-946.
Enes P., Panserrat S., Kaushik S., Oliva-Teles A. (2008a) Rearing temperature enhances glucokinase
but not glucose-6-phosphatase activities in Europiean sea bass (Dicentrarchus labrax) and
gilthead sea bream (Sparus auratus) juveniles fed with the same levels of glucose.
Comparative Biochemistry and Physiology, Part A 150, 355-358.
Enes P., Panserrat S., Kaushik S., Oliva-Teles A. (2008b) Hepatic glucokinase and glucose-6
phosphatase responses to dietary glucose and starch in gilthead sea bream (Sparus auratus)
juveniles reared at two temperatures. Comparative Biochemistry and Physiology, Part A 149,
80-86.
FAO. (1988). Development of marine and inland aquaculture, Greece, Draft National Aquaculture
Plan. Technical Report, Rome, 18 pp.
FAO. (2014). The state of world fisheries and aquaculture 2014. Rome, 223 pp.
FAO. (2016). Climate change and food security: risks and responses. Rome, 98 pp.
FAO, IFAD, WFP. (2015). The state of food insecurity in the world 2015. Meeting the 2015
international hunger targets: taking stock of uneven progress. Rome, FAO, 56 pp.
FAO/WHO. (2001). Report of a joint FAO/WHO expert consultation on evaluation of health and
nutritional properties of probiotics in food including powder milk with live lactic acid
bacteria. Córdoba, Argentina. Probiotics in food. Health and nutritional properties and
guidelines for evaluation. (2006) FAO Food and Nutrition Paper 85. Rome, FAO/WHO, 50 pp.
Ficke A. D., Myrick C. A., Hansen L. J. (2007). Potential impacts of global climate change on
freshwater fisheries. Reviews in Fish Biology and Fisheries 17, 581-613.

36
Fiess J. C., Kunkel-Patterson A., Mathias L., Riley L. G., Yancey P. H., Hirano T., Grau E. G. (2007).
Effects of environmental salinity and temperature on osmoregulatory ability, organic
osmolytes, and plasma hormone profiles in the Mozambique tilapia (Oreochromis
mossambicus). Comperative Biochemistry and Physiology, Part A 146, 252-264.
Fry F. E. J. (1967). Responses of vertebrate poikilotherms to temperature. pp. 375-409. In A. H. Rose
(Editor) Thermobiology, Academic Press, Londen. Cited by Beitinger et al., 2000.
Garriga C., Hunter R; R., Amat C., Planas J. M., Mitchell M; A., Moretó M. (2006). Heat stress
increases apical glucose transport in the chicken jejunum. American Journal of Physiology
Regulatory, Integrative and Comparative Physiology 290, R195-R201.
Geda F., Rekecki A., Decostere A., Bossier P., Wuyts B., Kalmar I. D., Janssens G. P. J. (2012).
Changes in intestinal morphology and amino acid catabolism in common carp at mildly
elevated temperature as affected by dietary mannanoligosaccharides. Animal Feed Science
and Technology 178, 95-102.
Geda F., Declercq A., Decostere A., Lauwaerts A., Wuyts B., Derave W., Janssens G. P. J. (2015). ß
Alanine does not act trough branched-chain amino acid catabolism in carp, a species with low
muscular carnosine storage. Fish Physiology and Biochemistry 41, 281-287.
Gerdaux D. (1998). Fluctutations in lake fisheries and global warming. In: George D. G. (Editor)
Management of lakes and reservoirs during global climate change, Dodrecht, p. 263-272.
Cited by Ficke et al., 2007.
Gjedrem T., Robinson N., Rye M. (2012). The importance of selective breeding in aquaculture to meet
future demands for animal protein: A review. Aquaculture 350-353, 117-129.
Glencross B., Rutherford N. (2010). Dietary strategies to improve the growth and feed utilization of
barramundi, Lates Calcarifer under high water temperature conditions. Aquaculture nutrition
16, 343-350.
Godfray H. C. J., Beddington J. R., Crute I. R., Haddad L., Lawrence D., Muir J. F., Pretty J., Robinson
S., Thomas S. M., Toulmin C. (2010). Food Security: The challenge of feeding 9 billion
people. Science 327, 812-818.
Guiotto A., Calderan A., Ruzza P., Borin G. (2005). Carnosine and carnosine-related antioxidants: a
review. Current Medicinal Chemistry 12, 2293-2315. Cited by Yamada et al., 2009.
37
Gunn D. L. (1942). Body temperature in poikilothermal animals. Biological Reviews 17, 293-314.
Cited by Beitinger et al., 2000.
Hazel J. R., Prosser C. L. (1974). Molecular mechanisms of temperature compensation in
poikilotherms. Physiological Reviews 54, 620-677.
Helland S. J., Grisdale-Helland B., Nerland S. (1996). A simple method for the measurement of daily
feed intake of groups of fish in tanks. Aquaculture 139, 157-163.
HLPE. (2012). Food security and climate change. A report by the High Level Panel of Experts on
Food Security and Nutrition of the Committee on World Food Security. Rome, 98 pp.
HLPE. (2014). Sustainable fisheries and aquaculture for food security and nutrition. A report by the
High Level Panel of Experts on Food Security and Nutrition of the Committee on World Food
Security. Rome, 118 pp.
Huey R. B., Stevenson R. D. (1979). Integrating thermal physiology and ecology of ectotherms: a
discussion of approaches. American Zoologist 19, 357-366.
IPCC. (2014). Climate change 2014: synthesis report. Contribution of working groups I, II and III to
the fifth assessment report of the intergovernmental panel on climate change. IPCC,
Geneva, Switzerland, 151 pp.
Irianto A., Austin B. (2002). Probiotics in aquaculture. Journal of Fish Diseases 25, 633-642.
Jimoh W. A., Fagbenro O. A., Adeparusi E. O. (2010). Digestibility coefficients of processed jackbean
meal Cannavalia ensiformis (L.) DC for Nile tilapia, Oreochromis niloticus (Linnaeus, 1785)
diets. International Journal of Fisheries and Aquaculture 2(4), 102-107.
Kalff J. (2000). Limnology. Prentice Hall, Upper Saddle River, New Jersey. Cited by Ficke et al., 2007.
Köck G., Triendl M., Hofer R. (1996). Seasonal patterns of metal accumulation in Arctic char
(Salvelinus alpinus) from an oligotrophic Alpine lake related to temperature. Canadian Journal
of Fisheries and Aquatic Sciences 53, 780-786.
Kohen R., Yamamoto Y., Cundy K. C., Ames B. N. (1988). Antioxidant activity of carnosine,
homocarnosine, and anserine present in muscle and brain. Proceedings of the National
Academy of Sciences USA 85, 3175-3179.
38
Langford T. E. (1983). Electricity generation and the ecology of natural waters. Liverpool University
Press, Liverpool, UK. Cited by Ficke et al., 2007.
Lazard J., Lecomte Y., Stomal B., Weigel J-Y. (1991). Pisciculture en Afrique subsaharienne:
situations et projets dans des pays francophones; propositions d’action. Ministère de la
Coopération et du Développement, Paris, 155 pp.
Li P., Mai K., Trushenski J., Wu G. (2009). New developments in fish amino acid nutrition: towards
functional and envirolmentally orientated aquafeeds. Amino Acids 37 (1), 43-53.
Liao I. C. (2009). The role of aquaculture in upcoming feed crisis. Fish Pathology 44 (1), 1-8.
Liao C., Chao N-H. (2009). Aquaculture and food crisis: opportunities and constraints. Asia Pacific
Journal of Clinical Nutrition 18 (4), 564-569.
MacLeod J. C., Pessah E. (1973). Temperature effects on mercury accumulation, toxicity, and
metabolism rate in rainbow trout (Salmo gairdneri). Journal of the Fisheries Research Board of
Canada 30, 485-492. Cited by Ficke et al., 2007.
McDonald P., Edwards R. A., Greenhalgh J. F. D., Morgan C. A., Sinclair L. A., Wilkinson R. G.
(2011). Animal nutrition. 7th edition. Pearson Education Limited, Harlow, England, p. 262-270,
346-354.
Médale F., Aguirre P., Kaushik S. J. (1991). Utilization of dietary carbohydrates by rainbow trout at two
water temperatures. In: Wenk C., Boessinger M. (Editors) Energy metabolism of Farm
Animals. European Association for Animal Production 58, 392-395. Cited by Moreira et al.,
2008.
Médale F., Poli J.-M., Vallée F., Blanc D. (1999). Comparaison de l’utilisation digestive et métabolique
d’un régime riche en glucides par la carpe à 18 °C et 25 °C. Cybium 23, 139-152.
Mohanty B., Mahanty A., Ganguly S., Sankar T. V., Chakraborty K, Rangasamy A., Paul B., Sarma D.,
Mathew S., Asha K. K., Behera B., Aftabuddin Md., Debnath D., Vijayagopal P., Sridhar N.,
Akhtar M. S., Sahi N., Mitra T., Banerjee S., Paria P., Das D., Das P., Vijayan K. K.,
Laxmanan P. T., Sharma A. P. (2014). Amino acid compositions of 27 food fishes and their
importance in clinical nutrition. Journal of Amino Acids Volume 2014, pp 7.
Moreira I. S., Peres H., Couto A., Enes P., Oliva-Teles A. (2008). Temperature and dietary
carbohydrate level effects on performance and metabolic utilization of diets in European sea
bass (Dicentrarchus labrax) juveniles. Aquaculture 274, 153-160.
39
Moyle P. B., Cech J. J. (2004). Fishes: an introduction to ichthyology. 5th edition. Prentice Hall,
Englewoord Cliffs, New Jersey. Cited by Ficke et al., 2007.
MRAG. (2005). Effects of climate change on the sustainability of capture and enhancement fisheries
important to the poor: analysis of the vulnerability and adaptability of fisherfolk living in
poverty. Fisheries Management Science Programme Department for International
Development. Marine Resources Assessment Group, Londen, 162 pp.
Mujahid A. (2011). Nutritional strategies to maintain efficiency and production of chickens under high
environmental temperature. Journal of Poultry Science 48 (3), 145-154.
Nagai K., Niijima A., Yamano T., Otani H., Okumra N., Tsuruoka N., Nakai M., Kiso Y. (2003).
Possible role of L-carnosine in the regulation of blood glucose trough controlling autonomic
nerves. Experimental Biology and Medicine 228, 1138-1145.
Nemcsók J., Orbán L., Aszolas B., Vig É. (1987). Accumulation of pesticides in the organs of carp,
Cyprinus carpio L., at 4° and 20°C. Bulletin of Environmental Contamination and Toxicology
39, 370-378. Cited by Ficke et al., 2007.
O’Dowd J. J., Cairns M. T. Trainor M., Robins D. J., Miller D. J. (1990). Analysis of carnosine,
homocarnosine, and other histidyl derivatives in rat brain. Journal of Neurochemistry 55, 446
452.
Perry A. L., Low P. J., Ellis J. R. Reynolds J. D. (2005). Climate change and distribution shifts in
marine fishes. Science 308, 1912-1914.
Petroff O. A. C., Hyder F., Rothman D. L., Mattsons R. H. (2001). Topiramate rapidly raises brain
GABA in epilepsy Patients. Epilepsia 42, 543-548.
Rijnsdorp A. D., Peck M. A., Engelhard G. H., Mölmann C., Pinnegar J. K. (2009). Resolving the effect
of climate change on fish populations. ICES Journal of Marine Science 66, 1570-1583.
Sauerhöfer S., Yuan G., Braun G. S., Deinzer M., Neumaier M., Grets N., Floege J., Kriz W., van der
Woude F., Moeller M. J. (2007). L-Carnosine, a substrate of carnosinase-1, influences
glucose metabolism. Diabetes 56, 2425-2432.
Sewell D. A., Harris R. C., Marlin D. J., Dunnett M. (1992). Estimation of the carnosine content of
different fibre types in the middle gluteal muscle of the thoroughbred horse. Journal of
Physiology 455, 447-453.

40
Shiau C.-Y., Pong Y.-J., Chiou T.-K., Chai T. (1996). Free amino acids and nucleotide-related
compounds in milkfish (Chanos chanos) muscles and viscera. Journal of Agricultural and
Food Chemistry 44, 2650-2653.
Shiau C.-Y., Pong Y.-J., Chioe T.-K., Chai T. (1997). Effect of growth on the levels of free histidine and
amino acids in white muscle of milkfish (Chanos chanos). Journal of Agricultural and Food
Chemistry 45, 2103-2116.
Shikata T., Iwanaga S., Shimeno S. (1995). Regulation of carbohydrate metabolism in fish .25.
Metabolic response to acclimation temperature in carp. Fisheries Science 61, 512-516. Cited
by Moreira et al., 2008.
Specziár A. (2002). An in situ estimate of food consumption of five cyprinid species in Lake Balaton.
Journal of Fish Biology 60, 1237-1251.
Spigarelli S. A., Thommes M. M., Beitinger T. L. (1977). The influence of body weight on heating and
cooling in selected Lake Michigan fishes. Comparative Biochemistry and Physiology 56A, 51
57.
Squires E. J., Hall D. E. Feltham L. A. W. (1979). Seasonal changes in plasma amino acid levels in
the winter flounder (Pseudopleuronectes americanus). Canadian Journal of Zoology 57, 1483-
1442. Cited by Costas et al., 2012.
Stevens E. D., Fry F. E. J. (1970). The rate of thermal exchange in a teleost, Tilapia mossambica.
Canadian Journal of Zoology 52, 1137-1145. Cited by Beitinger et al., 2000.
Stevens E. D., Fry F. E. J. (1974). Heat transfer and body temperatures in non-thermoregulatory
teleosts. Canadian Journal of Zoology 52, 1137-1145.
Stickney R. R. (2000). Encyclopedia of aquacuture. John Wiley and Sons, New York.
The World Bank. (2008). World development report 2008: agriculture for development. World Bank,
Washington, DC, 356 pp.
Trushenski J. T., Kasper C. S., Kohler C. C. (2006). Challenges and opportunities in finfish nutrition.
North American Journal of Aquaculture 68, 122-140.

41
Van Waarde A. (1988). Biochemistry of non-protein nitrogenous compounds in fish including the use
of amino acids for anaerobic energy production. Comparative Biochemistry and Physiology,
Part B 91, 207-228.
Verbrugghe A., Janssens G. P. J., Meininger E., Daminet S., Piron K., Vanhaecke L., Wuyts B., Buyse
J., Hesta M. (2010). Intestinal fermentation modulates postprandial acylcarnitine profile and
nitrogen metabolism in a true carnivore: the domestic cat (Felis catus). British Journal of
Nutrition 104, 972-979.
Vreken P., van Lint A. E. M., Bootsme A., Overmars H., Wanders R. J. A., van Gennip A. H. (1999).
Rapid diagnosis of organis acedemias and fatty-acid oxidation defects by quantitative
electrospray tandem-MS acyl-carnitine analysis in plasma. In Quant P. A., Eaton S. (Editors)
Current Views of Fatty Acid Oxidation and Ketogenesis – from Organelles to Point Mutations,
Kluwer, New York, p. 327-337. Cited by Verbrugghe et al., 2010.
Warwick E. J., Legates J. E. (1979). Breeding and improvement of farm animals. McGraw-Hill Book
Company, New York, p.264. Cited by Gjedrem et al., 2012.
Webb M. A. H., Van Eenennaam J. P., Feist G. W., Linares-Casenace J., Fitzpatrick M. S., Schreck C.
B., Doroshov S. I. (2001). Effects of thermal regime on ovarium maturation and plasma sex
steroids in farmed white sturgeon, Acipenser transmontanus. Aquaculture 201, 137-151.
Wedemeyer G. R., Meyer F. P., Smith L. (1999). Environmental stress and fish diseases. Narendra
Publishing House, Delhi, India, p.107. Cited by Chatterjee et al., 2004.
Wilson R. P. (1994). Utilization of dietary carbohydrate by fish. Aquaculture 124, 67-80.
Woo N. Y. S. (1990). Metabolic and osmoregulatory changes during temperature acclimation in the
red sea bream, Chrysophrys major: implications for its culture in the subtropics. Aquaculture
87, 197-208.
World Meteorologial Organization (2015). WMO: 2015 likely to be warmest on record, 2011-2015
Warmest Five Year Period. Internet reference: https://www.wmo.int/media/content/wmo-2015-
likely-be-warmest-record-2011-2015-warmest-five-year-period (consulted on November 27).
Worm B., Barbier E. B., Beaumont N., Duffy J. E., Folke C., Halpern B. S., Jackson J. B. C., Lotze H.
K., Micheli F., Palumbi S. R., Sala E., Selkoe K. A., Stachowicz J. J., Watson R. (2006).
Impacts of biodiversity loss on ocean ecosystem services. Science 314, 787-790.
Wu G. (2009). Amino acids: metabolism, functions, and nutrition: a review. Amino acids 37, 1-17.
42
Yamada S., Kawashima K., Baba K., Oku T., Ando S. (2009). Occurrence of a novel acetylated amino
acid, Nα-acetylhistidine, in skeletal muscle of freshwater fish and other ectothermic
vertebrates. Comparative Biochemistry and Physiology, Part B 152, 282-286.
Zhang Y., Dabrowski K., Hliwa P., Gomulka P. (2006). Indispensable amino acid concentrations
decrease in tissues of stomachless fish, common carp in response to free amino acid- or
peptide-based diets. Amino Acids 31, 165-172.
Zhou Q.-C., Buentello J. A., Gatlin III D. M. (2010). Effects of dietary prebiotics on growth
performance, immune response and intestinal morphology of red drum (Sciaenops ocellatus).
Aquaculture 309, 253-257.