Nutrient Management - Corn Agronomycorn.agronomy.wisc.edu/Management/pdfs/A3557.pdf · improved...
27
algae is most limited by its availability. Consequences of increased aquatic plant and algae growth include the deple- tion of dissolved oxygen contents of lakes resulting in fish kills, as well as reduced aesthetic and recreational values of lakes. Appropriate nutrient management practices for corn production vary widely due to cropping, topographical, en- vironmental, and economic conditions. With the variety of factors to consider in corn fertility management, it is nearly impossible to recommend best management practices ap- plicable to all Wisconsin farms. Nutrient management prac- tices for preserving water quality while maintaining or im- proving farm profitability must be tailored to the unique conditions of individual farms. A number of options for improved nutrient management are available to Wisconsin corn growers and are discussed in this publication. Introduction Soil nutrients, like all agricultural inputs, need to be managed properly to meet the fertility requirements of corn without adversely affecting the quality of our water re- sources. The corn nutrients of greatest concern relative to water quality are nitrogen (N) and phosphorus (P). Nitro- gen not recovered by a corn crop can contribute nitrate to groundwater through leaching. Nitrate is the most common groundwater contaminant found in Wisconsin, and the United States as a whole. Nitrate levels that exceed the es- tablished drinking water standard of 10 ppm nitrate-N have the potential to adversely affect the health of infants and livestock. Surface water quality is the concern with P management. Erosion and runoff from fertile cropland add nutrients to surface waters that stimulate the excessive growth of aquatic weeds and algae. Of all crop nutrients, P is the most important to prevent from reaching surface wa- ter since the biological productivity of aquatic plants and Nutrient Management Practices for Wisconsin Corn Production and Water Quality Protection A3557 University of Wisconsin-Extension - Cooperative Extension College of Agricultural and Life Sciences, University of Wisconsin - Madison
Transcript of Nutrient Management - Corn Agronomycorn.agronomy.wisc.edu/Management/pdfs/A3557.pdf · improved...

Nutrient Management 3
algae is most limited by its availability. Consequences ofincreased aquatic plant and algae growth include the deple-tion of dissolved oxygen contents of lakes resulting in fishkills, as well as reduced aesthetic and recreational valuesof lakes.
Appropriate nutrient management practices for cornproduction vary widely due to cropping, topographical, en-vironmental, and economic conditions. With the variety offactors to consider in corn fertility management, it is nearlyimpossible to recommend best management practices ap-plicable to all Wisconsin farms. Nutrient management prac-tices for preserving water quality while maintaining or im-proving farm profitability must be tailored to the uniqueconditions of individual farms. A number of options forimproved nutrient management are available to Wisconsincorn growers and are discussed in this publication.
IntroductionSoil nutrients, like all agricultural inputs, need to be
managed properly to meet the fertility requirements of cornwithout adversely affecting the quality of our water re-sources. The corn nutrients of greatest concern relative towater quality are nitrogen (N) and phosphorus (P). Nitro-gen not recovered by a corn crop can contribute nitrate togroundwater through leaching. Nitrate is the most commongroundwater contaminant found in Wisconsin, and theUnited States as a whole. Nitrate levels that exceed the es-tablished drinking water standard of 10 ppm nitrate-N havethe potential to adversely affect the health of infants andlivestock. Surface water quality is the concern with Pmanagement. Erosion and runoff from fertile cropland addnutrients to surface waters that stimulate the excessivegrowth of aquatic weeds and algae. Of all crop nutrients, Pis the most important to prevent from reaching surface wa-ter since the biological productivity of aquatic plants and
Nutrient ManagementPractices for Wisconsin Corn Production and Water Quality Protection
A3557University of Wisconsin-Extension - Cooperative ExtensionCollege of Agricultural and Life Sciences, University of Wisconsin - Madison

4 Nutrient Management
dent. At this point, soil tests are needed to keep soils withinoptimum nutrient supply ranges.
The Wisconsin soil testing program is research-based,reflects environmental concerns, and recognizes the needfor profitability in crop production. Soil testing has somelimitations, but it is the best available tool for predictingcrop nutrient needs. Nutrient application recommendationscan only be accurate if soil samples representative of thefield of interest are collected. Complete instructions forproper soil sampling are included in UWEX publicationA2100, Sampling Soils for Testing. Samples that are un-representative of fields often result in recommendations thatare misleading. In addition, field history information mustbe provided with the soil samples in order to accuratelyadjust the fertility recommendations to account for nutrientcredits from field-specific activities such as manure appli-cations and legumes in the rotation.
The most important consideration in sound nutrientmanagement for corn production is application rate. Nutri-ent applications in excess of crop needs are unwise fromboth an environmental and economic viewpoint. Applica-tions of N greater than corn requirements increase the po-tential for nitrate leaching to groundwater. Similarly, over-applications of P can increase the detrimental impacts ofcropland runoff and erosion on surface water quality.
Soil nutrients removed from cropping systems via leach-ing or erosion are investments lost by the grower. How-ever, soil nutrient levels that are inadequate to meet the re-quirements of a crop often result in yields below thoseneeded for reasonable profit. Because of the overall impor-tance of nutrient application rates, accurate assessments ofcorn nutrient needs are essential for minimizing threats towater quality while maintaining economically sound pro-duction. Soil testing is imperative in the accurate determi-nation of supplemental fertilizer requirements of corn.
Wisconsin Soil TestRecommendations
The importance of a regular soil testing program haslong been recognized by most corn growers. The goals ofWisconsin’s soil testing program are to determine existinglevels of available soil nutrients and recommend fertilizerapplications to prevent any nutrient deficiency which mayhinder crop production. Proper soil testing will give a rela-tive index of soil supplied nutrients and nutrients previouslysupplied from manure, legume crops or commercial fertil-izer. When the nutrient supply drops below a “critical” levelfor a particular soil and crop, yield reduction will occur.Since nutrient demands are not uniform throughout the en-tire growing season, an adequate supply must be plannedfor the period of peak demand. Supplemental fertilizer ap-plications based on soil test results allow the nutrient de-mand to be met. As farmers apply increasing amounts ofnutrients, and as soil fertility levels increase, water qualityproblems associated with excess nutrients may become evi-
NutrientApplication Rates

Nutrient Management 5
The following sections of this publication focus mainlyon N and P management for minimizing threats to waterquality. However, it should not be forgotten that overall soilfertility management involves monitoring all crop nutrientlevels. Likewise, soil pH must be properly adjusted andmaintained to maximize the availability and efficient use ofsoil nutrients.
Nitrogen
Nitrogen application rate is often the single most im-portant factor affecting the efficiency of N use by corn andthe extent of nitrate loss to groundwater. It is imperativethat N application rate recommendations accurately predictthe amount of N needed to obtain acceptable corn yieldsand minimize environmental impacts.
Wisconsin’s N recommendations for corn are basedon soil yield potential, soil organic matter content, and soiltexture. Yield goal estimates—which were often over-opti-mistic and led to excessive N applications—are no longera direct component of N recommendations. Nitrogenrecommendations for corn are based on N response researchconducted on a range of Wisconsin soils. Data generatedfrom this research indicates that the optimum N rate forcorn on a given soil is similar in high or low yielding years(Fig. 1). Recovery of N by corn is high under favorablegrowing conditions, but N recovery is low under poor grow-ing conditions, such as during seasons with drought stress.
The University of Wisconsin N recommendations forcorn are shown in Table 1. Sandy soils (sands and loamysands) are given separate recommendations depending onwhether they are irrigated. The lower recommendations fornon-irrigated sandy soils reflect the lower corn yield poten-tial in an environment where moisture is often inadequate.For medium and fine-textured soils, N recommendations arebased on soil yield potential and organic matter content.Every soil series in Wisconsin is assigned a yield potentialranking of very high, high, medium or low. The ranking isbased on length of the growing season and soil characteris-tics such as drainage, depth, and water holding capacity.Soils with very high or high yield potentials receive a higherN recommendation than those with a medium or low yieldpotential ranking. When the yield potential of a soil is un-known (due to the soil series name not being identified witha soil sample), the 2,300 growing degree day (GDD) accu-mulation line (May 1 to September 30, 50° F base) is usedto separate the northern soils, with lower optimum N rates,from the southern soils (Fig. 2).
The soil test N recommendations for corn in Table 1should be considered the maximum amount of N neededfor economically optimum yields. These N recommenda-tions are adjusted for manure and legume N contributionsif information on manure applications and crop rotation isprovided with the soil sample. Further adjustments for re-sidual soil nitrate need to be made separately if a soil ni-trate test is performed on the field.
50 100 150 200 250 3000
1959
1960
1983
1978
1984
1980
1979
1985
1986
60
130
200
Figure 1. Corn yield response to N application over several years on a Plano silt loam soil.
Nitrogen Application Rate(lb/a)
CornGrainYield(bu/a)

6 Nutrient Management
Users of the University of Wisconsin N recommenda-tions should be aware of the relationship between increasedreturns from the use of N at rates needed for economic op-timum yields and the risk of nitrate loss to groundwater.The data illustrated in Table 2 provide a typical example ofthe relationships among N rate, yield, profitability, and croprecovery of applied N. In this case, it is clear that yieldsand economic return increase up to the 160 lb N/acre rate.However, crop recovery of N decreases and the potential
for nitrate loss to the environment increases as N rates areincreased to, and especially above, the economic optimum.Although the risk of nitrate loss to groundwater is lower atN rates below the economic optimum, yields and economicreturns are also likely to be lower.
Methods for Improving Nitrogen Recommendations
The recent development of soil tests for assessing soilN levels has provided new tools for improving the efficiencyof N fertilizer applications to corn. Soil testing for N al-lows corn N recommendations to be adjusted for the nu-merous year and site-specific conditions that can influenceN availability. Two soil N tests are currently available. Oneis a technique for assessing N requirements based on mea-suring the residual soil profile nitrate present before plant-ing. The other is a pre-sidedress soil nitrate test that pro-vides an index of N availability and predicts sidedress Nrequirements.
In humid climates such as Wisconsin, it had been as-sumed that N applied to crops was utilized, immobilized,or lost through leaching or denitrification prior to the fol-lowing growing season. However, research has shown thatin some years, significant amounts of residual nitrate re-main in the root zone where it can be utilized by subse-quent crops. Soil nitrate testing can determine the amountof nitrate-N that has “carried-over” from the previous grow-ing season and is available to crops. Nitrogen fertilizer rec-ommendations in fields where a soil nitrate test has beenused can be reduced to reflect the soil’s residual nitrate con-tent. Crediting residual nitrate not only reduces fertilizercosts; it also aids in reducing risks of nitrate movement togroundwater due to N application in excess of crop needs.
Figure 2. The separation of very high/highand medium/low yield potentialsoils according to 2,300 growingdegree day (GDD) accumulationand county boundries (2,300GDD = May 1 to Sept. 30, 50° base).
Table 1. Nitrogen recommendations for corn.
Sands and loamy sands Other soilsSoil organic matter Irrigated Non-irrigated Medium and low Very high
yield potential1 and high yieldpotential1
(%) - - - - - - - - - - - - - - - - - - - - - - - - (lbs N/a) - - - - - - - - - - - - - - - - - - - - - - - -
< 2.0 200 120 150 1802.0 – 9.9 160 110 120 160
10.0 – 20.0 120 100 90 120> 20.0 80 80 80 80
1 To determine soil yield potential, see Table 16 of UWEX bulletin A2809, Soil Test Recommendations for Field, Vegetable, andFruit Crops, or contact your agronomist or county agent.

Nutrient Management 7
The potential for nitrate to remain in a soil profile fromthe previous growing season is affected by soil texture andprecipitation amounts (Table 3). Generally, nitrate is morelikely to accumulate on silt loam or heavier textured soils.Nitrate-N carry-over on sandy soils is not expected, andneither the preplant or pre-sidedress nitrate test is recom-mended on sands. The potential for nitrate carry-over isgreatest when:
precipitation during the previous growing seasonand over-winter period is normal or below normal
the amount of previously applied N (includingmanure and legumes) was greater than thecrop’s need
pest problems or climatic conditions limitedcrop uptake of N during the previousgrowing season.
Preplant Soil Nitrate Test
A preplant soil nitrate test involves deep soil samplingin the spring prior to both corn planting and any N applica-tions. Soil samples need to be collected in one foot incre-ments to a depth of two feet. Previously, the suggested sam-pling depth was three feet. The amount of nitrate-N in thethird foot is now estimated based on the nitrate content inthe top two feet—unless samples are taken to the three footdepth.
Early spring sampling measures only the nitrate formof N in the soil. Preplant soil nitrate test samples are usu-ally collected too early in the growing season to measure Nreleased from fall or spring manure applications, previous
legume crops, and soil organic matter. However, if back-ground information on field management is provided withthe soil samples, standard N credits for manure, legumesand organic matter are deducted from the N fertilizer rec-ommendation. Because soil sampling occurs too early tomeasure the N contributions from legumes, the preplant ni-trate test is most useful in years of corn following corn in arotation. If corn follows a forage legume (alfalfa), the testis not needed; however, the standard N credit for the previ-ous legume crop should be taken or the pre-sidedress soilnitrate test could be used.
Sampling procedures for the preplant soil nitrate testand information on sample handling are available from yourlocal UWEX office, as well as in UWEX publication A3512Wisconsin’s Preplant Soil Profile Nitrate Test.
Pre-sidedress Soil Nitrate Test
The pre-sidedress soil nitrate test is another method avail-able to corn growers for improving the efficiency of N appli-cations. Unlike preplant soil nitrate test samples, soil samplesfor the pre-sidedress nitrate test are collected only to a depthof one foot when corn plants are 6 to 12 inches tall, usuallyfour to six weeks after planting. Mineralization of organic Nto the plant-available nitrate form has usually occurred by thetime pre-sidedress samples are collected. Consequently, thissoil test can measure the amount of N released from previouslegumes, fall/spring manure applications, and soil organicmatter as well as residual nitrate in the top foot of soil. Thepre-sidedress soil nitrate test can be a valuable tool for grow-ers wanting to confirm the amount of N credited from manureor previous legume crops.
Table 2. Yield, economic return, and recovery of applied N with 40 lb/a increments of fertilizer N appliedto continuous corn. Janesville, Wisconsin, 1983–85.1
N recovery in grainN rate Yield Value of yield increase Return Incremental Total
(lb/a) (bu/a) ($/a) ($/a) (%) (%)
0 93 — — — —40 115 44 38 45 4580 131 32 26 45 40
120 138 14 8 20 37160 144 12 6 17 32200 145 2 -4 0 25
1 Assumes $0.15/lb for N and $2.00/bu for corn.

8 Nutrient Management
the usefulness of the test for determining N application ratesat soil test levels below the critical value of 21 ppm N. Spe-cific N rate recommendations for corn at various pre-sidedress test results are shown in Table 4.
Growers using the pre-sidedress rather than the pre-plant nitrate test have the advantage of a less labor-inten-sive sample collection procedure which can reduce theamount of time spent soil sampling. However, use of thepre-sidedress nitrate test may have some disadvantages tocorn growers. Obviously, growers using the pre-sidedresstest are locked into applying any supplemental N as asidedress application. This removes some flexibility in thetype of N fertilizer and fertilizer application method thatcan be used. An additional consideration when using thepre-sidedress test is time. Use of this test requires that soilsampling, laboratory analysis, and sidedress N applicationsall occur during a short period of time (one to two weeks)when a grower may be committed to other farm operations,such as cultivating, haying, etc.
Nitrogen recommendations based on either soil nitratetest are offered by University of Wisconsin labs in Madi-son and Marshfield and by several commercial soil testinglabs. The names of commercial labs performing these testsare available from county UWEX offices.
Table 3. Relative effects of soil texture,and previous growing seasonand over-winter precipitation onnitrate-N carry-over potential.
PrecipitationSoil Below Normal AboveTexture Normal Normal
Sand Low Low LowLoam High Medium LowSilt loam, High High Low& finer
Table 4. Corn nitrogen recommendationsbased on the pre-sidedress soilnitrate test (PSNT).
Soil Yield Potential1
PSNT Very High/ Medium/Result High Low
N N Application Rate
- - - (ppm) - - - - - - - - - - - (lb/a) - - - - - - - -
≥ 21 0 020–18 60 4017–15 100 4014–13 125 8012–11 150 80≤ 10 1602 1202
1 To determine a soil's yield potential, consult UWEXpublication A2809, Soil test recommendations for field,vegetable and fruit crops, or contact your agronomistor county agent.
2 Unadjusted nitrogen application rate.
Pre-sidedress nitrate test results are interpreted using acritical value of 21 ppm nitrate-N. Fields testing above 21ppm N will most likely not respond to additional N. Fieldstesting below 21 ppm N will likely respond to additional N.Recent research showing a relationship between pre-sidedress test results and soil yield potential has improved

Nutrient Management 9
siderations. As a result, soil fertility levels have the poten-tial to drop below economically productive thresholds inonly a few growing seasons. To prevent this, soil test levelsneed to be monitored closely to detect changes in P and Kstatus. It is recommended that soil tests be taken at leastevery three years and preferably every other year on sandyand other soils of low buffering capacity. Detailed infor-mation on soil test recommendations is available in UW-Extension publication A2809, Soil Test Recommendationsfor Field, Vegetable and Fruit Crops.
Optimum soil test levels for P and other nutrients forcorn production in Wisconsin are given in Table 5. Cornfertilizer recommendations for P and K are based on yieldgoals and soil test results as shown in Table 6. Note thatsoil test levels for P and K are reported in parts per million(ppm).
Realistic Yield Goals
As shown in Table 6, an important criteria in the recom-mendation of appropriate P and K application rates for cornis the determination of realistic yield goals. Yield goal esti-mates that are too low will underestimate P and K needsand could inhibit corn yield. Yield goal estimates that aretoo high will overestimate corn needs and will result in soilnutrient levels beyond those needed by the crop which couldincrease the likelihood for nutrient contributions to surfacewaters.
Table 5. Optimum Wisconsin test levels for corn.
Medium & fine textured soilsSoil test Southern & Eastern Northern Sandy Organic
Western Red soils soils
- - - - - - - - - - - - - - - - - - - - - - - - - - (ppm) - - - - - - - - - - - - - - - - - - - - - - - - - -
Available Phosphorus 11–20 16–20 13–18 23–32 23–32Exchangeable Potassium 81–110 81–110 101–130 66–90 66–90Calcium 600–1,000 600–1,000 600–1,000 400–600 600–1,000Magnesium 100–500 100–500 100–500 50–250 100–500Sulfur 30–40 30–40 30–40 30–40 30–40Manganese 10–20 10–20 10–20 10–20 10–20Zinc 3–20 3–20 3–20 3–20 3–20Boron 0.9–1.5 0.9–1.5 0.9–1.5 0.5–1.0 1.1–2.0
Phosphorus
Careful management of phosphorus (P) in corn pro-duction is essential for preventing nutrient enrichment ofsurface waters. Contributions of P to surface waters havebeen shown to increase with increasing rates of applied P.Fertilizer applications at rates higher than crop utilizationare unwise from both an environmental and economic view-point. Using soil tests to determine crop P needs, settingrealistic crop yield goals, and taking appropriate nutrientcredits are techniques which will reduce environmental riskand increase economic benefits.
To avoid over-fertilization with P and other nutrients,fertilizer additions should be made according to soil testresults. Regular and systematic soil testing is required fordetermining P application rates. The University of Wiscon-sin soil testing system recommends soil nutrient applica-tions at levels which in combination with nutrients suppliedby the soil result in the best economic return for the grower.This reliance on both soil-supplied and supplemental nutri-ents reduces threats to water quality by avoiding excessivenutrient applications. At optimum soil test levels, the rec-ommended P and potassium (K) additions are approximatelyequal to anticipated crop removal and are needed to opti-mize economic return and maintain soil test levels in theoptimum range. Additions of P and K at optimum soil testlevels are essential to prevent reductions in yields and profits.
The soil test recommendation program de-emphasizesthe former build-up/maintenance philosophy in favor of abetter balance between environmental and economic con-

10 Nutrient Management
Yield goals must be realistic and achievable based onrecent yield experience. Estimates used to determine corn Pand K requirements should be cautiously optimistic but notmore than 10 to 20% above the recent average corn yieldfrom a particular field. Yield goals 10 to 20% higher than a3-to 5-year average yield are suggested because annual yieldvariations due to factors other than nutrient application rates(primarily climatic factors) are often large.
Critical to successful estimation of corn yield goals isthe keeping of accurate records containing corn yields fromspecific fields. Absence of crop yield records can result inother, less reliable, estimates being used in the determina-tion of corn P and K requirements. It is strongly recom-mended that growers develop or maintain accurate corn yieldrecords. The information gathered from such records canincrease production efficiency and minimize threats towater quality.
Table 6. Corn fertilization recommendations for phosphate and potash at various soil testinterpretation levels.
Soil test interpretation1
Yield goal Very Low2 Low2 Optimum High Excessively High3
(bu/a) - - - - - - - - - - - - - - - - - - - - - - - - - - P2O5, (lb/a) - - - - - - - - - - - - - - - - - - - - - - - - - -
71–90 60–90 50–70 30 15 091–110 70–100 60–80 40 20 0111–130 75–105 65–85 45 25 0131–150 85–115 75–95 55 25 0151–170 90–120 80–100 60 30 0171–190 100–130 90–110 70 35 0191–220 105–135 95–115 75 40 0
- - - - - - - - - - - - - - - - - - - - - - - - - - K2O, (lb/a) - - - - - - - - - - - - - - - - - - - - - - - - - -71–90 50–80 40–65 25 15 091–110 55–85 45–70 30 15 0111–130 60–90 50–75 35 15 0131–150 65–95 55–80 40 20 0151–170 70–100 60–85 45 20 0171–190 75–105 65–90 50 20 0191–220 80–110 70–95 55 25 0
1 Where corn is harvested for silage, an additional 30 lb P2O5 /a and 90 lb K2O/a should be applied to the subsequent crop if soiltests are optimum or below.2 For phosphate, use the higher values on sandy or organic soils and lower values for other soils. For potash, use the lower valueson sandy or organic soils and higher values for other soils.3 Use a small amount of starter fertilizer on soils that warm slowly in spring (a minimum addition is considered 5, 10, 10 lb/a of N,P2O5, and K2O, respectively).

Nutrient Management 11
Nutrient CreditingThe best integration of economic return and environ-
mental quality protection is provided by considering nutri-ents from all sources. In the determination of supplementalfertilizer application rates, it is critical that nutrient contri-butions from manure, previous crops grown in the rotation,and land-applied organic wastes are credited. Both economicand environmental benefits can result if the nutrient sup-plying capacity of these nutrient sources is correctly esti-mated. Economically, commercial fertilizer application ratescan often be reduced or eliminated entirely when nutrientcredits are properly assessed. Environmentally, the preven-tion of over-fertilization reduces potential threats to waterquality. The use of appropriate nutrient credits is of par-ticular importance in Wisconsin where manure applicationsto cropland and legume crop production are common.
Manure
Manure can supply crop nutrients as effectively as com-mercial fertilizers in amounts that can meet the total N andP requirements of corn. In order to utilize manure efficiently,the application rate and nutrient supplying capacity need tobe estimated. Guidelines for determining rates of applica-tion can be found in UWEX publication A3537, NitrogenCredits for Manure Applications. The most effective methodfor gauging the nutrient content of manure is to have samplesanalyzed by a commercial or university laboratory. Largefarm-to-farm variation can occur in nutrient content due tomanure storage, handling, livestock feed, or other farmmanagement differences. Unfortunately, laboratory analy-sis is not always convenient or available; in such instances,estimates of crop nutrients supplied by animal manuresshould be made. Table 7 summarizes the University ofWisconsin recommendations for average nutrient values oflivestock manures common to the state.
As indicated in Table 7, not all the nutrients in manureare available in the first year following application. Forexample with N, manure contains both organic and inor-ganic N—only the inorganic form is immediately availablefor crop uptake. The available N contribution to corn fromdairy manure is approximately 30-35% of the total N con-tent of the manure in the first crop year. Additional amountsof nutrients are added to the soil in the second and thirdyear following manure applications. Detailed informationon the second and third year manure nutrient credits can befound in USDA-Natural Resources Conservation ServiceWisconsin Field Office Technical Guide–Sec. IV, Spec. 590.
Table 7. Average nutrient content fromvarious manures.1
Animal Type2
Dairy Beef Swine3 Poultry
Total Nutrient Content
Nitrogen (N)Solid (lbs/ton) 10 14 14 40Liquid (lbs/1000 gal) 24 20 25 16
Phosphate (P2O5)Solid (lbs/ton) 5 9 10 504
Liquid (lbs/1000 gal) 9 9 23 10
Potash (K2O)Solid (lbs/ton) 9 11 9 30Liquid (lbs/1000 gal) 20 20 22 12
First Year Availability
Nitrogen (N)Solid (lbs/ton)
surface applied 3 4 7 20incorporated 4 5 9 24
Liquid (lbs/1000 gal)surface applied 7 5 13 8incorporated 10 7 16 10
Phosphate (P2O5)Solid (lbs/ton) 3 5 6 304
Liquid (lbs/1000 gal) 5 5 14 6
Potash (K2O)Solid (lbs/ton) 7 9 7 24Liquid (lbs/1000 gal) 16 16 18 101 Values are rounded to the nearest pound.2 Assumes 24, 35, 20 and 60% dry matter for solid
dairy, beef, swine and poultry manure, respectively.Assumes 6, 5, 3, and 3% dry matter for liquid dairy,beef, swine, and poultry manure respectively.
3 Assumes a farrow-nursery indoor pit operation for swineliquid manure nutrient values.
4 For turkey, use 40 lb/ton for total nutrient content and 24lb/ton for first-year available nutrient content.
12 Nutrient Management
The Wisconsin soil test recommendations account formanure (and legume) nutrient credits when the appropriatefield history information is provided with soil samples. Thesoil test report utilizes the standard nutrient credits fromTable 7 unless specific manure analyses have been per-formed. For analyzed manure, 35 to 60% of the total N(depending on manure type), 55% of the total P2O5, and75% of the total K2O should be credited in the first year.The fertilizer adjustment for analyzed manure needs to bemade by the individual farmer, consultant, etc. For moreinformation on the nutrient value of manure, see UWEXfact sheet A3411, Manure Nutrient Credit Worksheet orA3537, Nitrogen Credits for Manure Applications.
Management recommendations for minimizing the threatof manure nutrient losses to surface and groundwater are de-scribed in the manure management section of this publication.
Legumes
Legume crops, such as alfalfa, clover, soybeans, andleguminous vegetables, have the ability to fix atmosphericN and convert it to a plant-available form. When grown ina rotation, some legumes can supply substantial amountsof N to a subsequent corn crop. For example, a good standof alfalfa can often provide all of the N needed for a corncrop following it in a rotation. An efficient nutrient man-agement program needs to consider the N contribution of alegume to the next crop.
Table 8 lists the N credits currently recommended inWisconsin for various legume crops. With forage legumes,stand density, soil texture, and cutting schedule affect thevalue of the N credit. Detailed information on legume-Ncrediting can be found in UWEX Publication A3517 Us-ing Legumes as a Nitrogen Source.
Similar to the nutrient credits for manure applications,the Wisconsin soil test recommendations account for the
nutrient contributions from legumes, provided that rotationinformation is included with the soil samples submitted fortesting.
Whey and Sewage Sludge
Application of organic wastes such as whey and sew-age sludge is common in certain areas of the state; how-ever, the overall percentage of corn acres treated with or-ganic wastes is relatively small. Nonetheless, the nutrientcontributions from sludge and whey applications are oftensignificant and need to be credited. Special management andregulatory considerations pertain to the land application ofthese and other organic waste materials. Detailed informa-tion on the nutrient values and management practices asso-ciated with sludge and whey applications to agriculturallands is available in UWEX publications R2779, SewageSludge Wastes that can be Resources, and A3098, UsingWhey on Agricultural Land–A Disposal Alternative.
Starter FertilizerA minimal amount of starter fertilizer is recommended
for corn planted in soils slow to warm in the spring. Forcorn grown on medium and fine textured soils, a minimumapplication of 10 lb N, 20 lb P2O5, and 20 lb K2O per acreis recommended as a starter fertilizer at planting. In mostcorn fields, all the recommended P2O5 and K2O can be ap-plied as starter fertilizer. On soils with test levels in the ex-cessively high range, starter fertilizer applications in ex-cess of 10 lb N, 20 lb P2O5, and 20 lb K2O per acre shouldbe avoided. Any amount of N applied as starter fertilizerthat exceeds 20 lb N/acre should be credited against theoverall N recommendation.

Nutrient Management 13
Table 8. Nitrogen credits for legume crops.
Legume Crop N Credit Exceptions
ForagesFirst Year Credit
Alfalfa 190 lb N/acre for a good stand1 Reduce credit by 50 lb N/a160 lb N/acre for a fair stand1 on sandy soils2
130 lb N/acre for a poor stand1 Reduce credit by 40 lb N/acreif less than 8 inches of regrowthat time of kill
Red clover 80% of alfalfa credit Same as alfalfa
Birdsfoot trefoil 80% of alfalfa credit Same as alfalfa
Second Year CreditFair or good stand 50 lb N/acre No credit on sandy soils2
Green manure cropsSweet clover 80–120 lb N/acre Use 20 lb N/acre credit ifAlfalfa 60–100 lb N/acre field has less than 6 inches of
Red clover 50–80 lb N/acre growth before tillage, killingfrost, or herbicide application
Soybeans credit of 40 lb N/acre No credit on sandy soils2
Leguminous vegetable cropsPeas, snap beans and lima beans 20 lb N/acre No credit on sandy soils2
1 A good stand of alfalfa (70–100% alfalfa) has more than 4 plants/ft 2; a fair stand (30–70% alfalfa) has 1.5 to 4 plants/ft 2; and apoor stand
(< 30% alfalfa) has less than 1.5 plants/ft 2.2 Sandy soils are sands and loamy sands.

14 Nutrient Management
Fall Versus Spring NApplications
The advantages and disadvantages of fall N fertilizerapplications have been discussed for many years. An in-creased risk of N loss during the fall and early spring needsto be weighed against the price and convenience advantagesoften associated with fall-applied N. The agronomic con-cern with fall N applications is that losses between appli-cation and uptake the following growing season will lowercrop recovery of N and reduce corn yield. The environmentalconcern with fall application is that the N lost prior to cropuptake will leach into groundwater.
Fall to spring precipitation, soil texture, and soil mois-ture conditions influence the potential for fall-applied Nlosses. As a result, the relative effectiveness of fall N ap-plications varies widely from one year to the next depend-ing on climatic conditions. If a soil is wet in the fall, rain-fall may cause either leaching of nitrate in coarse soils ordenitrification of nitrate in heavy, poorly drained soils. Long-term studies indicate that fall applications are usually less
Timing of application is a major consideration in N fer-tilizer management. The period between N application andcorn uptake is an important factor affecting the efficientutilization of N by the crop and the amount of nitrate-Nlost through leaching or other processes. Obviously, loss ofN can be minimized by supplying it just prior to the periodof greatest uptake by corn. In Wisconsin this typically oc-curs in mid-June throughout July when corn is in a rapidgrowth and dry matter accumulation period. Applicationsat such times reduce the potential for N to leach from theroot zone before plant uptake can occur. On sandy soils,this kind of timely application is essential. On medium andfiner textured soils, N leaching losses during the growingseason are significantly less. Other factors including soil,equipment, and labor, are involved in determining the mostconvenient, economical, and environmentally safe N fertil-izer application period for corn.
In regards to P fertilizer management, application tim-ing is not a major factor affecting water quality protection.However, applications of P on frozen sloping soils or ap-plications just prior to likely runoff events should be avoidedto prevent P contributions to surface waters.
Timing of Applications

Nutrient Management 15
effective than spring applications. Wisconsin research hasshown fall applications on medium textured soils to be 10to 15% less effective than the same amount of N appliedspring preplant.
For both agronomic and environmental reasons, fallapplications of N fertilizers are not recommended oncoarse textured soils or on shallow soils over fracturedbedrock. If fall applications are to be made on other soils,they should be limited to the application of only the ammo-nium forms of N (anhydrous ammonia, urea, and ammo-nium sulfate) on medium textured, well-drained soils whereN losses through leaching or denitrification are usually low.Fall applications of N should also be delayed until soil tem-peratures are less than 50° F in order to slow the conver-sion of ammonium to nitrate by soil organisms. If fall ap-plications must be made when soil temperatures are higherthan 50° F, a nitrification inhibitor should be used. Studieshave shown that nitrification inhibitors are effective in de-laying the conversion of ammonium to nitrate when N isfall-applied. However, fall applications of N with an in-hibitor are still not likely to be as effective as spring-ap-plied N.
Preplant N ApplicationsSpring preplant applications of N are usually agronomi-
cally and environmentally efficient on medium-textured, welldrained soils. The potential for N loss prior to corn uptakeon these soils is relatively low with spring applications. Ifspring preplant applications of N are to be made on sandysoils, ammonium forms of N treated with a nitrification in-hibitor should be used. Likewise, nitrification inhibitors
should be used if spring preplant N is applied to poorlydrained soils. Use of nitrification inhibitors reduces the po-tential for N loss compared to preplant applications with-out them; however, sidedress or split applications are usu-ally more effective than preplant applications with nitrifi-cation inhibitors.
Sidedress N ApplicationsSidedress applications of N during the growing season
are effective on all soils with the greatest benefit on sandyor heavy textured-poorly drained soils (Table 9). The effi-ciency of sidedress N applications can be attributed to theapplication of N just prior to the period of rapid N uptakeby corn and a much shorter period of exposure to leachingor denitrification risks. Table 10 illustrates the higher yield
Table 9. Probability of corn yieldresponse with sidedressversus preplant N application.
Soil Relative Probability
Sands & loamy sands GoodSandy loams & loams FairSilt loams & clay loams:
– well-drained Poor– poorly drained Fair
Table 10. Effect of rate and time of N application on corn yield and recovery of applied N on sandy,irrigated soil. Hancock, Wisconsin, 1981–84.
Yield N RecoveryN Rate Preplant Sidedress1 Preplant Sidedress
- - - (lb/a) - - - - - - - - - - - - - (bu/a) - - - - - - - - - - - - - - - - - - - - (%) - - - - - - - - - -
0 38 38 — —70 88 105 50 73140 120 136 44 64210 132 143 40 49
Average 113 128 45 62
1 Sidedress treatments applied six weeks after planting.

16 Nutrient Management
and crop recovery of N on sandy soils with sidedress appli-cations. In these trials, use of sidedress N applications im-proved average N recovery over preplant applications by17%. The use of sidedress or delayed N applications onsandy soils is essential for minimizing N loss to groundwa-ter since unrecovered N on these soils will be lost throughleaching. Sidedress N applications may also be of benefiton shallow soils over fractured bedrock.
Sidedressing N requires more management than pre-plant N applications. In order to maximize efficiency,sidedress N applications must be properly timed to provideavailable N during the maximum N-uptake period for cornwhich begins at about 6 weeks after planting and continuesfor an additional 4 to 6 weeks. Applications too late mayresult in lower yield and plant injury from root pruning andother physical damage.
Split or Multiple N ApplicationsApplication of N fertilizer in several increments during
the growing season can be an effective method for reducingN losses on sandy soils. However, a single well-timedsidedress application is often as effective as multiple appli-cations. Ideally, split applications supply N when neededby the corn and allow for N application adjustments basedon early growing season weather or plant and soil tests.
Where split or multiple applications are used, any preplantN additions should be minimized and most of the N shouldbe applied just prior to expected crop use.
To be successful, the timing of application and place-ment of fertilizer materials are critical. Climatic factors,such as untimely rainfalls, may interfere with applicationschedules and could result in nutrient deficiencies. Splitapplications, as well as sidedress applications, also tend tobe more time, labor, energy and equipment intensive thanpreplant N applications.
FertigationA common method for split or multiple N applications
is via irrigation systems. Multiple applications of fertilizerN at relatively low rates (30-50 lb N/a) can be injected intothe irrigation water and applied to correspond with periodsof maximum plant uptake. Theoretically, this should makeless N available for loss through leaching. The most com-mon fertilizer applied in irrigation systems is 28% N solu-tion because it is readily available and causes little or noequipment problems during injection to irrigation water.Anhydrous ammonia should not be used in sprinkler irriga-tion systems because it can cause precipitation of calciumin the water and loss of free ammonia to the atmosphere.
Nutrient Management 17
The success of fertigation systems is dependent on cli-matic factors and proper management. Fertigation shouldnot be relied upon as a sole method of applying N in a crop-ping season for the following reasons:
Adequate rainfall during the early growing seasoncould delay or eliminate the need for irrigationwater. A delay in fertilizer application couldreduce yields dramatically.
Leaching can result if N is applied through anirrigation system at a time when the crop does notneed additional water.
All N applications need to be made prior to thecrop’s period of major N uptake. If applied later,little of the applied N will be used and leachingpotential will be increased.
It also needs to be noted that the potential for back-siphoning of N into the well exists with fertigation. Wis-consin law requires anti-siphoning check valves to be inplace on irrigation systems; however, if the guards are notproperly installed, maintained, or not in place at all,fertigation systems could directly contribute to groundwa-ter contamination.
Nitrification InhibitorsNitrification inhibitors are used with ammonium or
ammonium-forming N fertilizers to improve N efficiency
and limit losses of fertilizer N on soils where the potentialfor nitrate leaching or denitrification is high. Nitrificationinhibitors function by slowing the conversion of ammoniumto nitrate, thereby reducing the potential for losses of Nthat occur in the nitrate form. At this time nitrapyrin (N-Serve) is the only nitrification inhibitor registered for usein Wisconsin.
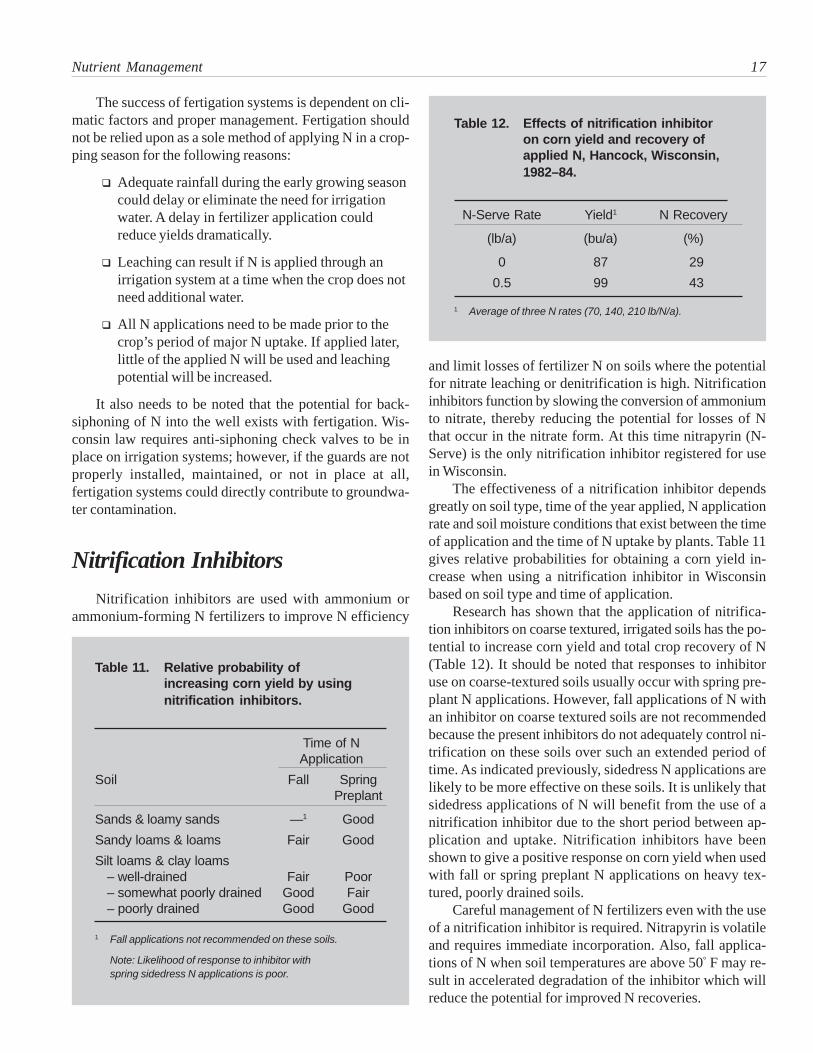
The effectiveness of a nitrification inhibitor dependsgreatly on soil type, time of the year applied, N applicationrate and soil moisture conditions that exist between the timeof application and the time of N uptake by plants. Table 11gives relative probabilities for obtaining a corn yield in-crease when using a nitrification inhibitor in Wisconsinbased on soil type and time of application.
Research has shown that the application of nitrifica-tion inhibitors on coarse textured, irrigated soils has the po-tential to increase corn yield and total crop recovery of N(Table 12). It should be noted that responses to inhibitoruse on coarse-textured soils usually occur with spring pre-plant N applications. However, fall applications of N withan inhibitor on coarse textured soils are not recommendedbecause the present inhibitors do not adequately control ni-trification on these soils over such an extended period oftime. As indicated previously, sidedress N applications arelikely to be more effective on these soils. It is unlikely thatsidedress applications of N will benefit from the use of anitrification inhibitor due to the short period between ap-plication and uptake. Nitrification inhibitors have beenshown to give a positive response on corn yield when usedwith fall or spring preplant N applications on heavy tex-tured, poorly drained soils.
Careful management of N fertilizers even with the useof a nitrification inhibitor is required. Nitrapyrin is volatileand requires immediate incorporation. Also, fall applica-tions of N when soil temperatures are above 50° F may re-sult in accelerated degradation of the inhibitor which willreduce the potential for improved N recoveries.
Table 11. Relative probability ofincreasing corn yield by usingnitrification inhibitors.
Time of NApplication
Soil Fall SpringPreplant
Sands & loamy sands —1 GoodSandy loams & loams Fair GoodSilt loams & clay loams
– well-drained Fair Poor– somewhat poorly drained Good Fair– poorly drained Good Good
1 Fall applications not recommended on these soils.
Note: Likelihood of response to inhibitor withspring sidedress N applications is poor.
Table 12. Effects of nitrification inhibitoron corn yield and recovery ofapplied N, Hancock, Wisconsin,1982–84.
N-Serve Rate Yield1 N Recovery
(lb/a) (bu/a) (%)
0 87 290.5 99 43
1 Average of three N rates (70, 140, 210 lb/N/a).

18 Nutrient Management
To avoid enriching surface waters with soil nutrients, it isrecommended that annual fertilizer applications for corn beband-applied near the row as starter fertilizer at planting. An-nual starter applications of P can usually supply all of the Prequired for corn. This practice reduces the chance for P en-richment of the soil surface and reduces P loads in runoff fromcropland. In addition, research has shown row applications ofstarter fertilizer can increase corn yields on most soils. Bandfertilizer placement should be 2 inches to the side and 2 inchesbelow the seed. Rates of application should be monitoredclosely if placement is closer to the seed.
When large broadcast P fertilizer applications are need-ed to increase low soil P levels, these applications shouldalways be followed by incorporation as soon as possible.
Soil Nutrient PlacementPlacement of soil nutrients on agricultural fields can
be a factor in determining their potential to affect waterquality. Nutrient placement is a more important consider-ation with respect to P management and surface water qual-ity protection than with N and groundwater quality.
NitrogenThe concern with N placement focuses more on pre-
venting N loss through ammonia volatilization than move-ment to groundwater. Applications of N in the form of ureaor N solutions need to be incorporated by rainfall, irriga-tion, injection or tillage. The amount of volatilization thatoccurs with surface N applications depends on factors suchas soil pH, temperature, moisture, and crop residue cover.Minimal volatilization losses of N can be expected if springsurface applications are incorporated within 3 to 4 days—provided temperatures are low (<50°F) and the soil is moist.However, a late spring or summer application should be in-corporated within a day or two because higher temperaturesand the chance of longer periods without rainfall could lead tosignificant N volatilization losses. Recent research shows thatlosses may be as high as 20% under these conditions.
PhosphorusThe placement of P-containing materials directly influ-
ences the amount of P transported to lakes and streams bysurface runoff. If P inputs are broadcast on the soil surfaceand not incorporated, P levels of runoff waters can risesharply. Phosphorus is strongly bound to soil particles; how-ever, adequate soil-P contact must occur to allow for ad-sorption. Incorporation by tillage or subsurface band place-ment is a very effective means of achieving this contact.Wisconsin studies have shown that eroded sediment andrunoff from soil surfaces where P fertilizer was not incor-porated will contribute significantly higher amounts of P torunoff and have a greater potential for impact on surface wa-ter quality than from soil surfaces where P was incorporated.

Nutrient Management 19
Manure ManagementManure is a valuable resource. Manure applications to
cropland provide nutrients essential for crop growth, addorganic matter to soil, and improve soil structure, tilth, andwater holding capacity. As with other nutrient sources, im-proper use of manure can result in environmental damage.The major concerns associated with manure applicationsare related to its effects on surface and groundwater qual-ity. In regards to groundwater, the nitrate-N contributionof manure is of greatest concern. The likelihood of nitratereaching groundwater is increased if manure applicationsexceed crop N needs, N contributions to soil from manureapplications are not credited in fertilizer recommendations,or manure is improperly stored or handled. With surfacewaters, P is the manure nutrient of importance. Runoff frommanured fields can carry readily available soil nutrients tosurface waters. The high soluble P content of manure canhave immediate adverse effects on surface water quality byenhancing production of algae and aquatic plants, and de-creasing dissolved oxygen levels.
Application MethodsProper manure application techniques are very impor-
tant for reducing contributions of P to surface waters. Ag-ronomically, proper application of manure is important inpreventing losses of N through the volatilization of ammo-
nia. Both nutrients can be conserved by incorporating orinjecting manure. To protect surface water quality and re-duce volatilization losses, it is recommended that surface-spread manure be incorporated within three days of appli-cation. Incorporation should reduce nutrient loss providedthe tillage is sufficiently deep and does not accelerate soilloss. If a reduction in soil erosion protection appears likelyfrom the incorporation of manure on sloping lands, a formof reduced tillage should be used. All incorporation or in-jection should follow the land contour when possible. Whenthe incorporation or injection of manure is not practical,manure spreading should be directed to fields that have run-off control practices in place and which do not dischargeunfiltered runoff to streams and lakes.
Application RatesTwo common strategies for manure application to crop-
land exist:
a P management strategy, and
a N management strategy.
If maximum nutrient efficiency is the goal, rates ofmanure application need to be based on the nutrient presentat the highest level relative to crop needs. For corn, the nu-
20 Nutrient Management
trient is P. With this strategy, manure should be applied ata rate which will meet corn’s requirement for P; additionalN and potassium (K) are supplied from other nutrientsources as needed. A management strategy based on P dic-tates the lowest manure application rates but it is the leastlikely to result in degradation of water quality. It has thedisadvantages of being inefficient with respect to labor, en-ergy, and time, more costly, and may have limited practi-cality. This system is only possible where the farmer has ad-equate land to spread manure at the lower rates required forthis strategy.
An alternative strategy for utilizing manure is to deter-mine a rate of application which will fulfill the corn re-quirement for N. This strategy maximizes the rate of appli-cation but results in the addition of P and K in excess ofcorn nutrient needs. The N strategy is most commonly usedsince the amount of land available for application is oftenlimited. While other environmental considerations may re-strict the timing, location, and methods of application, cornN requirements are the major rationale for limiting rateswith this method of utilization. The amount of available Nin manure and soil can be determined by manure and soilanalysis. In lieu of specific manure analysis, estimates ofthe amount of available nutrients from manure are given inTable 7.
A manure application strategy based on crop N require-ment will lead to an accumulation of P with repeated appli-cations. Excessive soil test levels of P can result in surfacewater quality problems in the event of runoff and soil ero-sion. When soil test levels for P reach 75 ppm, manureapplications should be reduced and P-demanding crops suchas alfalfa planted. At P soil test levels of 150 ppm, manureand other sources of P should be discontinued until soil test
levels decrease. Soil runoff and erosion control practicessuch as residue management, conservation tillage, contourfarming and filter strips are strongly recommended on soilswhere P levels significantly exceed crop needs.
From strictly a water quality viewpoint, P soil test lev-els of 75 to 150 ppm may be too high for some agriculturalsites. Soil test P levels lower than 75 ppm would signifi-cantly reduce threats to surface water quality and be ad-equate for most crop needs. However, with the average Psoil test level of Wisconsin soils at approximately 46 ppmand P soil test levels from dairy operations approximatelytwice that level, a P soil test limit of 75 ppm is not realisticfor livestock operations needing to dispose of animal waste.Additionally, a statewide recommendation limiting soil testlevels at 75 ppm would fail to consider the diversity of thestate’s soils. For example, areas of sandy soils where thepotential for runoff and water erosion is low, higher P soiltest levels would most likely not pose a threat to surfacewater quality. A general recommendation for P soil test lev-els would be that in the absence of adequate runoff controland soil conservation practices on soils susceptible to run-off and erosion, P soil test levels of 75 ppm should not beexceeded.
For surface water quality protection, it is recommendedthat on fields where manure cannot be incorporated, no morethan 25 tons/acre of solid dairy manure or its equivalent basedon P content be applied annually. In long term cropping situa-tions that preclude manure incorporation (i.e. continuous no-till corn) it is recommended that a cumulative total of not morethan 25 tons/acre of solid dairy manure (or its equivalent in P-content) be applied over a 5-year period unless previously ap-plied manure has been incorporated.
Nutrient Management 21
Application TimingManure application timing is of greater concern in con-
trolling P contributions to surface waters than nitrate move-ment to groundwater. Manure should not be spread on slop-ing lands any time a runoff producing event is likely. Un-fortunately, runoff producing events are impossible to pre-dict and the elimination of manure applications to slopinglands is seldom a practical consideration for landowners.The period of major concern is the late fall, winter, andearly spring months. Manure applied on frozen ground hasan increased likelihood for contributing nutrients to surfacewaters due to spring thaws and rains causing runoff.
If winter applications of manure must be made, the riskshould be minimized to the greatest extent possible. Ma-nure applications to frozen soils should be limited to slopesof less than 6%. Preferably these soils are cornstalk cov-ered, roughly tilled, or protected from up-slope runoff.
If applications of manure to frozen soils with slopes of6 to 12% must be made, conservation measures need to bein place in order to protect surface waters. Grassed water-ways must be well-established and maintained. Terracesshould be in place, if appropriate, or fields contoured andstrip-cropped with alternate strips in sod. If fields are farmedon the contour, they should be protected with an adequateresidue cover from the previous year’s crop.
Manure should not be applied to frozen soils on slopesgreater than 12%.
Site ConsiderationsMost soils have a high capacity for assimilating nutri-
ents from waste materials such as manure. Unfortunately,areas of the state exist where the soil is highly permeableor shallow over fractured bedrock. In such areas, ground-water problems from the application of manure can result.For shallow soils, manure should not be applied to soilsless than 10 inches thick over fractured bedrock. Wheresoil cover is 10 to 20 inches thick, manure needs to be in-corporated within three days of application to allow formaximum soil adsorption of nutrients. Manure should notbe applied when these soils are frozen. The 10 to 20 inchrecommendation is intended for livestock operations in lim-ited areas of the state where such unique soil conditionsexist.
Movement of mobile nutrients to groundwater is morelikely on excessively drained (sandy) soils. Manure appli-cations in early fall to fields where no actively growing cropis present to utilize the N, may allow for the conversion oforganic N to nitrate which is then subject to movement by
leaching. Whenever possible, manure should not be appliedto sands or loamy sands in the fall when soil temperaturesare greater than 50° F (conversion of ammonium-N to ni-trate-N is significantly reduced at soil temperatures below50° F) unless there is an over-wintering cover crop presentto utilize the N. In the absence of a cover crop, apply ma-nure when soil temperatures are below 50° F.
The main site characteristics affecting nutrient contri-butions to surface waters are those that affect soil runoffand erosion. These include slope, soil erodibility and infil-tration characteristics, rainfall, cropping system and thepresence of soil conservation practices. Site related man-agement practices dealing specifically with manure place-ment to protect surface water include:
Do not apply manure within a 10-year floodplainor within 200 feet of lakes and streams unlessincorporation follows as soon as possible—nolater than 72 hours after application. Do not applymanure to frozen soils in these areas. The 200foot set-back allows for buffer strips to slowrunoff velocity and deposit nutrient and sedimentloads. Do not apply manure to the soils associatedwith these land areas when they are saturated.
Do not apply manure to grassed waterways,terrace channels, open surface drains or otherareas where surface flow may concentrate.
Manure StorageDuring periods when suitable sites for land application
of manure are not available (i.e., soils are frozen or sea-sonally saturated), the use of manure storage facilities isrecommended. Storage facilities allow manure to be storeduntil conditions permit land application and incorporation.In addition, storage facilities can minimize nutrient lossesresulting from volatilization of ammonia and be more con-venient for calibrated land applications. With the exceptionof those systems designed to filter leachate, storage sys-tems should retain liquid manure and prevent runoff fromprecipitation on stored waste. It is imperative that manurestorage facilities be located and constructed such that therisk of direct seepage to groundwater is minimized. Withregards to maximum nutrient efficiency and water qualityprotection, it is critical that appropriate application tech-niques and accurate nutrient credits of the manure resourceare utilized when the storage facility is emptied.
22 Nutrient Management
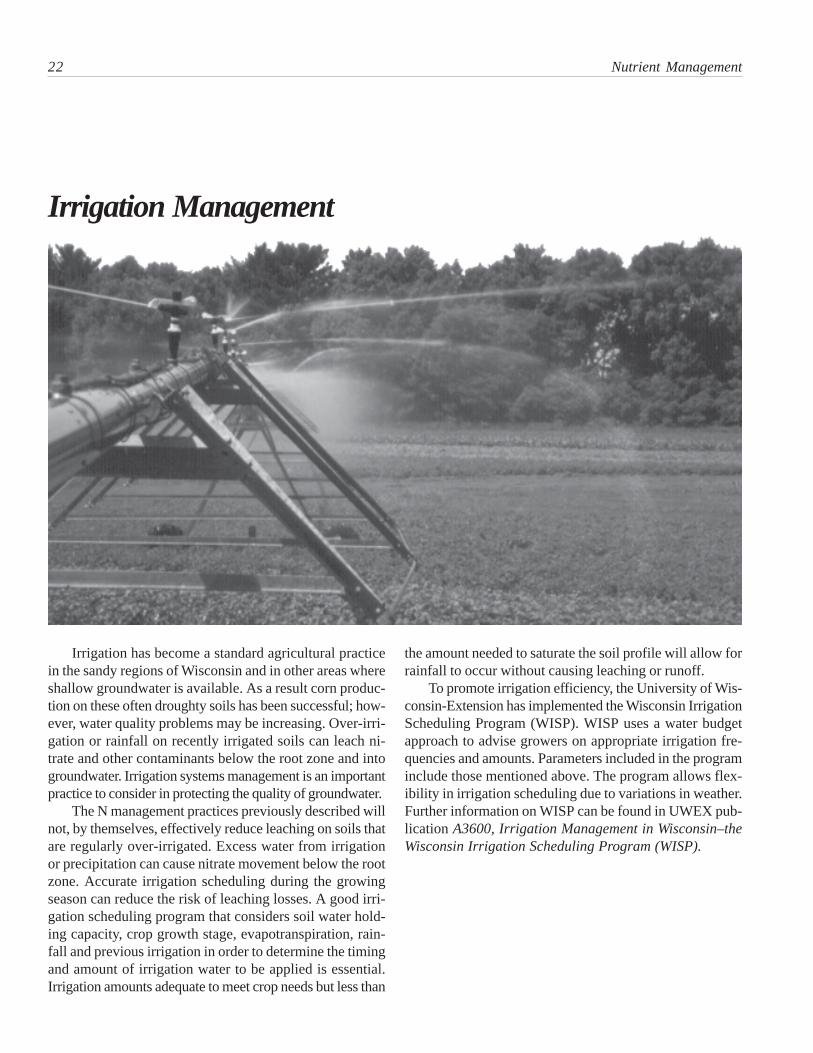
Irrigation has become a standard agricultural practicein the sandy regions of Wisconsin and in other areas whereshallow groundwater is available. As a result corn produc-tion on these often droughty soils has been successful; how-ever, water quality problems may be increasing. Over-irri-gation or rainfall on recently irrigated soils can leach ni-trate and other contaminants below the root zone and intogroundwater. Irrigation systems management is an importantpractice to consider in protecting the quality of groundwater.
The N management practices previously described willnot, by themselves, effectively reduce leaching on soils thatare regularly over-irrigated. Excess water from irrigationor precipitation can cause nitrate movement below the rootzone. Accurate irrigation scheduling during the growingseason can reduce the risk of leaching losses. A good irri-gation scheduling program that considers soil water hold-ing capacity, crop growth stage, evapotranspiration, rain-fall and previous irrigation in order to determine the timingand amount of irrigation water to be applied is essential.Irrigation amounts adequate to meet crop needs but less than
the amount needed to saturate the soil profile will allow forrainfall to occur without causing leaching or runoff.
To promote irrigation efficiency, the University of Wis-consin-Extension has implemented the Wisconsin IrrigationScheduling Program (WISP). WISP uses a water budgetapproach to advise growers on appropriate irrigation fre-quencies and amounts. Parameters included in the programinclude those mentioned above. The program allows flex-ibility in irrigation scheduling due to variations in weather.Further information on WISP can be found in UWEX pub-lication A3600, Irrigation Management in Wisconsin–theWisconsin Irrigation Scheduling Program (WISP).
Irrigation Management
Nutrient Management 23
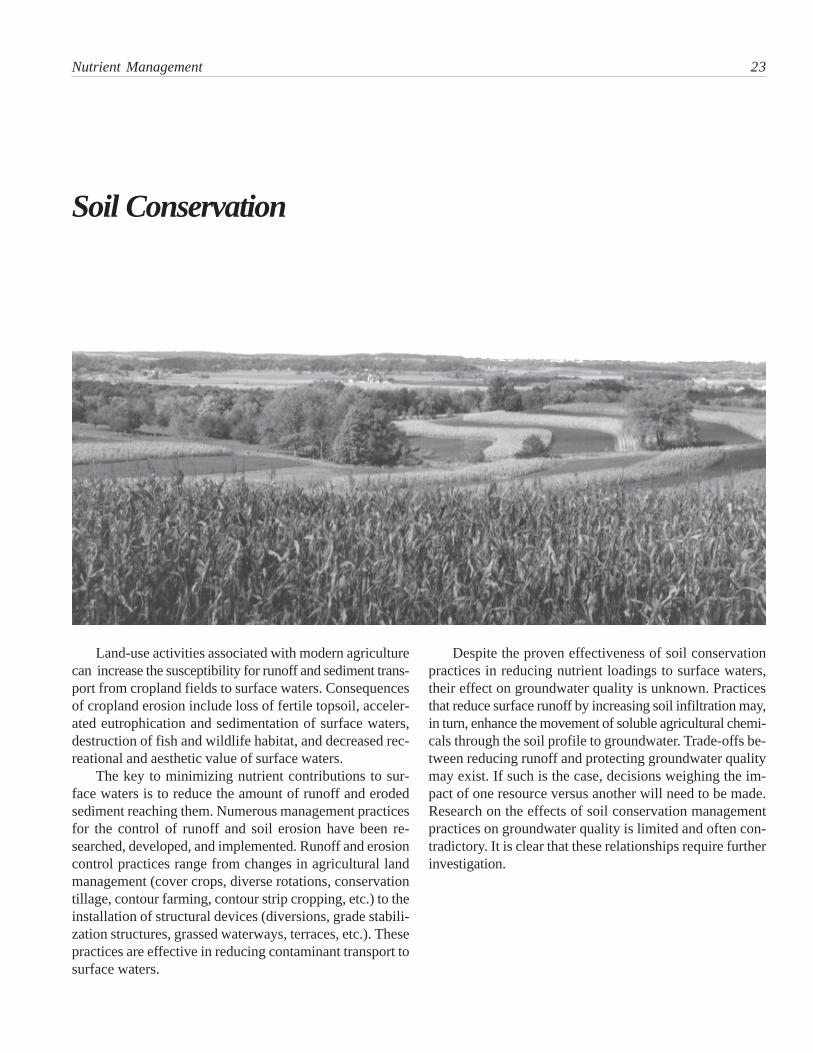
Despite the proven effectiveness of soil conservationpractices in reducing nutrient loadings to surface waters,their effect on groundwater quality is unknown. Practicesthat reduce surface runoff by increasing soil infiltration may,in turn, enhance the movement of soluble agricultural chemi-cals through the soil profile to groundwater. Trade-offs be-tween reducing runoff and protecting groundwater qualitymay exist. If such is the case, decisions weighing the im-pact of one resource versus another will need to be made.Research on the effects of soil conservation managementpractices on groundwater quality is limited and often con-tradictory. It is clear that these relationships require furtherinvestigation.
Land-use activities associated with modern agriculturecan increase the susceptibility for runoff and sediment trans-port from cropland fields to surface waters. Consequencesof cropland erosion include loss of fertile topsoil, acceler-ated eutrophication and sedimentation of surface waters,destruction of fish and wildlife habitat, and decreased rec-reational and aesthetic value of surface waters.
The key to minimizing nutrient contributions to sur-face waters is to reduce the amount of runoff and erodedsediment reaching them. Numerous management practicesfor the control of runoff and soil erosion have been re-searched, developed, and implemented. Runoff and erosioncontrol practices range from changes in agricultural landmanagement (cover crops, diverse rotations, conservationtillage, contour farming, contour strip cropping, etc.) to theinstallation of structural devices (diversions, grade stabili-zation structures, grassed waterways, terraces, etc.). Thesepractices are effective in reducing contaminant transport tosurface waters.
Soil Conservation
24 Nutrient Management
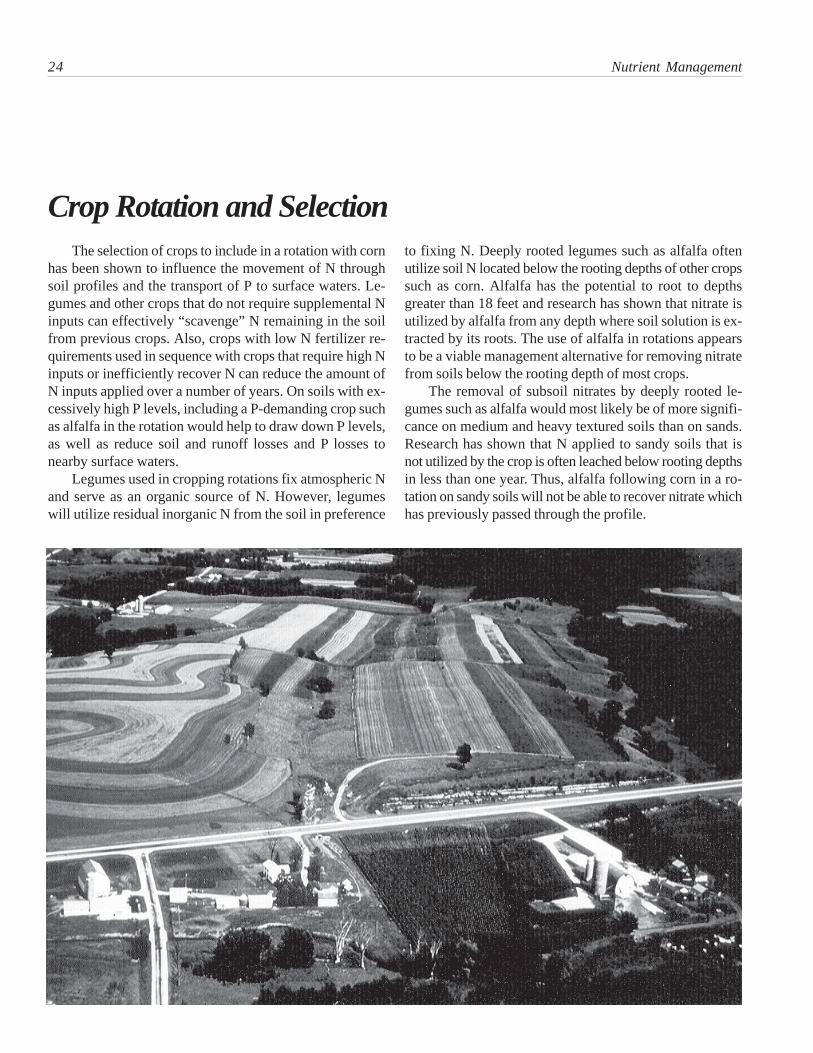
The selection of crops to include in a rotation with cornhas been shown to influence the movement of N throughsoil profiles and the transport of P to surface waters. Le-gumes and other crops that do not require supplemental Ninputs can effectively “scavenge” N remaining in the soilfrom previous crops. Also, crops with low N fertilizer re-quirements used in sequence with crops that require high Ninputs or inefficiently recover N can reduce the amount ofN inputs applied over a number of years. On soils with ex-cessively high P levels, including a P-demanding crop suchas alfalfa in the rotation would help to draw down P levels,as well as reduce soil and runoff losses and P losses tonearby surface waters.
Legumes used in cropping rotations fix atmospheric Nand serve as an organic source of N. However, legumeswill utilize residual inorganic N from the soil in preference
Crop Rotation and Selectionto fixing N. Deeply rooted legumes such as alfalfa oftenutilize soil N located below the rooting depths of other cropssuch as corn. Alfalfa has the potential to root to depthsgreater than 18 feet and research has shown that nitrate isutilized by alfalfa from any depth where soil solution is ex-tracted by its roots. The use of alfalfa in rotations appearsto be a viable management alternative for removing nitratefrom soils below the rooting depth of most crops.
The removal of subsoil nitrates by deeply rooted le-gumes such as alfalfa would most likely be of more signifi-cance on medium and heavy textured soils than on sands.Research has shown that N applied to sandy soils that isnot utilized by the crop is often leached below rooting depthsin less than one year. Thus, alfalfa following corn in a ro-tation on sandy soils will not be able to recover nitrate whichhas previously passed through the profile.

Nutrient Management 25
Maintaining or establishing strips of close-growing veg-etation adjacent to water bodies is a practice that can re-duce the sediment and nutrient content of runoff watersreaching them. The velocity of runoff is reduced when pass-ing through a buffer strip as is its capacity for transportingsediment and nutrients. Sediment is deposited and runoffinfiltrates or passes through the buffer strip with a substan-tially reduced nutrient content.
The width of an effective buffer strip varies with landslope, type of vegetative cover, watershed area, etc. Bufferstrip dimensions need to be specifically designed for givenfield and cropping conditions. Local Land ConservationDepartment or Soil Conservation Service staff can assistlandowners in establishing buffer strips.
Although proven effective in improving surface waterquality, buffer strips may potentially have an adverse ef-fect on groundwater quality. Increased infiltration in an areaof sediment deposition may promote the leaching of solublecontaminants such as nitrate. The extent to which this mayoccur needs to be investigated and evaluated against thebenefits to surface water quality.
Filter Strips

26 Nutrient Management
Conservation TillageConservation Tillageand Fertilizers
Conservation or reduced tillage systems, while beingvery effective in reducing runoff and soil erosion, requiresome degree of specialized nutrient management. This isparticularly true for no-till systems of corn production. Re-search evaluating the effect of conservation tillage systemson nitrate movement to groundwater is limited. However,from a corn production standpoint, it is recommended thatin addition to the standard N recommendation, an additional30 lbs/acre of N be applied to continuous no-till and ridge-till corn production systems where residue cover after plant-ing is at least 50%. This is needed to offset N that may beimmobilized in surface residues and the lower annual amountof N mineralized from soil organic matter in high residuesystems.
A great deal of research has investigated the effects ofconservation tillage systems on P losses to surface waters.Recommended production practices for conservation till-age in Wisconsin fit well with surface water quality objec-tives. It has always been recommended that required fertil-izer and lime be broadcast and incorporated prior to theimplementation of a conservation tillage system. Annualfertilizer additions should be band-applied once the conser-vation tillage system is established.
Conservation Tillageand Manure
Effective handling of manure is very important in pro-tecting water quality. As mentioned earlier, nutrient addi-tions to surface waters can be significantly reduced if landapplied manure is incorporated. This is possible with mostforms of reduced tillage but obviously not in no-till systems.
For both water quality and crop production purposes,manure applications to no-till cropland are not recom-mended. Research has shown that the P loadings to surfacewaters from manured no-till cropland can be extremely high.In addition, serious production problems can result from
the application of manure to no-till fields. A colder andwetter soil environment is created which can delay seed ger-mination and the early growth of crops. Weed problems mayalso increase due to manure reducing herbicide activity andcontributing weed seeds to the soil. Manure and the associ-ated higher soil moisture content can also produce mechani-cal problems for planting equipment. Any or all of theseconditions can cause serious production problems and re-duce yields.
The problems presented with manure applications tono-till fields can be alleviated with light incorporation. Af-ter applications to no-till fields, manure should be lightlydisked into the first two inches of soil. This will allow P tointeract with soil particles and should reduce P contribu-tions to runoff. In addition, the disking distributes manuremore evenly and reduces the mechanical and soil tempera-ture problems. This practice should not sacrifice erosioncontrol because sufficient surface residues should still re-main. While no longer strictly no-till, this modified prac-tice is necessary to integrate the benefits of no-till and ma-nure application.
Regardless of tillage, the practice of injecting manureat recommended rates with proper techniques can removepotential threats to surface water quality. Injection placessoluble P in manure below the soil surface and maintainssufficient surface residue for runoff and soil erosion con-trol in conservation tillage systems.

Nutrient Management 27
ConclusionThis publication provides a brief summary of general
nutrient management practices for Wisconsin corn produc-tion. It is not a complete inventory but rather an overviewof soil fertility management options available to corn grow-ers for improving farm profitability and protecting waterquality. The selection of appropriate nutrient managementpractices for individual farms needs to be tailored to thespecific conditions existing at a site.
Additional information on the topics discussed in thispublication is available. Consult the following reference listfor other publications on soil nutrient management prac-tices. Advice on the applicability of these practices to indi-vidual farming situations can be gained from local Univer-sity of Wisconsin–Cooperative Extension Service staff.
28 Nutrient Management
ReferencesBundy, L.G. 1985. Corn fertilization. Univ. Wis. Coop.
Extn. Ser. Bull. No. A3340.
Bundy, L.G. 1985. Understanding plant nutrients: soil andapplied nitrogen. Univ. Wis. Coop. Extn. Serv. Bull.No. A2519.
Bundy, L.G. 1987. Nitrogen management for groundwaterprotection and efficient crop use. Proceedings of 1987Wis. Fert., Aglime & Pest Mgmt. Conf. 26:254-262.
Bundy, L.G. 1988. Estimating nitrogen availability fromsoil and plant tests. Proc. 1988 Wis. Fert., Aglime &Pest Mgmt. Conf. 27:319-325.
Bundy, L.G. 1989. Nitrogen management to protectgroundwater resources. Ag Chem. Mgmt. Univ. Wis.Coop. Extn. Ser. Inservice Handbook.
Bundy, L.G. 1989. The new Wisconsin nitrogen recom-mendations. Proc. Wis. Area Fert. and Aglime DealerMeetings, Nov. 28 - Dec. 14, 1989.
Bundy, L.G., T.W. Andraski, and P.C. Widen. Soil nitratetest results and corn N responses in 1989. Dept. of SoilSci., Univ. Wis.-Madison. Mimeo.
Bundy, L.G., K.A. Kelling, and L. Ward Good. 1990.Using legumes as a nitrogen source. Univ. Wis. Coop.Extn. Ser. Bull. No. A3517.
Bundy, L.G., and E.S. Malone. 1988. Effect of residualprofile nitrate on corn response to applied nitrogen. SoilSci. Soc. Am. J. 52:1377-1383.
Bundy, L.G., S.J. Sturgul, and K.A. Binning. 1994. Soilnitrate tests for Wisconsin cropping systems: A guidefor using the preplant and pre-sidedress soil nitratetests. Univ. Wis. Coop. Extn. Serv. Bull. No. A3624.
Bundy, L.G., S.J. Sturgul, and R.W. Schmidt. 1990.Wisconsin’s preplant soil profile nitrate test. Univ. Wis.Coop. Extn. Ser. Bull. No. A3512.
Combs, S.M., E.E. Schulte, and L.G. Bundy. 1989.Summary of 1989 soil nitrate test results and outlookfor 1990. Proc. 1989 Wis. Fert., Aglime, and PestMgmt. Conf.
Council for Agricutural Science and Technology (CAST).1985. Agricultute and groundwater quality. CASTReport No. 103. May, 1985.
Curwin, D., and L.R. Massie. 1994. Irrigation manage-ment in Wisconsin-the Wisconsin irrigation schedulingprogram (WISP). Univ. Wis. Coop. Extn. Serv. Bull.No. A3600.
Daniel, T.C., D.H. Mueller, B.J. Andraski, and R.E.Springman. 1989. Effect of tillage on erosion andrunoff water quality. Univ. Wis. Coop. Extn. Serv. Bull.No. G3432.
Daniel, T.C., R.C. Wendt, and F.W. Madison. 1979.Nonpoint pollution: sediment and phosphorus inagricultural runoff. Univ. Wis. Coop. Extn. Serv. Bull.No. G2966.
Keeney, D.R., T.C. Daniel, and B. Shaw. 1986. Nitrate inWisconsin groundwater: sources and concerns. Univ.Wis. Coop. Extn. Serv. Bull. No. G3054.
Kelling, K.A., and A.E. Peterson. 1981. Using whey onagricultural land - a disposal alterrnative. Univ. Wis.Coop. Extn. Serv. Bull. No. A3098.
Kelling, K.A., E.E. Schulte, L.G. Bundy, S.M. Combs,and J.B. Peters. The new Wisconsin soil test recommen-dation program: Vegetables. Proc. Processing CropsConf. 20-22 Feb, 1990. LaCrosse, WI.
Kelling, K.A., E.E. Schulte, L.G. Bundy, S.M. Combs,and J.B. Peters. The new Wisconsin soil test recommen-dation program: Forages. Proc. WI Forage CouncilSymp. 1990.
Kelling, K.A., E.E. Schulte, L.G. Bundy, S.M. Combs,and J.B. Peters. 1991. Soil test recommendations forfield, vegetable, and fruit crops. Univ. Wis. Coop. Extn.Ser. Bull. No. A2809.
Hendrickson, L.L., D.R. Keeney, and L.M. Walsh. 1978Evaluation of nitrapyrin as a means of improvingnitrogen efficiency in irrigated sands. Agron. J. 70:689-703.
Hendrickson, L.L., L.M. Walsh, and D.R. Keeney. 1978.Effectiveness of nitrapyrin in controlling nitrification offall and spring applied anhydrous ammonia. Agron. J.70:704-708.
Nutrient Management 29
Jackson, G., D. Keeney, D. Curwen, and B. Webendorfer.1987. Agricultural practices to minimize groundwatercontaimination. Univ. Wis. Coop. Extn Serv. 115p.
Leclerc, S. 1987. Effects of residual profile nitrateaccumulation on corn response to applied N. M.S.Thesis. Dept. of Soil Sci., Univ. Wis.-Madison.
Madison, F., K.A. Kelling, J. Peterson, T.C. Daniel, G.Jackson, and L. Massie. 1986. Managing manure andwaste: guidelines for appplying manure to pasture andcropland in Wisconsin. Univ. Wis. Coop. Extn. Serv.Bull. No. A3392.
Magdoff, F.R., D. Ross, and J. Amadon. 1984. A soil testfor nitrogen availability to corn. Soil Sci. Soc. Am. J.48:1301-1304.
Mathers, A.C., B.A. Stewart, and B. Blair. 1975. Nitrate-N from soil profiles by alfalfa. J. Environ. Qual. 4:403-405.
Mueller, D.H., T.C. Daniel, and R.C. Wendt. 1981.Conservation tillage: best management practice fornonpoint runoff. Environ. Mgmt. 5(1):33-53.
Mueller, D.H., R.C. Wendt, and T.C. Daniel. 1984.Phosphorus losses as affected by tillage and manureapplication. Soil Sci. Soc. Am. J. 48:901-905.
Olsen, R.J., R.F. Hensler, O.J. Attoe, S.A. Witzel, andL.A. Peterson. 1970. Fertilizer nitrogen and croprotation in relation to movement of nitrate-N throughsoil profiles. Soil Sci. Soc. Am. Proc. 34:448-452.
Schulte, E.E., and A.E. Peterson. 1988. Using covercrops in sustainable agriculture. Dept. of Soil Sci.,Univ. Wis.-Madison.
Schulte, E.E., and L.M. Walsh. 1993. Management ofWisconsin soils. 4th ed. Univ. Wis. Coop. Extn. Ser.Bull. No. A3588
Stewart, B.A., F.G. Viets, and G.L. Hutchinson. 1968.Agriculture’s efffect on nitrate pollution of groundwa-ter. J. Soil Water Cons. 23:13-15.
USDA-Soil Conservation Service. 1991. Wisconsin fieldoffice technical guide, Sec. IV-Spec. 590.
Ward Good, L., F.W. Madison, K. Cates, and K.A.Kelling. 1991. Nitrogen credits for manure applications.Univ. Wis. Coop. Extn. Ser. Bull. No. A3537.
Authors: Larry G. Bundy, Keith A. Kelling and Emmett E.Schulte are professors of soil science, University of Wisconsin-Madison and extension soil scientists, University of Wisconsin-Extension. Sherry Combs is director of the Soil and PlantAnalysis Laboratory, University of Wisconsin-Extension.Richard P. Wolkowski is an outreach program manager in theDepartment of Soil Science, University of Wisconsin-Extension.Scott J. Sturgul is a senior outreach specialist with the Nutrientand Pest Management Program, University of Wisconsin-Madison. Desktop publishing: Kimberly Binning is an editorand Roger Schmidt is an information processing consultant withthe Nutrient and Pest Management Program, University ofWisconsin-Madison.
Partial funding provided by the Wisconsin Department ofNatural Resources - Nonpoint Source Priority Watershed Program.
This Publication is available from your Wisconsin County Ex-tension office or from: Extension Publications, Cooperative Exten-sion Publications , 45 N. Charter Street, Madison WI 53715. Phone(608) 262-3346 or (877) 947-7827 Contact Extension Publications todetermine availability before publicizing.
An EEO/Affirmative Action employer, University of Wiscon-sin-Extension provides equal opportunities including Title IX andADA requirements.
Wis. Dept. Ag., Trade & Cons. Protection. 1989. Nutrientand pesticide best management practices for Wisconsinfarms. WDATCP Tech. Bull. 1 - Univ. Wis. Coop.Extn. Ser. Bull. No. A3466.