Nursing for the people with lifestyle- related diseases in · PDF fileNursing for the people...
33
Nursing for the people with lifestyle- related diseases in Japan Japanese Nursing Association 1. Current state of lifestyle-related diseases/ NCDs in Japan and actions taken
Transcript of Nursing for the people with lifestyle- related diseases in · PDF fileNursing for the people...

Nursing for the people with lifestyle- related diseases
in Japan
Japanese Nursing Association
1. Current state of lifestyle-related diseases/ NCDs in Japan and actions taken

1. Current state of lifestyle-related diseases/NCDs in Japan and actions taken
2. Nursing for the people with lifestyle-related diseases: health promotion, prevention and living with the diseases (to be issued soon)
3. Japanese Nursing Association in Action (to be issued soon)
Japanese Nursing Association 2

The lifestyle-related diseases
It is a group of diseases the onset and progress of which are concerned with lifestyle and behavior factor(s) such as dietary habits, physical activities, rest, smoking, alcohol consumption, etc.
Examples: Diabetes, hypertension, heart diseases, cerebrovascular diseases, cancers, etc.
Japanese Nursing Association 3
The term “lifestyle-related diseases(Seikatsu-shukan-byo )” was proposed in 1996 bythe Ministry of Health and Welfare’s Council on Public Health.In Japan the mortality rates of such diseases as cerebrovascular diseases, cancersand heart diseases rapidly increased around the age of 40. The traditionaladministrative term of “adult diseases (Seijin-byo)” was used because these diseaseswere related with aging. However, as the prevention of such diseases requiredconsiderations based on the current state of one’s lifestyle and behavior factors suchas diet, physical activities, smoking and alcohol consumption as well as the issuesrelated to those, the concept of “lifestyle-related diseases” was introduced.
The lifestyle-related diseases are chronic diseases including cancer, heart diseasesand diabetes. It is also non-communicable diseases (NCDs) against which worldwideactions are being taken.

The principle causes of death among the Japanese have changed from infections to lifestyle-related diseases such as
cancer, heart diseases and cerebrovascular diseases
0
50
100
150
200
250
300
19
21
19
25
19
29
19
33
19
37
19
41
19
48
19
52
19
56
19
60
19
64
19
68
19
72
19
76
19
80
19
84
19
88
19
92
19
96
20
00
20
04
20
08
20
12
Tuberculosis
Malignant neoplasm
Diabetes
Hypertensive diseases
heart diseases
Cerebrovascular diseases
Pneumonia
Liver disease
Renal failure
Died of old age
Japanese Nursing Association 4
Source: 2012 Vital Statistics, Ministry of Health, Labour and Welfare(MHLW)
Changes in mortality rates from principle causes of death per 100,000 population
Japan saw a rapid decline in tuberculosis- and pneumonia-related deaths in theearly 1950s. The leading causes of deaths was dramatically changed fromcommunicable diseases to the lifestyle-related diseases around this time.Malignant neoplasm, cardiovascular diseases and cerebrovascular diseases havebeen the three major causes of death since 1958, currently making upapproximately 60% of all causes of death. Against this backdrop, emphasis is beingplaced on the preventive measure of the lifestyle-related diseases.

Approximately 30% of deaths among Japanese people are caused by cancer
286.6
157.996.511.5
5.8
98.4
19.9 12.7
48.232.6 5.1 21 13.1
Malignant neoplasm
heart diseases
Cerebrovascular diseases
Diabetes
Hypertensive diseases
Pneumonia
Renal failure
Liver diseases
Died of old age
Non-traffic accident
Traffic accident
Suicide
Other cause
Japanese Nursing Association 5
Source: 2012 Vital Statistics, MHLW
Approximately 60% of deaths among Japanese people are caused by lifestyle-related diseases; while approximately 30% are caused by cancers.Research on preventable risk factors in the Japanese population identified the twoprinciple determinants of adult deaths due to NCDs or injuries in Japan in 2007 assmoking and high blood pressure.1)
1) The issue of The Lancet featuring Japan (September 2011): Series Japan: Universal Health Care at 50 Years: What has made the population of Japan healthy? (Kenji Shibuya (representative); Comprehensive assessment of risk factor interventions and prevention of disease burden; Grant-in-Aid for Scientific Research from the Ministry of Health, Labour and Welfare (FY 2010–2012))
Cause specific mortality rate per 100,000 population

The estimated number of patients
670.6
298.3
283.8
232.4
77.4
2935.6
The estimated number of patients
Hypertensive diseases
Malignant neoplasm
Cerebrovascular diseases
Diabetes
Ischemic heart diseases
Others
Unit (1,000 persons)
Japanese Nursing Association 6
Source: 2011 Patients survey, MHLW
Approximately a third of the estimated number of patients in Japan is suffering fromlifestyle-related diseases.With regard to the hypertensive diseases, which rank at the top in the estimatednumber of patients list, the 2012 National Health and Nutrition Survey shows 55.5%of males and 39.6% of females of 20 years or older are deemed to have ahypertensive diseases (systolic blood pressure of 140 mmHg or higher and/ordiastolic blood pressure of 90 mmHg or higher, or taking a antihypertensive drug).
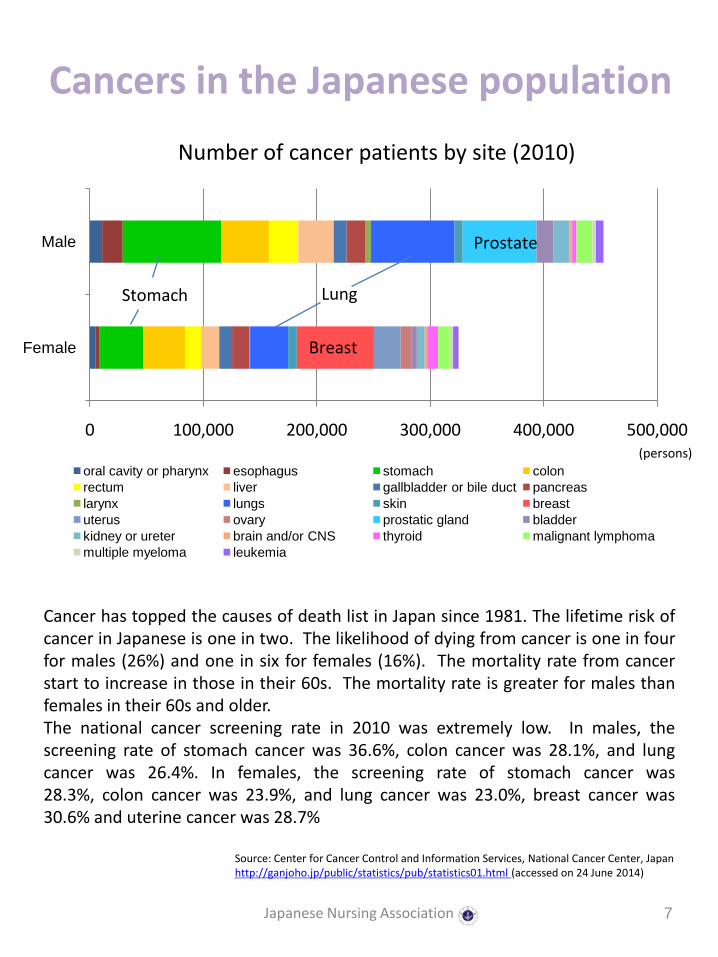
Cancers in the Japanese population
0 100,000 200,000 300,000 400,000 500,000
Female
Male
oral cavity or pharynx esophagus stomach colon
rectum liver gallbladder or bile duct pancreas
larynx lungs skin breast
uterus ovary prostatic gland bladder
kidney or ureter brain and/or CNS thyroid malignant lymphoma
multiple myeloma leukemia
Stomach
Breast
Prostate
Japanese Nursing Association 7
Cancer has topped the causes of death list in Japan since 1981. The lifetime risk ofcancer in Japanese is one in two. The likelihood of dying from cancer is one in fourfor males (26%) and one in six for females (16%). The mortality rate from cancerstart to increase in those in their 60s. The mortality rate is greater for males thanfemales in their 60s and older.The national cancer screening rate in 2010 was extremely low. In males, thescreening rate of stomach cancer was 36.6%, colon cancer was 28.1%, and lungcancer was 26.4%. In females, the screening rate of stomach cancer was28.3%, colon cancer was 23.9%, and lung cancer was 23.0%, breast cancer was30.6% and uterine cancer was 28.7%
Source: Center for Cancer Control and Information Services, National Cancer Center, Japan http://ganjoho.jp/public/statistics/pub/statistics01.html (accessed on 24 June 2014)
(persons)
Number of cancer patients by site (2010)
Lung

Diabetes
690 680740
880890
1320
950
1100
0
200
400
600
800
1000
1200
1400
Diabetes strongly suspected Diabetes cannot be ruled out
1997
2002
2007
2012
Japanese Nursing Association 8
The estimated figure for the number of “diabetes cannot be ruled out” had shown anincreasing tendency before, but decreased in a Japanese government survey in 2012.The percentage of the “diabetes strongly suspected” group was 15.2% for males and7.8% for females. Compared to the figures of previous survey in 2007, there were nochanges for males but an increase for females. Meanwhile the percentage of“diabetes cannot be ruled out” was 12.1% for males and 13.1% for females. Incomparison to the figures in the previous survey in 2007, there was no change formales but a decrease for the females.
Diabetes strongly suspected: persons with HbA1c (NGSP) of 6.5% or greater, and/or persons who have been diagnosed with diabetes and received treatmentDiabetes cannot be ruled out: persons with HbA1c (NGSP) of 6.0% or greater, but less than 6.5%, and not strongly suspected to have diabetes
Source: 2012 National Health and Nutrition Survey, MHLW
(10,000 persons)
(year)
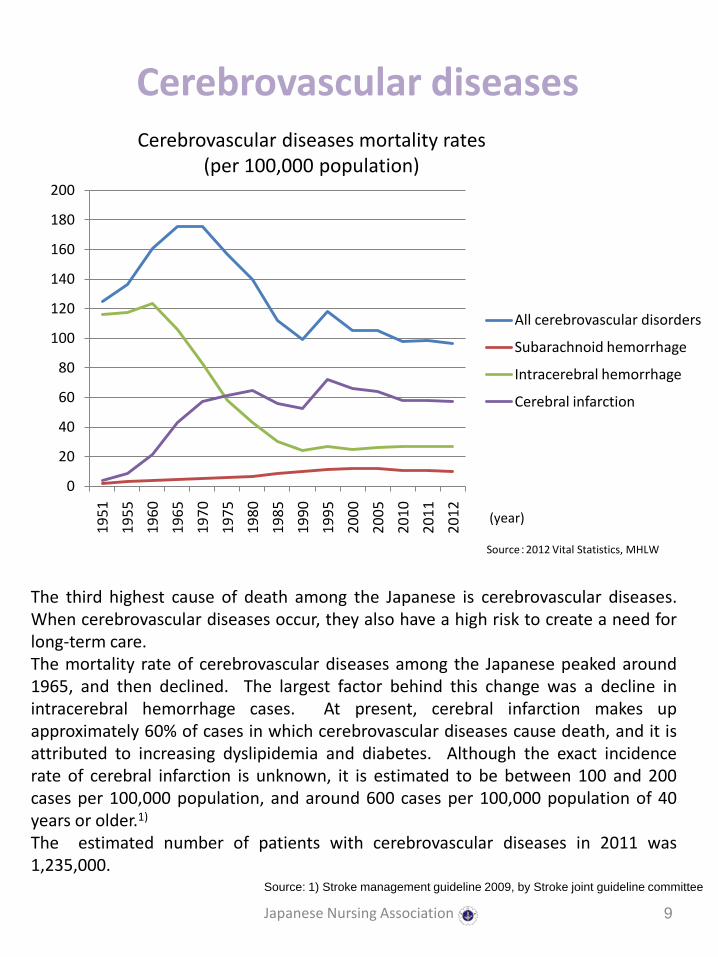
Cerebrovascular diseases
0
20
40
60
80
100
120
140
160
180
200
19
51
19
55
19
60
19
65
19
70
19
75
19
80
19
85
19
90
19
95
20
00
20
05
20
10
20
11
20
12
All cerebrovascular disorders
Subarachnoid hemorrhage
Intracerebral hemorrhage
Cerebral infarction
(year)
Japanese Nursing Association 9
The third highest cause of death among the Japanese is cerebrovascular diseases.When cerebrovascular diseases occur, they also have a high risk to create a need forlong-term care.The mortality rate of cerebrovascular diseases among the Japanese peaked around1965, and then declined. The largest factor behind this change was a decline inintracerebral hemorrhage cases. At present, cerebral infarction makes upapproximately 60% of cases in which cerebrovascular diseases cause death, and it isattributed to increasing dyslipidemia and diabetes. Although the exact incidencerate of cerebral infarction is unknown, it is estimated to be between 100 and 200cases per 100,000 population, and around 600 cases per 100,000 population of 40years or older.1)
The estimated number of patients with cerebrovascular diseases in 2011 was1,235,000.
Source: 1) Stroke management guideline 2009, by Stroke joint guideline committee
Source:2012 Vital Statistics, MHLW
Cerebrovascular diseases mortality rates (per 100,000 population)

Heart diseases
0
20
40
60
80
100
120
140
160
Ischemic heart disease Cerebrovascular disease
Japanese Nursing Association 10
Mortality rate of heart diseases among the Japanese is on the increase. In thepast, when compared to various overseas populations, the Japanese showed highermortality rate from cerebrovascular diseases and lower mortality rate from ischemicheart disease. However the changes in lifestyle and diet of Japanese population havebrought an increase in metabolic diseases such as obesity, dyslipidemia and impairedglucose tolerance. It is feared this trend may lead to an increased risk of ischemicheart disease.
Reference:Guidelines for the primary prevention of ischemic heart disease revised version(JCS 2012) by joint team from: The Japanese Circulation Society, Japan Society of Nutrition and Food Science, The Japanese Society of Hypertension, The Japan Menopause Society (The Japan Society for Menopause and Women's Health), Japanese Society of Pediatric Cardiology and Cardiac Surgery, Japanese College of Cardiology, The Japanese Association of Cardiac Rehabilitation, The Japan Diabetes Society, Japan Atherosclerosis Society and The Japan Geriatrics Society
Source: WHO Global Health Observatory Data Repository, Disease and injury country estimates, 2008
Estimated death due to ischemic heart disease and cerebrovascular disease per 100,000 population

Obesity
Japanese Nursing Association 11
Sources:1) World Health Organization (2014) Obesity and overweight Fact sheet No. 311, http://www.who.int/mediacentre/factsheets/fs311/en/# (accessed 19 June 2014) 2) Japan Society for the Study of Obesity (2011) Journal of Japan Society for the Study of Obesity, 17(50), pp1-2.
The WHO definitions are: a BMI greater than or equal to 25 is overweight while a BMIgreater than or equal to 30 is obesity.1)
The Japanese definition of obesity is a BMI greater than or equal to 25, while thosewith concurrent health issues or visceral fat area size of 100 cm2 or larger are deemedadiposity. Although the obesity-related diseases are on the rise in Japan, obeseJapanese mostly fall within a BMI range of 25 or more but less than 30. Since notmany fall in the WHO’s obese criterion of BMI of 30 or greater, Japan uses differentcriteria from WHO.2)
According to the 2012 National Health and Nutrition Survey, 25.3% of males and 15.9%of females of 20 years or older fall in a BMI range of 25 or greater but less than30, while 3.8% of the males and 3.4% of the females have a BMI of 30 or greater.There is an increasing tendency for obesity in males.
Source: 2012 National Health and Nutrition Survey, MHLW
Ratio of obese persons (BMI ≥ 25)
0.0
10.0
20.0
30.0
40.0 In their 20s
In their 30s
In their 40s
In their 50s
In their 60s
70 years or older
Males
0.0
5.0
10.0
15.0
20.0
25.0
30.0
35.0
40.0
19
80
19
82
19
84
19
86
19
88
19
90
19
92
19
94
19
96
19
98
20
00
20
02
20
04
20
06
20
08
20
10
20
12
In their 20s
In their 30s
In their 40s
In their 50s
In their 60s
70 years or older
Females
(%)
(year)

Metabolic Syndrome
Metabolic syndrome diagnostic criteria
Japanese Nursing Association 12
It has become known that lifestyle-related diseases are strongly associated withobesity with excess visceral fat (visceral fat obesity). The visceral fat obesity increasesthe risks for diabetes, dyslipidemia and hypertension, as well as progressive arterialsclerosis, which raises the risk for myocardial infarction (MI) and stroke. InJapan, metabolic syndrome (visceral fat syndrome) is diagnosed when two of thethree indicators of blood glucose, lipids and blood pressure, exceed their respectivereference ranges. Those who fulfill the criteria need to manage the conditions byimproving their lifestyles.The 2011 data of those who underwent metabolic syndrome-focusedscreening, targeting those of 40 years or older, show that 14.6% were likely to havemetabolic syndrome while 12.1% were deemed in the “potential” category.1)
Abdominal girth
Additional risks
Diagnosis i. blood glucose; ii. lipids; iii. blood pressure
Male≥ 85cmFemale≥ 90cm
Two or more apply Metabolic syndrome
One applies Potential
i. blood glucose: fasting blood glucose level of 110 mg/dL or higherii. lipids: neutral fat level of 150 mg/dL or higher and/or HDL cholesterol
level of less than 40 mg/dL iii. blood pressure: Systolic blood pressure(BP) of 130 mmHg or higher and/or
diastolic BP of 85 mmHg or higher
Source: 1) Data related to specified health examination and/or specified health guidance, MHLWhttp://www.mhlw.go.jp/bunya/shakaihosho/iryouseido01/info02a-2.html (accessed on 25 June 2014)

RISK FACTORS
Japanese Nursing Association 13

Although declining, salt intake level among the Japanese is still high
0
5
10
15
19
75
19
80
19
85
19
90
19
95
20
00
20
01
20
02
20
03
20
04
20
05
20
06
20
07
20
08
20
09
20
10
20
11
20
12
Salt intake level
Japanese Nursing Association 14
Dietary habits form one of the important factors that influence lifestyle-relateddiseases. Historically Japan had a higher prevalence of hypertension and deaths dueto stroke. One of the contributing factors was the high level of salt intake. Onaverage, the Japanese consume 10.4 g of salt/day (2012 data). Although WHOrecommends to limit the salt intake to 5 g/day, the target salt intake in Japan are lessthan 9 g/day for males and less than 7.5 g/day for females.
Sources:• 2012 National Health and Nutrition Survey, MHLW• Dietary reference intakes for Japanese (2010 edition), MHLW• 2014 Hypertension management guideline by The Japanese Society of Hypertension
Source: 2012 National Health and Nutrition Survey, MHLW
(g)
(year)
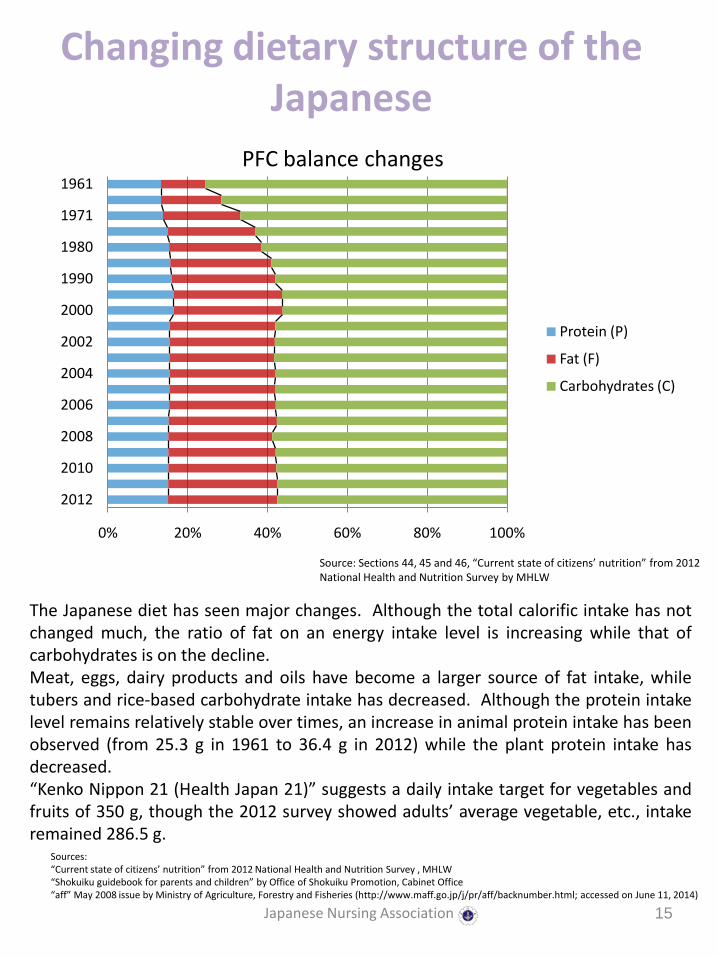
Changing dietary structure of the Japanese
0% 20% 40% 60% 80% 100%
2012
2010
2008
2006
2004
2002
2000
1990
1980
1971
1961
Protein (P)
Fat (F)
Carbohydrates (C)
Japanese Nursing Association 15
PFC balance changes
The Japanese diet has seen major changes. Although the total calorific intake has notchanged much, the ratio of fat on an energy intake level is increasing while that ofcarbohydrates is on the decline.Meat, eggs, dairy products and oils have become a larger source of fat intake, whiletubers and rice-based carbohydrate intake has decreased. Although the protein intakelevel remains relatively stable over times, an increase in animal protein intake has beenobserved (from 25.3 g in 1961 to 36.4 g in 2012) while the plant protein intake hasdecreased.“Kenko Nippon 21 (Health Japan 21)” suggests a daily intake target for vegetables andfruits of 350 g, though the 2012 survey showed adults’ average vegetable, etc., intakeremained 286.5 g.
Source: Sections 44, 45 and 46, “Current state of citizens’ nutrition” from 2012 National Health and Nutrition Survey by MHLW
Sources: “Current state of citizens’ nutrition” from 2012 National Health and Nutrition Survey , MHLW“Shokuiku guidebook for parents and children” by Office of Shokuiku Promotion, Cabinet Office “aff” May 2008 issue by Ministry of Agriculture, Forestry and Fisheries (http://www.maff.go.jp/j/pr/aff/backnumber.html; accessed on June 11, 2014)

Physical activities: Fewer steps are taken per day on overage
3,000
4,000
5,000
6,000
7,000
8,000
9,000
10,000
3,000
4,000
5,000
6,000
7,000
8,000
9,000
10,000
Japanese Nursing Association 16
According to WHO, physical inactivity is the fourth highest risk factor in terms of thenumber of deaths worldwide, following hypertension (13%), smoking (9%) andhyperglycemia (6%).1) Regular physical activity is deeply related to NCDs.When looking at the mean number of steps taken per day by Japanese males andfemales under 60 years of age, a gradual declining trend is observed. When looking atthe number of persons who have continued an exercise habit at least twice a week at 30minutes per session, the numbers among those in their 20s and 40s have fluctuated ataround 20%, while the figures for those in their 50s or older have shown increasingtrends.
― age 20–29 ― age 30–39 ― age 40–49 ― age 50–59 ― age 60–69 ― age 70 and over
Males Females(steps/day) (steps/day)
Source: 2012 National Health and Nutrition Survey , MHLW
Chronological changes in the average number of steps per day
Source: 1) Global recommendations on physical activity for health, Geneva, World Health Organization, 2010.
(year) (year)

Smoking
Japanese Nursing Association 17
Source: Global Tobacco Epidemic 2013, WHO
(%)
Tobacco(Cigarette) is one of the significant risk factors for lifestyle-related diseases suchas cancers, lung diseases, cardiovascular diseases and diabetes. Passive smoking alsohas a major health impact.In Japan, smoke cessation treatment is covered by insurance since 2006.However, despite the tobacco tax was increased in 2010 in the interest ofhealth, researchers reported that based on the survey data of tobacco tax rate andsmoking, the effect on non-smoking, reducing smoking and/or preventing an increase insmoking was transient.1)
The smoking rates of Japanese was 34.1% for male and 9.0% for female according to the2012 data. Although the smoking rates among men had been on a decline after1995, the trend has turned upward since 2010. 2)
Status of smoking in various countries (Cigarette)
0
10
20
30
40
50
60
Male
Female
Sources: 1) Compiled data from “National Survey on Changes in Work and Life Styles (Japanese Life Course Panel Survey for the Middle-aged) 2013” by Institute of Social Sciences, The University of Tokyo; specific data in press release (http://ssjda.iss.u-tokyo.ac.jp/panel/PR/13PressRelease.pdf; in Japanese; accessed on June 10, 2014)2) 2012 National Health and Nutrition Survey, MHLW

Drinking alcoholic beverages(alcohol consumption)
Japanese Nursing Association 18
Ratio of persons with a drinking habit
Persons who answered they would drink at least three days a week and at least 180 mL of seishu(refined sake) or equivalent on the days when they drink180 mL of seishu = approx. 500 mL of beer = 240 mL of wine
There is a large difference between males and females concerning the drinkinghabit.The ratio of persons with a drinking habit that raises the risk for lifestyle-relateddiseases (daily alcohol intake of 40 g or more pure alcohol for males or 20 g ormore for females): 14.7% for males and 7.6% for females.
Source: 2012 National Health and Nutrition Survey, MHLW
0
5
10
15
20
25
30
35
40
45
50
Males Females
age 20–29
age 30–39
age 40–49
age 50–59
age 60–69
age 70 and over
(%)

8,000
8,500
9,000
9,500
10,000
10,500
11,000
70
75
80
85
90
95
100
105
Level of alcohol consumption per person 20 years old or older
Size of population 20 years or older
Japanese Nursing Association 19
Source: “Alcohol factsheet” (March 2014) by Alcohol Tax Division, Taxation Department, National Tax Agency http://www.nta.go.jp/shiraberu/senmonjoho/sake/shiori-gaikyo/shiori/2014/pdf/100.pdf (accessed on 23 June 2014)
(L)(10,000 persons)
Size of population 20 years or older is based on “Annual demographic report (as of October 1, 2012)” of the Statistics Bureau, Ministry of Internal Affairs and Communications Not including Okinawa Prefecture
While the size of the population of 20 years or older increased, the level of alcohol consumption per person showed a declining tendency.
Level of alcohol consumption per adult
Drinking alcoholic beverages(alcohol consumption)
(Year)

The necessity to make actions to control lifestyle-related diseases:
The gap between average life expectancy and healthy life expectancy
0
10
20
30
40
50
60
70
80
90
Jap
an
Afg
han
ista
n
Arg
enti
na
Au
stra
lia
Bah
ama
Bra
zil
Can
ada
Cen
tral
Afr
ica
Den
mar
k
Fran
ce
Gre
ece
Ind
ia
Ken
ia
Ho
llan
d
New
Zea
lan
d
Ph
ilip
pin
es
Swed
en
Thai
lan
d
Ton
ga UK
USA
Average life expectancy Healthy life expectancy
Japanese Nursing Association 20
Source: Global Health Observatory Data, World Health Organizationhttp://apps.who.int/gho/data/view.main.690?lang=en (Accessed on 2014/6/11)
The Japanese population boasts the world’s highest average life expectancy at birthof 80.21 years for men and 86.61 years for women(2013 data). On the otherhand, there is a large difference between the average life expectancy at birth andhealthy life expectancy : about 9 years for men and 12 years for women. Healthpromotion and disease prevention will play a major role to fill this gap.Although various countries throughout the world show varying length of average lifeexpectancy, the gap between average life expectancy and healthy life expectancyranges from 7 to 10 years.
(years)

The necessity to make actions to control lifestyle-related diseases:
Ratio of healthcare expenditures used for the lifestyle-related diseases
Malignant neoplasm
Hypertensive diseases
Cerebrovascular diseases
Diabetes
Ischemic heart diseases
Others
Japanese Nursing Association 21
Ratio of medical care related healthcare expenditure by disease
Source: 2011 Estimates of national medical care expenditure, MHLW
A few lifestyle-related diseases account for up to almost 30% of the healthcare expenditure.
Total medical care related healthcare expenditure ¥ 27812.9billion
(about US$ 271billion)

The necessity to make actions to control lifestyle-related diseases:
Lifestyle-related diseases’ impact on long-term care
0% 20% 40% 60% 80% 100%
Female
Male
Total
Cerebrovascular diseases (stroke) Cardiac diseases (heart diseases) Malignant neoplasm (cancer)
Diabetes
Respiratory diseases
Joint disorders
Dementia
Parkinson’s disease
Fall and/or fracture
Age-related debility
Others, unknown or unclear
Japanese Nursing Association 22
Source: 2012 Comprehensive Survey of Living Conditions, MHLW
The four major lifestyle-related diseases, cerebrovascular diseases, cardiacdiseases, malignant neoplasm and diabetes, account for up to 30% of the maincauses for long-term care needs (44% in the male population and 27% in thefemale population).

JAPANESE GOVERNMENT POLICIES
Japanese Nursing Association 23
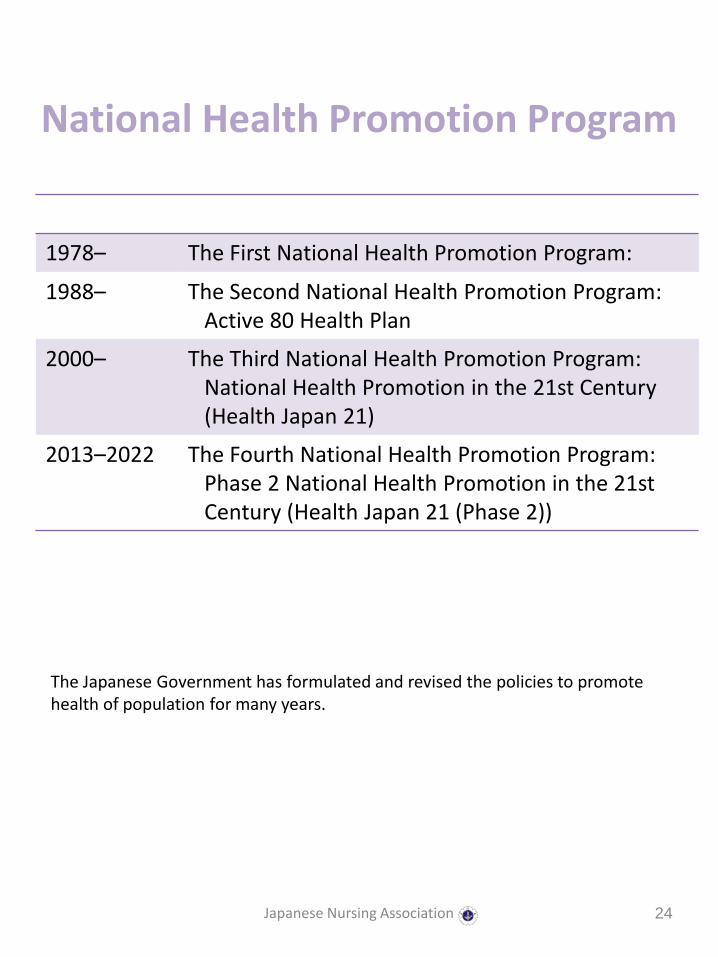
National Health Promotion Program
1978– The First National Health Promotion Program:
1988– The Second National Health Promotion Program:Active 80 Health Plan
2000– The Third National Health Promotion Program:National Health Promotion in the 21st Century (Health Japan 21)
2013–2022 The Fourth National Health Promotion Program:Phase 2 National Health Promotion in the 21st Century (Health Japan 21 (Phase 2))
Japanese Nursing Association 24
The Japanese Government has formulated and revised the policies to promote health of population for many years.

Health Japan 21 Phase 2
(1) To extend healthy life expectancy and to reduce health disparity
(2) To thoroughly implement measures to prevent the onset and/or exacerbation of lifestyle-related diseases
(3) To maintain and improve the functions necessary for having a social life (mental health, health of the next generations and health of the elderly)
(4) To improve the social environment to support and protect health
(5) To improve lifestyle and behavior and the social environment
Japanese Nursing Association 25
Health Japan 21 (Phase 2) is a plan for the ten-year period from 2013. It wasformulated to set the policy direction among the socioeconomic changes in recentyears and the rapid population aging and fewer children, by focusing on thedemographic movement in the next ten years and clearly presenting, “What tostrive for.”Altogether the plan sets 53 targets (excluding duplications) for health promotion ofpopulation in numerical indicators to build an energetic society where people canlive healthy and spiritually content lives in each stage of their lives, and thus ensurethat social security systems are sustainable.“To thoroughly implement measures to prevent the onset and/or exacerbation oflifestyle-related diseases,” specific targets for NCDs namely cancer, cardiovasculardiseases, diabetes and chronic obstructive pulmonary disease (COPD) are set. Atthe same time, with regard to the objective, “To improve lifestyle and behavior andthe social environment,” specific lifestyle targets in relation to the lifestyle-relateddiseases are set (namely nutrition and diet, physical activities and exercise, rest,alcohol consumption, smoking and dental and oral health).

Health Japan 21 Phase 2: To improve lifestyle and behavior and
social environment (nutrition and diet)
• Increase in the number of people maintaining optimal weight (fewer obesity or underweight persons)
• Increase in the number of people taking adequate quantity and quality of meals (more meals with a combination of staple carbohydrate, main protein dish and side vegetable dish, less salt intake and more intake of vegetables and fruit)
• Increase in the number of people having meals in the company of others (smaller ratio of children who eat meals alone)
• Increase in the number of food companies and restaurants that registered as tackling reduction of salt and fat in food
• Increase in the proportion of specified meal catering facilities that implement the plan, cooking and nutritional assessment of meals depending on the users they cater for
Japanese Nursing Association 26
To extend healthy life expectancy and improve the quality of life, targets are set for prevention of main lifestyle-related diseases (cancers, cardiovascular diseases and diabetes) based on scientific evidences. Due to the large ratio of underweight females in their 20s (29.0%) and for better nutrition and prevention of malnourishment for the elderly, targets aimed to reduce underweight conditions are also set, in addition to obesity-related targets.
* Specified meal catering facilities: facilities that provide at least 100 meals at once or at least 250 meals per day on an ongoing basisExamples: meal catering facility at a childcare center, school, business establishment, hospital or aged care facility

Health Japan 21 Phase 2: To improve lifestyle and behaviors and social environment (physical activities)
• Increase in the number of walking steps in the course of daily living (1200–1500 more steps)
• Increase in the proportion of people who exercise regularly (approximately 10% more)
• Increase in the number of local governments that commit to building an exercise friendly town for residents and commit to improving the environment for it
Japanese Nursing Association 27
The government set the above targets in Health Japan 21 (Phase 2). As a part of theactions to promote Health Japan 21 (Phase 2), “Exercise and Physical ActivityReference for Health Promotion 2013” was developed to present the importance ofphysical activities and exercise and a method to put them into practice.
By increasing the daily physical activity level, one can lower the risks of developinglifestyle-related diseases including metabolic syndrome, the risk of dying from sucha condition and the risks of losing the functions for living due to aging, as well as therisk of developing mental disorders. Furthermore, regular practice of physicalactivity is expected to increase the preventative effects against those diseases, etc.,will increase.
Source: Report by the committee on revision of Exercise and physical activity reference and guideline, Ministry of Health, Labour and Welfare

Health Japan 21 Phase 2: To improve lifestyle and behavior and
social environment (smoking)
• Reduction of the smoking ratio in adults
• Eliminate underage smoking
• Eliminate smoking in pregnant women
• Reduction of the ratio of persons who are exposed to second-hand smoke (at home, in the workplace, restaurants, government facilities and healthcare institutions.)
Japanese Nursing Association 28
Smoking is the main risk factor of such diseases as cancer, stroke, ischemicheart diseases and diabetes. Since both smoking and second-hand smoke areconsidered as a factor of many diseases in the Japanese population, its riskshall be reduced.

Health Japan 21 Phase 2: To improve lifestyle and behavior and
social environment (alcohol)
• Reduction of the ratio of persons with a drinking habit that raises the risk for lifestyle-related diseases (daily alcohol intake of 40 g pure alcohol or more for males and 20 g or more for females)
• Eliminate underage drinking
• Eliminate drinking in pregnant women
Japanese Nursing Association 29
Health Japan 21 (Phase 2) sets the three above targets on alcohol.Drinking also tends to increase consumption of accompanying food, and withthe calories of the alcohol, tends to increase the total energy intake. Sincecancer, hypertension, cerebral hemorrhage, dyslipidemia and such show a linealcorrelation with the average daily alcohol consumption, a target on the quantityof alcohol consumption has been set as a measure to prevent lifestyle-relateddiseases.In addition, elimination of underage drinking was set as a target for healthyphysical development in underage persons (younger than 20 yearsold), alongside the reduction of the ratio of pregnant women who drink from8.7% in 2010 to zero, as the target to protect the fetus from the impact ofdrinking during pregnancy.
Source: Health Japan 21(Phase 2), MHLW

Specified health examination and specified health guidance
• Target groups: those between 40 and 74 years of age
• Costs: paid for by insurers of health insurance (except for a partial out-of-pocket contribution with some insurers)
• Basic examination items:
Japanese Nursing Association 30
To prevent lifestyle-related diseases, which cause approximately 60% of deaths inthe Japanese population, the health examination focusing on the metabolicsyndrome began in 2008.It became mandatory for insurers to provide insured persons and their families withhealth examination and health guidance. However, the ratio of implementingspecified health examination in 2011 was 44.7%, which is not a high figure. Malestend to show a lower screening ratio in the age groups older than 60 years, which isthe general retirement age.1)
Questionnaire History of medication, smoking, etc.
Physical measurement
Height, weight, BMI and abdominal girth
Blood pressure measurement
Physical screening
Physical examination
Urinalyses Glucose and protein in urine
Blood testsLipids: neutral fat, HDL cholesterol and LDL cholesterolBlood glucose: fasting blood glucose or HbA1cLiver function: GOT, GPT and γ-GTP
Source: 1) “Specified health examination and specified health guidance: Status of implementation” by MHLW
*When the physician deems necessary, electrocardiogram, funduscopy and other examination(s)/test(s) may be conducted

Specified health guidance
Specified health guidance target group
Japanese Nursing Association 31
Based on the results of the specified health examination, specialized support in lifestyleand behavior review is offered by designated professionals including physicians, publichealth nurses, and/or registered dietitians to persons with a high risk of developing alifestyle-related disease, but more likely to benefit from lifestyle improvements toprevent the lifestyle-related diseases. Specified health guidance may be provided in theform of motivational support or proactive support, depending on the degree of the risks.Those with higher risks receive proactive support.
Among those who underwent the 2011 specified health examination, 18.2% wereidentified as a specified health guidance target group. Specified health guidancecompletion rate in the specified health guidance target group was 15.0%. This rate hasincreased every year since the introduction of specified health guidance in 2008.
i. Abdominal girth & BMI
Additional risksv. history
of smoking
Assessment
ii. blood glucose; iii. lipids;
iv. blood pressureage 40–64 age 65–74
Male≥ 85cm
Female≥ 90cm
Two or more applicable Proactive
supportMotivational
support
One applicableYes
Not
Above not applicable
ANDBMI ≥ 25 kg/m2
Three applicable Proactive support
Motivational support
Two applicableYes
No
One applicable

Effects of specified health examination and specified health
guidance
Japanese Nursing Association 32
A working group at the Ministry of Health, Labour and Welfare reviewed theeffects of specified health guidance and published its findings as an interim report.In those findings, among the specified health guidance target group, those whoreceived proactive support by public health nurses or other professionals in theform of telephone calls and interviews experienced a major reduction inabdominal girth, BMI and body weight and improvement in such indicators asblood glucose, blood pressure and lipid levels, in comparison to those withoutsupport or those who did not continue. Furthermore, it was observed inapproximately 20–30% of the males and approximately 30–40% of the females inthe metabolic syndrome group or potential group had “graduated” from therespective groups at completion of the proactive support stage.
Source: Interim report by the working group for review of healthcare cost optimization effects of specified health examination and specified health guidance, MHLW, April 2014

Basic Act on Food and Nutrition Education and Basic Plan to Promote
Food and Nutrition Education
• Promotion of food and nutrition education according to each developmental stage throughout one’s life
• Promotion of food and nutrition education that leads to prevention and improvement of the lifestyle-related diseases
• Promotion of food and nutrition education for children through having meals together with their families
Japanese Nursing Association 33
Against the backdrop of changing socioeconomic structure and diversifyingvalues, the traditional diet of eating a wide range of side dishes along the stapleof rice has changed, leading to unbalanced nutrition such as over-intake of lipidsand irregular eating habits such as skipping breakfast. In order to ensure thehealth of body and mind, and to live an active and full life, food and nutrition isextremely important. The Basic Act on Food and Nutrition Education wasestablished in 2005 for the purpose of facilitating children to acquire knowledgeon food and nutrition and the ability to choose food well, so that they can growhealthy diet habits. Actions to prevent lifestyle-related diseases and improveone’s lifestyle are also under way by the Plan to Promote Food and NutritionEducation.
Source: Basic Plan to Promote Food Education Phase 2, Cabinet Office(http://www8.cao.go.jp/syokuiku/about/plan/pdf/2kihonkaiteihonbun.pdf; accessed on 23 June 2014)
Fundamental policies concerning promotion of food and nutrition education(Shokuiku)