MEDICARE ATYPICAL ANTIPSYCHOTIC DRUG CLAIMS FOR ELDERLY NURSING HOME RESIDENTS

Nursing for the older people in Japan
Japanese Nursing Association
1. The Aging of the Japanese Population

1. The Aging of the Japanese Population
2. Nursing for the Older People: Current Situation and Challenges (to be issued soon)
3. The Japanese Nursing Association in Action(to be issued soon)
2

Glossary
• Population aging rate: Ratio of people aged 65 and over to the total population
• Birth rate = Number of births / Population 1,000
• Total fertility rate: Sum of the age-specific birth rates of women aged between 15 and 49
3

4
0
5
10
15
20
25
30
35
40
45
An Aging World: Percentage of People Aged 65 and over in Selected Countries
Australia
Canada
Japan
United Kingdom
United States of America Indonesia
Philippines
Viet Nam
India
Malaysia
Thailand
China
Source: Population Division of the Department of Economic and Social Affairs of the United Nations Secretariat, World Population Prospects The 2010 Revision,
National Institute of Population and Social Security Research, Population Projections for Japan (January 2012) for data for Japan after 2010.
Population aging is a worldwide phenomenon. Japan is aging faster than any other countries.
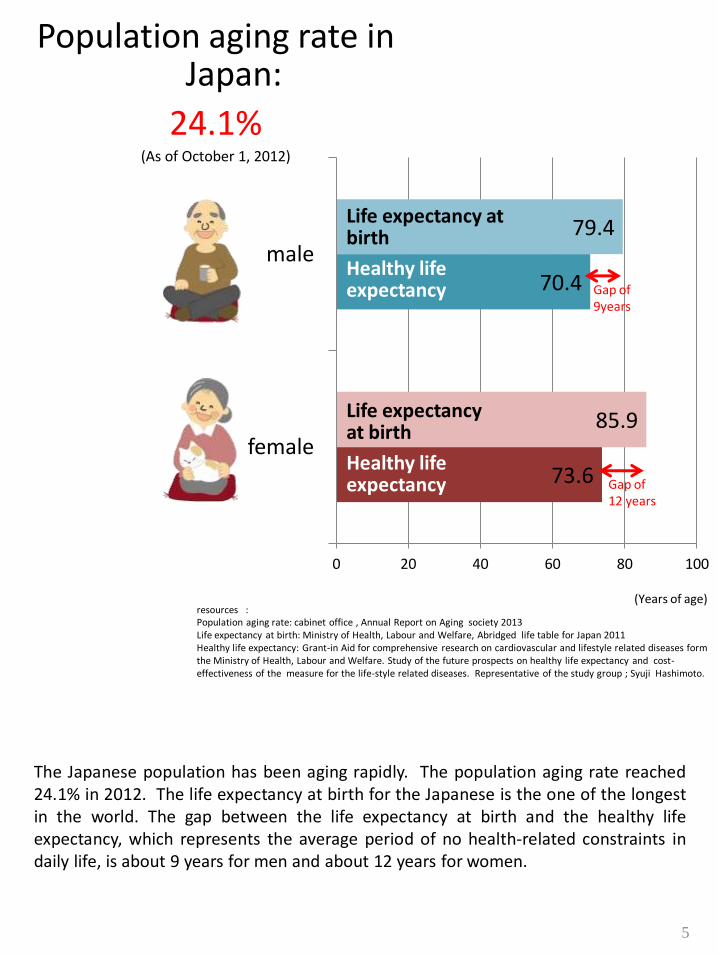
Population aging rate in Japan:
24.1% (As of October 1, 2012)
73.6
70.4
85.9
79.4
0 20 40 60 80 100
female
male
(Years of age)
Life expectancy at birth
Healthy life expectancy
The Japanese population has been aging rapidly. The population aging rate reached 24.1% in 2012. The life expectancy at birth for the Japanese is the one of the longest in the world. The gap between the life expectancy at birth and the healthy life expectancy, which represents the average period of no health-related constraints in daily life, is about 9 years for men and about 12 years for women.
5
Life expectancy at birth
Healthy life expectancy
resources : Population aging rate: cabinet office , Annual Report on Aging society 2013 Life expectancy at birth: Ministry of Health, Labour and Welfare, Abridged life table for Japan 2011 Healthy life expectancy: Grant-in Aid for comprehensive research on cardiovascular and lifestyle related diseases form the Ministry of Health, Labour and Welfare. Study of the future prospects on healthy life expectancy and cost-effectiveness of the measure for the life-style related diseases. Representative of the study group ; Syuji Hashimoto.
Gap of 9years
Gap of 12 years
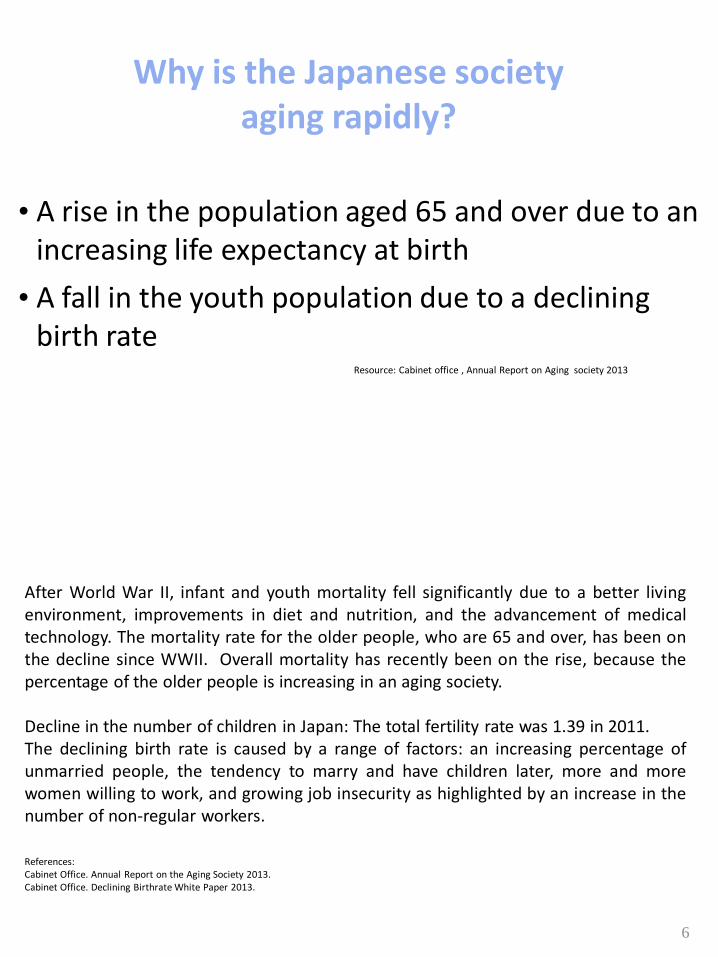
Why is the Japanese society aging rapidly?
• A rise in the population aged 65 and over due to an increasing life expectancy at birth
• A fall in the youth population due to a declining birth rate
After World War II, infant and youth mortality fell significantly due to a better living environment, improvements in diet and nutrition, and the advancement of medical technology. The mortality rate for the older people, who are 65 and over, has been on the decline since WWII. Overall mortality has recently been on the rise, because the percentage of the older people is increasing in an aging society. Decline in the number of children in Japan: The total fertility rate was 1.39 in 2011. The declining birth rate is caused by a range of factors: an increasing percentage of unmarried people, the tendency to marry and have children later, more and more women willing to work, and growing job insecurity as highlighted by an increase in the number of non-regular workers.
References: Cabinet Office. Annual Report on the Aging Society 2013. Cabinet Office. Declining Birthrate White Paper 2013.
6
Resource: Cabinet office , Annual Report on Aging society 2013

Japan is entering a long period of population decline.
0
20,000
40,000
60,000
80,000
100,000
120,000
140,000
0.0
10.0
20.0
30.0
40.0
50.0
60.0
70.0
population estimates
age 0-19
age 20 -64
age 65-74
age 75 and over
(person) (%)
Resource: National Institution of Population and Social Security Research, Population Projection for Japan (January 2012)
Japan entering a long period of population decline. According to projections by the National Institute of Population and Social Security Research, Japan’s total population is expected to drop from 128.06 million in 2010 to 86.74 million by 2060. A rise in the number of the older people amid a declining total population means that the elderly ratio will continue to go up.
The number of the older people will rise while the total population will fall.
7
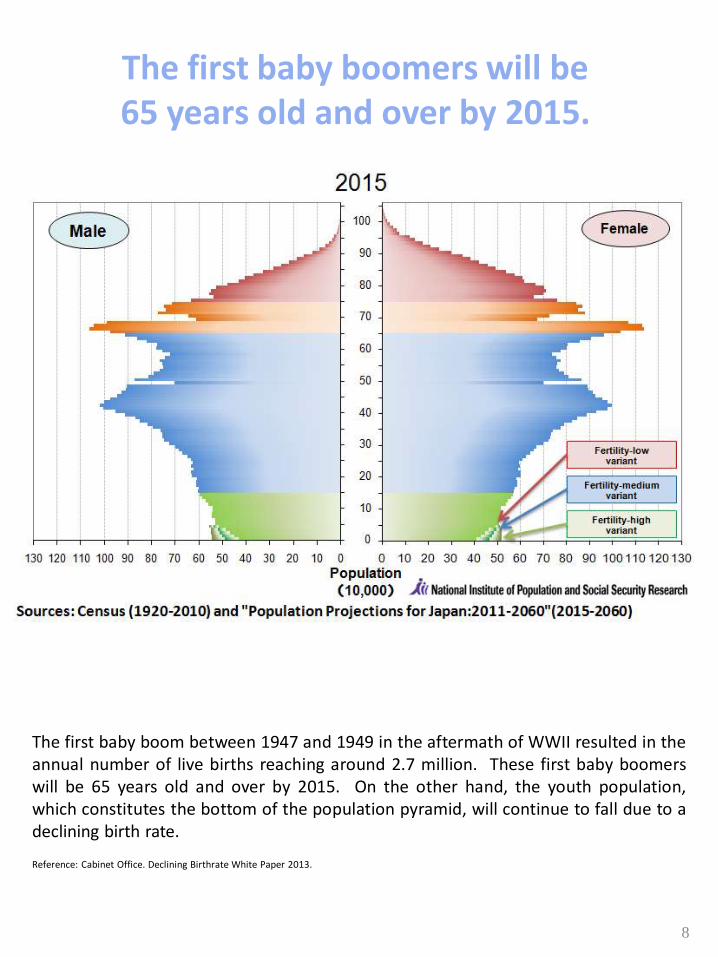
The first baby boomers will be 65 years old and over by 2015.
The first baby boom between 1947 and 1949 in the aftermath of WWII resulted in the annual number of live births reaching around 2.7 million. These first baby boomers will be 65 years old and over by 2015. On the other hand, the youth population, which constitutes the bottom of the population pyramid, will continue to fall due to a declining birth rate.
Reference: Cabinet Office. Declining Birthrate White Paper 2013.
8

The birth rate in Japan will continue to fall.
1.31 1.32 1.33 1.34 1.35 1.36 1.37 1.38 1.39 1.4 1.41 1.42 1.43 1.44 1.45
0
1
2
3
4
5
6
7
8
9
2012 2020 2030 2040 2050 2060
Birth rate
Total fertility rate
Transition of birth rate (per 1,000 of the population)
(projection data after 2020)
(%)
(year)
Given a declining birth rate and a low total fertility rate, the youth population will continue to fall, resulting in the ratio of older people going up.
9
Resource: National Institution of Population and Social Security Research, Population Projection for Japan (January 2012) The 2012 data is from Vital Statistics published by the Ministry of Health Labour and Welfare

As the population ages, the age composition of population in Japan will change greatly.
17.7% 12.7%
58.1%
47.3%
24.1%
39.9%
0%
10%
20%
30%
40%
50%
60%
70%
2012 2060
age 0-19
age 20-64
age 65 and over
On average, one older person was supported by 2.4 persons in the working age bracket(20-64 years of age) in 2012. By 2060, one in every 2.5 of the Japanese population will be 65 years and over. One older person will be supported by 1.2 persons in this bracket by that year.
10
One older person is supported by 2.4
working-age people.
One older person will be supported by 1.2
working-age persons.
Resource: Population estimates(as of Oct. 1st, 2012) by Ministry of Internal Affairs and Communications, Population Projection for Japan ( January 2012) by National Institution of Population and Social Security Research
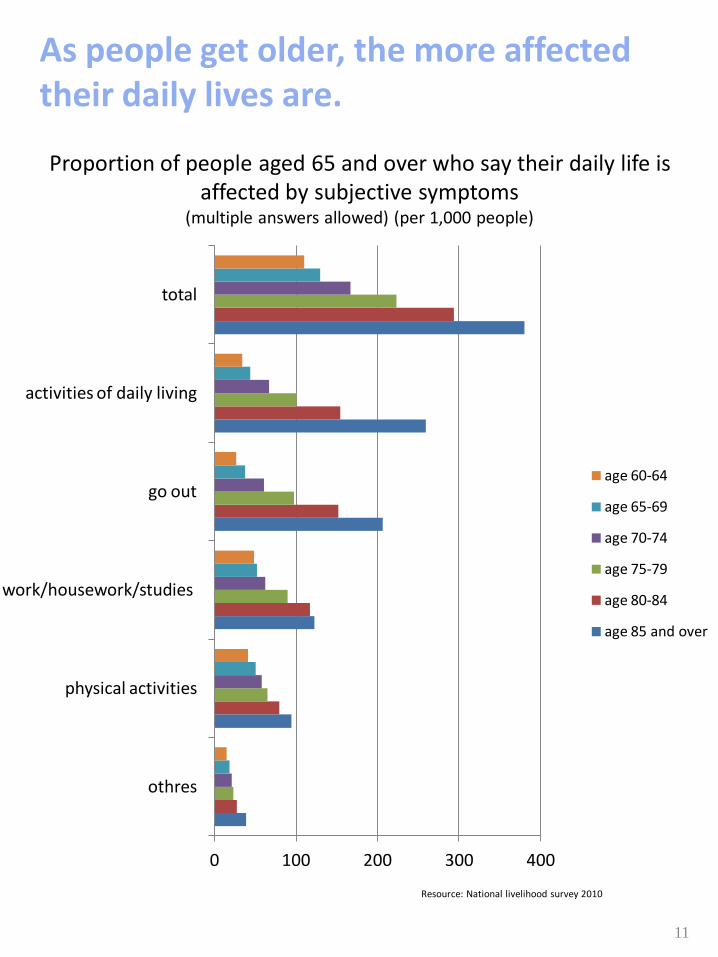
Proportion of people aged 65 and over who say their daily life is affected by subjective symptoms
(multiple answers allowed) (per 1,000 people)
0 100 200 300 400
othres
physical activities
work/housework/studies
go out
activities of daily living
total
age 60-64
age 65-69
age 70-74
age 75-79
age 80-84
age 85 and over
As people get older, the more affected their daily lives are.
11
Resource: National livelihood survey 2010

5 000
10 000
15 000
20 000
25 000
30 000
35 000
1986 1989 1992 1995 1998 2001 2004 2007 2010 2011 2012
living with non-relatives living with relatives living with unmarried children live with son/dauter and his/her partner a married couple only one-person households
Notes: 1. The figures for 1995 exclude those of Hyogo Prefecture. 2. The figures for 2011 exclude those of Iwate, Miyagi, and Fukushima
prefectures. 3. The figures for 2012 exclude those of Fukushima Prefecture.
Source: National livelihood survey 2012 by Ministry of Health Labour and Welfare
Transition of the number of age 65 and over based on the family form (estimated number) (1,000 people)
Traditionally, Japanese people often lived with their elder parents and even their grandparents and took care of them. More recently, however, the percentage of three-generation households has been decreasing, and the size of the average household has been shrinking due to increases in the percentages of nuclear families and one-person households. The percentage of older people who lived with their child(ren) dropped from nearly 70% in 1980 to 42.3% in 2012. By contrast, the percentage of people aged 65 and over who live alone or with their spouse only has been on the rise. A 2012 survey shows that aged households accounted for 21.3% of all households.
People aged 75 and over more likely live alone or with their child’s family than those aged 65-74.
People see their daily life more affected with aging. The traditional system of mutual help based on the family is weakening.
12
Social Security System in Japan
Japan’s social security system are roughly divided into four component pillars: social insurance, social welfare, public assistance, and public health. The core social insurance scheme are health insurance, pension insurance, labor insurance, and long-term care insurance.
13

Health Insurance System The health insurance system of Japan guarantees universal coverage in accordance with the National Health Insurance Act. Under this system, everyone has access to appropriate health care at any time and anywhere in Japan.
The National Health Insurance Act was first established in 1938, laying the foundations for a universal health insurance system. By 1961, the national health insurance system was fully introduced. Under the system, Japanese citizen have to be covered by any of the following healthcare insurances: (i) the employee’s health insurance for employed individuals, (ii) the National Health Insurance for the self-employed and unemployed, and (iii) the health insurance for people aged 75 and over.
With a monthly premium payment to their insurers, the insured are eligible for health care services from health care facilities for a fixed-rate copayment. Health care facilities in turn claims medical fee to screening and payment institutions and reimbursed for the remaining expenses by the insurers. Health care expenses are charged on a fee-for-service basis. Medical fees for which health care institutions claims are calculated by adding up the points of the individual practices. 14
Source/Reference: Summary of Health System in Japan by Ministry of Health Labour and Welfare, accessed at http://www.mhlw.go.jp/seisakunitsuite/bunya/kenkou_iryou/iryouhoken/iryouhoken01/index.html in September 18 ,2013.
See a doctor/ Pay part of fee
Health care service
Medical institution
Screening and payment institutions
Charging medical fee
Premiums
charge
Payment of medical expenditure
- National Health Insurance - Health Insurance Managed by Association - Mutual Aid Association - Seamen’s Insurance -Health Insurance Managed by Japan Health Insurance Association
Payment of medical expenditure
Patient(insured person)
Government
Share of Public funds
Healthcare system for the later-stage elderly

The Older people and Health Care
In-patient Out-patient
0
500
1000
1500
2000
2500
3000
3500
0
100
200
300
400
500
600
700
age 0-14
age 15-34
age 35-64
age 65-74
age 75 and over
(1,000 people)
Transition of number of estimated patients by age group
People are more likely to be hospitalized as they get older. For statistical purposes, the Ministry of Health, Labour and Welfare (MHLW) divides inpatients (severities, etc.) into five categories: (i) “life-threatening,” (ii) “small risk to life but requiring inpatient treatment,” (iii) “to be discharged when acceptance condition is met” that means the condition of patient allow him/her to leave the hospital but still in hospital because the environment including housing and human resources after the discharge is unsettled, (iv) “hospitalization for examination,” and (v) “others.” The higher the age-group of inpatients gets, the more likely they are “to be discharged when acceptance condition is met.”
15
Resource: Survey on patients 2011 by Ministry of Health, Labour and Welfare

National Medical Care Expenditure Per Capita
0.0
200.0
400.0
600.0
800.0
1 000.0
1 200.0
Resource: National medical care expenditure 2010 by Ministry of Health, Labour and Welfare
On average, Japanese people pay half of their lifetime health care expenses after they turn 70.
16
(age)
1,000 yen = US$10.25 (as of August 21, 2013)
(1,000 yen)

Changes in National Medical Care Expenditure
0
50 000
100 000
150 000
200 000
250 000
300 000
350 000
400 000
1955 1975 1986 1988 1990 1992 1994 1996 1998 2000 2002 2004 2006 2008 2010
(hundred million yen)
National medical care expenditure accounts for 7.8% of gross domestic product (GDP) and 10.71% of national income (NI).
MHLW estimates that, of the annual growth rate of about 3% for medical care expenditure in recent years, about 1.5 percentage points are contributed by the aging population and the remaining 1-2 percentage points are contributed by advancing health care.
17
Resource: National medical care expenditure 2010 by MHLW
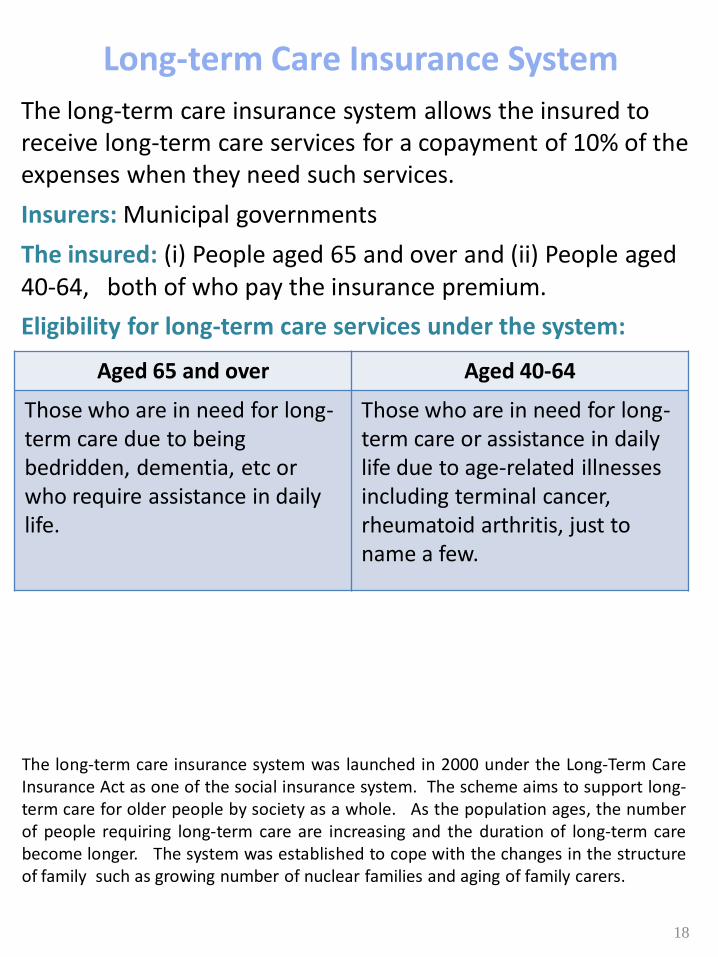
Long-term Care Insurance System
The long-term care insurance system allows the insured to receive long-term care services for a copayment of 10% of the expenses when they need such services.
Insurers: Municipal governments
The insured: (i) People aged 65 and over and (ii) People aged 40-64, both of who pay the insurance premium.
Eligibility for long-term care services under the system:
The long-term care insurance system was launched in 2000 under the Long-Term Care Insurance Act as one of the social insurance system. The scheme aims to support long-term care for older people by society as a whole. As the population ages, the number of people requiring long-term care are increasing and the duration of long-term care become longer. The system was established to cope with the changes in the structure of family such as growing number of nuclear families and aging of family carers.
Aged 65 and over Aged 40-64
Those who are in need for long-term care due to being bedridden, dementia, etc or who require assistance in daily life.
Those who are in need for long-term care or assistance in daily life due to age-related illnesses including terminal cancer, rheumatoid arthritis, just to name a few.
18
Long-term Care Services
• Facility service
• Home-based service:
Home visit nursing, home visit long-term care, home visit bathing, day rehabilitation, day care service, short-term stay, Rental service / purchase of equipment for long-term care, etc.
• Community-based service
Periodical round, multifunctional long-term care in a small group home, home-visit at night for long-term care, etc.
Services under the long-term care insurance system are largely divided into facility services, home-based services, and community-based services. Facility and home-based services are designated and supervised by the competent prefectural government, while community-based services are designated and supervised by the competent municipal government.
Facility services are provided to those staying at nursing homes for the elderly and similar facilities. Home-based services are essential services to keep older people live at home, including visiting nursing and day care services. Community-based services include services provided at group homes for people with dementia as well as the services mentioned above.
19

Government Reponses to an Aging Population
Comprehensive Reform of Social Security and Tax
20

In anticipation of a super-aged society, the comprehensive reform of social security and tax has been underway.
Securing stable revenue sources and soundness of public finance
Implementing fundamental tax reform with a focus on raising the consumption tax
Enhancing the social security to support all
generations
- Support for children and child-rearing
- Reform of health care and long-term care
- Pension reform
- Measures against poverty and economic
disparities
Japan is facing a number of changes in the social environment, including an aging population with fewer children, changing employment pattern, poverty and widening economic disparities. Social security benefit expenditures have been increasing rapidly for the past two decades. They are expected to rise further as the population ages. An increase in social security benefit expenditures has widened the gap between such expenditures and revenues from social insurance premiums. This gap is filled by large amounts of public funds, which means an ever-growing national debt. These situation point to the need for comprehensive reform of social security and tax toward building a sustainable social security system.
21

Directions for the reform of Health Care and Long-term Care
The Japanese government states that by around 2025, it will solve the issues with the existing system of health and long-term care service delivery that have been identified so far and build a new service system that supports residents in a multi-layered and integrated manner through division of function and coordination.
Specifically, the government aims to ensure that health and long-term care services as well as preventive services and housing are provided at the daily living area. The local base hospitals will be covering wider area, and advanced health care services such as emergency medical services and cancer-related services will be provided at the prefectural level.
It will also work to improve home based health care and long-term care and increase the number of health care staff including emergency care staff so that people have access to health and long-term care in familiar settings.
Note: It is assumed that the geological unit for community-based comprehensive care represents a “middle-school” area with a population of about 10,000.
22
Comprehensive management
- Hub for the collaboration among home based medicine - Community general support center - care manager
Acute care hospital
Home
Early discharge
Focused on rehabilitation→ early recovery
Home/ Elderly housing with care
<Community based comprehensive care system >
Facilitating the smooth transition from medical to nursing care
consultation and coordination of services
Sub-acute / sub-acute rehabilitation hospital
Primary care physician
Local partner hospital
Everyday health care
Health and
medical care
Long-term care
Livelihood support/ Preventive long-term care
support
Senior citizen’s club/ long-term care prevention/ livelihood support etc.
When get sick After discharged
Visit a hospital
Attend a care facility Home visit
long-term care/ nursing
Home visit medicine/ nursing
advanced medicine including emergency and surgery
Living place
Required staff at acute care settings will be increase to 1.6-2 fold of current staff in FY2025
Users of home based medicine and nursing FY2012 170,000 people/day FY2025 290,000 people/day
Users of in-home /Home based long-term care FY2012 3,5million people/day FY2025 5,2 million people/day
Source: Public relations office, government of Japan; Comprehensive reform of social security and tax, accessed at http://www.gov-online.go.jp/tokusyu/201208/naniga/img/jujitsusaku_01_l.gif in September 18,2003.