Nursing Facility Task Force Workforce Presentation
20
Nursing Facility Task Force Workforce Presentation Presented by Tara Gregorio October 18, 2019 1
Transcript of Nursing Facility Task Force Workforce Presentation

Nursing Facility Task Force
Workforce Presentation
Presented by Tara GregorioOctober 18, 2019
1

Massachusetts Nursing Facilities By The Numbers
2
40,000 Nursing Facility Residents
Cared For Daily
and 150,000 Annually
73,000 Total EmployeesIncluding Direct Care, Social Services,
Activities, Therapy, Housekeeping,
Laundry, Dietary & Other Staff
75 Cents of Every Nursing Facility Dollar
is Spent on Staff Wages and Benefits
383 Skilled Nursing Facilities363 Medicaid participating facilities
2 out of 3 Nursing Facility
Residents Rely on MassHealthMedicaid
69%
Medicare,
13%
Private Pay,
13%
Other, 5%
of Nursing Facilities are
Operating at a Loss
$362 Million Annual Medicaid Gap,
Among the Highest in the Nation

3
Sector in Financial Crisis Unable to Make
Needed Workforce Investments
14.1% 13.2%12.8% 12.8%
11.4%10.6%
-13.2%-14.7% -15.1% -14.4%
-15.7%-17.0%
0.4% 1.0%
-0.6% -1.6%
-20.0%
-15.0%
-10.0%
-5.0%
0.0%
5.0%
10.0%
15.0%
20.0%
2012 2013 2014 2015 2016 2017
Medicare13% Payor Mix
Medicaid69% Payor Mix
Total
Nursing Facility Margins by Payor Margin Percentage Based Upon Medicaid Volume
4.3%
-1.4%
-3.2%-4.0%
-2.0%
0.0%
2.0%
4.0%
6.0%
NF with >50% NF with 50-75% NF with <75%
MassHealth Usage MassHealth Usage MassHealth Usage
(23 Nursing Homes) (179 Nursing Homes) (138 Nursing Homes)
Closing the Medicaid Gap by Using More Current Costs, Actual Resident
Days and a Valid Inflation Adjustment is Critical to Making Workforce
Investments, Since 75% of a Facility’s Budget is used to Fund Wages
Sources: Medicare – MedPAC Data Report; Medicaid –Mass Senior Care Projections
using Medicaid Rate and Cost Data; and (3) Total Margin – Eljay, LLC Report:
Medicaid Certified Nursing Facilities in Massachusetts: An Analysis of Margins (Oct.
2016, April 2017, Aug. 2017, Sept. 2018)
Source: Eljay, LLC Report: Medicaid Certified Nursing Facilities in Massachusetts: An
Analysis of Margins: 2017 (September 2018)
“Of the 23 facilities with
low Medicaid volume, all
but 7 are part of systems
that have a combined
margin of just 1.1%.”

The typical long term care nursing
facility resident is:
• Female, Age 86
• Typically relies on MassHealth to pay
for his/her care as approved by local
ASAPs
• Widowed and lived alone prior to
entering a nursing facility
• Likely to have dementia or cognitively
impaired
• She is totally dependent on assistance
with activities of daily living (ADLs)
Typical Long Term Resident
4
Nursing facilities care for 32,000 long term
residents each day, primarily frail elders
and individuals with disabilities. However,
there is a growing proportion of residents
under the age of 65.
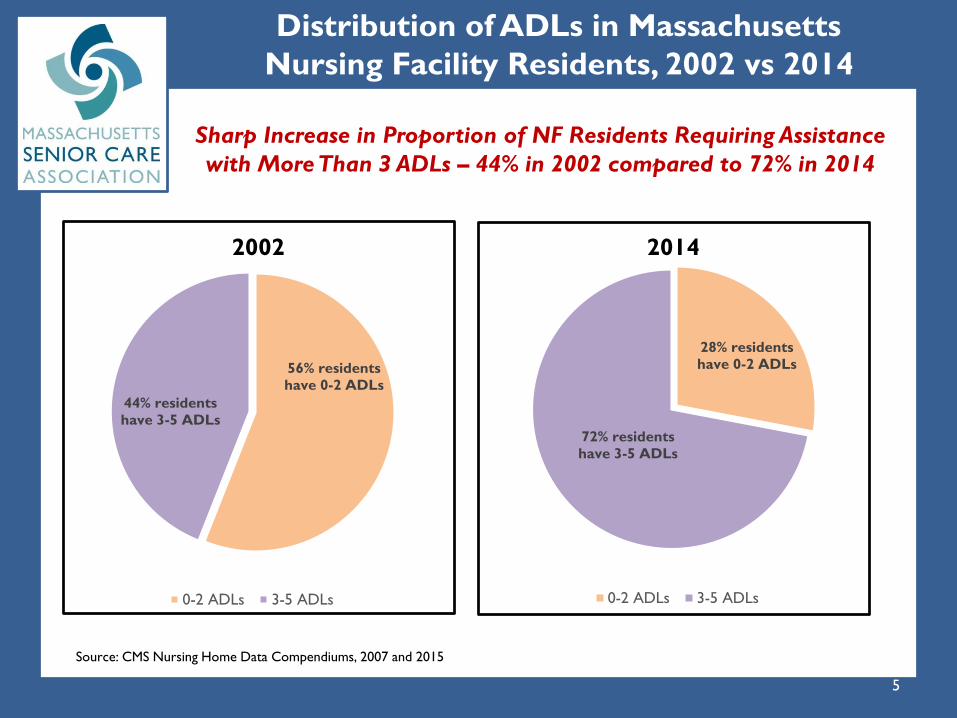
Distribution of ADLs in Massachusetts
Nursing Facility Residents, 2002 vs 2014
5
Source: CMS Nursing Home Data Compendiums, 2007 and 2015
Sharp Increase in Proportion of NF Residents Requiring Assistance
with More Than 3 ADLs – 44% in 2002 compared to 72% in 2014
56% residents
have 0-2 ADLs
44% residents
have 3-5 ADLs
0-2 ADLs 3-5 ADLs
28% residents
have 0-2 ADLs
72% residents
have 3-5 ADLs
0-2 ADLs 3-5 ADLs
20142002

Severe Cognitive Impairments in
Nursing Facility Residents in Massachusetts
6
Sources: CMS Nursing Home Data Compendiums, 2007 and 2015; Alzheimer’s Association 2019 Alzheimer’s Disease Facts and Figures.
LeadingAge 2019 Survey, How Do Older Baby Boomers Envision Their Quality Of Life If They Need Long-Term Care Services?
• Residents with Severe Cognitive Impairment Nearly Tripled Since
2002 and is Projected to Grow by 15% by 2025
• 42% of Baby Boomers Prefer a “Place that is Staffed to Provide
Health Care Plus Help with Daily Activities” if they Develop a
Cognitive Disability
15%
40%
55%
0%
10%
20%
30%
40%
50%
60%
2002 2014 2025 Projected
Severe Cognitive Impairments in Massachusetts
Nursing Facility Residents

Nursing Facility Direct Care Staff (2019)
Source: CHIA Annual Nursing Facility Cost Reports, and 2019 Mass Senior Care Employment Trends
Certified
Nurse Aide
27,000
Registered
Nurse
8,000
Licensed
Practical
Nurse
10,000
Hourly Wage
Starting: $13.00 Median: $15.35
Hourly Wage
Starting: $24.00 Median: $27.50
Hourly Wage
Starting: $27.00 Median: $31.41
7
45,000 Direct Care Staff Provide 24-hour Care to Vulnerable
Residents Who Can No Longer Live at Home

8
27,000 Certified Nursing Assistants
CNA Training: Prior to taking a competency test, CNAs must complete 75 hours of classroom
training and 25 hours clinical rotation. Training includes: patient care skills, ethics, communications,
physiology, medical terminology, nutrition, charting, observation skills, transfer and all the skills
necessary to carry out duties at a long term care facility.
Bathing
Eating
Dressing
Companionship
Toileting
Vital Signs
Positioning
Shaving
Compassion
Mobility
Caregiver
90% Women
Multiple Jobs
Dependent on
Public Assistance
Immigrant
Work Full-Time
Support Families
Comfort

CNA SHORTAGE: MA Unemployment Rate Compared
to Nursing Home Vacancy Rate, 2010-2019
9
8.3%7.2%
6.7% 6.7%5.8%
4.8%3.9% 3.8% 3.4% 3.0%
6%7%
8% 8%9%
11%
16%
13%14%
17%
0.0%
2.0%
4.0%
6.0%
8.0%
10.0%
12.0%
14.0%
16.0%
18.0%
2010 2011 2012 2013 2014 2015 2016 2017 2018 2019
Unemployment Rate CNA Vacancy Rate
Source: (1) Unemployment Data - Bureau of Labor Statistics and (2) Vacancy Rate - Mass Senior Care Annual Employment Trend Reports
Unemployment Rate
CNA Vacancy Rate
As unemployment rates decline, nursing facility CNA vacancies grow.
3,500 CNAs Needed Today!
CNA starting wage of $13 identified as top barrier to recruitment
Nursing Facility CNA Vacancy Rate Compared to MA Unemployment Rate

5,600 Direct Care Nursing Staff Vacancies (2019)
10.1% (310)
14.2% (180)
14.7% (370)
15.3% (710)
15.5% (5,570)
16.4% (1,120)
17.5% (570)
17.8% (480)
17.8% (260)
18.2% (670)
20.9% (900)
0.0% 5.0% 10.0% 15.0% 20.0% 25.0%
Norfolk
Berkshire
Plymouth
Worcester
MA (State Avg.)
Middlesex
Bristol
Suffolk
Barnstable
Western Mass*
Essex
Western Mass* = Franklin, Hampshire and Hampden Counties
Source: Mass Senior Care Association Employment Trends in MA Nursing Facilities Report (2019)
10
Vacancies Continue to Increase with 1,100 Additional
Direct Care Staff Vacancies Compared to 2018

11
• All nursing facilities are experiencing direct care staff shortages
➢ 70% reported an insufficient number of qualified applicants
➢ To fill vacancies, 97% are asking existing staff to work additional hours,
89% offer financial incentives (overtime, shift differentials & bonuses)
and 50% are using costly temporary nursing services (30% of these
agencies are unable to reliably fill vacant shifts)
• CNAs are chiefly leaving for higher pay in competing nursing facilities
or outside of health care such as food service & retail industry (Dunkin
Donuts, Starbucks, McDonalds, Target, Walmart). Better hours and burnout
are also contributing to CNAs leaving health care.
• 81% of facility staff are or have experienced burnout or job stress
➢ Workforce shortages, staff working short, meeting resident care
needs and regulatory enforcement were the biggest factors leading to
burnout
• 23% of facilities in 2019 have limited or considered limiting
admissions due to a lack of staff
• Nursing facilities reported an ideal CNA starting wage is $15
2019 Labor and Workforce “Survey Says”
Source: MSCA October 2019 Workforce Survey, 192 nursing facilities responses

Uncompetitive Starting Wage for
Nursing Facility CNAs
12
Sources: (1) Federal Reserve Economic Date for Massachusetts Minimum Wage and (2) Mass Senior Care Association Employment Trend Report
for Median Starting Wage Per Hour
In 2014 the CNA Starting Wage Was 37% Above Minimum Wage
Today It Is Less Than 10%, and Well Below PCA Starting Wage
$8.00
$9.00
$10.00
$11.00 $11.00
$12.00 $11.00 $11.00
$11.52 $12.13
$12.50 $13.00 $13.38
$13.68 $14.12
$14.56 $15.00 $15.40
$7.00
$8.00
$9.00
$10.00
$11.00
$12.00
$13.00
$14.00
$15.00
$16.00
2014 2015 2016 2017 2018 2019
Masschusetts Minimum Wage CNA Median Starting Hourly Wage PCA Starting Hourly Wage
CNA Starting Wage
PCA Starting Wage
MA Minimum Wage

13
MassHealth Nursing Facility Daily Funding Shortfall
A Facility’s Ability to Make Workforce Investments is
Tied to Medicaid Funding
Medicaid Funding Directly Impacts Workforce
The Nursing Facility Dollar
Resident Payor Mix
Medicaid
69%
Medicare,
13%
Private Pay,
13%
Other, 5%

NFs are Managing Direct Care Spending by
Delaying Vendor Payments
14
Sources: (1) CHIA Cost Report Data for Outstanding A/P and Direct Care Spending, (2) Medicaid Rate – based on case mix adjusted rate change, and (3) Operating Margin
- ) Total Margin – Eljay, LLC Report: Medicaid Certified Nursing Facilities in Massachusetts: An Analysis of Margins (Oct. 2016, April 2017, Aug. 2017, Sept. 2018)
Delays in Paying Vendors & Deficit Budgets are Funding
Workforce Investments and Preventing Widespread Failures
Outstanding Accounts Payables Increased by $126M
Medicaid Rate
Direct Care
Spending
Outstanding
Accounts Payable
Operating Margin
1.1%
1.3%2.4%
5.3%
1%
7%
15%16%
2.7%
0.6%2.2% 0.3%
0.4% 1.0%-0.6%
-1.6%
-7.0%
-2.0%
3.0%
8.0%
13.0%
18.0%
Direct Care Spending (%) Outstanding Accounts Payable (%)
Medicaid Rate (%) Operating Margin %
2014 2015 2016 2017

Medicaid Funding Linked to Direct Care Staffing:
Massachusetts Comparison
15
Sources: (1) CMS Data Archive File (State Averages, December Year End) and 2015 AHCA Medicaid Shortfall Report Prepared by Hansen
and Hunter (November 2018)
Massachusetts Ranks 29th in the Nation
for Nursing Home Direct Care Staffing
States with a smaller Medicaid shortfall can provide direct care
staffing well above the National average.
4.13 4.14 4.154.14
4.12 4.12 4.134.08
4.62
4.74.66 4.64
4.44.43
4.544.514.5
4.54 4.57 4.594.534.57
4.614.61
3.7
3.9
4.1
4.3
4.5
4.7
4.9
2014 2015 2016 2017
US Massachusetts Maine North Dakota Florida California
Top Tier States in Nurse Staffing Per Hour Compared to Medicaid Shortfall (2015 actual)
ME: ($17.33/day)
ND : ($7.36/day)
FL: ($13.00/day)
CA: ($14.84/day)
MA: ($33.91/day)

$15.35
$16.86
$17.65
$10.00
$11.00
$12.00
$13.00
$14.00
$15.00
$16.00
$17.00
$18.00
Nursing Home CNA Home Health Aide Hospital CNA
Source: Mass Senior Care Association Annual Employment Survey, 2019 (NF); Home Care Alliance of Massachusetts 2019 Employment Survey
(Home Health Agency); and TNS Differential Applied to Nursing Home Wage (Hospital)
69%
Medic
aid
42%
Medic
aid
21%
Medic
aid
Health Care Wages Investments Linked to
Medicaid Dependency (2019)
A Nursing Facility’s Ability to Increase Wages is
Uniquely Dependent on Medicaid Funding
16

Minimum Wage Cost Impact for Nursing Facilities
17
$6.75
$12.00
$12.75
$13.50
$14.25
$15.00
$6.50
$7.50
$8.50
$9.50
$10.50
$11.50
$12.50
$13.50
$14.50
$15.50
2006 2007 2008 2009 2010 2011 2012 2013 2014 2015 2016 2017 2018 2019 2020 2021 2022 2023
Masschusetts Minimum Wage CNA Median Starting Hourly Wage
Dietary Aide Median Starting Hourly Wage Housekeeping Aide Median Starting Hourly Wage
Laundry Aide Median Starting Hourly Wage
Sources: (1) Federal Reserve Economic Date for Massachusetts Minimum Wage and (2) Mass Senior Care Association Employment Trend Report
for Median Starting Wage Per Hour
Minimum Wage Law Results in $69M in
New Uncompensated Costs for Nursing Facilities

MassHealth Funding Linked to
Staffing & Outcomes
Low or High
Medicaid Nursing
Facilities
CMS 5-Star Quality
Rating
# of Survey
Deficiencies
Daily Nursing Care
Provided Per
Resident
LOW Medicaid –
Less than 50% of
total residents 4.4 Stars 3.2 Deficiencies4 Hours, 37 Minuteswith 24 hour supervision
HIGH Medicaid –
more than 75% of
total residents 2.9 Stars 7.2 Deficiencies 3 Hours, 50 Minuteswith 24 hour supervision
Statewide Average 3.4 Stars 6.0 Deficiencies3 Hours, 58 Minuteswith 24 hour supervision
“Lower reimbursement rates can lead to reductions in staffing,
which can result in lower nursing home care quality and poor
care outcomes.” Kaiser Family Foundation (June 2017)
Sources: CMS Nursing Home Compare Data and CMS Provider File (December 2017 Data)
18
X
xxxxx

Adequate Funding Matters - Quality
23%
30%
33%
25%
17%
11%
8%6%8%
9%10% 10% 10% 10% 9% 8%
0%
5%
10%
15%
20%
25%
30%
35%
2009 2011 2013 2015 2016 2017 2018 2019
Percentage of Deficiency Free Facilities
Massachusetts
National
Nursing Home Financial & Workforce Crisis Has Led
to a Sharp Decline in Outcomes
Massachusetts Now Underperforms the Nation
Source: Centers for Medicare and Medicaid Services Online Survey Certification and Reporting (CMS-OSCAR)
19

20
➢ Passage of the Stabilization Bill (S.352 & H.610)
1. Modernize Rates Using Actual Days & Fully Fund $185M in legitimate resident care
and staffing expenses in 2017. Currently rates are paid using ‘imputed’ days instead of actual
days.
2. Update Rates Using 2017 Costs in order to fund staff increases and resident care.
3. Update rates using Medicare’s Inflation Rate – Current 2020 rates are set at 2014 expenses,
but there is 0% inflation to recognize new resident care costs from 2014 to 2020.
➢ Passage of the Quality Jobs Initiative (S.671 & H.618)
1. Living Wage Requires MassHealth to fund its portion of a $15 starting wage and establishes a
path to a living wage with annual increases.
2. Opportunity Establishes a training program to recruit new staff and career ladders for existing
staff.
3. Culture Establishes grants for Leadership & Supervisory Training.
➢ Implement HC Collaborative Recommendations
1. Recruitment Improve Access to CNA Training
2. Retention Support Career Ladders via Upskilling
Workforce Solutions
Closing the Medicaid Gap by Using More Current Costs, Actual Resident
Days and a Valid Inflation Adjustment is Critical to Making Workforce
Investments, Since 75% of a Facility’s Budget is used to Fund Wages