NURSE WORKFORCE CHALLENGES IN THE UNITED … · NURSE WORKFORCE CHALLENGES IN THE UNITED ... NURSE...
48
DELSA/ELSA/WP2/HEA(2008)2 OECD HEALTH WORKING PAPERS NURSE WORKFORCE CHALLENGES IN THE UNITED STATES: IMPLICATIONS FOR POLICY Linda H. Aiken and Robyn Cheung 35
Transcript of NURSE WORKFORCE CHALLENGES IN THE UNITED … · NURSE WORKFORCE CHALLENGES IN THE UNITED ... NURSE...

DELSA/ELSA/WP2/HEA(2008)2
OECD HEALTH WORKING PAPERS
NURSE WORKFORCE CHALLENGES IN THE UNITED STATES: IMPLICATIONS FOR
POLICY
Linda H. Aiken and Robyn Cheung
35

Unclassified DELSA/ELSA/WP2/HEA(2008)2 Organisation de Coopération et de Développement Économiques Organisation for Economic Co-operation and Development 01-Oct-2008 ___________________________________________________________________________________________
English text only DIRECTORATE FOR EMPLOYMENT, LABOUR AND SOCIAL AFFAIRS Employment, Labour and Social Affairs Committee Health Committee
OECD HEALTH WORKING PAPERS NO. 35 NURSE WORKFORCE CHALLENGES IN THE UNITED STATES: IMPLICATIONS FOR POLICY
Linda H. Aiken and Robyn Cheung
JEL Classification: I10, F22, J2
JT03251652
Document complet disponible sur OLIS dans son format d'origine Complete document available on OLIS in its original format
DE
LSA
/EL
SA/W
P2/HE
A(2008)2
Unclassified
English text only

DELSA/ELSA/WP2/HEA(2008)2
2
DIRECTORATE FOR EMPLOYMENT, LABOUR AND SOCIAL AFFAIRS
OECD HEALTH WORKING PAPERS
This series is designed to make available to a wider readership health studies prepared for use within the OECD. Authorship is usually collective, but principal writers are named. The papers are generally available only in their original language – English or French – with a summary in the other. Comment on the series is welcome, and should be sent to the Directorate for Employment, Labour and Social Affairs, 2, rue André-Pascal, 75775 PARIS CEDEX 16, France.
The opinions expressed and arguments employed here are the responsibility of the author(s) and do not necessarily reflect those of the OECD
Applications for permission to reproduce or translate all or part of this material should be made to:
Head of Publications Service
OECD 2, rue André-Pascal
75775 Paris, CEDEX 16 France
Copyright OECD 2008

DELSA/ELSA/WP2/HEA(2008)2
3
ACKNOWLEDGMENTS
This report relies on previously conducted research by Linda Aiken, including Aiken (2007). This research was supported in part by the National Institute of Nursing Research (P30NR05043), the Robert Wood Johnson Foundation, and the Commonwealth Fund. The authors are grateful to Tim Cheney for data analysis assistance and the National Council on State Boards of Nursing for data.
This paper is one in a series of case studies undertaken as part of a project on Health Workforce and International Migration. The project was jointly undertaken by the OECD and the World Health Organization, which seconded a WHO official to the OECD to work on the project. We are grateful to the Swiss authorities for the financial support which supported this secondment.
The Health Workforce and International Migration project has received direct financial support from Australia and Canada, and has benefitted from voluntary contributions in support of the Health Systems Performance work programme from other member countries.
The Health Workforce and International Migration project has been co-financed by a grant provided by the Directorate General for Health and Consumer Protection of the European Commission. Nonetheless, the views expressed in this report should not be taken to reflect the official position of the European Union.

DELSA/ELSA/WP2/HEA(2008)2
4
SUMMARY
The United States has the largest professional nurse workforce in the world numbering close to 3 million but does not produce enough nurses to meet its growing demand. A shortage of close to a million professional nurses is projected to evolve by 2020. An emerging physician shortage will further exacerbate the nurse shortage as the boundaries in scope of practice necessarily overlap. Nurse immigration has been growing since 1990 and the U.S. is now the world’s major importer of nurses. While nurse immigration is expected to continue to grow, the shortage is too large to be solved by recruitment of nurses educated abroad without dramatically depleting the world’s nurse resources. Moreover, the domestic applicant pool for nursing education is very strong with tens of thousands of qualified applicants turned away annually because of faculty shortages and capacity limitations. The national shortage could be largely addressed by investments in expanding nursing school capacity to increase graduations by 25 percent annually and the domestic applicant pool appears sufficient to support such an increase. A shortage of faculty and limited capacity for expansion of baccalaureate and graduate nurse education require public policy interventions. Specifically public subsidies to increase production of baccalaureate nurses are required to enlarge the size of the pool from which nurse faculty, advanced practice nurses in clinical care roles, and managers are all recruited. Retention of nurses in the workforce is critical and will require substantial improvements in human resource policies, the development of satisfying professional work environments, and technological innovations to ease the physical burdens of caregiving. Because of the reliance of the U.S. on nurses educated abroad as well as the benefits to the U.S. of improving global health, the nation should invest in nursing education as part of its global agenda.

DELSA/ELSA/WP2/HEA(2008)2
5
RÉSUMÉ
Les États-Unis comptent le plus grand nombre d’infirmiers(ères) diplômés au monde – près de 3 millions – mais ils n’en forment pas suffisamment pour répondre à une demande en augmentation. Il devrait manquer près d’un million d’infirmiers(ières) diplômés, aux États-Unis, d’ici 2020. Et le déficit de médecins qui commence d’apparaître ne fera qu’exacerber le problème car les deux pratiques professionnelles sont nécessairement interdépendantes. L’immigration d’infirmiers(ères) n’a cessé d’augmenter depuis 1990 et les États-Unis sont désormais le premier pays d’accueil d’infirmiers(ères) étrangers au monde. Cette vague d’immigration devrait se poursuivre mais la pénurie est trop importante pour pouvoir être résorbée par des recrutements à l’étranger sans que cela ponctionne gravement les ressources en personnel infirmier au niveau mondial. Par ailleurs, les personnes désireuses de suivre une formation d’infirmier(ère) dans le pays sont nombreuses mais des dizaines de milliers de postulants qualifiés sont refusés chaque année en raison du manque de personnel enseignant et de l’insuffisance des capacités d’accueil dans les écoles d’infirmiers(ères). On pourrait largement pallier ces insuffisances en intensifiant les investissements consacrés aux écoles d’infirmiers(ières) de façon à accroître de 25 % par an le nombre des diplômés, ce qui paraît réaliste au regard du nombre actuel de candidats. Le manque de personnel enseignant et l’insuffisance des capacités de formation appellent l’intervention des pouvoirs publics. Précisément, des subventions publiques doivent aider à accroître le nombre d’infirmiers(ières) diplômés, ce qui élargira l’effectif au sein duquel on pourra recruter du personnel enseignant, des infirmiers(ères) cliniciens de haut niveau et des gestionnaires. Inciter les infirmiers(ères) à rester dans la profession est fondamental et cela nécessitera une amélioration significative des politiques de gestion des ressources humaines, la garantie d’un environnement de travail satisfaisant et des innovations technologiques pour alléger la charge physique que représente l’activité de soins. Compte tenu de l’importance des personnels infirmiers formés à l’étranger pour les États-Unis et des avantages qui résulteraient d’une amélioration générale de la santé publique, le pays devrait faire de l’investissement dans la formation d’infirmiers(ères) un des objectifs de l’action publique.

DELSA/ELSA/WP2/HEA(2008)2
6
TABLE OF CONTENTS
ACKNOWLEDGMENTS .............................................................................................................................. 3
SUMMARY .................................................................................................................................................... 4
RÉSUMÉ ........................................................................................................................................................ 5
INTRODUCTION .......................................................................................................................................... 8
NURSE STOCK ............................................................................................................................................. 8
Skill mix .................................................................................................................................................... 11 Gender ....................................................................................................................................................... 12 Age ............................................................................................................................................................ 12 Activity status ............................................................................................................................................ 12 Part-time status .......................................................................................................................................... 12 Supply by Region ...................................................................................................................................... 13 Employment setting................................................................................................................................... 14
SUPPLY ....................................................................................................................................................... 15
Inflow of Newly Educated RNs ................................................................................................................ 15 Immigration ............................................................................................................................................... 21
Nurse Immigration Requirements .......................................................................................................... 22 Trade agreements ................................................................................................................................... 23 Data sources on nurse migration: .......................................................................................................... 24 Source countries and distribution .......................................................................................................... 25 Nurse migration and nurse shortage: ..................................................................................................... 29
NURSE STOCK OUTFLOWS .................................................................................................................... 30
Emigration ................................................................................................................................................. 30 Inactivity ................................................................................................................................................... 30 Retirements ............................................................................................................................................... 30
DEMAND ..................................................................................................................................................... 31
New job creation ....................................................................................................................................... 31
SUMMARY AND CONCLUSIONS ........................................................................................................... 33
Options for responding to nurse shortages ................................................................................................ 34 Monitoring nurse workforce trends: ...................................................................................................... 34 Nurse Workforce Self-sufficiency: ........................................................................................................ 34 Improving retention and increasing productivity ................................................................................... 36 Managed Nurse Migration ..................................................................................................................... 37 Foreign aid and immigration policies .................................................................................................... 38
BIBLIOGRAPHY ......................................................................................................................................... 39
APPENDIX: UNITED STATES LICENSING PROCESS FOR FOREIGN-EDUCATED RNS .............. 43

DELSA/ELSA/WP2/HEA(2008)2
7
Tables
Table 1. U.S. Nurse Workforce by Category, Gender and Age, 1985, 1995, 2005, thousands .................. 9 Table 2. Employed RNs, LPNs and nursing assistants per 1000 population, 1990-2005 ......................... 11 Table 3. Employment status of RNs by geographic area, 2004, US ......................................................... 13 Table 4. Employment status of LPNs and nursing assistants, 2005, U.S. ................................................. 14 Table 5. Number of entrants, graduations, and admission in nursing schools 1990-2006 ........................ 18 Table 6. Absolute and relative remuneration of nurses 1998-2004, U.S................................................... 19 Table 7. Annual number of newly licensed RNs and LPNs by place of training, 1990-2006 .................. 22 Table 8. Percentage of foreign born persons trained as professional nurses by current occupation, 2003 23 Table 9. Foreign educated nurses by region of birth ................................................................................. 26 Table 10. Number of foreign educated nurses by gender, age category, and employment setting, 2004 . 28 Table 11. Projections of US RN supply, demand, and shortages, 2010-2020 .......................................... 29 Table 12. Percent of unfilled vacancies for hospital RNs, LPNs, nursing assistants, 2004-2007 ............. 31
Figures
Figure 1: GPD Per Capita, Healthcare Workforce, and Nurse Supply in OECD Countries ..................... 10 Figure 2. Graduations and Enrollments in RN Programs 1958 – 2005* ................................................... 16 Figure 3. Trends in Federal Title VII Appropriations for Nursing, 1965-2005 ........................................ 17 Figure 4. Actual and real salaries for RNs, 1980 - 2004 ........................................................................... 20 Figure 5: Distribution of Foreign Born RNs by Density by State, 2000 ................................................... 25

DELSA/ELSA/WP2/HEA(2008)2
8
INTRODUCTION
1. This paper focuses on the balance between supply and demand for nurses in the United States with a particular focus on nurse migration. Trends over the past two decades in the supply of nurses are examined, taking into account the contribution of inflows to the nurse stock (including training, trends in inactive status, and immigration) as well as outflows (including retirement and emigration). The supply of nurses is considered in the context of present and projected future demand. Workforce policy directions are reviewed and recommendations will be made regarding future considerations for policy decision-making. Data are provided, where available, on the two categories of licensed nurses in the United States, professional registered nurses (RNs) and licensed practical/vocational nurses, and on nursing assistants, although the primary focus of the paper is professional registered nurses.
NURSE STOCK
2. The nurse workforce in the United States is the largest of any country in the world (Aiken, 2007). The professional nurse workforce alone (RNs) numbers almost 3 million as of 2004, and grew by over 1.4 million between 1980 and 2004 [U.S. Department of Health and Human Services (USDHHS), 2006]. Licensed practical/vocational nurses (LPNs) (technical nurses with a limited legal scope of practice who generally work under the supervision of registered nurses), number close to 510 000 employed, and there are about 1.5 million employed nursing assistants (see Table 1).

DELSA/ELSA/WP2/HEA(2008)2
9
Table 1. U.S. Nurse Workforce by Category, Gender and Age, 1985, 1995, 2005, thousands
Employed RNs by gender and age group, 1985, 1995, 2005
1985 1995 2005 Male Female Total Male Female Total Male Female Total
<25 1.7 88.9 90.7 4 60 64 5 85 90
25-34 28.1 602.2 630.3 32 437 469 48 414 462
35-44 17. 9 470.5 488.4 63 699 762 47 591 638
45-54 5,3 326.7 331.9 32 448 480 63 727 790
55-64 2.9 234.5 237.4 3 4 169 173 19 356 375
>64 .8 82.5 83.3 28 28 5 57 62
Total 56. 8 1 805.3 1 862.1 135 1 841 1 976 187 2 230 2 417 Data Sources: 1985 data from NSSRN 1984, authors' calculations; 1995 and 2005 data from Current Population Survey, Employed Persons by Detailed Occupation 1995, 2005.
Employed LPNs by gender and age group, 1995, 2005 1995 2005 Male Female Total Male Female Total
<25 2 19 21 1 29 30
25-34 5 80 85 8 99 107
35-44 6 131 137 13 125 138
45-54 4 101 105 7 144 151
55-64 2 41 43 4 66 70
>64 8 8 1 13 14
Total 19 380 399 34 476 510 Data Source: Current Population Survey, Employed Persons by Detailed Occupation 1995, 2005
Employed Nursing assistants* by gender and age group, 1995, 2005 1995 2005 Male Female Total Male Female Total
<25 48 250 298 28 215 243
25-34 61 367 428 41 317 358
35-44 38 406 444 35 344 379
45-54 26 324 350 25 276 301
55-64 9 176 185 10 145 155
>64 3 49 52 2 36 38
Total 185 1 572 1 757 141 1 333 1 474 Data Source: Current Population Survey, Employed Persons by Detailed Occupation 1995, 2005*Nursing assistants include nursing aides, orderlies, and attendants
Notes: Data are displayed in 10 year periods rather than 5 year periods. Empty cells indicate too few to count. 1985 data not available for LPNs and nursing assistants.
DELSA/ELSA/WP2/HEA(2008)2
10
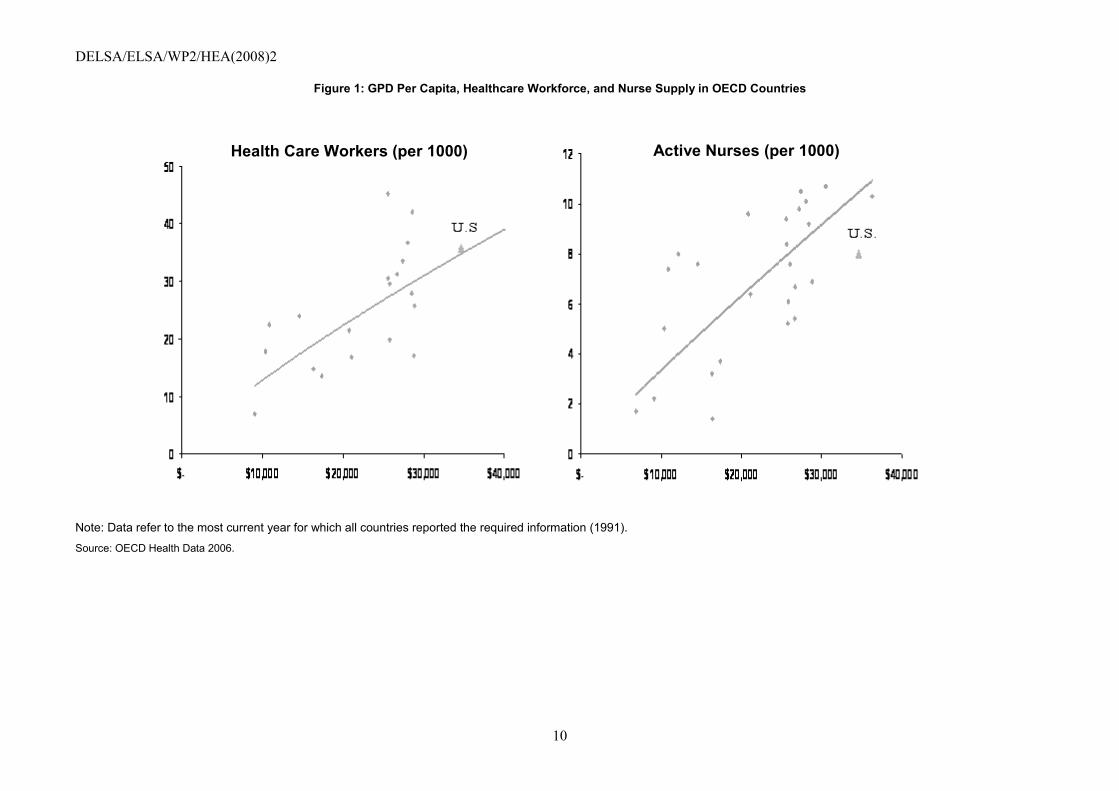
Figure 1: GPD Per Capita, Healthcare Workforce, and Nurse Supply in OECD Countries
Note: Data refer to the most current year for which all countries reported the required information (1991).
Source: OECD Health Data 2006.
Health Care Workers (per 1000) Active Nurses (per 1000)

DELSA/ELSA/WP2/HEA(2008)2
11
3. Figure 1 illustrates the relationship between GDP per capita and total healthcare workforce supply and nurse supply in OECD countries. Countries with higher GDP per capita have a larger healthcare workforce in population ratio terms as is illustrated in panel 1 of Figure 1. This relationship is also true of nurses. Indeed, as illustrated by the slopes of the lines in the two panels of Figure 1, OECD countries show a stronger relationship between active nurses per 1000 population and GDP per capita than is the case for the overall healthcare workforce. This relationship between GDP per capita and nurses is a contributing factor in the global shortage of nurses—as GPD grows so does the demand for nurses, with countries with the highest GPD per capita possibly using more nurses than they produce.
4. The U.S. has experienced consistent growth in real health expenditures per capita and percent growth of GDP per capita. However, panel 2 of Figure 1 suggests that relative to other OECD countries of high GDP per capita, the U.S. employs fewer active nurses than would be expected, given its high GDP per capita. Given limitations in data it is difficult to pinpoint whether this is a relatively new phenomenon or longstanding. However, we do know that most of the growth in the U.S. nurse supply occurred before 1990, after a period of decades when the growth of nurses outstripped population growth. As noted in Table 2, the rate of growth in population ratio terms remained constant at between 10 and 11 RNs per 1 000 population between 1990 and 2004, a period of decline in nursing school enrollments.
Table 2. Employed RNs, LPNs and nursing assistants per 1000 population, 1990-2005
RN per capita LPN per capita Nursing assistant per capita MD:RN ratio
1990 10.0 3.4 1991 10.3 3.5 1992 10.2 3.5 1993 10.5 3.4 1994 11.1 3.5
1995/1996 11.1 3.4 1997 11.2 3.3 1998 11.3 3.4 4.7 1999 11.4 3.3 4.8 2000 11.0 3.2 4.5 2001 10.9 3.1 4.8 2002 11.1 3.0 4.6 2003 11.0 3.0 4.6 2004 10.4 2.8 4.8 2005 11.3 3.0 1:4
Note: Pre-1998 data on nursing assistants not available.
Source: RN and LPN estimates from the National Council of State Boards of Nursing, Total Number of Active Licenses; nursing assistant estimates from the US Census Bureau, Bureau of Labor Statistics, Annual Household Survey. Nurse supply from National Sample of Registered Nurses, 2004; RN:MD ratio calculated using MD per capita data from OECD Health Division, Table Practising Physicians, available from http://www.oecd.org/dataoecd/46/36/38979632.xls
Skill mix
5. Skill mix has remained relatively constant at about 4 RNs per physician. Licensed practical nurses have declined marginally in population terms consistent with trends of lower use of LPNs in hospitals for the past two decades (Aiken, Sochalski, Anderson, 1996). Aides per capita remained constant.

DELSA/ELSA/WP2/HEA(2008)2
12
Gender
6. Nursing in the U.S. is predominantly a female occupation (Table 1). However between 1985 and 2005, men increased as a percent of total RNs from 4% to 8%, and more than 130 000 additional male nurses were added to the workforce. Over this same period the proportion of male LPNs declined slightly (from 9.5% in 1985 to 7% in 2005) although male LPNs increased in number by 15 000 over the period. The proportion of male nursing assistants stayed the same over the period, at 9%.
Age
7. The average age of the RN population is increasing, reaching 46.8 years of age in 2004 (US Department of Health and Human Services, 2006). In 1980, over half of licensed RNs were under the age of 40, while in 2004 only slightly more than a quarter were under 40. The proportion of RNs over 54 years of age increased from 17% in 1980 to 25% in 2004. The aging of the nurse population has created substantial challenges for nurse retention, particularly in physically demanding and fast-paced patient care roles in hospitals where the average age of bedside nurses is close to 46 years. Nurses have a high rate of employment-related injuries, especially back injuries. Institutional accreditation bodies and professional societies have placed a high priority on implementing safe lifting practices including the use of mechanical lift devices. Other innovations that would enable older nurses to remain in clinical care and delay retirement are being sought.
Activity status
8. In 2004, over 83% of those with active RN licenses were employed in nursing, a high labor force participation rate for a predominantly female population. Almost 17% or 488 000 licensed RNs were not employed in nursing as of 2004 (US Department of Health and Human Services, 2006). This was the lowest percentage of inactivity since 1980 but nevertheless remains of interest because the number of inactive nurses is so great that it represents a significant potential inflow to the nurse stock if these nurses could be attracted back to active practice. However, of those not employed in nursing in 2004, almost 40% were 60 years of age or older and thus not good prospects for returning to active employment. The approximately 160 000 inactive licensed RNs below the age of 50 represent a potentially employable group. Trends over time suggest that more of these nurses come into the workforce when either the economy is weak or nurses’ wages are high (Aiken and Mullinix, 1987). Indeed, along with nurse immigration, inactive nurses returning to work accounted for a substantial share of the growth of the employed nurse workforce over the period 2000-2003, a period of decline in nurse graduations (Buerhaus, Staiger, & Auerbach, 2004). Data are lacking on the number of nurses of employment age no longer holding licenses to practice.
Part-time status
9. About 30% of employed RNs work part-time. In 2004, the number of part-time nurses totalled 720 000. The hours that part-time nurses do not contribute thus represent a substantial potential reservoir of supply. There is evidence that the number of hours worked by part-time nurses increases during economic downturns and/or periods of increased relative nurse wages (Aiken and Mullinix, 1987). The most promising strategies to motivate part time nurses to provide more hours include flexible hour options including 12 hour shifts with more days off, opportunities for temporary assignments by employing organizations or supplemental staffing firms (Aiken, Xue, Clarke, Sloane, 2007), and better benefits including retirement. The latter, retirement benefits, is not an option widely offered to bedside nurses but is of increasing importance to retaining nurses as the nurse workforce ages.

DELSA/ELSA/WP2/HEA(2008)2
13
Supply by Region
10. Table 3 illustrates that the national nurse supply is not proportionately distributed across all regions with the New England region having 11 employed nurses per 1 000 population to only 6.5 per 1 000 in the Pacific region. Interestingly, both the high and low regions purport to have nurse shortages. This distribution pattern is similar for LPNs and aides (Table 4). Over all regions, about 20% of employed nurses are working in non-nursing jobs. However in the regions with acute perceived shortages only about 12% of nurses are working in non-nursing jobs. The unemployment rate among nurses defined as those looking for employment is negligible. Similarly the unemployment rate for LPNs and aides is also low. The supply differences between California and New England are due both to higher rates of population growth in California and fewer nursing schools.
Table 3. Employment status of RNs by geographic area, 2004, US
Geographic area Employed in nursing
Employed not in
nursing
Employed nurses per
1000 population
Unemployed
New England 157 676 31 818 11.0
Mid Atlantic 374 201 97 966 9.3
South Atlantic 446 850 94 902 8.0
East South Central 152 517 22 917 8.7
West South Central 225 252 35 651 6.8
East North Central 417 855 83 438 9.0
West North Central 202 106 30 542 10.3
Mountain 137 980 28 408 7.0
Pacific 307 023 62 365 6.5
Total 2 421 460 488 007 28 000 Note: Unemployed not available by geographic area.
Source: For employed: NSSRN, Preliminary Findings, Table A. Registered Nurses Population in Each State and Geographic Area by Activity Status: March 2004; For unemployed: Current Population Survey, Table 3, 2005.

DELSA/ELSA/WP2/HEA(2008)2
14
Table 4. Employment status of LPNs and nursing assistants, 2005, U.S.
Employed Employed per 1000 population Unemployed
LPN Nursing assistants LPN Nursing
assistants LPN Nursing assistants
New England 32 680 92 100 2.3 6.5
Mid Atlantic 103 320 213 430 2.6 5.3
South Atlantic 137 600 250 300 2.4 4.5
East South Central 57 610 92 010 3.3 5.2
West South Central 110 660 151 340 3.3 4.5
East North Central 107 300 246 240 2.3 5.3
West North Central 60 140 135 550 3.0 6.8
Mountain 32 790 70 870 1.6 3.5
Pacific 67 910 139 580 1.4 2.9
Total 710 010 1 391 420 16 000 114 000 Source: For employed: 2005 Bureau of Labor Statistics; For unemployed: Current Population Survey, Table 3, 2005.
Employment setting
11. The dominant employment setting for RNs is the hospital, accounting for 56% of employed nurses in 2004, a decline from 65% in 1980 (US Department of Health and Human Services, 2006). Over time hospitals have accounted for a declining share of a growing stock of nurses. In 2004, community health/public health and ambulatory settings accounted for 11 and 12% of employed nurses respectively. Nursing homes/extended care facilities accounted for 6% of employed RNs. In general, hospitals and nursing homes have a more difficult time filling budgeted positions for RNs than ambulatory settings and are more likely to engage in international recruitment.
DELSA/ELSA/WP2/HEA(2008)2
15
SUPPLY
Inflow of Newly Educated RNs
12. There are four different educational pathways for licensed nurses in the U.S. and two licensure categories. Registered nurses are prepared in 3 types of generic programs: baccalaureate programs generally taking 4 years (674 programs), associate degree programs generally taking about 3 years (846 programs), and hospital diploma programs without formal higher education credit generally taking 3 years (69 programs). All RN programs in the U.S. must be at the post secondary level after 12 years of general education and a high school diploma or equivalent. The professional nurse licensing exam (RN) is the same for graduates of these 3 types of RN programs. There is a separate licensing exam for practical/vocational nurses; educational programs are generally one year in length. There are increasing numbers of programs of varying lengths for RNs to obtain additional education in the form of associate, bachelors, and master’s degrees. Additionally “fast track” programs are increasingly common that enable second career non nurses with baccalaureate or higher degrees in other fields to become nurses in between 1 and 2 years.
13. Figure 2 portrays the general upward trend in RN nursing school enrollments and graduations since 1958, including as well cyclical fluctuations. Recent analyses of trends in nursing school applications, admissions, graduations and enrollments are hampered by the absence of data in key years from the National League for Nursing (NLN), the only organization to collect these data on all types of nursing schools. In the tables that follow, proxy data where available, such as number of graduates from U.S. nursing schools taking the licensure exam for the first time, have been substituted for years in which NLN did not report graduations. Among the types of basic nursing education there have been large proportional shifts over time. Hospital sponsored diploma schools have been replaced by rapidly growing associate degree programs that now account for 65 percent of new nurse graduates. Proportionately graduations from baccalaureate programs have remained at one-third of graduates for several decades despite rapidly growing demand for nurses with higher education. Only a small fraction of associate degree nurses go on to obtain higher degrees. Explanations for this include lack of wage differentiation based on educational qualifications except at the graduate level, selection to community colleges of nurse applicants without the desire and or qualifications to advance to higher education, and the cost of higher education including foregone wages. The result is that not enough nurses are being produced with the educational qualifications to obtain graduate degrees necessary for faculty positions, advanced practice clinical roles, and administrative roles.

DELSA/ELSA/WP2/HEA(2008)2
16
Figure 2. Graduations and Enrollments in RN Programs 1958 – 2005*
Dotted line indicates imputed values for missing data, years 1997, 1998, 2000, 2001.
* Data on enrollments available for years 1958-2003
Source: NLN (enrollments 1958-1996, 1999, 2002-2003; graduations 1958-2004); National Council State Boards of Nursing (2005 first-time U.S.-educated NCLEX-RN test takers to estimate graduations).

DELSA/ELSA/WP2/HEA(2008)2
17
Figure 3. Trends in Federal Title VIII Appropriations for Nursing, 1965-2005
Source: Eastaugh, 1985.
14. Most nursing students in the U.S. finance their own education. Unlike many other countries, nursing students in the U.S. receive little public support for their education other than general subsidies to public institutions of higher education that result in lower tuition. The increase in enrollments and graduations from 1965-1976, were associated with significant federal investments in nursing education over the decade following the introduction of the Medicare and Medicaid programs that expanded access to health care for the elderly and poor, illustrated in Figure 3 (Eastaugh, 1985). Nursing also benefited over the 1965-75 period from a national expansion in the number of colleges and universities, many of which included nursing schools, and increased enrollments of women in higher education. Recently with much slower growth in the establishment of new colleges and universities, enrollments in nursing schools have been constrained by overall crowding and enrollment limits in institutions of higher education. Also in the absence of substantial public subsidies for nursing education, enrollments have been sensitive to market conditions for nurse employment. As noted in Figure 3, except for the 10 year period in the 1970s, federal support of nursing education has grown only modestly in real terms. Moreover, federal support does not have the same impact now as it did in the 1965-75 period because nursing schools do not have the same capacity to expand because of overall growth constraints in the parent colleges and universities.

DELSA/ELSA/WP2/HEA(2008)2
18
Table 5. Number of entrants, graduations, and admission in nursing schools 1990-2006
Admissions Graduations Enrollments
1990 108 580 66 088 221 170
1991 113 526 72 230 237 598
1992 122 656 80 839 257 983
1993 126 837 88 749 270 228
1994 129 897 94 870 268 350
1995 127 184 97 052 261 219
1996 NA 94 326 NA
1997 NA 89 619 NA
1998 NA 83 239 NA
1999 NA 76 523 NA
2000 NA 71 392 NA
2001 NA 68 759 NA
2002 77 868 70 692 221 698
2003 133 011 76 688 244 769
2004 145 410 87 171 NA
2005 152 627 99 186 NA
2006 NA 136 621 NA Note: Data for LPNs not available. NA denotes data not available.
Source: National League for Nursing, Nursing Data Review Academic Year 2004-2005; 2002 data from unpublished NLN Preliminary Data; 1996 to 2006 graduations taken from the National Council of State Boards of Nursing domestic first time test takers of the NCLEX-RN.
15. The impact of market forces on admissions to nursing schools is suggested by the 10 year decline in graduations between 1996 and 2004 illustrated in Table 5. Applications and admissions to nursing schools declined for six consecutive years from 1995 through 2000 during a period of highly publicized nurse layoffs and nurse workforce downsizing through attrition associated with employer adaptations to increased market penetration of managed care organizations (Aiken, Clarke, Sloane, 2001). There were no changes in financing of nursing education or educational capacity or major wage shifts during the period or other factors that would explain the abrupt decline in interest in nursing careers. The easy availability of jobs for nurses in every community is a major attraction to prospective students. In an overall environment of job outsourcing and corporate downsizing in the U.S., nurse layoffs shook the confidence of prospective nursing students and many apparently made other career choices or delayed entry into nursing. Graduations from RN programs fell from over 97 000 in 1995 to a low of 71 000 in 2001. It was not until 2005 that graduation numbers rebounded to 1995 levels. This 10 year decline resulted in at least 142 000 fewer nurses being produced, a very conservative estimate based on enrollments staying at 97 000 annually over the decade 1995-2005.
16. Since 2004, nursing school graduations have risen substantially to historic highs. In 2006, 136 621 graduates from U.S. nursing schools took the licensing exam (NCLEX-RN) for the first time, a proxy for new graduates. What factors explain the rapid growth? Some new nursing schools have opened but not enough to explain the increase in graduations. Existing nursing schools had excess capacity because of the earlier fall in enrollments and were able to expand to 1995 enrollment levels and beyond. However, widespread reports of shortages of faculty will temper further growth in enrollments. The

DELSA/ELSA/WP2/HEA(2008)2
19
American Association of Colleges of Nursing (AACN) reported that more than 30 000 applicants seeking baccalaureate nursing education could not be accommodated in 2005 because of faculty shortages and capacity limitations [American Association of Colleges of Nursing (AACN), 2005]. The National League for Nursing estimated that as many as 150 000 applicants were turned away from all nursing programs, including baccalaureate, associate degree, and hospital diploma schools although this number is inflated by multiple applications per individual (National League for Nursing, 2005). Faculty shortages are the result of two factors: a large upswing in demand in clinical care roles for nurses with graduate degrees (advanced practice nurses such as nurse practitioners) and too small of a pool of baccalaureate degree nurse graduates to meet increased demand for more educated nurses at the bedside as well as in education.
Table 6. Absolute and relative remuneration of nurses 1998-2004, U.S.
RN LPN Nursing Assistant
1998 Absolute $43 070 $28 040 $17 290
Relative 1.37 0.89 0.55
1999 Absolute $44 470 $29 020 $17 860
Relative 1.35 0.88 0.54
2000 Absolute $46 410 $30 470 $19 100
Relative 1.34 0.88 0.55
2001 Absolute $48 240 $31 490 $19 850
Relative 1.37 0.89 0.56
2002 Absolute $49 840 $32 300 $20 540
Relative 1.38 0.89 0.57
2003 Absolute $52 810 $33 930 $21 370
Relative 1.41 0.90 0.57
2004 Absolute $55 680 $35 580 $21 890
Relative 1.40 0.90 0.55 Note: Relative remuneration is the ratio of absolute remuneration to per capita GDP.
Source: Bureau of Labor Statistics, Occupational Employment and Wage Estimates, 1998-2004; OECD Stat.
17. Nurses experienced real wage growth of 12.8% between 2000 and 2004, the first significant up-turn in real wages since 1988 (US Department of Health and Human Services, 2006), which may have been a contributing factor in increased nursing school enrollments (see Figure 4). Nurses’ incomes in absolute terms are reasonable by domestic standards and high by international standards. As noted in Table 6, the relative remuneration of RNs (ratio of absolute remuneration to per capita GDP) is favorable. Nurse workforce research has been out of favor for over two decades and thus recent research on the effect of wages on nursing school applications is lacking. In 2005 and 2006 nurses’ real wage growth was flat. Nevertheless, the domestic applicant pool for nursing schools remains very strong and thousands of qualified applicants continue to be turned away each year. One explanation for increased interest in nursing is the obverse of the explanation for the decline in applications in the mid-1990s: plenty of jobs in every community at a time when white collar jobs are less plentiful. Second career applicants with college degrees to nursing schools account for a significant proportion of all applicants. In addition to good job availability in traditional nursing roles, second career applicants are attracted by opportunities in well paid and professionally satisfying positions for nurses with graduate clinical training as nurse practitioners, nurse midwives, and nurse anesthesia (Skudera, 2007).

DELSA/ELSA/WP2/HEA(2008)2
20
Figure 4. Actual and real salaries for RNs, 1980 - 2004
Source: US Department of Health and Human Services, 2006.
18. The age of nurses at completion of their basic education and licensure has been increasing significantly over time in all types of programs. Graduates of associate degree programs are, on average, in their thirties and significantly older than graduates of other programs. Because associate degree programs have grown rapidly and now account for over 60% of new nurse graduates, the impact of the older ages of new nurse cohorts could affect supply over time for they would presumably have a shorter potential worklife (Auerbach, Buerhaus, Staiger, 2007).
19. The concept of “wastage” in nursing education terms, defined by students admitted to nursing programs but not completing, is not tracked in the U.S. (as it is in many other countries) for a number of reasons. There are no funded positions specifically for nursing students as in some other countries. Financial aid generally goes to students and it is common in the U.S. for students to change their majors after entering higher education. It is not possible to calculate wastage from national statistics such as those presented in Table 5 on admissions, graduations, and enrollments because programs vary widely in length. While systematic research is lacking, it is apparent that community college nursing programs, many of which have open admissions with few requirements beyond high school equivalency, experience a relatively high rate of non-completion in their associate degree nursing programs, perhaps in the 40% range. There are programs of remedial study and counseling to improve completion rates, particularly among under-represented minority students. However the issue does not have the same policy interest in the U.S. because students, for the most part, finance their own education and there are plenty of applicants to take the places of those who drop out.
20. The robust applicant pool for nursing schools suggests that further expansions of nursing school enrollments and graduations are possible if additional resources are invested in preparing more qualified faculty and in expanding the educational infrastructure. Recent expansions have largely been a return to slightly above pre-1995 enrollment levels, and additional expansion will require more faculty and clinical

DELSA/ELSA/WP2/HEA(2008)2
21
training opportunities. There are some 1 589 nursing schools/programs in the U.S. The majority of schools are public; private colleges and universities within the U.S. are almost all non-profit institutions. A small number of private, for-profit nursing schools that target U.S. students are located in the Caribbean and off shore nursing schools are under development in a few other countries, but at this time they are not a substantial source of nurses for the U.S. The U.S. has the potential to become largely self-sufficient using its own domestic labor resources to produce enough nurses to meet future demand if additional public resources become available to expand nursing school capacity (Cooper and Aiken, 2006).
Immigration
21. Healthcare organizations in the United States have actively recruited professional nurses from abroad for over 50 years in response to cyclical nurse shortages in hospitals and nursing homes (Brush and Berger, 2002; Aiken, Buchan, Sochalski, Nichols, & Powell, 2004; Aiken, 2007; Polsky, Ross, Brush, Sochalski, 2007). Until the early 1990s, the inflow of registered nurses educated abroad generally did not exceed 4 000-5 000 a year (Buerhaus et al., 2004). But in the period 1994 through 2006, the annual number of newly licensed registered nurses from abroad tripled to more almost 21 000 in 2006 (see Table 7) making the U.S. the largest importer of professional nurses in the world. Foreign educated nurses increased as a percent of new entrants from 9% in 1990 to 16% in 2006. Immigration of persons in the category of practical or vocational nurses has remained constant over time at about 1 400 a year accounting for about 2% of new LPN entrants to the workforce. For the most part trends in nurse immigration parallel trends in enrollments in nursing schools. Both enrollments, as argued earlier, and immigration are driven by employer demand, particularly in the hospital sector. If there are fewer jobs, nursing school enrollments decline as does nurse immigration because hospitals are not recruiting at home or abroad.

DELSA/ELSA/WP2/HEA(2008)2
22
Table 7. Annual number of newly licensed RNs and LPNs by place of training, 1990-2006
RN LPN Native trained
Number passing
NCLEX exam
Foreign trained Number passing
NCLEX exam
Percent foreign
trained (of total passers)
Native trained Number passing
NCLEX exam
Foreign trained Number passing
NCLEX exam
Percent foreign
trained (of total passers)
1990 68 325 7 017 9 40 407 2 113 5
1991 72 192 10 303 12 45 712 2 222 5
1992 81 788 9 668 11 48 460 1 790 4
1993 87 103 10 010 10 49 877 2 251 4
1994 98 920 11 016 10 45 242 1 642 4
1995/96 185 792 15 955 8 85 403 3 091 3
1997 87 836 5 016 5 41 055 1 183 3
1998 79 807 4 044 5 38 072 1 059 3
1999 75 360 4 702 6 35 417 990 3
2000 69 499 5 231 7 33 480 914 3
2001 68 561 6 682 9 33 448 1 097 3
2002 70 474 10 152 13 36 662 1 433 4
2003 75 821 12 870 15 42 723 1 717 4
2004 85 824 14 954 15 48 155 1 515 3
2005 98 363 14 750 13 51 158 1 276 2
2006 109 746 20 907 16 54 458 1 378 2 Source: National Council of State Boards of Nursing. Note: Newly licensed is estimated from NCSBN statistics of those who passed the NCLEX-RN. Actual licensure data come from each state and there is no central reporting mechanism across states.
Nurse Immigration Requirements
22. The U.S. has stringent requirements for licensing nurses compared with most other countries, and requires all domestic and international nurses to pass the NCLEX-RN or NCLEX-PN examination for licensure to practice. As a point of comparison, the U.K. does not have a licensure examination and credentials reviews are conducted by employers.
23. The Appendix provides information on visa requirements and types. In brief, a VisaScreenTM certificate must be received before the U.S. Citizenship and Immigration Services will issue an occupational visa. To obtain the certificate the following are required: a credentials review of the applicant’s professional nursing education and licensure to ensure comparability to U.S. requirements, a major one being that nursing education must have been at the post-secondary school level; successful completion of required English language proficiency examinations; and successful completion of either the Commission on Graduates of Foreign Nursing Schools (CGFNS) Qualifying Examination or the NCLEX-RN examination.
24. CGFNS has a comprehensive program of services for foreign educated nurses designed to help ensure safety in patient care, facilitate the application process for graduates of foreign nursing schools who wish to immigrate to the U.S., and to reduce the risk of failure to qualify to practice as a RN after travel to

DELSA/ELSA/WP2/HEA(2008)2
23
the U.S. (Davis and Nichols, 2002). CGFNS undertakes the required credentials review and offers tests of nursing knowledge and English proficiency. CGFNS offers its nursing knowledge examination in many locations throughout the world; the exam provides nurses interested in migrating to the U.S. a good indicator of their likelihood of passing the required licensure exam (NCLEX-RN), which until 2005 was offered only in the United States. The CGFNS exam does not substitute for the NCLEX-RN which must be passed to obtain licensure. The CGFNS exam was originally developed to save nurses the expense of coming to the U.S. to take the NCLEX-RN and to help reduce the possibility that nurses would migrate and then not be able to qualify for licensure. The NCLEX-RN was offered for the first time in 2005 in 3 sites outside the U.S.: London, Hong Kong, and Seoul. As of 2007, NCLEX-RN test sites include: London, England; Hong Kong; Sydney, Australia; Toronto, Montreal, and Vancouver, Canada; Frankfurt, Germany; Mumbai, New Delhi, Hyderabad, Bangalore, and Chennai, India; Mexico City, Mexico; Taipei, Taiwan; Manila, Philippines; and Chiyoda-ku and Yokohama, Japan. With easier international access to the NCLEX exam, use of the CGFNS exam will undoubtedly decline although in most states CGFNS remains the sole provider of required credentials review for visas.
Trade agreements
25. The North American Free Trade Agreement (NAFTA) facilitated the immigration of Canadian nurses to the U.S. However, contrary to expectations, NAFTA has not substantially influenced immigration of nurses from Mexico. Most nursing education in Mexico takes place at the secondary-school level which does not meet U.S. requirements for licensure. English language proficiency is another barrier. A total of 77 Mexican nurses took the NCLEX-RN exam for the first time in 2003 and the pass rate was 17% compared to 2 126 Canadian nurses who had a pass rate of 75% (National Council of State Boards of Nursing [NCSBN]). The potential exists for broad trade agreements in the future to impact on nurse migration to the U.S. but for now there are no examples other than NAFTA.
Table 8. Percentage of foreign born persons trained as professional nurses by current occupation, 2003
Current Occupation Percent RN 60.2 Non-RN 21.0 - Nursing, psychiatric, or home health aides 13.3 - Medical assistant & other health care support 1.1 - Personal & health care aides 1.1 - Waiter/waitress 1.1 - Motor vehicle operator 0.6 - Legal support worker 0.6 - Dental assistant 0.6 - Stock clerk & order filler 0.6 - Office & adminstrative support 0.6 - Laundry & dry cleaning 0.6 - Other 1.1 Missing data 18.8
Notes: Data collected May - November 2003. Data drawn from new immigrants who reported having an academic degree in nursing (associate, bachelor, or higher).
Source: The New Immigrant Survey, with sample of 181 nurses, http://nis.princeton.edu/overview.html
26. It is difficult to estimate the number of foreign educated nurses who immigrate to the U.S. but work in lower skill level occupations. The programs of the Commission on Graduates of Foreign Nursing Schools (CGFNS) are designed to discourage nurses with poor chances of qualifying for licensure from traveling to the U.S. with the expectation of practicing as RNs. However data from a targeted survey of new immigrants undertaken in 2003 revealed that a substantial share of persons who have completed

DELSA/ELSA/WP2/HEA(2008)2
24
professional nurse education in another country are working in the U.S. at occupations that would be considered less skilled than RNs. As noted in Table 8, at least 21% of nurse respondents in the New Immigrant Survey reported working at lower skill level occupations. Most of the respondents not working as nurses worked as nursing, psychiatric, or home health aides. This study should be interpreted with caution since only 181 respondents from the larger study of new immigrants were educated as nurses.
Data sources on nurse migration:
27. There is no ideal source of information on nurse immigration to the U.S. and thus this paper relies on multiple sources, each with some limitations (see Aiken, 2007). The 4 main data sources are: the National Sample Survey of Registered Nurses (NSSRN), the U.S. Population Census; the NCSBN, and the U.S. Department of Homeland Security. Immigration statistics reported by the U.S. Department of Homeland Security do not include complete information on occupational status except for those entering the U.S. on an occupational visa. Many nurses enter the country on other types of visas, for example as family members or students, and thus Department of Homeland Security statistics significantly underestimate the number of foreign educated nurses entering the U.S.
28. The National Sample Survey of Registered Nurses (NSSRN), a national probability sample (of 35 724 registered nurses in 2004) drawn from 50 states and the District of Columbia (USDHHS, 2006), has the greatest detail on foreign educated nurses residing in the U.S. The survey has been conducted every four years since 1977. The 2004 NSSRN estimated that 3.5% of RNs in the U.S., or 100 791 registered nurses, were trained abroad (Xu and Kwak, 2005).
29. The U.S. Population Census, conducted every 10 years, is another source of information on foreign nurses. Its major limitation is the absence of data on country in which professional education took place. Analyses of the 2000 U.S. Population Census (1% Public Use Data file) reveal over 300 000 foreign born registered nurses. We advocate deleting foreign born nurses who immigrated before age 22 as a practical way to estimate from Census data the number of nurses trained abroad. Those immigrating as children presumably obtained their nursing education in the U.S. Using this analytic strategy, Census data suggest that close to 218 000 nurses in the U.S., or about 8% of current stock, are likely to have been educated abroad (Aiken, 2007). We believe that Census data is the most reliable source for estimating foreign educated nurses in the stock of current nurses.
30. The NSSRN provides a richer array of data on foreign-educated nurses. However compared to Census data, the NSSRN appears to significantly underestimate the number of foreign educated nurses in the U.S. For example, the NSSRN finds little change in the number of foreign educated nurses between 2000 and 2004 despite evidence from the NCSBN of more than a tripling of the number of foreign educated nurses who passed the licensing exam over that period, most of whom presumably immigrated. The undercount of foreign educated nurses in NSSRN may result from the geographic concentration of foreign educated nurses in five states, as noted in Figure 5 as well as possibly the greater reluctance of immigrants to respond to surveys.

DELSA/ELSA/WP2/HEA(2008)2
25
Figure 5: Distribution of Foreign Born RNs by Density by State, 2000
Note: Density of foreign born RNs calculated as number of foreign born nurses as a percent of total RNs in each state.
Source: US Census, 1% public use sample.
31. The NCSBN reports on an annual basis the number of nurses taking and passing the licensing exam (NCLEX-RN) by country of nursing education. The NCSBN data provide proxy measures of immigration potential (numbers taking the test the first time) and of the number of new foreign educated nurses entering the U.S. (numbers passing the exam) Licenses to practice nursing are issued by the states, however, and NCSBN does not have a complete listing of newly licensed foreign educated nurses from every state. The actual number of nurses immigrating is less by an unknown amount than the number passing the exam.
Source countries and distribution
32. The U.S. is the destination of choice for many migrating nurses from both developed and lower income countries because of high wages, opportunities to pursue additional education, and a high standard of living (Kingma, 2006). The prolonged nurse shortage in the U.S. and the large shortage projected for the future have motivated more nurse recruitment abroad by hospital employers and commercial recruiting firms (Brush, Sochalski, & Berger, 2004). Almost 34 000 foreign educated nurses took the NCLEX-RN registered nurse license exam in 2005 (44% passed), suggesting a great deal of interest among foreign educated nurses in working in the U.S. (National Council of State Boards of Nursing).
33. Close to a third of the estimated 218 720 foreign educated nurses in the U.S. are from the Philippines. The second most important source region for foreign born nurses is the Caribbean and Latin America which has contributed almost 50 000 nurses. Western developed countries including Canada, Western Europe, Australia and New Zealand rank third with a total of almost 33 000 nurses (see Table 9).

DELSA/ELSA/WP2/HEA(2008)2
26
Table 9. Foreign educated nurses by region of birth
RN LPN
Number Percent Number Percent
Western Europe, Canada, Australia and NZ 35 758 17 3 405 9
Former Soviet Bloc 8 192 4 1 901 5
India 13 407 6 1 596 4
Philippines 76 095 35 6 772 17
Other Asia 26 575 12 4 029 10
Caribbean and Latin America 39 873 18 16 748 43
Sub-Saharan Africa 14 910 7 4 369 11
Other 1 068 0 352 1
Total 215 878 100 39 172 100
Percent of total US* 7 4 *total RNs = 3103981; total LPNs = 902154.
Note: Because the 2000 US Census did not identify place of education, the number educated outside of the US was estimated by subtracting those immigrating to the US before age 22 from the number of foreign born.
34. Numbers of nurses passing the NCLEX-RN is used as a proxy for the number of new nurses licensed and to estimate nurse immigration. The pass rate for first time NCLEX-RN test takers is also important as it suggests the relative difficulty of migration by country and possibly is a reflection of the comparability of education and/or English language comprehension of nurses from various countries. The first time pass rate for U.S. nurses in 1995 was 87%. The Philippines continues to contribute more nurses than any other source country, although almost half fail to pass the NCLEX-RN the first time. This relatively low pass rate has been consistent for Philippine test takers and is not a new phenomenon that might be attributed to the rapid growth in nursing schools in the Philippines. The Philippines is a small country with a limited labor pool. The demand on the Philippines from multiple developed countries may be too great to expect immigration to the U.S. to continue to grow at rates of years past (Lorenzo, Galvez-Tan, Icamina, & Javier, 2007). Three other countries currently contribute over 1 000 nurses a year: India, South Korea, and Canada. The remaining source countries, even among the top 10, contribute less than 300 a year. Nigeria is the only sub-Saharan African country among the top 10 source countries for the U.S.
35. The steady growth of India and South Korea as source countries for U.S. nurses can be expected to continue. India is the major source country for U.S. foreign educated physicians (Mullan, 2005), and given its very large labor pool and English-speaking population could potentially ellipse the Philippines in the future as the major source country for U.S. nurses (Khadria, 2007). China has a huge population base but to date not many nursing schools in China are producing nurses that meet international educational standards and are fluent in English (Fang, 2007).
36. Figure 5 shows the uneven distribution of foreign educated nurses by state. California, New York, New Jersey, Florida, and Illinois have the highest density of foreign educated nurses, with foreign educated nurses comprising as much as 29% of the nurse workforce in California and 24% in Florida. These states all report acute shortages of nurses, particularly in hospitals. Both California and Florida have particularly low nurse to population ratios. California’s shortage has been exacerbated by enactment of legislation that took effect 1 January 2004, mandating minimum licensed nurse staffing ratios in all hospitals. Nurse workloads cannot exceed 5 patients per nurse on medical and surgical units and 2 in ICUs (Coffman, Seago, & Spetz, 2002). Foreign educated nurses are less likely to reside in rural areas than are native born nurses and much more likely to reside in central city locations. Less than 2% of foreign

DELSA/ELSA/WP2/HEA(2008)2
27
educated nurses reside outside of metropolitan areas compared to 18% of native born nurses (Aiken, 2007).
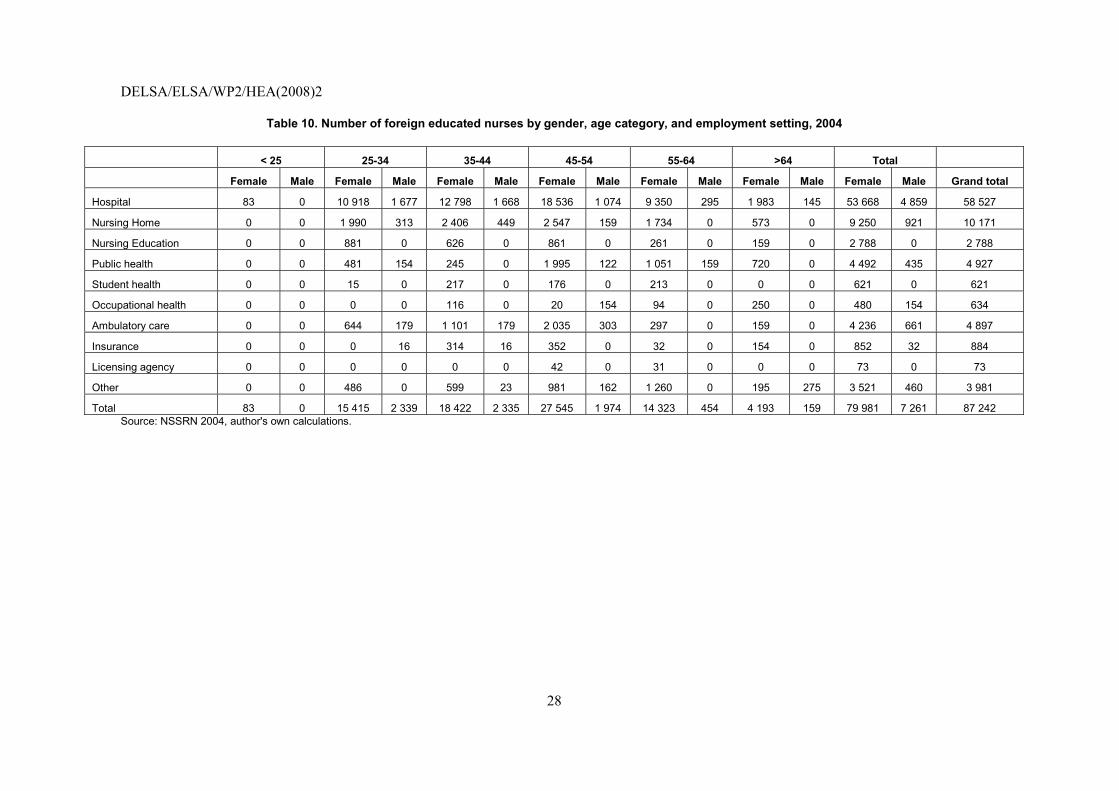
37. Almost 72% of foreign educated RNs work in hospitals compared to 59% of native born nurses. An estimated 15 000 foreign educated registered nurses work in nursing homes and extended care. New foreign educated nurses are 3 times more likely to work in nursing homes than new U.S. graduates (Polsky, et al., 2007) but from the perspective of the overall stock of nurses, foreign educated nurses are only slightly more likely to practice in nursing homes and extended care (9% vs. 7%) than native born registered nurses (Aiken, 2007). Foreign educated LPNs are significantly more likely to work in nursing homes than foreign educated RNs. Foreign educated nurses are distributed across clinical specialties much like native born nurses except for their higher presence in intensive care. Foreign educated nurses are no more likely to practice in psychiatry, for example, than native born nurses and less likely to be employed in primary care. See Table 10 for data on foreign-educated nurses by gender, age, and employment setting.
DELSA/ELSA/WP2/HEA(2008)2
28
Table 10. Number of foreign educated nurses by gender, age category, and employment setting, 2004
< 25 25-34 35-44 45-54 55-64 >64 Total
Female Male Female Male Female Male Female Male Female Male Female Male Female Male Grand total
Hospital 83 0 10 918 1 677 12 798 1 668 18 536 1 074 9 350 295 1 983 145 53 668 4 859 58 527
Nursing Home 0 0 1 990 313 2 406 449 2 547 159 1 734 0 573 0 9 250 921 10 171
Nursing Education 0 0 881 0 626 0 861 0 261 0 159 0 2 788 0 2 788
Public health 0 0 481 154 245 0 1 995 122 1 051 159 720 0 4 492 435 4 927
Student health 0 0 15 0 217 0 176 0 213 0 0 0 621 0 621
Occupational health 0 0 0 0 116 0 20 154 94 0 250 0 480 154 634
Ambulatory care 0 0 644 179 1 101 179 2 035 303 297 0 159 0 4 236 661 4 897
Insurance 0 0 0 16 314 16 352 0 32 0 154 0 852 32 884
Licensing agency 0 0 0 0 0 0 42 0 31 0 0 0 73 0 73
Other 0 0 486 0 599 23 981 162 1 260 0 195 275 3 521 460 3 981
Total 83 0 15 415 2 339 18 422 2 335 27 545 1 974 14 323 454 4 193 159 79 981 7 261 87 242 Source: NSSRN 2004, author's own calculations.

DELSA/ELSA/WP2/HEA(2008)2
29
38. Ninety percent of U.S. nurses are white; blacks and Hispanics are under-represented in relation to their proportion of the U.S. population. Foreign educated nurses are less likely to be white than native born nurses, but not much more likely to be black or Hispanic (Aiken, 2007). The major difference in ethnicity between native and foreign educated nurses is that half of all foreign educated nurses are Asian compared to 1% of native born nurses. Thus, while nurse immigration contributes somewhat to ethnic and cultural diversity of the U.S. nurse workforce, it does not contribute substantially to having more black and Hispanic nurses, the major under-represented minorities.
Nurse migration and nurse shortage:
39. Recruitment from abroad is one strategy to ameliorate the U.S. nurse shortage. However there is no overarching national policy regarding nurse migration or solutions for the nurse shortage. There are no designated visas for nurses; they must enter under the overall policies governing all visas. From time to time, interest groups are successful in lobbying the Congress for small dispensations for nurses, such as the H-1C temporary visa for nurses employed by hospitals in health professions shortage areas, limited to 500 visas a year for about 14 rural hospitals designated by statute (see the Appendix). In 2005, interest groups convinced Congress to “recapture” 50 000 unused immigrant visas and reprogram them for use by designated countries—Philippines, India, China, Mexico—for nurses and physical therapists. These recaptured visas were almost immediately used but a minority went to medical personnel and the rest to their family members (on average, 2.5 green cards are issued for every applicant meeting employment requirements). Debate about legislative provisions directed toward nurse immigration and other priority employment categories is currently mired in contentious national debate about undocumented workers and illegal immigration.
40. Despite visa restrictions and other barriers to immigration, nurses are immigrating in significant numbers. A large commercial infrastructure of immigration specialists, lawyers, and recruiters has developed in response to employer demand for nurses and a willing supply of nurses educated abroad. However, the size of the projected shortage of nurses in the U.S. reported in Table 11 is too large to address primarily through nurse immigration. The order of magnitude of nurse migration would be much greater than would be feasible from a U.S. immigration policy perspective given the many other employment needs of the country. Additionally, recruiting hundreds of thousands of nurses from other countries would create severe nurse global shortages. While nurse immigration is likely to remain part of the U.S. workforce configuration in the future, it cannot be a primary solution to the country’s long-term projected nurse shortage. The solutions involve increasing the supply of domestic nurses primarily by expanding educational capacity and moderating demand, which will be discussed subsequently.
Table 11. Projections of US RN supply, demand, and shortages, 2010-2020
2010 2015 2020
Supply 1 941 200 1 886 100 1 808 000
Demand 2 347 000 2 569 800 2 824 900
Shortage 405 800 683 700 1 016 900 Source: Bureau of Health Professions, Health Resources and Services Administration, What is Behind HRSA's Projected Supply, Demand, and Shortage of Registered Nurses? September 2004.

DELSA/ELSA/WP2/HEA(2008)2
30
NURSE STOCK OUTFLOWS
Emigration
41. U.S. nurses do not emigrate to other countries in substantial numbers or permanently. In the past, Saudi Arabia was the dominant temporary destination for a small number of U.S. nurses but that trend has reportedly declined since the U.S. military engagement in Iraq. Emigration is a non factor in the supply of nurses in the U.S.
Inactivity
42. Inactivity is relatively low among U.S. nurses considering that the workforce is predominantly women. As noted earlier, only 17% of the licensed RN workforce was not working in nursing in 2004, though this still represents a large number of close to 488 000 RNs. As noted earlier, almost 40% of inactive nurses still holding active licenses were 60 years of age or above, and thus probably represent nurses who have retired. Many states do not require nurses to meet practice or continuing education requirements for licensure renewal and thus a substantial share of licensed nurses are for all intents and purposes retired. An additional 24% of licensed but inactive nurses (numbering about 121 000) are employed in non-nursing roles ranging from administration/management to retail sales to pharmaceutical and durable medical supply services (US Department of Health and Human Services, 2006). Over time the percent of inactivity has varied some but has not exceeded a maximum of 22%. Little is known about how many nurses who were ever educated as nurses no longer maintain their licenses.
Retirements
43. The major source of outflow is retirements, which will be significant over the next decade with the aging of the nurse workforce (Buerhaus, Staiger, & Auerbach, 2000). The average age of registered nurses was 46.8 years in 2004, and has been increasing steadily since 1980 (US Department of Health and Human Services, 2006). Retirements will be a particular challenge for hospitals where 45% of employed RNs were at least 50 years old in 2006 and only 12% were 34 years of age or younger (Buerhaus, Donelan, Ulrich, DesRoches, & Dittus, 2007). Analyses by the Bureau of Labor Statistics show that beginning at age 50, nurses begin to leave the work force in large numbers, usually permanently. Permanent retirement rates by age are estimated to be 17% for those ages 50-54, 29% for those ages 55-50, and 60% for those ages 60-64. Some 478 000 nurses can be expected to retire between 2002 and 2012 (US Department of Labor, [DOL] 2005).
DELSA/ELSA/WP2/HEA(2008)2
31
DEMAND
New job creation
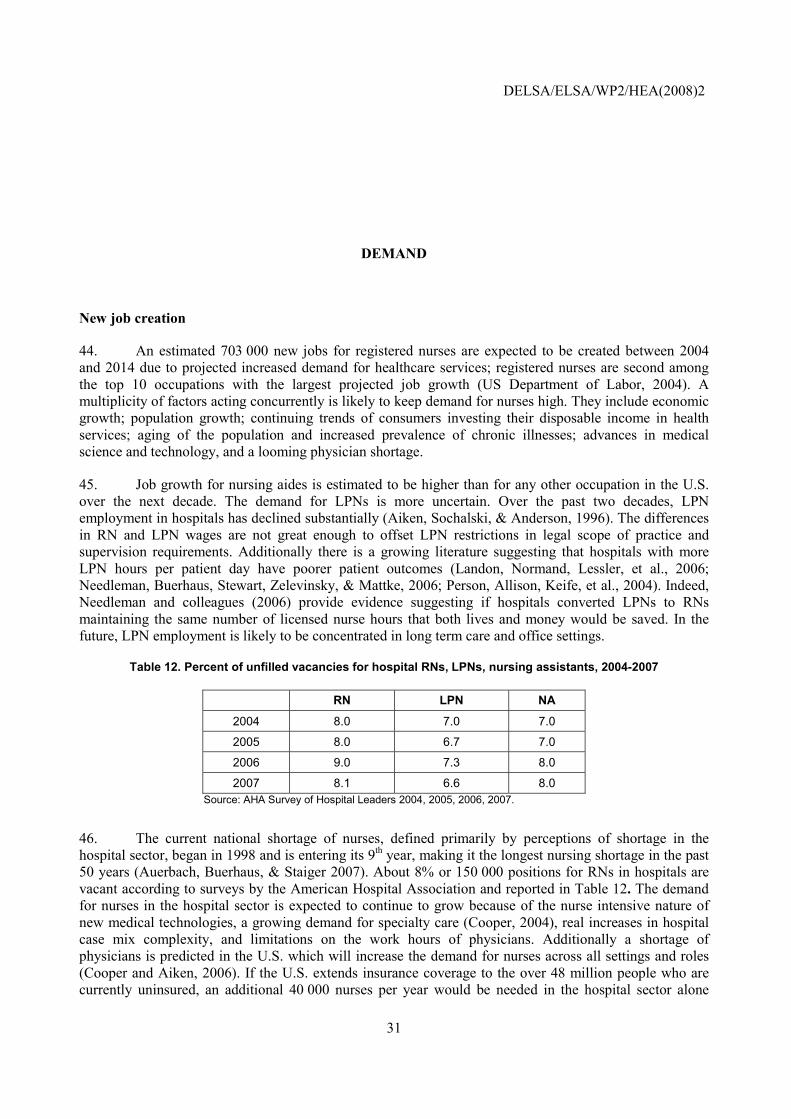
44. An estimated 703 000 new jobs for registered nurses are expected to be created between 2004 and 2014 due to projected increased demand for healthcare services; registered nurses are second among the top 10 occupations with the largest projected job growth (US Department of Labor, 2004). A multiplicity of factors acting concurrently is likely to keep demand for nurses high. They include economic growth; population growth; continuing trends of consumers investing their disposable income in health services; aging of the population and increased prevalence of chronic illnesses; advances in medical science and technology, and a looming physician shortage.
45. Job growth for nursing aides is estimated to be higher than for any other occupation in the U.S. over the next decade. The demand for LPNs is more uncertain. Over the past two decades, LPN employment in hospitals has declined substantially (Aiken, Sochalski, & Anderson, 1996). The differences in RN and LPN wages are not great enough to offset LPN restrictions in legal scope of practice and supervision requirements. Additionally there is a growing literature suggesting that hospitals with more LPN hours per patient day have poorer patient outcomes (Landon, Normand, Lessler, et al., 2006; Needleman, Buerhaus, Stewart, Zelevinsky, & Mattke, 2006; Person, Allison, Keife, et al., 2004). Indeed, Needleman and colleagues (2006) provide evidence suggesting if hospitals converted LPNs to RNs maintaining the same number of licensed nurse hours that both lives and money would be saved. In the future, LPN employment is likely to be concentrated in long term care and office settings.
Table 12. Percent of unfilled vacancies for hospital RNs, LPNs, nursing assistants, 2004-2007
RN LPN NA
2004 8.0 7.0 7.0
2005 8.0 6.7 7.0
2006 9.0 7.3 8.0
2007 8.1 6.6 8.0 Source: AHA Survey of Hospital Leaders 2004, 2005, 2006, 2007.
46. The current national shortage of nurses, defined primarily by perceptions of shortage in the hospital sector, began in 1998 and is entering its 9th year, making it the longest nursing shortage in the past 50 years (Auerbach, Buerhaus, & Staiger 2007). About 8% or 150 000 positions for RNs in hospitals are vacant according to surveys by the American Hospital Association and reported in Table 12. The demand for nurses in the hospital sector is expected to continue to grow because of the nurse intensive nature of new medical technologies, a growing demand for specialty care (Cooper, 2004), real increases in hospital case mix complexity, and limitations on the work hours of physicians. Additionally a shortage of physicians is predicted in the U.S. which will increase the demand for nurses across all settings and roles (Cooper and Aiken, 2006). If the U.S. extends insurance coverage to the over 48 million people who are currently uninsured, an additional 40 000 nurses per year would be needed in the hospital sector alone
DELSA/ELSA/WP2/HEA(2008)2
32
(Whelan, 2007).
47. The Health Resources and Services Administration (HRSA), a federal agency, estimated that the supply of RNs nationally fell approximately 111 000 short of demand in 2000 (5.5%) and projected the gap would widen in the future (see Table 11). HRSA has not updated the demand component of its model for a decade, giving rise to concerns by some that demand in the model is underestimated and thus the shortage could be even greater than projected. Others counter that the current shortage is easing in many parts of the country, perhaps a product of historically high graduation and immigration numbers, and thus the shortage in the out years may not be as big as predicted by HRSA (Auerbach, Buerhaus, & Staiger 2007; Government Accountability Office, 2007). All would agree that greater investment is required in all aspects of nursing workforce research including updated projection models of supply and demand balance over the next two decades.
48. One problematic area for nursing demand projections is long term care. There is greater “need” for long term care services now than is being met because of limited health insurance coverage. Given the aging of the population, both need and demand for long term care can be expected to grow. Currently nursing homes are experiencing a 15% vacancy rates for RNs, twice the rate of hospitals (National Commission on Nursing Workforce for Long-Term Care, 2005). The U.S. Department of Health and Human Services (2005) cites projections that the number of workers providing long-term care services (including nurses, aides, and personal care workers in institutional and home settings) will grow from 1.9 million to 2.7 million, a 45% increase between 2000 and 2010. At present, funding levels in nursing homes in the U.S. do not permit the employment of many RNs. For now and probably for the future, long term care will be provided primarily by nursing assistants, who make up the majority of current nursing home caregivers, supervised by LPNs and with only modest participation by registered nurses.

DELSA/ELSA/WP2/HEA(2008)2
33
SUMMARY AND CONCLUSIONS
49. Health care in the U.S. is predominantly private and decision-making is decentralized. Health policy at the national level is enacted indirectly through payment policies and rules for provider participation in the two large government-funded insurance programs, Medicare for the elderly and Medicaid for low income individuals and families. The dominant policy paradigm favors market-based strategies to address health and social services challenges. So while governments, federal and state, provide subsidies for health services and for the education of health professionals, coordinated national strategies on healthcare workforce issues are lacking. Healthcare workforce monitoring is under-funded and relegated to lower levels of the federal government distant from policy decision-making (Cooper and Aiken, 2006; Aiken, 2007).
50. Healthcare workforce policy has not been a high priority for leaders in the private sector either as evidenced by its absence from a list of the 10 top health policy priorities ranked by a poll of national health care experts (Commonwealth Fund, 2004). This is despite consensus among nurses, physicians, and chief executive officers in hospitals that a serious shortage of RNs exists (Buerhaus et al., 2007). This seeming paradox is explained best by the presumption that market forces will eventually revolve the problem of nurse shortage. Indeed, the Buerhaus survey shows that the vast majority hospital executives (94%) believe the current shortage will lead to higher pay for nurses. In the past nursing shortages in the U.S. have responded to market factors and have been self-correcting (Aiken and Mullinix, 1987). However the current shortage is of long duration, over 12 years. The factors promoting increased demand seem unalterable over the long run. And there is market failure in nursing education represented by long waiting lists of applicants that cannot be accommodated because of a shortage of educational capacity including a faculty shortage. A few private for-profit nursing schools have developed in the Caribbean and a small number of new hospital diploma programs have opened but thus far the market response in education has not produced a large number of new nursing programs. The shortage of nurse faculty is one explanation. Another might be that potential applicants to nursing schools are predominantly women who tend to be less open to geographic relocation for education. As noted previously, the shortage of nurse faculty is associated with too few nurses being educated at the baccalaureate degree levels and beyond to meet the increased demand for advanced practice nurses in clinical care as well as faculty. Issues of health care financing and cost containment dominant the agendas of healthcare organizations and government leaving limited opportunity to seriously debate issues such as nurse and doctor shortages.
51. Increasingly in the absence of leadership at the federal government level on healthcare workforce shortages, states have become more actively involved in workforce research, planning, and policy. A number of states have established nursing workforce centers and some have increased state subsidies to nursing education. However, state efforts cannot substitute for the absence of national workforce monitoring and coordinated efforts to address projected future shortages using the full complement of options open to the federal government including immigration. Thus at least in the near term what can be expected is more of the same, namely reliance on market forces to blunt the shortage and incremental policy approaches like the Nurse Reinvestment Act which provides modest increases in federal support to nursing education, small changes in immigration that favor nurse employers, and modest state initiatives to increase nurse supply and educational capacity.

DELSA/ELSA/WP2/HEA(2008)2
34
Options for responding to nurse shortages
52. Despite the current lack of public will to take major steps to address the nurse shortage, if the shortage worsens a broader coalition of stakeholders could form to force a public policy response. The link between nursing shortage and patient safety and quality of care has increasingly been documented by research and the evidence may eventually become so strong that it cannot be ignored (Aiken, Clarke, Sochalski, & Silber, 2002; Needleman, Buerhaus, Mattke, Stewart, & Zelevinsky, 2002; IOM 2004). A significant nurse shortage would dampen expansion of health services which is a major source of revenue for local communities thus threatening local economies. A nurse shortage imperils the nation’s emergency response capability for epidemics, natural disasters, terrorist attacks, and military engagements now that the armed services medical capabilities are more dependent upon the civilian healthcare workforce.
53. Thus it is prudent to lay out an agenda for addressing the shortage. Five inter-related foci for research and intervention warrant consideration: 1) establishment of a an improved federal capacity to monitor changes in national and regional nurse labor market dynamics including nurse immigration which will make this information publicly available in a timely fashion; 2) moving towards greater self-sufficiency by increasing graduations from domestic nursing schools; 3) diminishing the rate of growth in demand for nurses by improving retention, achieving greater productivity, and addressing the shortage of physicians; 4) managing nurse migration; and 5) achieving a more coherent policy approach to the inclusion of nurse workforce development in foreign aid.
Monitoring nurse workforce trends:
54. Relatively modest changes in existing national databases could vastly improve monitoring of nurse workforce trends. Some of these include adding country of professional education in the U.S. census; extending the data sharing compact of the National Council of State Boards of Nursing to include annual licensure information from every state; adding a short standardized questionnaire required for nurse licensure renewal in every state and made into an annual public use file; more timely release of data from the National Sample Survey of RNs; more comprehensive data on immigrants including their occupations, place of professional education, and migration history. U.S. data on nurse immigration is not only important for its information on the U.S. nurse population and inflows but it also provides one of the few sources of information to monitor loss of nurses from other countries, particularly developing countries that have little information on their workforce (Pittman, Aiken, & Buchan, 2007). In addition to improving data sources, more public funding should be made available to support timely statistical analyses of workforce trends both within federal and state governments and by independent scholars.
Nurse Workforce Self-sufficiency:
55. The U.S. has the capacity in terms of human and economic resources to become largely self-sufficient in its nurse workforce. There are large numbers of Americans who want to become nurses, thousands more than can be accommodated by nursing schools because of faculty shortages and other capacity limitations. The U.S. has a large enough labor pool and enough resources to expand higher education to increase nurse supply. Moreover, greater representation in nursing by blacks, Hispanics, and men could be achieved by expanding nursing school capacity at a time when the applicant pool is strong.
56. Expanding nurse supply is in the interest of nurse employers. Indeed, hospitals, the major employers of nurses, have been making significant investments in nurse education through tuition support in exchange for work commitments for new graduates, facilitating access to education for their nurse employees, providing space in their facilities for nursing education, and enabling their employed nurses with graduate education to serve as clinical faculty for nursing schools (Cheung and Aiken, 2006). However, hospitals are unlikely increase their support of nursing education substantially beyond current

DELSA/ELSA/WP2/HEA(2008)2
35
levels without provisions to include these costs in reimbursement rates. The State of Maryland is currently implementing such an initiative. The State’s Health Services Cost Review Commission increased hospital rates by a tenth of one percent, raising about $100 million over 10 years to be used in solving the hospital nursing shortage by investing in the expansion of nursing faculty and nursing school enrollments.
57. Investments of hospitals in nursing education have helped nursing schools expand enrollments substantially over the past five years resulting in the highest number of new nurse graduates ever at over 100 000 a year. However, most estimates suggest that increases in enrollments will have to be considerably higher, probably at least 25% higher, to avert the nurse shortage projected to occur in a decade when increasing demand collides with increasing retirements of an aging nurse workforce (American Association of Colleges of Nursing, 2005). Title VIII funding under the Public Health Service Act (which includes funding from the recent Nurse Reinvestment Act) provides an annual federal appropriation ($149.68 million in FY 2006) for nurse workforce development programs including advanced practice nurse training (i.e. nurse practitioners, nurse anesthetists, nurse administrators); grant support to increase nursing workforce diversity and improve retention; and loan repayment and scholarship funds. These funds were only modestly increased by the Nurse Reinvestment Act passed in 2002 as a response to the nursing shortage. In 2004, 82% of applicants for the loan repayment program and 98% of the applicants for scholarships were turned away due to insufficient funding (American Association of Colleges of Nursing 2005). The federal Nurse Training Act in 1974 is credited with increasing the nation’s nurse to population ratio (Eastaugh, 1985). In today’s dollars, a comparable investment would require over $500 million a year in addition to existing funding levels for Title VIII, including targeted distribution of the funds to BSN and graduate level nursing education, where the greatest shortage exists. While this represents a significant investment in new funding, it is insignificant as a percent of federal health expenditures.
58. Times of nurse shortage tend to lead to calls for shortened education for nurses. However, there is ample evidence that a more educated nurse workforce is associated with better patient outcomes and higher nurse productivity (Aiken, Clarke, Cheung, Sloane, & Silber, 2003; Estabrooks, Midodzi, Cummings, Ricker, & Giovannetti, 2005). Nursing education in the U.S. is lagging behind the global trend to set baccalaureate education as the international standard for professional nursing because of decentralized health policy decision-making processes including having licensure authority vested in 50 different state governments. Innovations in nursing education have created options to produce nurses with a baccalaureate degree in about one year for students who hold a baccalaureate or higher degree in another field. Indeed these accelerated programs are among the most popular in nursing schools today, and speak to the high level of interest of Americans in becoming nurses. In many states the length of associate degree programs has increased to three years or more to meet the requirements for practice thus reducing the difference in the time it takes to produce nurses with associate versus baccalaureate degrees. Nursing schools need incentives to create more efficient educational pathways that will permit the extensive network of community colleges to participate in baccalaureate nursing education thus producing a larger cadre of nurses with baccalaureate degrees.
59. An impending shortage of physicians in the U.S. has important consequences for the nurse shortage as the boundaries between physician and nurse practice overlap considerably (Cooper and Aiken, 2006). The overlap was demonstrated well when employment of advanced practice nurses by hospitals increased immediately upon implementation of the 80 hour work week limit for resident physicians. The shortage of specialist physicians will result in generalists focusing on complex patients and advanced practice nurses—nurse practitioners, clinical nurse specialists, nurse midwives, and nurse anesthetists—taking more responsibility for routine primary care and chronic disease management. Because the physician and nurse shortages are interdependent, it is imperative that both are addressed simultaneously.

DELSA/ELSA/WP2/HEA(2008)2
36
Improving retention and increasing productivity
60. The cost of nurse turnover is high, particularly in hospitals and nursing homes Additionally more nurses are opting to work in jobs outside of hospitals and nursing homes, and in non-clinical roles. A substantial body of research links poor work environments with nurse job dissatisfaction, burnout, turnover, and increased costs (Aiken et al. 2002; Vahey, Aiken, Sloane, Clarke, & Vargas, 2004; Waldman, Kelly, Arora, & Smith, 2004). Every blue ribbon expert committee convened over the past 25 years to make recommendations on how to solve the U.S. nursing shortage recommended modifications in nurses’ practice environments to retain nurses in clinical roles and facilitate their productivity (American Hospital Association 2002; Kimball and O’Neill 2002; Joint Commission, 2002; Steinbrook, 2002). Organizational modifications that research suggests would improve nurse retention in clinical care roles include:
• A qualified chief executive officer who is an integral part of top management decision-making which improves institutional response to problems nurses identify at the bedside;
• A flat organizational structure and decentralized decision-making at the unit level on clinical policies and procedures as well as human resources policies and practices;
• Flexible scheduling and part-time work options;
• Greater professional autonomy to make clinical decisions within nurses’ legal scope of practice;
• Improved ancillary support services for nurses including the timely provision of supplies and equipment in working order to reduce the time nurses spend away from patients;
• Mentoring or residency programs, often a year in length, for new graduates to facilitate skill acquisition, management of work and people, and integration into the organization;
• Investment in nurses’ continuing education including specialty certification, advanced degrees, and management education;
• Keeping nurses engaged and challenged in their jobs over the long term by allowing them to rotate to new clinical areas or responsibilities; options for safely “floating” to a variety of units or moving within the system to other institutional settings without adversely affecting their seniority, providing sabbaticals for learning new skills and knowledge, serving as mentors to less expert nurses, opportunities for research and extramural professional activities.
61. Additional initiatives to improve retention of older nurses and to attract inactive nurses back to the workforce include:
• Changing the physical environment to make the job of nursing physically less demanding by deploying lift teams and lift devices to move patients and reducing distances nurses walk to care for patients;
• Improved retirement benefits;
• Phased retirement including a shorter work week with full time benefits, preference of work shifts, optional break in service (some hospitals are experimenting with 6 week break);
• Rewarding experience and loyalty by creating incentives and rewards for long-term employees

DELSA/ELSA/WP2/HEA(2008)2
37
and for nurses to work beyond retirement;
• Accessible refresher courses to attract inactive nurses back to the workforce.
62. The number of hospitals that have achieved or are applying for Magnet Recognition for organizational excellence in nursing services administration suggests that positive change in nurse work environments is occurring (Aiken, 2002). Ultimately the long term solution to the projected future shortage of nurses is to redesign work, particularly in hospitals, to enable nurses to be more productive in their care of patients (Joint Commission, 2005). Improving work environments is largely a private sector agenda in the U.S. rather than a public policy initiative. The recent federal Nurse Reinvestment Act and some state initiatives include small amounts of funding for competitive grant applications to improve nurses’ work environments through pilot demonstrations of promising innovations, like the ones listed above, to improve nurse retention and to attract inactive nurses back to work. However, there are no comprehensive federal or state policies to explicitly improve nurse retention or to motivate nurses to return to active practice.
Managed Nurse Migration
63. The projected size of the long-term nurse shortage in the U.S. is too large to be resolved through recruitment of nurses from other countries. The immense global demand for nurses from the Philippines has greatly diminished access to and quality care of care there (Lorenzo, Galvez-Tan, Icamina & Javier, 2007). To place the projected shortage of 800 000 nurses in perspective, Canada currently has a nurse workforce of fewer than 250 000 nurses and a projected shortage of 100 000 (Little, 2007). India and China both have large overall workforces and the potential to produce nurses for export, but have a low density of nurses relative to their population and illness burden (Chen and Evans, 2004). Moreover the majority of nurses in India and China would not meet U.S. nurse educational standards. Thus the most likely nurses to emigrate from countries with developing economies like India, China, and sub-Saharan Africa would be the highest educated nurses, who if they stayed in their native countries, would provide leadership in practice and faculty in schools to produce more nurses. Activities by private entrepreneurs to produce more nurses abroad for export to the U.S. can be expected. The potential inflow of private funding for nursing education for the purposes of international recruitment could be beneficial if managed in a way that would benefit the source and destination countries as well as the migrant nurses. Thus international nurse recruitment is likely to be part a larger solution to the U.S. nursing shortage but will fail to substantially ameliorate the future shortage without concurrent increases in graduations from domestic nursing schools.
64. At present there is little “management” of international nurse recruitment that would ideally include provisions to balance the rights of individual nurse migrants and their families, the interests of their countries of origin, patient concerns about quality and communication, and employers’ needs. There is no coherent nurse immigration policy. Nurses must navigate a complex immigration system and there is no relationship between the number of nurses admitted on temporary work or permanent employment-based visas and national need. The federal government does not negotiate agreements with other countries regarding nurse migration or set ethical standards as the U.K. has done to govern employment of international nurse graduates in the National Health Service (Buchan, 2007). Given the largely private nature of healthcare in the U.S., the development and implementation of ethical and quality standards for international nurse recruitment rests primarily with firms that import nurses and the organizations that employ them. The federal government has not exercised much oversight in employment conditions of international nurse graduates except in general employment laws that, for example, prevent discrimination in wages. The Joint Commission (JC), the primary hospital accreditation organization in the U.S., sets and enforces quality standards in hospitals that employ international nurses and has a voluntary program of accreditation for supplemental staffing firms that are involved in international recruitment. Nursing education accreditation bodies could play more central roles in the oversight of educational programs

DELSA/ELSA/WP2/HEA(2008)2
38
preparing nurses for export to the U.S., especially those involving American nursing schools. In summary there has been insufficient attention given to managing ethical and quality concerns pertaining to the use of international workers in healthcare.
Foreign aid and immigration policies
65. Employers, professional associations, and other stakeholders with interests in having an adequate supply of nurses in the future should work together with the federal government to promote more coherence between international development/foreign aid and immigration policies. With modest, targeted investments, U.S. foreign aid funds could have a substantial impact on expanding the capacity of low income countries with high illness burden to increase their production of nurses and improve nurse retention. The focus should be on developing a self-sustaining nursing educational infrastructure with capacity to produce nurse leaders and faculty, as well as clinical nurses. U.S. university nursing faculty could be of assistance in the developmental phases if funding was available to support faculty exchanges. Currently, the healthcare workforce receives little attention or funding in existing programs of international aid despite the centrality of nursing to a number of international aid goals. Nursing is key to addressing the epidemics of HIV, malaria, and tuberculosis, for providing surveillance for emerging infectious diseases that pose health risks to all countries, for improving maternal and infant outcomes that are so important to economic development and growth, and for improving quality and safety of healthcare.
66. Research suggests that the differentials in wages between low income source and high income destination countries are so large that small increases in source country wages do not affect migration. Thus non-wage interventions in source countries are likely to be more successful in retaining nurses (Vujicic, Zurn, Kiallo, Adams, & Poz, 2004). Creating safer and more rewarding professional nurse roles and settings in source countries could be very important in stemming the flight of nurses. Initiatives are needed to find ways to make professional nursing more attractive in source countries.
67. A recently completed demonstration supported by the United States Agency for International Development involving “twinning” is an exemplar worthy of replication (Aiken 2005). The Nursing Quality Improvement Program paired U.S. hospitals that had been accredited for nursing excellence in the Magnet Recognition Program with hospitals in Russia and Armenia, countries that have historically underinvested in professional nursing. Over a 3 year period involving the exchange of nurses and hospital managers between the countries, the professional roles of nurses in the participating Russian and Armenian hospitals expanded, nurses were more satisfied with their jobs, patients were more satisfied with their care, and adverse patient outcomes were reduced. This model needs to be replicated in countries experiencing more nurse emigration to know whether increased job satisfaction would translate into greater retention within source countries. This model and others like it are worthy of investment by the U.S. and other developed countries as a strategy to reduce the “push” factors associated with the lack of professional roles and opportunities for nurses in low income countries.
68. The U.S. clearly plays an important role in global nurse migration because of the size of its nurse workforce and its ever growing demand for more nurses. The size of its projected future shortage of nurses, if not contained by increases in domestic production of nurses and policies to dampen growing demand, threatens to undermine health care delivery in the U.S. as well as in low income countries whose nurses migrate to the U.S. in significant numbers. By developing and implementing an action plan to ensure the availability of enough native-born nurses to meet future needs in the U.S., we will ensure access and quality of care for our own citizens in addition to making a very important contribution to global health.

DELSA/ELSA/WP2/HEA(2008)2
39
BIBLIOGRAPHY
Aiken, L. H. (2002), Superior outcomes for magnet hospital: The evidence base. In M. L. McClure & A. S. Hinshaw (Eds.), Magnet Hospitals Revisited: Attraction and Retention of Professional Nurses, American Nurses Publishing, Washington, DC, pp. 61-81
Aiken, L. H. (2005), Extending the magnet concept to developing and transition countries: Journey to excellence. Reflections on Nursing Leadership, 31, Vol. 1, pp. 16-19.
Aiken, L. H. (2007), U.S labor market dynamics are key to global nurse sufficiency. Health Services Research. 42, Vol.3, Part II, pp.1299-1320.
Aiken, L. H., et al. (2004), Trends in international nurse migration. Health Affairs, 23, Vol. 3, pp. 69-77.
Aiken, L.H., S.P. Clarke and D.M. Sloane, D.M. (2001), Hospital restructuring: Does it adversely affect care and outcomes?” Journal of Health and Human Services Administration, 23(4), pp. 416-440.
Aiken, L. H., et al. (2003), Educational levels of hospital nurses and surgical patient mortality. Journal of the American Medical Association, 290(12), pp. 1617-1623.
Aiken, L. H., et al. (2002), Hospital nurse staffing and patient mortality, nurse burnout, and job dissatisfaction. Journal of the American Medical Association, 288(16), pp. 1987-1993.
Aiken, L. H. & C.F. Mullinix (1987), The nurse shortage: myth or reality? New England Journal of Medicine. 317(10, pp. 641-6.
Aiken, L.H., J. Sochalski, and G.F. Anderson (1996), Downsizing the hospital workforce. Health Affairs 15(4): pp. 88-92.
Aiken, L. H., et al. (2007), Supplemental nurse staffing in hospitals and quality of care. Journal of Nursing Administration, 37(7):335-342.
American Association of Colleges of Nursing (AACN)(2005), With Enrollment Rising For The 5th Consecutive Year, U.S. Nursing Schools Turn Away 30,000 Qualified Applicants, www.aacn.nche.edu/Media/NewsReleases/2005/enrl05.htm, accessed 11 May 2007.
American Hospital Association Commission on Workforce for Hospitals and Health Systems. (2002), In Our Hands: How Hospital Leaders Can Build a Thriving Workforce. Chicago, IL.
Auerbach, D.L., P.I. Buerhaus and D.O. Staiger, (2007), Better late than never: Workforce supply implications of later entry into nursing. Health Affairs. 26(1): pp. 178-185.
Brush, B. L. and A. M. Berger (2002), Sending for nurses: Foreign nurse migration, 1965-2002. Nursing and Health Policy Review I(2), pp. 103-115.

DELSA/ELSA/WP2/HEA(2008)2
40
Brush, B. L., J. Sochalski and A.M. Berger (2004), Imported care: Recruiting foreign Nurses to U.S. health care facilities. Health Affairs,23(3), pp. 78-87.
Buchan, J. (2007), International recruitment of nurses: Policy and practice in the United Kingdom. Health Services Research. 42(3),Part II, pp. 1321-1335.
Buerhaus, P. I., et al. (2007), Trends in the experiences of hospital-employed registered nurses: Results from three national surveys. Nursing Economics, 25(2): pp. 69-79.
Buerhaus, P.I., D.O. Staiger, and D.I. Auerbach (2000), Implications of an aging registered nurse workforce. Journal of the American Medical Association, 283(22),pp. 2948-2954.
Buerhaus, P.I., D.O. Staiger, and D.I. Auerbach (2004), New signs of a strengthening U.S. nurse labor market? Health Affairs. 23 (Web exclusive),pp. 526-533.
Chen, L. C. and T. Evans (2004), Human Resources for Health: Overcoming the Crisis, Harvard University, Boston.
Cheung, R. B. and L.H. Aiken (2006), Hospital initiatives to support a better-educated workforce. Journal of Nursing Administration, 36(7/8), pp. 357-362.
Coffman, J. M., J.A. Seago and J. Spetz (2002), Minimum nurse-to-patient ratios in acute care hospitals in California. Health Affairs, Vol. 21, pp. 53-64.
Commonwealth Fund (2004), The Commonwealth Fund Health Care Opinion Leaders Survey: Assessing Health Care Experts’ Views on Policy Priorities, www.cmwf.org/surveys/surveys_show.htm?doc_id=254281, accessed 11 May 2007
Cooper, R. A. (2004), Weighing the evidence for expanding physician supply. Annals of Internal Medicine, Vol. 141, pp. 705-714.
Cooper, R.A. and L.H. Aiken (2006), Health services delivery: reframing policies for global migration of nurses and physicians - a U.S. perspective. Policy, Politics, & Nursing Practice. Vol. 7 (3 Suppl), pp. 66S-70S.
Davis, C. R., and B.L. Nichols (2002), Foreign-educated nurses and the changing U.S. nursing workforce. Nursing Administration Quarterly, Vol. 26(2), pp. 43-51.
Eastaugh, S. R. (1985), The impact of the nurse training act on the supply of nurses, 1974-1983. Inquiry, Vol. 22(4),pp. 404-417.
Estabrooks, C. A., et al. (2005), The impact of hospital nursing characteristics on 30-day mortality. Nursing Research, Vol. 54(2), pp. 74-84.
Fang, Z.Z. (2007), Potential of China in global nurse migration. Health Services Research. Vol. 42(3),Part II, pp. 1419-1428.
Government Accountability Office (2007), Nursing workforce: HHS needs methodology to identify facilities with a critical shortage of nurses. Report to Senators Kennedy and Dingell, April 30, 2007.
Institute of Medicine. (2004), Keeping Patients Safe: Transforming the Work Environment of Nurses. National Academies Press, Washington, D.C.

DELSA/ELSA/WP2/HEA(2008)2
41
Joint Commission (2002), Health Care at the Crossroads: Strategies for Addressing the Evolving Nursing Crisis. Oakbrook Terrace, Il.
Joint Commission (2005), Issues and Strategies for Nurse Leaders: Meeting Hospital Challenges Today. Oakbrook Terrace, IL.
Khadria, B. (2007), International nurse recruitment in India. International nurse migration. Health Services Research. Vol. 42 (3),Part II, pp. 1429-1436.
Kimball, B. & E. O’Neil (2002), Health Care’s Human Crisis: The American Nursing Shortage, The Robert Wood Johnson Foundation, Princeton, NJ.
Kingma, M. (2006), Nurses on the Move: Migration and the Global Health Care Economy, Cornell University Press, Ithaca, NY.
Little, L. (2007), Nurse migration: A Canadian case study. Health Services Research. Health Services Research. 42(3),Part II, 1336-1353.
Lorenzo, F.M.E., et al. (2007), Nurse migration from a source country perspective: Phillipine country case study. Health Services Research, Vol. 42(3),Part II, pp. 1406-1418.
Mullan F. (2005), The metrics of the physician brain drain. New England Journal of Medicine. Vol. 353(17), pp. 1810-18.
National Commission on Nursing Workforce for Long-Term Care. (2005), Act Now for Your Tomorrow, www.ahca.org/research/workforce_rpt_050519.pdf, accessed 11 May 2007.
National Council of State Boards of Nursing (2007), Nurse licensure and NCLEX examination statistics, www.ncsbn.org/462.htm, accessed 11 May 2007.
National League for Nursing. (2005), Despite Encouraging Trends Suggested by the NLN’s Comprehensive Survey of all Nursing Programs, Large Number of Qualified Applications Continue to be Turned Down. National League for Nursing (2005, December 9).
National League for Nursing. (2006), Nursing Data Review Academic Year 2004-2005: Baccalaureate, Associate Degree, and Diploma Programs. National League for Nursing: New York, NY.
Needleman, J., et al. (2002), Nurse-staffing levels and the quality of care in hospitals. New England Journal of Medicine Vol. 346(22), pp. 1715-1722.
Needleman, J., et al. (2006), Nurse staffing in hospitals: Is there a business case for quality? Health Affairs, Vol. 25(1), pp. 204-11.
The New Immigrant Survey (2006), Princeton University: Princeton, NJ, http://nis.princeton.edu/index.html, accessed 11 December 2006.
Person, S.D., et al. (2004), Nurse staffing and mortality for Medicare patients with acute myocardial infarction. Medical Care, Vol. 42, pp. 4-12.
Polsky, D., et al. (2007), Trends in characteristics and country of origin among foreign-trained nurses in the United States, 1990 and 2000, American Journal of Public Health, Vol. 97(5), pp. 895-899.

DELSA/ELSA/WP2/HEA(2008)2
42
Skudera, C. (2007), Questioning a Career in Health Care? Health and Science Jobs. Washington Post, August 12, 2007, Section L, pp. 1-2.
Steinbrook, R. (2002), Health policy report: Nursing in the crossfire. New England Journal of Medicine, Vol. 346(22), pp. 1757-1765.
U.S. Census Bureau (2007), National and state population estimates, www.census.gov/popest/states/NST-ann-est2004.html, accessed 11 May 2007
U.S. Department of Health and Human Services (2006), Registered Nurse Population: Findings from the March 2004 National Sample Survey of Registered Nurses, Washington, DC.
U.S. Department of Labor, Bureau of Labor Statistics (2004), Occupational Projections and Training Data, Bulletin 2572. www.bls.gov/news.release/ecopro.t06.htm, accessed 11 May 2007
U.S. Department of Labor, Bureau of Labor Statistics (2005), Current Population Survey. Employed and experienced unemployed persons by detailed occupation and class of worker, Annual Average 2005.
Vahey, D. C. et al. (2004), Nurse burnout and patient satisfaction. Medical Care, 42(2) Suppl II57-66.
Vujicic, M. P., et al. (2004), The role of wages in the migration of health care professionals from developing countries. Human Resources for Health, Vol. 2 (3), www.human-resources-health.com/content/pdf/1478-4491-2-3.pdf, accessed 11 May 2007.
Waldman, J. D., et al. (2004), The shocking cost of turnover in health care. Health Care Management Review, Vol. 29, pp. 2-7.
Whelan, D. (2007), Is there another doctor in the house? Forbes, Vol. 179(6), 26 March, pp. 6-7.
Xu, Y. & C. Kwak (2005), Characteristics of internationally educated nurses in the United States. Nursing Economics, Vol. 23(5), pp. 233-238.
DELSA/ELSA/WP2/HEA(2008)2
43
APPENDIX: UNITED STATES LICENSING PROCESS FOR FOREIGN-EDUCATED RNS
Licensing requirements for nurses educated abroad:
• Must have a recognized degree or diploma in nursing • Nursing education must be at post secondary school level • Proof of credentials and skills by the authoritative body
o Automatic licensure upon request if the source and host countries have formal mutual recognition agreements.
o If no such agreement, applicant must undergo screening process.
• Requirements for US licensure – requirements determined by each state. Minimal Data Set for the Evaluation of International Nurses lists state-level requirements (https://www.ncsbn.org/minimal_data_set_final.pdf).
o Pre-licensure documentation - All but one state (California) require one or both of the following:
CGFNS Certification Program Certificate. Cost is US$368 for an initial applicant. The Certification Program (CP) is designed only for first-level, general nurses educated and/or licensed outside the United States who wish to assess their chances of passing the U.S. registered nurse licensing exam, the NCLEX-RN® examination, and attain licensure as registered nurses within the United States. In 2006, there were 12,256 applicants and a 72% pass rate for first time takers. http://www.cgfns.org/sections/tools/stats/cp-tests.shtml. The program is comprised of the following:
• Credentials review. • Pre-licensure qualifying exam, required by the majority of US states, offered
worldwide, satisfies one of the immigration requirements to obtain an occupational visa to the US.
• English language proficiency exam.
Credentials Evaluation Service (CES). Analyzes the credentials and serves as a valuable tool for regulatory/licensing agencies, specialty certification authorities, academic institutions, immigration attorneys, prospective employers and others. It also helps qualified applicants demonstrate the merits of their credentials with regard to U.S. standards, facilitating their pursuit of educational or career opportunities in the United States.
• In 2006, 5,130 reports were issued for RNs. Cost can be a high as US$328.
Credential Verification Service for New York State (CVS)
• Additional requirement by the state of New York that provides verification of the authenticity of the applicant’s educational and licensure credentials and is part of the application process to work in New York State. Cost is US$275.

DELSA/ELSA/WP2/HEA(2008)2
44
As of August 7, 2007, all states require one or both of the CES and CP, except California, which has no requirements http://www.cgfns.org/files/pdf/maps/sbon_req.pdf.
o NCLEX-RN examination – International test sites currently are in London, England; Hong Kong; Sydney, Australia; Toronto, Montreal, and Vancouver, Canada; Frankfurt, Germany; Mumbai, New Delhi, Hyderabad, Bangalore, and Chennai, India; Mexico City, Mexico; Taipei, Taiwan; Manila, Philippines; and Chiyoda-ku and Yokohama, Japan.
• Obtaining a Visa
o Acquire a visa screen (VS) certificate (required under section 343 of the Illegal Immigration Reform and Immigrant Responsibility Act of 1996), administered by CGFNS at a cost of US$398 for an initial applicant. In 2006, 15,258 Visa Screens were issued to RN applicants (http://www.cgfns.org/sections/tools/stats/vs.shtml.
o There are not specific visas for nurses. Work visas available to foreign educated RNs seeking employment in the US include:
Temporary visas (nonimmigrant)
• H-1B Work Visa for college educated professionals
o Available only to those in a profession that requires a minimum of a baccalaureate level education. Issued up to 3 years but may be extended. Maximum of 65,000 issued per year. Given that no US state currently requires a baccalaureate for entry into nursing, this visa is not applicable to foreign educated registered nurses.
• TN NAFTA Work Visa – available only to citizens of Mexico or Canada.
o Applicant must meet the specific criteria for the occupation and must have a US employer.
• E-3 Work Visa for Australians
o Available only to those with a minimum of a baccalaureate level education. Maximum of 10,500 issued per year. Issued up to 2 years but may be extended.
• H-1C Visa program
o Allows qualified hospitals in health professional shortage areas to employ temporary foreign registered nurses for up to 3 years via the reauthorization of the Nursing Relief for Disadvantaged Areas Act of 2005 (PL 109-423). Expires on December 20, 2009. 500 visas issued per year.
Permanent Immigrant Visa (green card)
• Employment Based Third Preference Visas

DELSA/ELSA/WP2/HEA(2008)2
45
o The majority of nurses enter with employment based immigrant visas that allow permanent residency. Nursing falls within the 3rd priority among 4 categories. The total number of employment based preference visas is limited each year and there is also a limit by source country. Since 9/11/01 some employment-based visas have remained unused. In the case of nurses and other healthcare providers, Congress has set a precedent by allowing a one time reactivation of unused visas to be transferred to countries (such as the Philippines) that have exhausted their annual allocation but which have qualified nurse applicants eligible for visas. Legislation is pending to extend this provision in subsequent years as well as proposals to lift the limits on visas for nurses.

DELSA/ELSA/WP2/HEA(2008)2
46
OECD HEALTH WORKING PAPERS
No. 34 MISMATCHES IN THE FORMAL SECTOR, EXPANSION OF THE INFORMAL SECTOR: IMMIGRATION OF HEALTH PROFESSIONALS TO ITALY (2008) Jonathan Chaloff
No. 33 HEALTH WORKFORCE AND INTERNATIONAL MIGRATION: CAN NEW ZEALAND COMPETE? (2008) Pascal Zurn and Jean-Christophe Dumont
No. 32 THE PREVENTION OF LIFESTYLE-RELATED CHRONIC DISEASES: AN ECONOMIC FRAMEWORK (2008) Franco Sassi and Jeremy Hurst
No. 31 PHARMACEUTICAL PRICING AND REIMBURSEMENT POLICIES IN SLOVAKIA (2008) Zoltán Kaló, Elizabeth Docteur and Pierre Moïse
No. 30 IMPROVED HEALTH SYSTEM PERFORMANCE THROUGH BETTER CARE COORDINATION (2007) Maria M. Hofmarcher, Howard Oxley and Elena Rusticelli
No. 29 HEALTH CARE QUALITY INDICATORS PROJECT 2006 DATA COLLECTION UPDATE REPORT (2007) Sandra Garcia-Armesto, Maria Luisa Gil Lapetra, Lihan Wei, Edward Kelley and the Members of the HCQI Expert Group
No. 28 PHARMACEUTICAL PRICING AND REIMBURSEMENT POLICIES IN SWEDEN (2007) Pierre Moïse and Elizabeth Docteur
No. 27 PHARMACEUTICAL PRICING AND REIMBURSEMENT POLICIES IN SWITZERLAND (2007) Valérie Paris and Elizabeth Docteur
No. 26 TRENDS IN SEVERE DISABILITY AMONG ELDERLY PEOPLE: ASSESSING THE EVIDENCE IN 12 OECD COUNTRIES AND THE FUTURE IMPLICATIONS (2007) Gaetan Lafortune, Gaëlle Balestat, and the Disability Study Expert Group Members
No. 25 PHARMACEUTICAL PRICING AND REIMBURSEMENT POLICIES IN MEXICO (2007) Pierre Moïse and Elizabeth Docteur
No. 24 PHARMACEUTICAL PRICING AND REIMBURSEMENT POLICIES IN CANADA (2006) Valérie Paris and Elizabeth Docteur
No. 23 HEALTH CARE QUALITY INDICATORS PROJECT, CONCEPTUAL FRAMEWORK PAPER (2006) Edward Kelley and Jeremy Hurst
No. 22 HEALTH CARE QUALITY INDICATORS PROJECT, INITIAL INDICATORS REPORT (2006) Soeren Mattke, Edward Kelley, Peter Scherer, Jeremy Hurst, Maria Luisa Gil Lapetra and the HCQI Expert Group Members
No. 21 THE SUPPLY OF PHYSICIANS IN OECD COUNTRIES (2006) Steven Simeons and Jeremy Hurst
No. 20 CONSUMER DIRECTION AND CHOICE IN LONG-TERM CARE FOR OLDER PERSONS, INCLUDING PAYMENTS FOR INFORMAL CARE: HOW CAN IT HELP IMPROVE CARE OUTCOMES, EMPLOYMENT AND FISCAL SUSTAINABILITY? (2005) Jens Lundsgaard
No. 19 TACKLING NURSE SHORTAGES IN OECD COUNTRIES (2004) Steven Simoens, Mike Villeneuve and Jeremy Hurst
No. 18 PRIVATE HEALTH INSURANCE IN THE NETHERLANDS. A CASE STUDY (2004) Nicole Tapay and Francesca Colombo
No. 17 SKILL-MIX AND POLICY CHANGE IN THE HEALTH WORKFORCE: NURSES IN ADVANCED ROLES (2004) James Buchan and Lynn Calman
No. 16 SHA-BASED NATIONAL HEALTH ACCOUNTS IN THIRTEEN OECD COUNTRIES: A COMPARATIVE ANALYSIS (2004) Eva Orosz and David Morgan
No. 15 PRIVATE HEALTH INSURANCE IN OECD COUNTRIES: THE BENEFITS AND COSTS FOR INDIVIDUALS AND HEALTH SYSTEMS (2004) Francesca Colombo and Nicole Tapay
No. 14 INCOME-RELATED INEQUALITY IN THE USE OF MEDICAL CARE IN 21 OECD

DELSA/ELSA/WP2/HEA(2008)2
47
COUNTRIES (2004) Eddy van Doorslaer, Cristina Masseria and the OECD Health Equity Research Group
No. 13 DEMENTIA CARE IN 9 OECD COUNTRIES: A COMPARATIVE ANALYSIS (2004) Pierre Moise, Michael Schwarzinger, Myung-Yong Um and the Dementia Experts’ Group
No. 12 PRIVATE HEALTH INSURANCE IN FRANCE (2004) Thomas C. Buchmueller and Agnes Couffinhal
No. 11 THE SLOVAK HEALTH INSURANCE SYSTEM AND THE POTENTIAL ROLE FOR PRIVATE HEALTH INSURANCE: POLICY CHALLENGES (2004) Francesca Colombo and Nicole Tapay
No. 10 PRIVATE HEALTH INSURANCE IN IRELAND. A CASE STUDY (2004) Francesca Colombo and Nicole Tapay
No. 9 HEALTH CARE SYSTEMS: LESSONS FROM THE REFORM EXPERIENCE (2003) Elizabeth Docteur and Howard Oxley
A full list of the papers in this series can be found on the OECD website: www.oecd.org/els/health/workingpapers
RECENT RELATED OECD PUBLICATIONS:
PHARMACEUTICAL PRICING POLICIES IN A GLOBAL MARKET (2008) OECD HEALTH DATA 2008 (2008), available in English, French, German, Italian and Spanish on CD-ROM (Windows XP/Vista); online version features these languages. HEALTH AT A GLANCE: OECD INDICATORS 2007 (2007). See www.oecd.org/health/healthataglance for more information OECD REVIEWS OF HEALTH SYSTEMS - SWITZERLAND (2006) LONG-TERM CARE FOR OLDER PEOPLE (2005), OECD HEALTH PROJECT SERIES HEALTH TECHNOLOGIES AND DECISION MAKING (2005), OECD HEALTH PROJECT SERIES OECD REVIEWS OF HEALTH CARE SYSTEMS - FINLAND (2005) OECD REVIEWS OF HEALTH CARE SYSTEMS - MEXICO (2005) PRIVATE HEALTH INSURANCE IN OECD COUNTRIES (2004), OECD HEALTH PROJECT SERIES TOWARDS HIGH-PERFORMING HEALTH SYSTEMS - POLICY STUDIES (2004), OECD HEALTH PROJECT SERIES TOWARDS HIGH-PERFORMING HEALTH SYSTEMS (2004), OECD HEALTH PROJECT SERIES OECD REVIEWS OF HEALTH CARE SYSTEMS - KOREA (2003) A DISEASE-BASED COMPARISON OF HEALTH SYSTEMS: WHAT IS BEST AND AT WHAT COST? (2003)
For a full list, consult the OECD On-Line Bookstore at www.oecd.org, or write for a free written catalogue to the following address:
OECD Publications Service 2, rue André-Pascal, 75775 PARIS CEDEX 16 or to the OECD Distributor in your country