NUREG/CR-4479, 'The Use of a Field Model to Assess Fire ...
72
URCEG/CR447O BNbN#UHEIO•5IO4f THE USE OF A FIELD MODEL TO ASSESS FIRE BEHAVIOR IN COMPLEX NUCLEAR POWER PLANT ENCLOSURES: PRESENT CAPABILITIES AND FUTURE PROSPECTS John L. Boccio and John L. Usher December 1985 RELIABILITY & PHYSICAL ANALYSIS GROUP DEPARTMENT OF NUCLEAR ENERGY, BROOKHAVEN NATIONAL LABORATORY UPTON, NEW YORK 11973 ilipruk I Prepared for United States Nuclear Regulatory Commission Washington, D.C. 20555 U. S. NUCLEAR REGULATORY OO"S3ION L1BRARY WASHI-NGTON DQ ZXU , STOP 55•4..
Transcript of NUREG/CR-4479, 'The Use of a Field Model to Assess Fire ...
URCEG/CR447OBNbN#UHEIO•5IO4f
THE USE OF A FIELD MODEL TO ASSESS FIRE BEHAVIORIN COMPLEX NUCLEAR POWER PLANT ENCLOSURES:
PRESENT CAPABILITIES AND FUTURE PROSPECTS
John L. Boccio and John L. Usher
December 1985
RELIABILITY & PHYSICAL ANALYSIS GROUPDEPARTMENT OF NUCLEAR ENERGY, BROOKHAVEN NATIONAL LABORATORY
UPTON, NEW YORK 11973
iliprukI
Prepared forUnited States Nuclear Regulatory Commission
Washington, D.C. 20555
U. S. NUCLEAR REGULATORY OO"S3IONL1BRARYWASHI-NGTON DQ ZXU ,STOP 55•4..


NUREG/CR-4479BNL-NUREG-51948
AN. R-7
THE USE OF A FIELD MODEL TO ASSESS FIRE BEHAVIORIN COMPLEX NUCLEAR POWER PLANT ENCLOSURES:
PRESENT CAPABILITIES AND FUTURE PROSPECTS
J.L. Boccio and J.L. Usher
Manuscript Completed - November 1985Date Published - December 1985
RELIABILITY AND PHYSICAL ANALYSIS GROUPDEPARTMENT OF NUCLEAR ENERGY
BROOKHAVEN NATIONAL LABORATORYUPTON, N.Y. 11973
Prepared forDIVISION OF ENGINEERING TECHNOLOGY, RESOFFICE OF NUCLEAR REGULATORY RESEARCH
U.S. NUCLEAR REGULATORY COMMISSIONWASHINGTON, D.C. 20555
UNDER CONTRACT DE-AC02-76CH00016FIN A-3252
NOTICE
This report was prepared as an account of work sponsored by an agency of the UnitedStates Government. Neither the United States Government nor any agency thereof, orany of their employees, makes any warranty, expressed or implied, or assumes anylegal liability or responsibility for any third party's use, or the results of such use, ofany information, apparatus, product or process disclosed in this report, or representsthat its use by such third party would not infringe privately owned rights.
The views expressed in this report are not necessarily those of the U.S. NuclearRegulatory Commission.
Available fromSuperintendent of Documents
U.S. Government Printing OfficeP.O. Box 37082
Washington, DC 20013-7982and
National Technical Information ServiceSpringfield, Virginia 22161
-iii-
ABSTRACT
This report provides a summary of the work conducted during FY-1984 byBrookhaven National Laboratory (BNL), under FIN A-3252 "Fire Protection ResearchProgram." It was undertaken under the cognizance of the Electrical EngineeringBranch in the Division of Engineering Technology within the Office of NuclearRegulatory Research. The report describes a mathematical model for predictingthe thermal environment within complex nuclear power plant enclosures. It dem-onstrates the capability of the existing numerical code by direct comparisonswith electrical cable fire/large enclosure tests performed by Sandia NationalLaboratories (SNL) for the NRC and by the Factory Mutual Research Corporation(FMRC) for the Electric Power Research Institute (EPRI). It further demon-strates the potential usefulness of the existing code in addressing fire-protec-tion issues. This is done through a parametric study of the thermal environmentresulting from a series of fires within cabinets in a nuclear power plant con-trol room (similar to LaSalle). Also, it presents an example of how the codecan be utilized by addressing an Appendix R exemption request which deals withthe vulnerability of containment fans to a fire emanating from a reactor coolantpump bay. Recommendations are also given as to how the model/code can be fur-ther enhanced and where current effort is proceeding.

-iv-
ACKNOWLEDGEMENT
This work was performed for the Electrical Engineering Instrumentation andControl Branch (EEICB) of the U.S. Nuclear Regulatory Commission. Dr. AmarDatta of EEICB was the technical monitor of the project and the authors wish to
acknowledge him for providing useful guidance and comments throughout the courseof this program. Special thanks go to our subcontractor, CHAM of North
America, and especially this organization's technical director, Dr. AshokSinghal. The use of this organization's proprietary code, PHOENICS, was thebasis for the numerical predictions present herein.
Finally, the authors wish to acknowledge our secretary, Ms. Jeanne Danko,without whose dedicated efforts and attention to detail this report would not
have been completed in a timely fashion.
CONTENTS
Pagge
ABSTRACT ...................................................... iii
ACKNOWLEDGEMENT .................. ......................................... iv
LIST OF TABLES ........................................................... v
LIST OF FIGURES ....................................... vii
EXECUTIVE SUMMARYo .................................... ix
I. INTRODUCTION ...................... I
A. Background: Fire Protection Safety Issues and Program Overview... 1B. Study Obetvs......................... 2
II. FIRE PROTECTION PROJECT DESCRIPTION ................................... 4A. Fire Source Characterization(FSC)............................... 4B. Fire Environment Determination (FED)............................. 4C. Control Room Habitability and Fire Safety Study CCR)............. 7
III. BNL PROJECT SUMMARIES................................................ 8A. Fire Source Characterization Program............................. 8B. Fire Environment Determination Program........................... 18C. Control Room Habitability and Fire Safety Study Program.......... 39D. Plant Specific Code Application.................................. 42
IV. FUTURE DIRECTIONS - BVL ............................................... 50A. Validation with Cabinet/Control Room Test Data ........ 0.......... 50B. Parametric Study of Fires Within NPP Control Rooms ............... 50
V. CONCLUSIONS ....................................... 51
REFERENCES ...... o..................................... 52
-vi-
LIST OF TABLES
Table Page
1. Generic Enclosures Survey. ........ ........ 11
2. Exchange Coefficients (ro) and Source Terms (SO) for DifferentSVariables ......... .. .......................... ..... 0 ...... 0 4....... 21
-vii-
LIST OF FIGURES
Fig. No. Title Page
1. Code Comparison Matrix............................................. 19
2. Three-Dimensional View of FMRC Test Structure...................... 23
3. Velocity Vector Field Through Central Vertical Plane DuringFire Growth................................................ ...... 26
4. Isotherm Contours (T=50*C, T=60*C) at 240 secs. Into Fire.*........ 27
5. Fire Enclosure Details: Preliminary Fire Experiments Number2 and 3 and Full-Scale Tests 1 and 2 ...................... 28
6. Grid Distributions, Coordinate Directions and ThermocouplePositions (Shown by "X)......................................... 29
7. Total Heat Release Rates for Experiments 2 & 3, and Tests I & 2.... 30
8. Heat Release Rate for Experiment 2 ................................. 30
9. Volumetric Heat Release and Heat Loss Distributions ................ 30
10. Calculated Development of Doorway Velocity and TemperatureProfiles for Experiment 3........................................ 32
11. Measured Doorway Profiles in Steckler's (NBS) Steady-StateExperiments ...................................................... 32
12. Predicted and Measured Temperatures for Experiments 2 and 3........ 33
13. Predicted and Measured Temperatures at Several Levels for
Experiment Measue T....emperture atSeveral.r....... 33
14. Predicted and Measured Temperatures at Several Levels forExperiment 3 .se.......... , ................... 33
15. Predicted and Measured Temperatures at Several Levels for
Experiment 3...........................33
16. Velocity Distributions in Two Longitudinal Vertical Planes(Experiment 2) ............................................. 34
17. Predicted and Measured Temperatures at 1' Below Ceiling and2' from the Tray (Test 1) ........................................ 35
-viii-
LIST OF FIGURES (Cont'd)
Fig. No. Title Page
18. Predicted and Measured Temperatures at Redundant Target (Test 1)... 35
19. Predicted and Measured Temperatures at 1' Below Ceiling and2' from the Tray (Test 2) ........................................ 35
20. Predicted and Measured Temperatures at Redundant Target (Test 2)... 35
21. Predicted and Measured Temperatures at Several Locations forTest 1* .............................................. 36
22. Predicted and Measured Temperatures at Several Locations forTest 1........................................................... 36
23. Stratified Hot Layer Development for Experiment 3 ................. 37
24. Stratified Hot Layer Development for Test 1 ........................ 38
25. Horizontal Cross-Section ................. ........ ...... .. ....... 39
26. Valance Horizontal View ............................. 40
27. Velocity Distributions in Horizontal Plane IZfl at t=360 so..*....... 42
28. Development of Temperature Field at Various Times .... 0........... 43
29. Containment Model Geometry ....... .............. .... ... . .. ..... 45
30. Flow Vectors Plotted on a 2-D Cross-Section of the ContainmentBuilding. The vectors are magnified seven times for details.Inflow at the RCP Bay Base is 1 m/so.............................. 46
31. Containment Temperature Profile at end of Variously Sized LubeOil Fires ....................... o .........*............. 48
32. Lines of Constant Temperature in the Containment Building Afterthe Postulated Fire. The Contours Range from 386K to 450Kin 2K Increments ............................... o.................. 49

-ix-
EXECUTIVE SUMMARY
A. BACKGROUND
For the past several years research in fire protection measures and firesafety conducted by the U.S. Nuclear Regulatory Commission (NRC) has focused onproviding technical bases upon which specific deterministic requirements forfire protection could be established. The requirements, buffered by these re-search activities, are contained in Appendix R to 10CFR50 and in Section 9.5.1of the Standard Review Plan (SRP). These criteria/guidelines indicate the mini-mum necessary fire protection measures and features such as separation by firebarrier or distance, automatic fire detection and suppression, and system redun-dancy to limit fire damage while not impairing those engineered safety featuresdesigned to safely shut down the plant.
Efforts by utilities in either complying with or seeking exemption fromthese requirements have largely relied on the use of analytical fire models toprovide justification to their proposed fire-safety design changes or to indi-cate that existing features conservatively comply with the overall fire safetymandates. In the course of evaluating these analyses, the NRC must judgewhether they incorporate state-of-the-art models and recent test results. Par-ticular attention must be given to ensure that the application of the models isconsistent with the assumptions and limitations of the particular unit-problemfire models employed in the fire hazards analysis.
The scope of these reviews entail answers to the following questions:
" Are the fire scenarios analyzed reflective of what may realistically oc-cur? In other words, does the physical model employed represent an ade-quate and conservative replication of the major fire-related phenomena.
" Concomitantly, does the mathematical model adequately portray thesemajor physical processes and geometrical constraints?
• Does the actual scenario bound the overall problem?
" Are the conclusions drawn from the calculated results uniformly validwith the assumptions made to provide a tractable analysis?
Responding to these questions as well as other "fire damage" issues which havebeen raised indicates a need for NRC to develop a computational capability todetermine the margins of safety inherent in various fire protection features andlayouts in nuclear power plants (NPPs).
Also, reflecting upon the increasing emphasis and use of probabilistictechniques in the assessment of NPP risk in general, and the risk due to inter-nal fires in particular, further indicates a need to develop a fire-scenariomodeling capability. Only recently has the probabilistic analysis of internal

fires become an accepted, albeit immature, part of full-scale Probabilistic Risk
Assessment (PRA) studies. The more difficult aspects of the probabilistic anal-
ysis occur in estimating the likelihood that equipment will be disabled by a
fire. This problem is compounded by the existing uncertainties in
deterministic/probabilistic modeling of detection and suppression systems, the
stochastic nature of fire growth over time, and the size and geometric complexi-
ty of the fire zone wherein hot gases can cause equipment failure or induce
secondary fires.
A number of important models have been developed over the years to assist
the analyst in calculating the likely progression of a fire, but in even the
simplest cases the quantitative uncertainties remain large. Available fire-
growth and fire-enclosure models are highly approximate in character and are not
capable of accurately modeling the fire-induced environment in a compartment of
crowded objects situated in a unique configuration. Also, the analysis of fail-
ure modes for components exposed to the whole spectrum of combustion products
(heat, smoke, toxic aerosols) needs more methodological development enhanced by
test data. Methods must also be developed for treating the intercompartmentalspread of fire and combustion products.
The need for conducting fire testing in complex, large test enclosures that
contain flow obstacles, prototypic fire-sensitive equipment, and house forced
ventilation systems requires that a computational capability be developed to
economically scope a fire-test program.
For the NRC to determine how fire safe nuclear power plants are, how much
fire-safety improvement, if any, is required, and how the desired level of fire
safety can be ensured during the lifetime of the plant more sophisticated and
phenomenologically complete mathematical tools must be developed to assist them
in their regulatory, decision-making process.
B. SUMMARY OF EFFORTS
As a continuation of a research project initiated in FY 1982, prior efforts
entailed surveys of both national and international research programs which
could be a factor in formulating nuclear power plant fire protection programs
and guidelines. Keeping abreast of these fire-protection research programs
undertaken by the fire-science community and apprising NRC of the results, con-
clusions, and possible implementation into NRC's decision-making process (as it
relates to fire-safety issues) provided the necessary background and experience
to complete a survey of enclosure fire models that specifically employ three-
dimensional, transient field model techniques. Also, understanding NRC needs in
nuclear power plant fire safety and the issues raised allowed BNL to develop
criteria for selecting one of these modeling approaches which has the potential
for analyzing the fire-induced environment in enclosures typical of NPP critical
areas.

-xi-
Based on the criteria established, a computational model was selected.Efforts in FY 1984, summarized in this report, were scoped to demonstratefurther the capability of the selected analytical model/numerical code. Thislargely entailed comparisons with cable fire/enclosure tests conducted for theElectric Power Research Institute (EPRI) and for the NRC. The former test pro-gram was performed by the Factory Mutual Research Corporation (FMRC) in theirintermediate scale facility; the latter was performed for Sandia National Labor-atories in their investigation of spatial separation as a fire protection meth-od. Comparisons with both test programs are promising to the extent that themodel-demonstration phase is essentially complete and model enhancement canproceed.
This report also describes the effort started in FY 1984 in which a parame-tric study of potential fire environments within nuclear power plant controlroom configurations was conducted. This work was undertaken to provide addi-tional fire-modeling capability to those fire-risk tasks associated with NRC'sRisk Methodology, Integration, and Evaluation (RMIE) Program. As such, prelim-inary efforts have been directed toward numerical investigation of potentialfire scenarios in the LaSalle NPP control room. Prefatory analysis of the fireenvironment within the LaSalle Control Room, caused by a fire within a controlcabinet is documented in this report also. The results are indeed promising,and the ensuing thermal environment is physically plausible.
In addition to numerical comparisons of enclosure fire tests involvingelectrical cables and parametric studies of cabinet fires within realistic com-plex control-room configurations, this report presents numerical comparisons ofthe effects of a reactor coolant pump lube oil fire within a particular plantcontainment building. This latter demonstration emphasizes the value of themathematical model as a tool which can be used by NRC in their review of licen-see Appendix R exemption requests.
C. RECOMMENDATIONS
Based upon favorable comparisons with experiments and the plausible resultsfrom parametric studies and case-specific Appendix R exemption requests, thisreport details future directions in model improvement which can further enhanceits usefulness in addressing fire protection and fire risk issues. In this re-gard, it is recommended that effort should continue in the following threeareas:
1. Further adapt the three-dimensional field model in order to incorpo-rate within the numerical code additional energy generation and heatexchange mechanisms. Energy generation mechanisms to be included inthe multi-component aspects of the mathematical model should containthose features which account for the afterburning of pyrolysis pro-ducts. To keep the analytical modeling tractable, emphasis should beplaced on employing a simple, existing chemical-reaction scheme or aone-step quasi-global gaseous reaction mechanism, coupled with a

-xii-
combustion-inefficiency parameter. This presupposes that input to the
code will include mass fractions of the major reactant products.
Heat exchange mechanisms, notably losses due to conduction and radia-
tion, should also be modeled. However, these loss mechanisms (or
thermal energy transfer mechanisms) are to be treated in an ancillary
manner and coupled to the conservation equations through a unit-prob-lem approach. For example, instead of using relations directly linked
to the general governing equations, constitutive unit models will be
employed which are somewhat decoupled from the convective and diffu-
sive exchange processes. Thus, radiative heat transfer could be
treated by linking zone models to the field model, employing view
factors and global energy transfer considerations. This will allow
global radiation transfer from the hot gas layer and the flame zone to
selected targets to be determined simply.
This model enhancement can be used in the design of a fire-test exper-
imental program and could assist SNL's fire-research efforts by iden-
tifying the parameters, instrumentation locations, relevant fire loca-
tions, etc., for their test program.
2. Apply the upgraded model, at an appropriate level of development, to
complete the parametric study (started in FY 1984) to investigate po-
tential fire environments in the LaSalle Plant control room. The par-
ametric study and model development should be initially tied directly
to existing NRC concerns for this type of fire area, e.g., controlroom habitability during the early stages in the developing fire.Means for appraising final room-damage states and plant operability
from the control room after the fire has been extinguished will also
be key modeling features that should be examined. Fire suppression
activities (manual/automatic) can be modeled during this effort.Detection/suppression models can be augmented into the existing code/mathematical model.
3. In addition to parametric studies of control room environment, given aselected series of realistic initiating fires, the upgraded model
should be used to predict potential fire environments in other nuclear
power plant enclosures. As potential support to the fire-risk tasks
of the RMIE Program (FIN A-1391) initial guidance for choosing other
enclosure/geometries will come from the critical fire area screening
analyses to be conducted for the LaSalle plant.
This report indicates that continued future efforts should be conducted
with the existing code and its adaptations through parametric studies of criti-
cal fire areas and identified by screening analyses performed through "external-
event" risk studies. By the example applications described in this report, how-
ever, the results show that at its present stage of development, the model/code
can be a useful adjunct to NRC's decision-making process in addressing fire-
safety issues.

-1-
I. INTRODUCTION
A. BACKGROUND: FIRE PROTECTION SAFETY ISSUES AND PROGRAM OVERVIEW
Appendix R to 10 CFR Part 50 and the Branch Technical Position CMEB 9.5-1establish the fire damage limits to systems associated with achieving and main-taining safe hot shutdown condition of the nuclear reactor as follows:
"One train of equipment necessary to achieve hot shutdown from either thecontrol room or emergency control station(s) must be maintained free offire damage by a single fire, including an exposure fire."
This is interpreted as a clear requirement to maintain at least one of the re-dundant trains of safe hot shutdown equipment in continued operable condition,even after exposure to a fire or a fire environment. Section IIIG of Appendix Rand Section C5.b of the BTP spell out three options available to the licensee tomeet this requirement, one of which is the "20-ft separation" option. Thelicensee may meet the requirement of maintaining a hot shutdown capability byseparating the redundant trains by a horizontal distance of more than 20 ft,with no intervening combustibles or fire hazards, provided that fire detectorsand an automatic fire suppression system are also installed in the fire area.
The Office of Nuclear Reactor Regulation requested a series of tests to as-certain the adequacy of the 20-ft separation option. Full-scale replications ofa nuclear power plant enclosure were set up, with cable tray systems represent-ing the two redundant trains located a horizontal distance of 20 ft apart. Insome of the tests1 in which one of the redundant trains (a vertical cable tray)was set on fire, the second train suffered electrical failures occurring atvarying times from the inception of fire. IEEE Std. 383-qualified cables faredbetter than their unqualified counterparts, and expectedly, fire retardantcoatings and ceramic fiber blankets on cable trays improved the chances of sur-vival of both types. No suppression of the fire was attempted in order to as-certain the level of protection afforded by spatial separation alone withoutbenefit of the automatic suppression system.
The tests provided valuable insight into the fire growth process in a cabletray and the nature of the consequential damage to a second cable system separa-ted by an intervening space. They did not, however, provide the basis for ex-trapolation of the data to the numerous combinations of enclosure geometry andequipment layouts that are encountered in nuclear power plants. It has alsosince been realized that safe shutdown equipment other than cables may be vul-nerable to fire. Obviously, some measure of protection is obtained by spatialseparation of the redundant trains. This protection, however, is effective fora limited maximum severity of the exposure and for a limited duration. Theseverity of the fire exposure in turn is dependent not only on its own charac-teristics, such as the heat evolution rate, but also on factors such as fire en-closure geometry, equipment layout, door and vent locations, fire locations, andventilation rate. Therefore, the NRC has not been able to clearly confirm theadequacy of the 20-ft separation option. However, based on experience to date,the question may best be addressed by studying the various factors affecting thecontinued operability of equipment exposed to fire. These factors are:

-2-
1) the characteristics of the fire (energy and mass release rates),
2) the environment produced by the fire (temperature, heat flux, species
concentrations), and
3) the response of the equipment itself to the environment (fire damage
thresholds).
The overall fire protection research program being conducted by NRC, which is
discussed in more detail below is, therefore, to investigate these factors
separately and to combine the acquired knowledge at a later stage to address the
totality of the problem.
Additional specific needs are also addressed within the overall framework
of the fire protection research program. Among these are: 1) enhancing fire
test programs, and 2) addressing PRA fire-related issues. The above issues con-
stitute a more thorough view of the overall objectives of the fire protection
research program.
Full-scale fire test programs represent necessary yet expensive means for
determining enclosure fire environments. Case-specific fire tests representprohibitive costs to both the NRC and licensees. Careful fire environment char-
acterization and consequent modeling capability produced by this program can aid
in the careful selection of full-scale test cases and reduce the number of tests
required, thereby lowering costs.
Probabilistic studies (PRA) of nuclear power plants require data regarding
the occurrence frequencies and consequences of events which take place within
plant environs. Also, more detailed fire models can be used to benchmark models
used in fire-risk analysis thereby providing some measures of modeling and data
uncertainties inherent in these simpler models. An example of an event ofinterest would be a fire within a safety-related NPP area. Data regarding the
consequential outcome of a fire in a specific plant area would likely not bereadily available. The effects of fire on safety-related equipment within the
NPP characterized by the fire protection research program would provide data to
the PRA analysis.
B. STUDY OBJECTIVES
NRC's Fire Protection Research Program (FPRP) is a multiphase, multiyear
research program requiring close coordination between the fire-modeling effort
being conducted at BNL and the continuing experimental program being undertaken
at Sandia National Laboratories. The goal of the FPRP is to develop test data
and analytical capabilities to support the evaluation of: (1) the contribution
of fires to the overall risk from nuclear power plants, (2) the effects of fires
on control room equipment and operations, and (3) the effects of actuation of
fire suppression systems on safety equipment. These three goals will be met by
(a) defining fire sources with respect to their energy and mass release rates,
(b) determining the environment resulting from the fire, and (c) determining the
response of certain safe shutdown equipment and components to the environmental
conditions.
-3-
As a subset to this overall objective, this report summarizes the work con-ducted by Brookhaven National Laboratory (BNL) to utilize, enhance, and developa computational capability for determining the environments within plant enclo-sures caused by fires and to initiate a probabilistic fire model/fire data baseto support fire-risk activities and projects within the NRC.
In this regard, this report essentially provides, in Section 1I, a detaileddescription of the various elements and basics of the FPRP that have been con-ducted at BNL. This section also illustrates the coordination efforts betweenthe two laboratories. In Section I11, the results of these fire-modeling ef-forts are presented. Where this program is currently directed and what furtherfire protection issues remain for analysis are discussed in Section IV. Morespecifically, this report provides the following:
1. A survey of actual fire loads and configurations within nuclear powerplants (NPPs) and a classification scheme into several generic enclo-sure configurations. The purpose of this effogt and the results, de-tailed more fully in Section II-A, is to assist in the development ofa cost-effective enclosure fire-test program.
2. A process for selecting an existing fluid dynamic model/code which canbe utilized to investigate the thermal environment within complex NPPenclosures resulting from prespecified initiating fires. The resultsof this selection process are described in Sections IL-C, IIl-B-I, andIII-B-2.
3. A demonstration that, by experimental comparison, the selected model/code has the potential for addressing the fire-protection issues pre-viously described. Results of the efforts devoted to this demonstra-tion phase are provided in Sections II-C and III-B-2.
4. A description of BNL's involvement in the development of an enclosurefire test program structured to conform to the generic enclosure sur-vey delineated above. Further details summarizing this effort aregiven in Sections II-C and III-B-3.
5. A parametric study of the thermal environment within a plant-specificcontrol room resulting from a series of control cabinet fires. Theresults of this phase of the study are detailed in Section III-C.
6. An example of the use of the code in an existing nuclear plant. InSection III-D, results are shown in which the selected code was usedto analyze the spatial and temporal variations in a plant-specificcontainment building resulting from a fire in one of its reactor cool-ant pump bays.
7. A discussion in Section IV concerning where effort in this program iscurrently proceeding.

-4-
II. FIRE PROTECTION PROJECT DESCRIPTION
Within the four sub-program areas, outlined in the NRC Program Plan, there
is a division of effort between BNL and SNL which is essentially along the lines
of modeling and experiment. The remainder of this report addresses the BNL con-
tributions to the overall FPRP which are essentially the modeling and code
development efforts. A summary of the BNL contributions within each subprogram
is outlined below.
A. FIRE SOURCE CHARACTERIZATION (FSC)
Survey of Actual Fire Loads and Configurations in NPPs. A survey of a num-
ber of nuclear power plants has been performed and a tabulation made fire-area
wise of in situ and transient fire loads. The geometry of the fire area, clas-
sification as to room type (vault, corridor, or bay), ventilation conditions,
and equipment type and location were also noted. The survey was restricted to
fire areas where threats to safety-related equipment may originate. Plant fire
hazard analyses, licensee submissions for exemption from Appendix R require-
ments, PSARs, and FSARs were the sole sources of this survey.
Survey of Existing Research Results. The mass and energy release rate
characteristics of probable source fuels such as flammable liquids in pools and
cable bundles were assembled from the literature. This project has already been
detailed in previous letter reports to the NRC and is not discussed further
here.
Experiments to Augment Existing Data. Experiments have been planned to
fill gaps in the information. The fuel configurations in such experiments will
be well defined and the fire unrestricted by ventilation. The experiments will
cover a range of sizes (Btu content) for each fuel and configuration. A large
part of this effort is described below under the subject of test matrix
development.
Recommendations for Source Fires. Source fires are to be defined from the
envelopes of mass and energy rate curves and possibly species concentrations
also obtained from the above experiments and surveys. This project has already
been detailed in previous letter reports to the NRC from BNL and SNL and is not
discussed further here.
B. FIRE ENVIRONMENT DETERMINATION (FED)
Fire Environment Model and Computer Code Selection. This task involved a
survey of existing fire models and selection of one for development in order to
address the problem of determination of fire environments in nuclear power plant
enclosures with typical layouts of safety-related equipment. The model is to be
translated into a user-oriented computer code, capable of describing the envi-
ronmental parameters (temperature, velocity, fire-induced species concentra-
tions) in three dimensions as functions of time elapsed from fire inception.
-5-
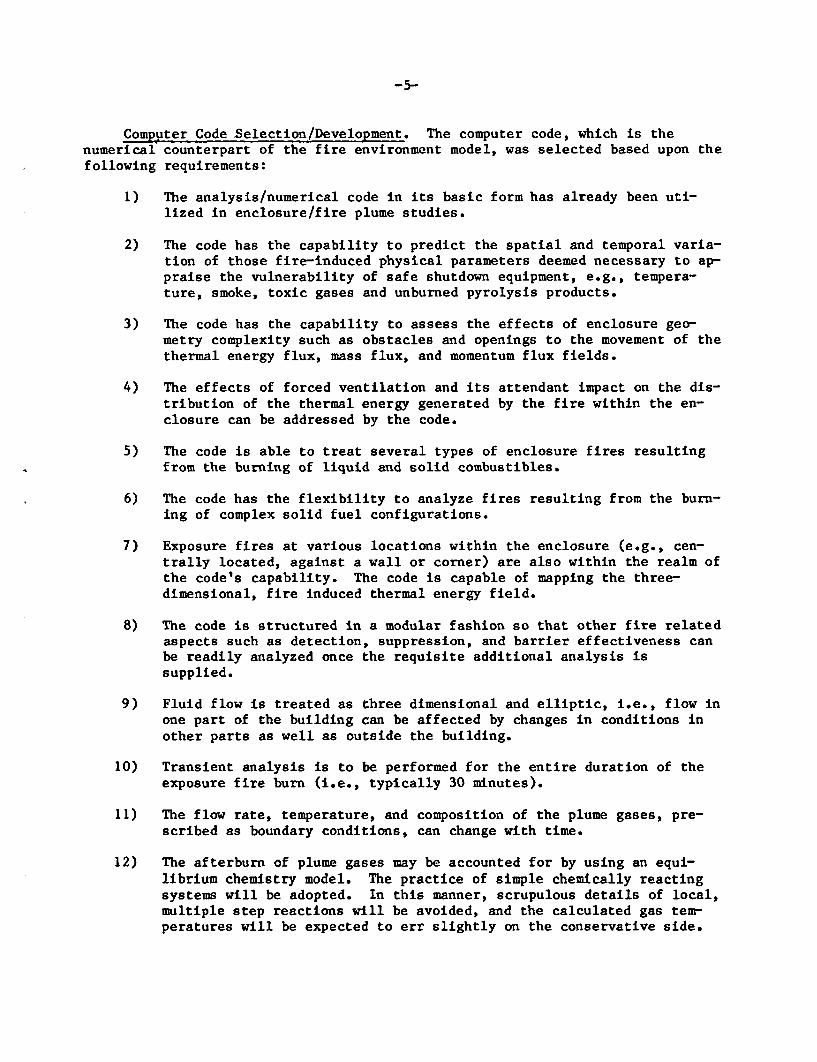
Computer Code Selection/Development. The computer code, which is thenumerical counterpart of the fire environment model, was selected based upon thefollowing requirements:
1) The analysis/numerical code in its basic form has already been uti-lized in enclosure/fire plume studies.
2) The code has the capability to predict the spatial and temporal varia-tion of those fire-induced physical parameters deemed necessary to ap-praise the vulnerability of safe shutdown equipment, e.g., tempera-ture, smoke, toxic gases and unburned pyrolysis products.
3) The code has the capability to assess the effects of enclosure geo-metry complexity such as obstacles and openings to the movement of thethermal energy flux, mass flux, and momentum flux fields.
4) The effects of forced ventilation and its attendant impact on the dis-tribution of the thermal energy generated by the fire within the en-closure can be addressed by the code.
5) The code is able to treat several types of enclosure fires resultingfrom the burning of liquid and solid combustibles.
6) The code has the flexibility to analyze fires resulting from the burn-ing of complex solid fuel configurations.
7) Exposure fires at various locations within the enclosure (e.g., cen-trally located, against a wall or corner) are also within the realm ofthe code's capability. The code is capable of mapping the three-dimensional, fire induced thermal energy field.
8) The code is structured in a modular fashion so that other fire relatedaspects such as detection, suppression, and barrier effectiveness canbe readily analyzed once the requisite additional analysis issupplied.
9) Fluid flow is treated as three dimensional and elliptic, i.e., flow inone part of the building can be affected by changes in conditions inother parts as well as outside the building.
10) Transient analysis is to be performed for the entire duration of theexposure fire burn (i.e., typically 30 minutes).
11) The flow rate, temperature, and composition of the plume gases, pre-scribed as boundary conditions, can change with time.
12) The afterburn of plume gases may be accounted for by using an equi-librium chemistry model. The practice of simple chemically reactingsystems will be adopted. In this manner, scrupulous details of local,multiple step reactions will be avoided, and the calculated gas tem-peratures will be expected to err slightly on the conservative side.

-6-
13) Buoyancy effects are accounted for by having an appropriate gravityforce term in the momentum conservation equation.
14) Fluid is allowed to enter or exit through the openings (vents, etc.)in the building, the magnitude and direction of the flow depending onthe local difference between the ambient and inside pressure, whichcan and does change with time.
15) Internal solid objects such as interbay walls, columns, horizontalworking platforms, etc., are simulated by specifying infinitely largeflow resistances in the appropriate momentum equations. As a result,the normal velocity components at solid surfaces will be zero.
After demonstrating that the code has the capability of complying with the
above requirements/criteria, the FPRP is structured for further code develop-ment. In conjunction, it will subsequently be used to compare with the "bench-mark" tests (see following) so that reasonable confidence is gained in its pre-dictions in new applications. The postulated fire conditions for the computersimulation will be the source fires developed in the FSC Project. Prior todirect comparison with results from the test program the code will be developedindependently of the FSC Project in the interim period, using characteristics ofknown test fires as input. Two sets 1-2 of previously conducted cable fire testshave been utilized in a series of preliminary benchmarking calculations. Theresults of these preliminary comparisons are described below.
Benchmark Testing. The generic enclosure survey has produced informationon typical enclosure geometries and equipment layouts so as to define a numberof generic enclosure geometries and generic equipment configurations. These en-closures, and to some extent the equipment, are to be replicated in a series offire tests where the energy and the mass inputs will be controlled to reproducethe postulated fire sources. The instrumentation is designed to monitor thevarious thermodynamic variables throughout the enclosures. The tests have beenplanned to cover a range of geometrical variables (length, width, and heightratios) and a range of fire severities (Btu outputs), so that the totality ofthe test results by itself permits a degree of confidence in extrapolation toother realistic situations.
Code Validation and User Package Preparation. The fire environment compu-ter code will be continuously refined by comparison with the benchmark tests un-til reasonable confidence is gained concerning the accuracy of its predictions.A complete package will then be developed for the NRC comprising the necessarysoftware, including a full listing of the program statements, flow charts, anduser instructions.
Combustion Product Migration. With the addition of existing submodels, the
computer code will be extended further to compute room-to-room migration oftoxic combustion products, which may affect the operability of equipment notwithin the enclosure containing the source fire. This capability will be usefulin evaluating designs/layouts for which fire dampers and I- or 3-hour fire bar-riers have been employed for fire protection but for which migration paths mayexist between fire areas.
-7-
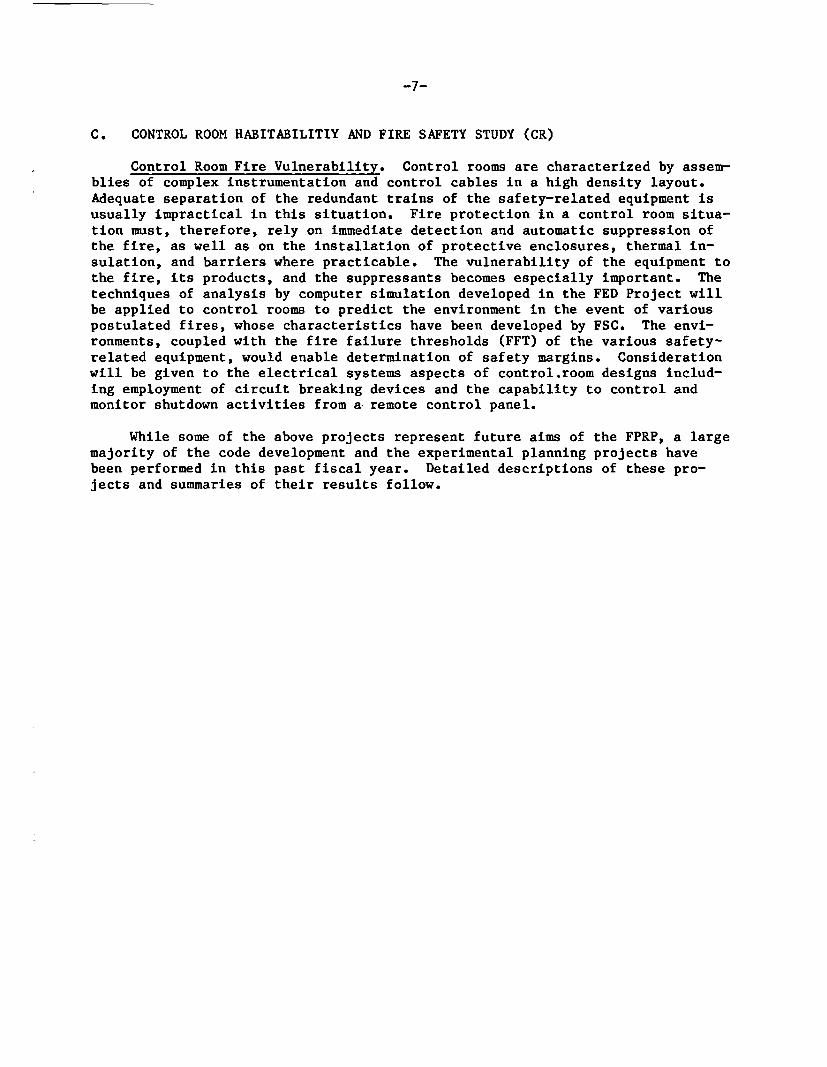
C. CONTROL ROOM HABITABILITIY AND FIRE SAFETY STUDY (CR)
Control Room Fire Vulnerability. Control rooms are characterized by assem-blies of complex instrumentation and control cables in a high density layout.
Adequate separation of the redundant trains of the safety-related equipment isusually impractical in this situation. Fire protection in a control room situa-tion must, therefore, rely on immediate detection and automatic suppression ofthe fire, as well as on the installation of protective enclosures, thermal in-sulation, and barriers where practicable. The vulnerability of the equipment tothe fire, its products, and the suppressants becomes especially important. Thetechniques of analysis by computer simulation developed in the FED Project willbe applied to control rooms to predict the environment in the event of variouspostulated fires, whose characteristics have been developed by FSC. The envi-ronments, coupled with the fire failure thresholds (FFT) of the various safety-related equipment, would enable determination of safety margins. Considerationwill be given to the electrical systems aspects of control.room designs includ-ing employment of circuit breaking devices and the capability to control andmonitor shutdown activities from a remote control panel.
While some of the above projects represent future aims of the FPRP, a large
majority of the code development and the experimental planning projects havebeen performed in this past fiscal year. Detailed descriptions of these pro-jects and summaries of their results follow.
-8-
III. BNL PROJECT SUMMARIES
A. FIRE SOURCE CHARACTERIZATION PROGRAM
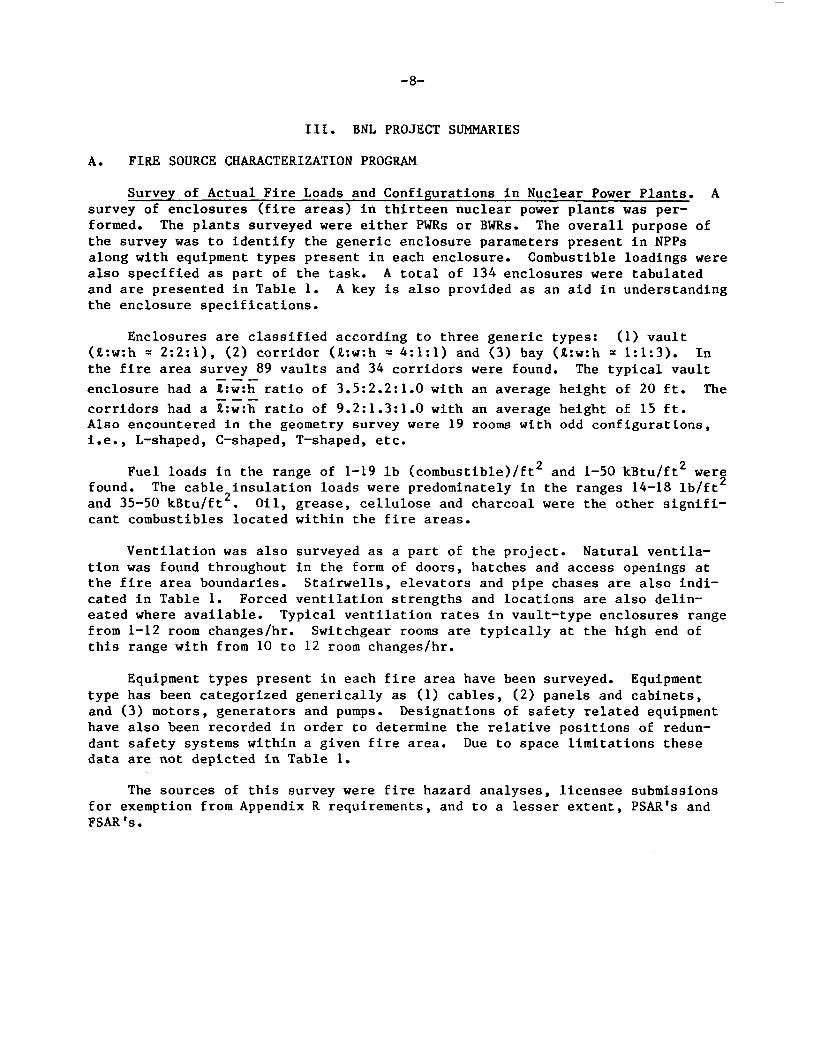
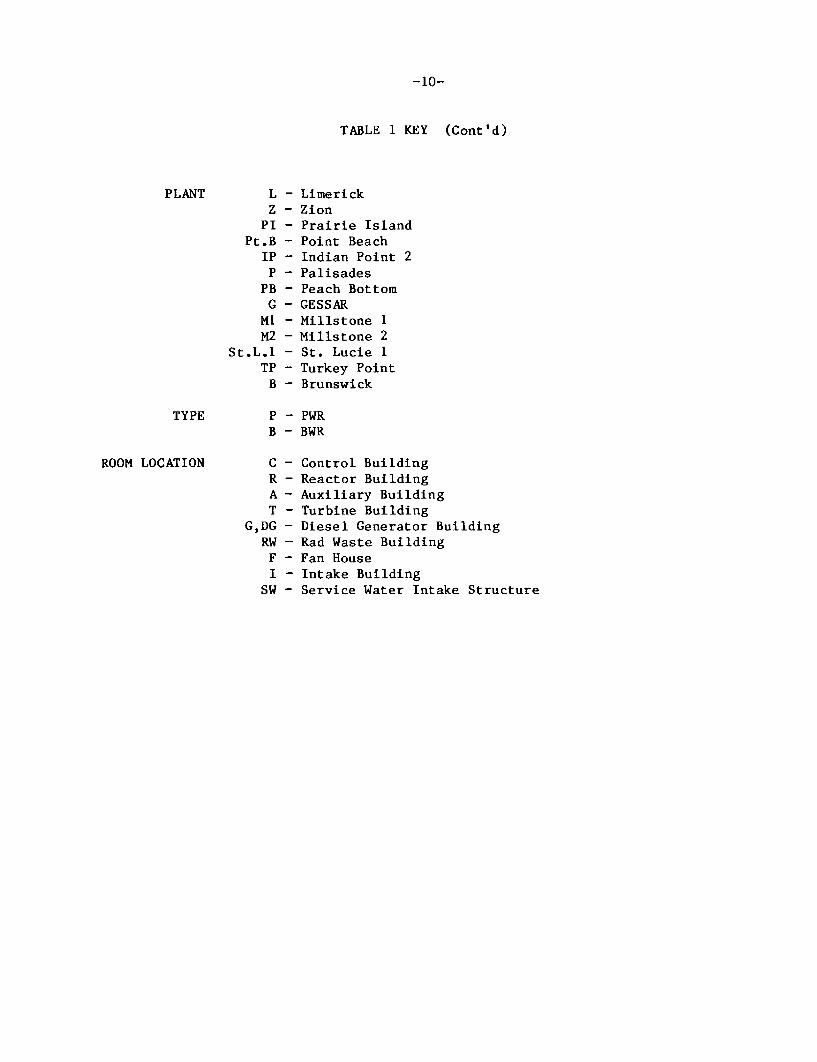
Survey of Actual Fire Loads and Configurations in Nuclear Power Plants. Asurvey of enclosures (fire areas) in thirteen nuclear power plants was per-formed. The plants surveyed were either PWRs or BWRs. The overall purpose ofthe survey was to identify the generic enclosure parameters present in NPPsalong with equipment types present in each enclosure. Combustible loadings werealso specified as part of the task. A total of 134 enclosures were tabulatedand are presented in Table 1. A key is also provided as an aid in understandingthe enclosure specifications.
Enclosures are classified according to three generic types: (1) vault(Z:w:h = 2:2:1), (2) corridor (L:w:h = 4:1:1) and (3) bay (L:w:h = 1:1:3). In
the fire area survey 89 vaults and 34 corridors were found. The typical vault
enclosure had a £:w:h ratio of 3.5:2.2:1.0 with an average height of 20 ft. The
corridors had a Z:w:h ratio of 9.2:1.3:1.0 with an average height of 15 ft.Also encountered in the geometry survey were 19 rooms with odd configurations,i.e., L-shaped, C-shaped, T-shaped, etc.
Fuel loads in the range of 1-19 lb (combustible)/ft 2 and 1-50 kBtu/ft 2 werefound. The cable insulation loads were predominately in the ranges 14-18 lb/ft 2
and 35-50 kBtu/ft 2 . Oil, grease, cellulose and charcoal were the other signifi-cant combustibles located within the fire areas.
Ventilation was also surveyed as a part of the project. Natural ventila-tion was found throughout in the form of doors, hatches and access openings atthe fire area boundaries. Stairwells, elevators and pipe chases are also indi-cated in Table 1. Forced ventilation strengths and locations are also delin-eated where available. Typical ventilation rates in vault-type enclosures rangefrom 1-12 room changes/hr. Switchgear rooms are typically at the high end ofthis range with from 10 to 12 room changes/hr.
Equipment types present in each fire area have been surveyed. Equipmenttype has been categorized generically as (1) cables, (2) panels and cabinets,and (3) motors, generators and pumps. Designations of safety related equipmenthave also been recorded in order to determine the relative positions of redun-
dant safety systems within a given fire area. Due to space limitations thesedata are not depicted in Table 1.
The sources of this survey were fire hazard analyses, licensee submissions
for exemption from Appendix R requirements, and to a lesser extent, PSAR's andFSAR's.

-9-
TABLE 1 KEY
ENCLOSURE CLASS
EQUIPMENT
FUEL LOAD
DOORS
ACCESS
VCB
VaultCorridorBay
(L:W:H=2:2:1)(L:W:Hm4:I:1)(L:W:H=I:1:3)
P - Panels, CabinetsG - Generators, PumpsC - Cables
lb - (combustible)/sq. ft.g - gallons
kB - thousand BTUkBsf - thousand BTU/sq. ft.
lb - pounds of greaseC' - cellulose (lb/sq. ft.)
char - charcoalNF - treated with flamemastic and not
considered flammable
x/yN - x-single/y-double North WallzE - z-single East WalleW - Elevator West Wall
N/y' - north wall/y ft widepc - pipe chase
d - downu - up
STAIRWELLS
HATCHES n/y 'xz'F
pcC
VENTILATION thorRATE AC
EX.SP.
GEOMETRY x
yzCLIXTA
- n hatches/y ft. x z ft.- floor- pipe chase- ceiling
isand cubic feet/minute- air conditioning- exhaust- supply
- L length/height- W width/height- H height in feet- C-shaped room- L-shaped room- I-shaped room- intersecting hallways- T-shaped room- triangular room
-10-
TABLE I KEY (Cont'd)
PLANT LZ
PIPt.B
IPP
PBG
MlM2
St.L.1TP
B
LimerickZionPrairie IslandPoint BeachIndian Point 2PalisadesPeach BottomGESSARMillstone IMillstone 2St. Lucie 1Turkey PointBrunswick
TYPE P - PWRB - BWR
ROOM LOCATION CRAT
G, DGRW
FI
SW
Control BuildingReactor BuildingAuxiliary BuildingTurbine BuildingDiesel Generator BuildingRad Waste BuildingFan HouseIntake BuildingService Water Intake Structure

WAIM"(ILR 1 2 3 4 5 6- 7- 8 9 10 II 12 13 14 li 16 17 i8 19 20 210 22 23 24 25 26
ENCLOSURE V V V V V V V V V V V V V V V V V V V V V V V C CCLASS
EQUIIIF'VNT P p p P p p p p p p P C,P P PO PG GP G G G G G G G PC P
IFUEL LOADCAMLE 1.6 1.0 3.1 1.7 3.4 2.6 2.0 2.7 1.2 6.0 13.5 17.8 2.6 3.0 1.0 1.0 6.9 2.3 1.0 16.9 7.8 2.7 16.6 3.9
OIL 2 g 34 g 8 g 1425 g 9.0IRAAS/41 SC.
0/1 I E IN 2 N 0/I N 2 N I N I I I N I N I I E" 3 N IE I N I NE•S 211 1 2 N 2 I I N 2w 0/I 0/I S 2 , S I S IS IS I tE 1 N I S I 5 3S 2E 3 N I 5 2 IS
3/1 N eW 0/I E 0/2 w I S I w eN 3/ow I E
ACCESS W/? S/8 E/I1' W N/8' PC E5/8'
STAIRWELLS I I 5 3
i(API, tl S FAN 3 2 MANY
VENTS
VENTILATION 5 FANSRAll 2.0 1.7 4.0 3.5 3.8 15. 10.8 8.0 3.0 3.6 11.0 16.0 4.8
vEIr I'ATIO11IM IENTAT ItO
I-i..a
(;1(7t41 TVf
PLANr
T"IONI(VA I I Oil
5.,2.6
22
L
C
6.53
3.3
L
C
9.24.4
14
C
C
5.4
4.8
28
2.81.9
24
3 4.3 3.6 2 3.1 3.9 4 .6 3.2 4.6 9 3.8 4 2.9
2.8 2 3.8 1.4 1.2 1.6 3.0 3.4 2.7 45 2.6 1.6 1.8
12 24 19 19 16.5 17 16.5 14.5 II 19 19 16.5 22
5.4 13.3 1.8 4.1 5.4 5.6 3.6 3.94.8 7.3 1 .4 3.1 4.5 4 1:1 0.7
28 12 12 14 II 19 14 .34 C
L
1I
R
z I z~ I~ PP 1 IPYB IpIPt8 PIIIP'sI PIF IIPI IP1I P181 IpfI lip Ip P P P I p I P I PP B L I Z I Z I L8 p p a
Z IP1
A I A I A I A I T I A I C I C
C IC IA IA IA IG R A IA IC A IA I C R
Table 1. Generic Enclosures Survey

ROLAM NtIMPER 27 28 29 30 31 32 33 35 1 36 37 38- 39' 40 41 42 43 44 46 47 48 49
4-4--I-I -- 4- .4-4-I- -4-4.- ~~ P.- - - - - - -- + - A - I-4 -
WACLOSIMIlE
CLASS
EQU IPMENT
FUEL LOADLADLE
OIL
TfA! S/ MI SC.
DOORS
AC:ECSS
STAIRWELLS
IIATCFICS
C C C C C Y C V C C C CC C C C C V V V CV V
P*1P P.GC PG PG G G,P P C.P CP C C C C C C C P,C PC P,G,C PC
8-2,' -l.0 6.) .21Bsf 4.5 6.6 1.5 10.1 9.1 42 0.7 5.9 NA Il8kBst 3 2
kýsA 52k0s0 11,3kBst 31.OkBst
I 0.4 14. 9k8$
.2 .9kBs .8 0.1 76kg 76k8 76k1 I.8kBst
I N N 0/ E/ E /N4 /0°' 3E 6E 26E WE 6E 2N N 0/46 IS
2 N 4 E 4 2 1E / N I S 0/ S0/ I 3 w 2 lW Iw I S 4S I Nw
I4 IS /IS IS I/* E
S/A' N/A' 2/1' S-2/101 S/4' N/4' 2/10' 2/8' E/PC S/9.51. N/ NE/3• N/3'
S/8' S/4' 10' Partlal
W/60'
2 2 2 Id 2d 2d 2 4
luI'.
9 2/2'x2'
VFNTI LAT I01, FAN 3 FANS SMOKE
kATE 8.5 0.7 20. 8.5 7.0 54. 2.0 2.0 21.0 54.0 EXHAUST
VENT I LATION IE N I4E
ORIENTATION IS IN-4'
GEGM/TRY 4.5 I14.3 5.7 6.7 6.7 7.1 7.1 6.3 4.9 8.3 8.8 6.5 17.9 9.4 16.2 6.8 18 6.9 5.7 19.4 2.1 6.3 10.1
0.9 2.4 1 1 1.7 1.8 4.1 1.3 4.6 1.7 0.6 1.7 0.9 0.3 3.8 1 1 5.7 4.I 1.9 2.1 5.0 4.0
10 19 L 16.5 16.5 15 15 18.5 16.5 L 14 t8 45 17.5 14 14 11 40 8 L1 9.5 9.5 16 L 46 16 26 C
PLANT P Pl Pta IP IP PtB Pt" IP PB G G P8 PB Z IP IP IP M1 M M1 MI MI
TYlE P P P P P P P P 8 B B 0 B P P P P p B BT B 8 8
PYI A A A C C A A A RW A A T T A A C F T T T T T R
LOCAI I(IN
Table 1. Generic Enclosures Survey

RO.9 N*9IIER 50 51 52 53 54 55 56 57 58 59 60 61 62 63 64 65 66 67
ENCLOSURE v V v V V V C V V V C C V V V V C VCLASS
EQUIPMENT G.C CPG CG.P C.GP G.CP PC PC C GC PC P,C PC P,C C.P P.C PC GC
FUEL LOAD
CABLE 4.SkBSf 2.5k6st 2.2kBsf 26.,SkBsf 7.7kBsf 40.2kBSf 33.9kBsf NA 47.6kBsf 10.3kBsf 34.2kBst 9.7kBsf NF NF NF NF F -OIL 0.5kB$ f 1.9kBs 64 g
TRANS/MISC. O.SkBsf O.71sf 3.SkBsf 1.3kBst 20 9 5.0kBsf 1.91,10
I N 2/ E N I E I N 2 E 0/I N 0/1 N IN I1 IN IW IN II IE IN INDOORS 2 W 0/I E IN I W I E I W W I I , E/12.12 IE Is , IS /E
I6 6E 0/1 E 1/2 S 0/I S I S ROLL-UP IW 1W
ACCESS N.S/3$ 2N/3' E/6. S/41 N/18x20 W/4x7 E/6x7 E/Ix3S/61 S/18x20 W/12x12 W/16xlO
STAIRWELLS 2 I 2 I I I I
HATCHES 1/20x20 1/20x20 2 PC 1/20x20 1/14xO F/IOxIO
VENTILATION 61.9 9.3 OUTSD 3 FANS INDEP. INDER. INDEP. AC AC AC/FAN AC ACRATE 2.0 AC 30.0 RECIRC. RECIRC. RECIRC. 45.2 25.4 17.0 19.0 4.0
RECIRC.
VENTILAI ION W/54- CEILING EX-FLOOlP IN-WALL W/51 W/IOxIO C/3x3 INnRIENTATIO(Y EXHAUST EX-CEIL. FAN E/5,x2. S/,5x.67 3W
W/204
CF(IME rRY 1.5 9.1 6.0 3.3 6.8 6.1 6.4 13.8 4.1 4.1 10.9 11.9 5.5 4.1 4.0 3.5 6.1 3.00.9 4 56 2.5 3.3 4.3 2.2 1.0 5.9 3.3 3 1.6 1.6 3.2 3.2 1.4 3.0 1.1 2.4
26 16 24 22 22 10 20 1 10 -20 '20 I 12 17 17 17 18 IS I8
PLANT MI HI Mt mI HI 2 M2 42 M2 1M2 M2 M2 St.LI St.LI St.LI St.LI St.LI St.LITYPE 6 8 a 6 6 P P P P P P P P P P P P P
6)04 R R R R R A A A I T T T A A A A A ALoI ATIO N l
I-
U3
Table 1. Generic Enclosures Survey

60. 69 70 71 72 73 74 75 76 77 78 79 80 81 82 83 84 85
FI'CLOSITPlI V V V V V V V V C C C C C,B V V V V
CLASS
FUIIN[ -T N C C C,C PC GC GC G,C G CP C,G CG C,G C G,C CG CG C GC
FUEL LOAD
CAPLE NF fif NF NF NF NF NF NF NF NF NF NF NF NF NF NF NF
OIL >0. 12.0WDs >" >0 >0
TRlANS/'AISC. 4.4kNsf 7.Oks f 4.OkBsf 4.41899 0.168sf -- 3.k Bf 5.6kBsf 5.41k68 6.1k8sf 7.4k01s 2.2,85f
IE IE is IN 3W IE 1W IE IN
C(U,'•S 1. IW I W 2S 2S l/IW
2E 0/IE
AC!ýE S C/8l10 S/191 S/3' S/I10 S/41 E/4' S/5x6 5/4x6 3N/4x6 S/5x6 E/7x6
w/2A(I/2 S/21(1/2 E/13(1/2 8/5x6 W/5x6 N-S HALL E/16x22 S/12x6
WALL) WALL) WALL) OPEN W/16x22
STA 14II IS 3 I I I
iNT ILATI O' A, IC FAN AC AC AC FAN EX. FAN AC N/A N/A N/A FAN FAN FAN FAN FAN N/A
RAT, 1.1 0.9 5.0 0.7 2.0 2.1 0.4 6.0 2.5 1.0 1.0 0.2 0.2 1.0
VC'ETILATION SFW C/Ix3 W/3 N/EXSxI.5
PIIFINTATIC0, DUCTS E/SP.Ix2
,;F(VETF" 2.1 1.7 S.T 1.8 1.9 2.9 2.1 1.1 5.9 7.5 7.5 2.9 47.2 1.0 1.1 1.1 2.4 5.6
1.1 .1 1.3 1.7 1.4 2.4 2.0 0.7 3.0 0.5 0.9 0.5 2.4 0.3 0.6 0.6 1.6 1.9
is 19.5 1)95 22 20 17 20 17.5 11.5 11.5 L 11.5 C 13.5 L 6. X 36.5 21 21 14.5 16
PLANT S.I St.LI StLI St St tLI SL.1I StLI St.L1 TP TP TP TP TF TP TF TP TP TP
TYPE F P P P P P F P F F P P P P P P P
RO(1 A AA A A A A A A A A A A A A A
LOCAT I ON
I
Table 1. Generic Enclosures Survey

ROOM NUMOER 86 87 88 89 90 91 92 93 94 95 96 97 98 99 100 101 102 103
EtJLOSUfRE C V V V V C C V V V V V V C C V V V
CLASS
EQUIPMENT C.P GP G PC GC G G,C G,C PC PC PC PC P,C PC GPC C,P G,P C,G
FUEL LOAD
CABLE NF NF NF NF NF NF NF NF NF NF NF NF NF NF NF NF NF NF
OIL >0 241b. 14Og >0 >0 >0 >0 320g 28g & 301b SIb
TRANS/MISC. 12.3kBSt 10 4.BkBsf >0 >0
N,E.S.W IN IE IE INN IN is IS 2N IN 2NE O/Iw
DOORS NUMEROUS 2W ISW O/IS 0/IN IE O/IE 2SE
0I/I 0/IE 0/ISW INW
ACCESS N/2.507 W/50x20 N/38x18 F/pc N/S
S17-1/2
x22
STAIRWELLS 2 2 I1
HATCHES
VEII7LATIOPI FAN N/A N/A AC N/A FAN 2 FANS 2 FANS FAN SP/EX SP/EX SPIEX SP/EX 3 FANS 4 FANS f NONE RB VENT
RATE 26.4 8.3 1.3 2.3 20.0 12.3 11.1 11.1 4.4 4.4 91.4 EA 91.4 8.2 3.0
VENTILATIOtN 2E/4x4 EX/NW EX/SW EX/NW EX/SW EX8/W/4.4 EXS/W/4x4 EX/Nw
lI ENINArIOt 4x4 404 SP/SE SP/2/NE SPS/E/4X4 SP/NS/16/12
GEOMETRY 26.1 2.8 1.3 4.7 2.1 2.4 6.7 5.3 8.8 1.4 1.7 2.6 2.6 7.1 10.4 0.8 1a 7 3.9
1.0 2.2 0.5 3.5 1.9 0.5 1.5 1. 1 3*3 1.1 1.1 1.3 1.3 0.5 1.7 0.6 I*3 3.1
II T 22.5 24 14.5 18 19 15 19 20 26.5 26.5 17 17 17 17 17 34.5 13
PLANT TP TP TP TP TP TP 8 8 8 B B B a 0 B B 8 8
TYPE P P P P P P 8 8 a 8 8 8 8 a 8 B B 8
P.YIM A T T C R R SW SW DO DG DOG D DO DG DG DG R R
1.(0ATIONG
ILii1
Table 1. Generic Enclosures Survey

RACM NUMI'ER 104 10M 106 107 108 109 1O 111 112 It3 114 115 11 t17 lie 119 120 121
ENCLOSUIIE V V V V V V V V V V V V V C V 8,V C,8 C.B
(A ASS
/UI•YELNT GC G,P G,F C,PG G G GC GC P.C GtP C P,G C GP.C CG C C C
FUEL LOAD
CASLE NF NF NP NF NF NF NF NF NF NF NF NF NF NF NF NF NF NW
OIL 155.4&251b 28 9 &41b 30g&3¢b 31b 601b 451b 211b 51b 61b 30q 301b 40g&1121b 451b
MANS'MISC. CHAR,1201b
IE IW INE is IN eEW IS 18 IE 1W I5DOORS ISE IN 1E lB IN IE
eNE
ACCESS E/28' E/25' PLUGS N/S EIW S/30- N/301 N/S/40'
W W
STAVI',. LLS I 1 I 1 I I I 4
HATCIES 1NF WALLS WALLS NE/20-20
IS CEILING CEILING
VENTILATION SP/EX SP/EX 10.5 EX 14.4EXISP N/A Avg. N/A N/A N/A
PATE 2.0 2.5 5.5 1.5 7.5 3.0 SPI.0&9.5 3.0 8.2 1.0 2.5 2.0 12.0
VENTILATION YP/ SP/Sx4 SP/S& SP/N&
ORIENTATION FLOOR FLOOR FLOOR
GEOMETRY 2.6 1.3 1.6 1.8 1.1 2.2 1.4 1.4 1.7 2.5 2.1 1.6 2.9 11.4 2.1 0.4 1.4 1.2
2.1 1.3 2.4 1.6 1.0 2.0 0.7 0.7 1.2 1.5 0.8 1.0 2.9 1.6 1.7 0.4 0.4 0.4
19 34.5 6 29 L 29 L 29 14.5 28.5 29 29 29.5 29 L 29 L 13 29 C 24 25.5 25.5 25.5
PLANT B 8 B B O B B a 8 B B B 0 a B B B
TYPE B B B B B B B B B B B a B B B B
A R RNRNRR R RIN R R R R R C C C
LIC•Al OI
0"I
Table 1. Generic Enclosures Survey

ROOM N•LW8ER 122 123 124 125 126 127 128 129 130 131 132 133 134
ENCILOSURE 8,V BV. C,B Cs Vs w V V'B V V CB V V
CLASS
EQUIPM?4ENT C C C C C C C G,C C P.C C PC GC
FUEL LOAD
CABLE NV NF NF NF NF NF NF NM NV NF NV NF NF
OIL 28g6411bTRANS/MISC. 5.0 C' 20 lb C'
IN IW IS IN IE 0/1E IE IE IS O/IE IE IN IS
DOORS IE IE 1W 1E
7/3W
ACCESS
STAIRWELLS 1
HATCHES
VENTILATIOII N/A N/A N/A N/A N/A N/A AC N/A SP/EX
RATE 0.6 0.7 0.6 0.4 34.2 2.5
VENTILATION NE/SE NE/SE HIE E SP/
ORIENTATION STAIRS
•EOMETRY 0.5 0.6 2.0 lI' 0.7 1.2 0.8 0.4 3.4 1.8 0.9 11.6 1.3
0.4 0.5 0.5 0.5 0.0 0.8 0.8 0.4 1.7 0.8 0.2 2.0 1.325.5 19 19 19 19 20 20 L1 20 9.5 19 19 L 19 34.5A
PLANT a B a B B B B B B B B B BTYPE B B B B B B B B B B B B B
ROOM4 C C C C C C C C C C C C R
LOCATION
I-
Table 1. Generic Enclosures Survey

-18-
Survey of Existing Research Results. BNL has assisted in the compilation
of mass and energy release characteristics of probable source fuels encountered
in critical fire areas. Typical fuels identified were cable insulation, lubri-
cating oil and grease, fuel oil along with more well-categorized combustibles
such as cellulose. Typical loadings of these combustibles are given in Table 1.
Experiments to Augment Existing Data. These preliminary experiments are
the responsibility of SNL. BNL has provided consultation and input (Table 1) to
aid in the selection of candidate source combustibles for testing.
B. FIRE ENVIRONMENT DETERMINATION PROGRAM
Fire Environment Model and Computer Code Selection. This project involved
two basic phases: (1) the determination of features required in the fire envi-
ronment model and (2) the selection of a computer code which best fulfilled the
requirements set forth in the model.
The first phase of this project is best typified as a set of criteria which
any candidate model must meet:
(1) The analysis/numerical code must have already been utilized in real-
istic enclosures similar to what may exist in NPPs.
(2) The code should already have the capability to predict the spatial and
temporal variation of those fire-induced parameters deemed necessary
to appraise the vulnerability of NPP safe-shutdown equipment.
(3) The code should already have the capability to assess the effects of
NPP enclosure geometry complexity, such as obstacles and openings, on
the movement of the fire-induced thermal energy flux, mass flux, and
momentum flux field.
(4) The effects of forced ventilation and its attendant impact on the re-
distribution of the flux field must also be an aspect that the code
can address.
(5) The code must have the flexibility for analyzing fires resulting from
the burning of complex solid fuel configurations.
(6) Exposure fires initiated at various locations within the enclosure
(e.g., centrally located or against a wall or corner) must be within
the realm of the code's capability. Thus mapping of the three-dimen-
sional, fire-induced thermal energy field is mandatory.
(7) The fire-induced flow should be treated as three dimensional and
elliptic, i.e., flow in one part of the building can be affected by
changes in conditions in other parts, as well as conditions outside
the building.
(8) Subsequent combustion of pyrolzate products may be addressed with the
unit-models employed in the code.

-19-
(9) Restrictive constraints imposed by the Boussinesq approximation should
not be included.
(10) The boundary conditions and field-grid structure inherent in the code
should be such that the effects of internal solid objects, such asinterbay walls, columns, horizontal working platforms, etc., on theflow field can be readily investigated.
Given the above set of criteria, five potential codes/sources were reviewed as
candidates for selection: PHOENICS/CHAM, UNDSAFEII/UND, DRAGON/EPM, (Unnamed)/NBS, and COBRA/EPRI.
A matrix (Figure 1) comparing the various attributes of each of the numeri-
cal codes was prepared to aid in the second phase of this project, viz., codeselection.
1 2 3 4 5 6 7 8 9 10
PHOENICS/CHAM * * * * * * * * * *
UNDSAFEII/UND * * *
DRAGON/EPM * * * *
(Unnamed)/NBS * * *
COBRA/EPRI * * *
Figure 1. Code Comparison Matrix
The CHAM-developed fluid flow analysis code PHOENICS was selected as the
model to be further developed.
CHAM of North America, Inc., specializes in the development and applicationof mathematical models of fluid flow, heat transfer, and chemical reaction pro-cesses. Its primary business is to provide technical services, computer soft-ware and support in the field of fluid flow simulation. Adaptations of the num-erical model utilized in PHOENICS 3 have been previously applied to fire hazardanalysis within the complex geometrical enclosures of NASA's vehicle assemblybuilding (VAB). The aim here was to determine the thermal environment in theVAB following accidental ignition of solid rocket motor(s). An additional fire-related study was performed by CHAM's sister organization in the United Kingdom:CHAM, Ltd. This study5 involved simulation of fire tests conducted to address
questions of smoke movement in shopping mall corridors. The following conclu-sions were drawn regarding the application of the model in the two cases:
-20-
(1) All results were qualitatively plausible.
(2) Calculated temperatures and velocities were in fair agreement withmeasured data, where applicable.
(3) These applications, though demonstrating the potential usefulness ofthe model/code, were not typical of cable insulation fires in NPPenclosures.
Computer Code Demonstration/Development. Included within the framework ofthis project was the preliminary validation of the computer code, PHOENICS, viacomparison with fire test results conducted with NPP environs in mind. Prior tothese test comparisons a summary of the numerical model is presented.
For purposes of the following analysis, a field model based on the solutionof governing partial-differential conservation equations of mass, momentum, andenergy is used. Gas flow is treated as three-dimensional, transient, and ellip-tic. The fluid is assumed to be a perfect gas with constant physical propertiespertinent to that of air. Density is calculated as a function of local tempera-ture. Buoyancy effects are accounted for by using local densities in all termsof the conservation equations, i.e., the Boussinesq approximation is not used.The turbulence effects are accounted for by using the two-e uation k-e modelof turbulence,6 with known refinements for buoyant flows. Cable tray assem-blies are simulated as combinations of perforated plates and blocks. The poros-ities of these plates and blocks are determined from the available informationon packing of cables. Thus, the presence of a cable tray disrupts the flow.Heat transfer to and from the redundant (target) cable trays is neglected. Thecalculation domain includes the whole room and some volume outside the door soas to account for the effects of the canopy over the door and to avoid the needof prescribing boundary conditions at the doorway. The fire heat source andwall heat losses are prescribed as functions of time. Further specific detailsof boundary conditions are presented later along with the discretizationdetails.
The independent variables are three coordinates (x,y,z) of a cartesiancoordinate system and time, t. Dependent variables include the three velocitycomponents (u,v,w), the pressure (p), the enthalpy (h), the turbulence kineticenergy (k), and its dissipation rate (W). The conservation equations are ex-pressed in the following general time averaged form:
at (pý) + div (p4 + J•) =S, (1)
where * stands for a general conserved property (u,v,w,h,k, etc.) and p, u,÷4, S* are density, velocity vector, diffusive flux vector, and source termfor ý per unit volume, respectively. The diffusive flux, J,, is given by:
J =-r eff, grad , (2)
where reff,* is the effective exchange coefficient for the transport of prop-erty *. The values of reff and S for different ý's are listed in Table 2.

-21-
Exci
TABLE 2
hange Coefficients (ry) and Source Terms (SO) for Different 0 Variables
r s
1 0 0 (Continuity)
U l1 eff 'P + a e u + e v-ax ax (eff ax) 3•y (eff ý-xC )
+ .(el8z ('eff ix')
V Ileff ap + 3 P u + l- e vay ax eff ay) 3 eff 3y)
8z (eff ay)
w lf p -B g BP u
W 1eff az - ref) +a(x eff iz)
ay c•eff -Z) + 3z Ieff T)
h "eff evil
q
k Tieff Gk -p + Gb
ak
C 1'eff k [(Gk + Gb) C1 - C2 Pe]
From the table:
j ef 0' 11 + •£(3 )
lt Me P pk/I (4)
-22-
G[u)2 2Ck~l~t f2 [(h +V +(w)]
2 + a2 2 2 (5)
2 22u + (av2
and
G t ap (6)b P a
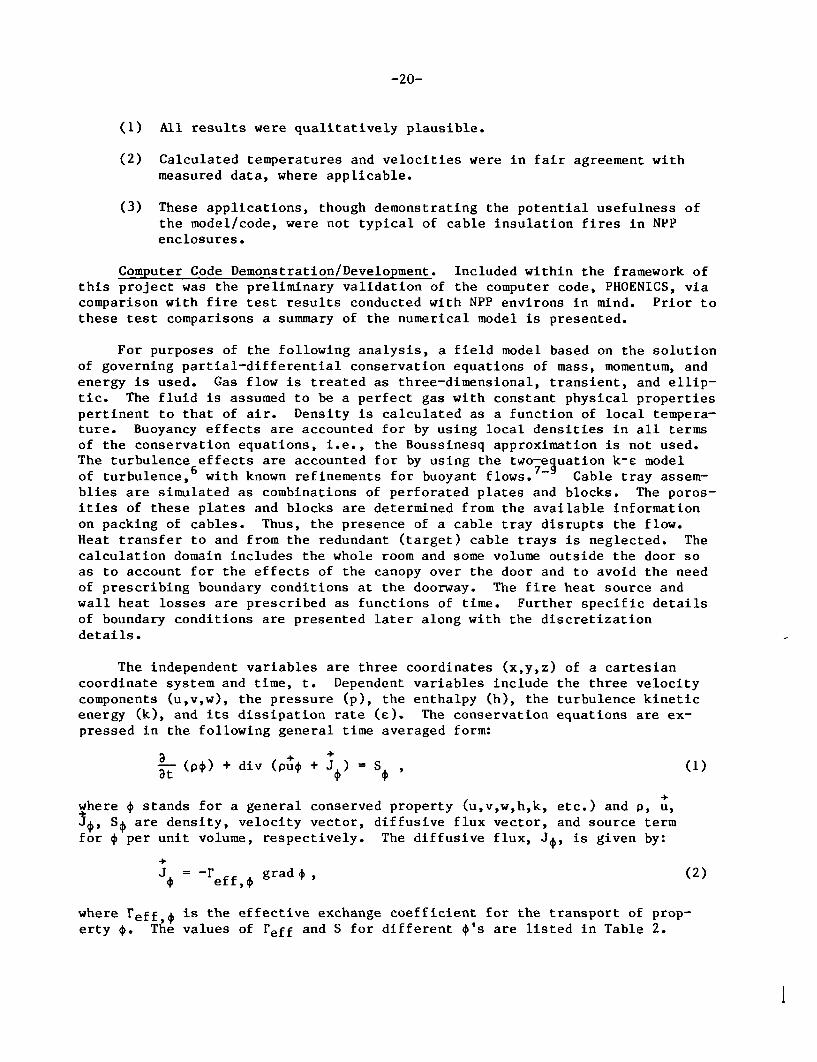
The buoyancy production term, Gb, represents the generation/suppression ofturbulence due to buoyancy. In stable stratification (fire enclosures), ap/azis negative; hence Gb becomes a sink term, and the turbulent mixing is re-duced. The turbulence model contains five empirical constants which are assign-ed the following standard values6:
C1 = 1.44
C2 = 1.92
CP = 0.09 , (7)
ak = 1.0 , and
oE = 1.3
The computational model consists of a finite difference solution of the setof elliptic partial differential equations expressing the conservation of mass,momentum, energy and other fluid variables in three dimensions. The code gener-ates local predictions of temperature, velocity, species concentrations, andpressure. These calculated values were then compared with the measured datafrom two series of tests conducted to simulate cable fires in NPP enclosures toprovide a preliminary validation of the computer model.
The first set of tests 2 were cable insulation burning experiments conductedby FMRC under the sponsorship of the EPRI. From this series of tests, a partic-ular case was chosen for analysis: (designated as Test #2 in Reference 2).This test was performed in the enclosure depicted in Figure 2. Forced ventila-tion was rated at 6 room changes per hour, and the cable tray array was placedin the center of the room and was arranged parallel to the ventilation flow (N
to S in Figure 2). The exposure fire consisted of 4 gal of methanol in a 36 in.diameter by 3 in. deep pool placed directly below the cable array. The totalpool fire heat release rate was 286 kW. The cable array consisted of both hori-zontal and vertical cables which were interconnected. The total burn time forthe test was to be 1200 s although sprinkler actuation occurred sometime priorto this set experimental duration. Boundary conditions for velocities aredetermined by the flow rates at the ventilation source(s). Initial conditionsfor density and pressure are those of ambient air. In order to establish

-23-
W-- 12.19 1 i
Open Web E,// Steel Joists
i BrancLines
iNear Cross Main
44 Exterior Framework.Eflx-Riser 50 mm x 150mm Lumber W2' 6')
spaced 0.61 m on center with2. 5 Sheetrock nailed to interior
Iceii ýbservation r..
DorWindows-L__
Dimensions in units of meters
Figure 2. Three-dimensional view of FMRC test structure.
initial conditions for other properties a "cold-flow" case is simulated with noheat source present. Reported data utilized in the computational validationwere (1) total heat release rate vs. time (input to code) and (2) one ceiling
gas temperature vs. time (used to compare with code predictions).
Problem formulation began with the setting up of grid structure simulationof the test enclosure. Due to symmetry within the room (at the plane of theventilation inlet and exhaust) only half of the room was considered as the cal-culation domain. A total of 3368 control cells were utilized in the xyz grid
structure. The load cell, supporting the methanol pan, was represented as asolid block. Cable trays were represented as solid blocks and plates (perfora-ted and/or impervious). The exposure fire was represented as a heat sourcespread over a region of computational cells. The heat and mass sources releasedgases having the same thermophysical properties as air (molecular weight of gasand enthalpy/temperature relation similar to air). Gaseous fuel was releasedwith specific heat and heat of combustion values as stated in Reference 2.Instantaneous chemical reactions (SCRS) were presumed. A total of seven caseswere modeled:
Case 1.1: Simulated fire test room with nominal heat release rate and ven-tilation rate, but without any cable trays. Calculated 3 time steps to givesolutions at t10, 20 and 60 s.

-24-
Case 1.2: Same as Case 1.1, but with cable trays. Calculations performedup to t=180 s.
Case 1.3: Same as Case 1.2, but with zero porosity of the top two rows ofcable trays. Calculations up to t=180 s.
Case 1.4: Same as Case 1.3, but with refined simulation of fire source,i.e., finite mass release considered with heat release. Also, heat source isspread over smaller volume (both height and width are reduced). Calculations upto t=180 s.
Case 1.5: All cable trays simulated as impervious plates and blocks. In-stead of using heat release rate directly as input, it is assumed that gaseousfuel was released with specific heat and heat of combustion values as reportedin Reference 2. Instantaneous reaction (SCRS) was assumed. The mass releaserate is determined as a function of the heat release rate and the heat of com-bustion. The region of mass release changes (increases) with time in accordancewith Reference 2. Total heat release rates were reduced to 85% to neglect theradiative component since it should have no effect on gas temperature as deter-mined by the code. Calculations performed up to t=240 s.
Case 1.6: Heat release rate determined from the following expression:
Q= min (QA (Qm + 1/2(QA-Qm)))
where QA is the measured heat release rate reported, and Qm is the heat re-lease rate of methanol in the equilibrium burning state (286 kW).
Case 1.7: Heat release rate adjusted to take an approximate account of thepyrolysis process. In Reference 2 it is indicated that there is a critical rateof mass release (;n" ) below which no cable combustion takes place. By using the
crvalues of QA' Qm' m cr' H (the heat of combustion for the cable), and A (the sur-
face area of the cable exposed to nominal heat fluxes), the following expres-sions are derived to estimate the heat release rate:
QA < Qm ; Q = QA
QA > Qm ; Q = Qm + b H
where mb represents the mass release rate of the cable which is in excess of;-° A and, hence, combustible.
cr
Cases 1.6 and 1.7 were run subsequent to the other five cases. These twocases were necessary because the code was overpredicting ceiling gas temperatureas a function of time utilizing the actual heat release rate as input. The im-provement effected in Cases 1.6 and 1.7 produces temperatures much more nearlyapproximating the measured data.
-25-
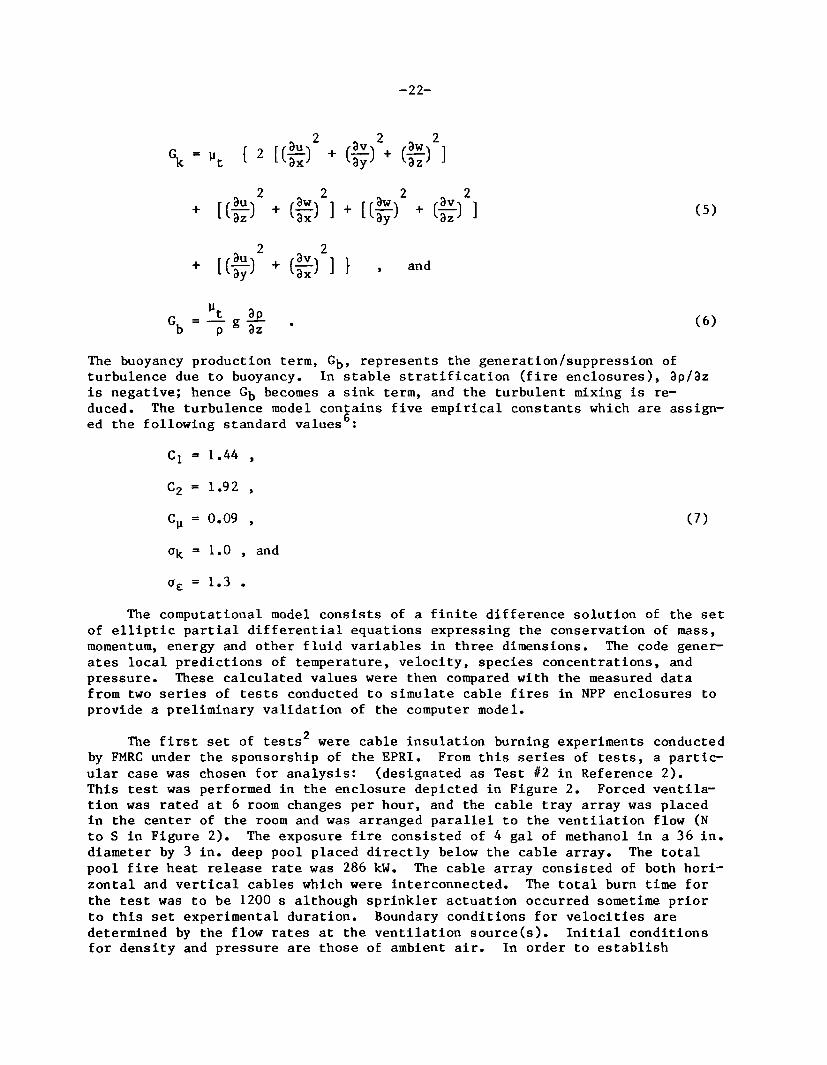
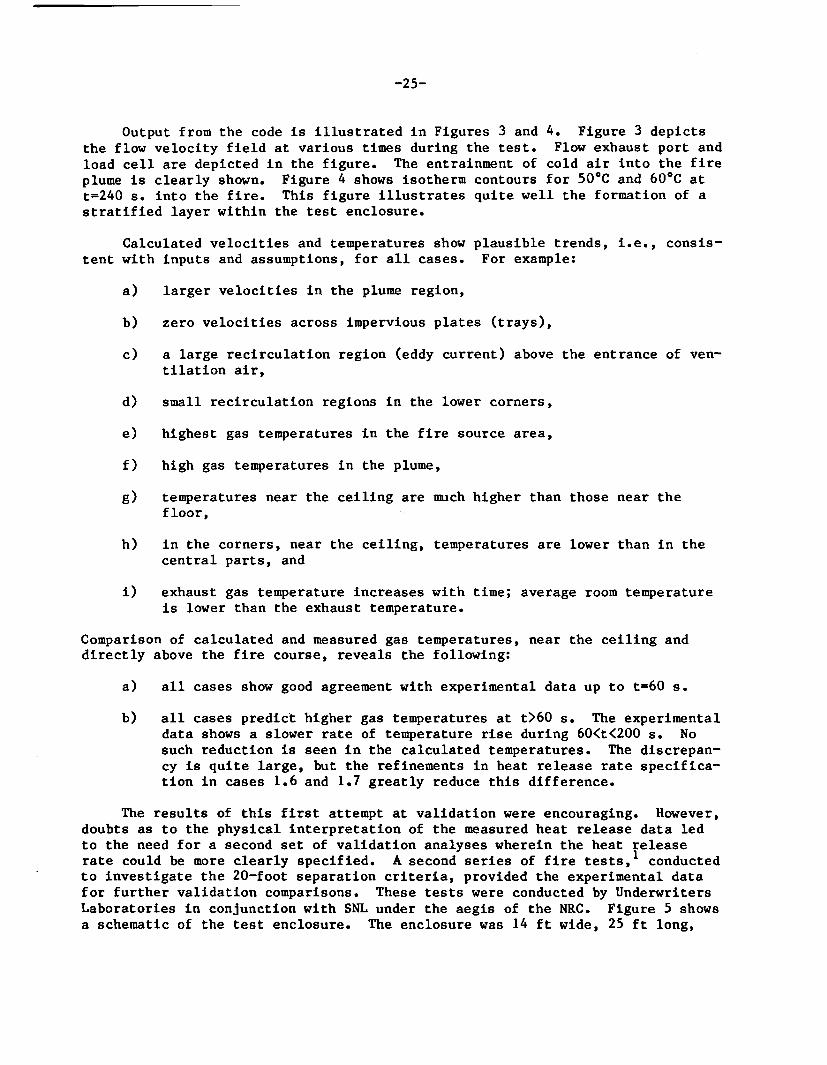
Output from the code is illustrated in Figures 3 and 4. Figure 3 depicts
the flow velocity field at various times during the test. Flow exhaust port and
load cell are depicted in the figure. The entrainment of cold air into the fire
plume is clearly shown. Figure 4 shows isotherm contours for 500C and 60*C at
t=240 s. into the fire. This figure illustrates quite well the formation of a
stratified layer within the test enclosure.
Calculated velocities and temperatures show plausible trends, i.e., consis-
tent with inputs and assumptions, for all cases. For example:
a) larger velocities in the plume region,
b) zero velocities across impervious plates (trays),
c) a large recirculation region (eddy current) above the entrance of ven-tilation air,
d) small recirculation regions in the lower corners,
e) highest gas temperatures in the fire source area,
f) high gas temperatures in the plume,
g) temperatures near the ceiling are much higher than those near thefloor,
h) in the corners, near the ceiling, temperatures are lower than in thecentral parts, and
i) exhaust gas temperature increases with time; average room temperatureis lower than the exhaust temperature.
Comparison of calculated and measured gas temperatures, near the ceiling and
directly above the fire course, reveals the following:
a) all cases show good agreement with experimental data up to t=60 s.
b) all cases predict higher gas temperatures at t>60 s. The experimentaldata shows a slower rate of temperature rise during 60<t<200 s. Nosuch reduction is seen in the calculated temperatures. The discrepan-cy is quite large, but the refinements in heat release rate specifica-tion in cases 1.6 and 1.7 greatly reduce this difference.
The results of this first attempt at validation were encouraging. However,
doubts as to the physical interpretation of the measured heat release data led
to the need for a second set of validation analyses wherein the heat releaserate could be more clearly specified. A second series of fire tests, 1 conductedto investigate the 20-foot separation criteria, provided the experimental data
for further validation comparisons. These tests were conducted by UnderwritersLaboratories in conjunction with SNL under the aegis of the NRC. Figure 5 shows
a schematic of the test enclosure. The enclosure was 14 ft wide, 25 ft long,

-26-
Li-'it-
S'I
5'
*1%
'I'
5'"
' .."-.5--
- -
60 secs.
-S.---
*1*-q
- - - = -- - - - - -
- - = - -
* - - - - /
* . . I
* - - 1 ' '. - ~ - -.---- -.----
* . - ,.----------- - - - -
*............- - - - -
* * - - - - -
- - - - -. -
* I I I ~ - -
120 secs.
-rIt~ '5-.. I -
- I.. -
- - -
- - -I
- -- I-
- - - /- - ,
-. - - /- -. - I- - -
- 'I, -
240 secs.
Figure 3. Velocity vector field through central vertical planeduring fire growth.

-27-
Figure 4. Isotherm contours (T=50*C, T=60°C) at 240 secs. into fire.

-28-
25' NOTE: DOOR WIDTH25- 8' fot Experiment24' for Experiment; 3 and Tests I and 2
21.5'.5'
in x 5' Pan (10 Gallonst Heptan. for Experiments 2
and 3) 15 Gallons Hea-
t [ sane so, Tests I and 2)
Cannopy
2 Vertical Trays
12.5% Fill (43 Cables)Tests 1-6 Only
PLAN
21.5' 2.5'4
Redundant IA~Cable Trays 4' a 8
ELEVATION SIDE
Figure 5. Fire enclosure details: preliminary fire experimentsNo. 2 and 3 and full-scale tests 1 and 2.
and 10 ft high, with a doorway in one of the 14 xl0 ft walls. Four preliminaryexperiments and six tests were conducted. Measured data consisted of wall andgas temperatures and heat fluxes at various locations. Vertical thermocouplerakes were installed at predominately three locations: 4 ft, 20 ft, and 25 ftfrom the wall near the source fire. Fuel mass and heat release rates were notmeasured. Subsequently, in order to use the test data for the verification ofnumerical models, heat release rates were calculated1 0 for four cases: Experi-ments 2 and 3 and Tests I and 2. In this present analysis all four cases havebeen simulated numerically by using the calculated heat-release rates as pre-scribed input. The salient features of these four cases are described below.
In Experiment 2 the doorway was 8 x 8 ft while in the other three cases thedoorway width was 4 ft. Experiments 2 and 3 involved 10 gal heptane pool fireswith no other combustibles. The pool was rectangular (I x 5 ft) and was placedalong the wall opposite the doorway. Tests I and 2 each had a 5 gal heptanepool fire with electrical cables as an additional combustible, all placedagainst the wall opposite the door. The cables were placed in two vertical

-29-
trays, suspended above the heptane pool, each loaded with 43 10-ft lengths of
cable. (12.5% fill). This amount of cable was estimated to equal 5 gal of hep-
tane in total heat release. Two horizontal cable trays (the redundant division)
were also located near the ceiling and 20 ft away from the fire source. In Test
1 all cables were unqualified and unprotected. In Test 2 the cables were quali-
fied but remained unprotected.
Because of the geometrical symmetry of the problem considered, only half of
the room was simulated. As illustrated in Figure 6, a total of 950 control
cells, with 5, 19, and 10 cells in the x, y, and z directions, respectively,
were used for all four cases. The grid distributions are non-uniform in each
coordinate direction, permitting good resolution of the solution in the particu-
lar area of interest. No-slip boundary conditions are applied at all solid sur-
faces, while at the calculation-domain boundaries outside the room, free bounda-
ry or constant-pressure conditions are applied. Heat source variations with
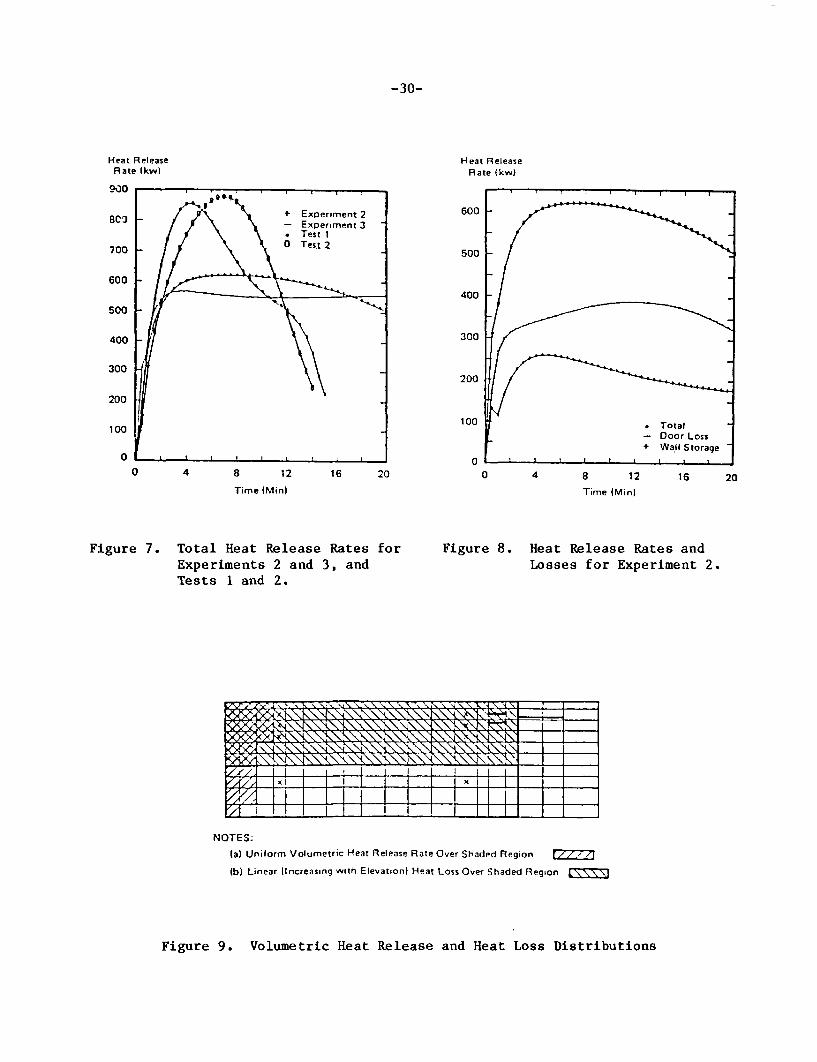
time as determined in Reference 10 are shown in Figure 7. Figure 8 depicts heat
release and loss rates for Experiment 2. Similar data are available for other
cases. Figure 9 illustrates the manner in which heat release and heat losses
F YFuel Pon
[1 X
Al_
Ir
1 2 3 4 5 6 7 8
4"20"
L 0 11 12 13
PLAN VIEW
14 15 16 17" 18 19
2(r
Redundant Cable Tray. Canopy
ELEVATION VIEW
Figure 6. Grid distributions, coordinate directions and thermocouplepositions (shown by "X").
-30-
Heat ReleaseRate Ikw)
900
Heat ReleaseRate (kwj
8C-3
700
600
500
400
300
200
100
0
600
S00
400
300
200
100
00 4 8 12 16 20
Time (Min)
0 4 8 12 16 20
Time (Min)
Figure 7. Total Heat Release Rates forExperiments 2 and 3, andTests I and 2.
Figure 8. Heat Release Rates andLosses for Experiment 2.
S I I -A I I I
NOTES.
(a) Unilorm Volumetric Heat Release Rate Over Shaded Region
(b) Linear (Increasing with Elevationi Heat Loss Over Shaded Region
Figure 9. Volumetric Heat Release and Heat Loss Distributions

-31-
were modelled across the enclosure volume. As noted in Case 1.4 of the previous
set of simulations, decreasing the size of the volume containing the heat source
has little or no effect on the accuracy of results while increasing computer
time. Likewise the effect of allowing the heat source to spread in a realistic
manner also has a negligible effect on the temperatures of concern (located-20 ft. from the fire). While the fire was not permitted to spread, the heat
release rate did follow the temporal distribution calculated from the experimen-
tal datal0.
All computations reported have been performed with the aid of a general
purpose finite-difference flow analysis comyuter code, PHOENICS 3 . An implicit,
successive substitution algorithm, SIMPLEST 1, has been employed. SIMPLEST is a
modified form of the SIMPLE algorithm. In both cases, global and species con-
tinuity is satisfied through solution of a Poisson-type pressure correction
equation.
Computations for Experiments 2 and 3 were performed up to 960 s in nine
time steps with At=60 s for the first two time steps and At=120 s for the last
seven time steps. For full scale Tests 1 and 2, smaller time steps (At=60 s
versus At=120 s) were used since transient heat release rates were larger and
steeper than those of Experiments 2 and 3. All computations were performed on a
32-bit mini computer (Perkin Elmer 3251), which is about ten times slower than a
CDC-7600 or at least twenty times slower than a CRAY-I. For each time step 100
overall iterations (sweeps) were performed. All solutions were well converged,
i.e., residuals were reduced by at least two orders of magnitude, and all flow
variables settled within 1%. Computer time requirement was about thirty minutes
per time step on the mini computer.
Figure 10 illustrates predicted transient development of doorway velocity
and temperature profiles for Experiment 3. At t=960 s these profiles are well
developed. The fire strength at this time is 548 kW. In order to assess the
similarity of profiles, data from Steckler's NBS room fire experiments12 are
shown in Figure 11. The comparison of Figures 10 and 11 provides a qualitative
verification of the calculated profiles. Figure 12 shows the comparison of pre-
dicted temperature near the horizontal (redundant) trays with the data of Exper-iments 2 and 3. The agreement is most satisfactory. There is a measurable in-
crease in temperature of the environment when the door width is decreased from 8
ft (Expt. 2) to 4 ft (Expt. 3). Figure 13 shows the comparison of predicted
temperature variations within the stratified hot layer as a function of distance
below the ceiling for Experiment 3 data. The stratified layer structure ob-
served in Experiment 3 is well predicted by the present model. Comparisons be-
tween predictions and measurements of temperatures recorded at several vertical
locations, 4 ft and 20 ft from the fire source, are shown in Figures 14 and 15,
respectively. The agreement is quite good in Figure 15. Figure 14 illustrates
a combination of two effects: 1) thermocouples, which were not shielded from
flame radiation, indicated higher gas temperatures than actually present, and 2)
quantification approximations made in the calculation of the heat release rate
have their greatest effect close to the source fire.
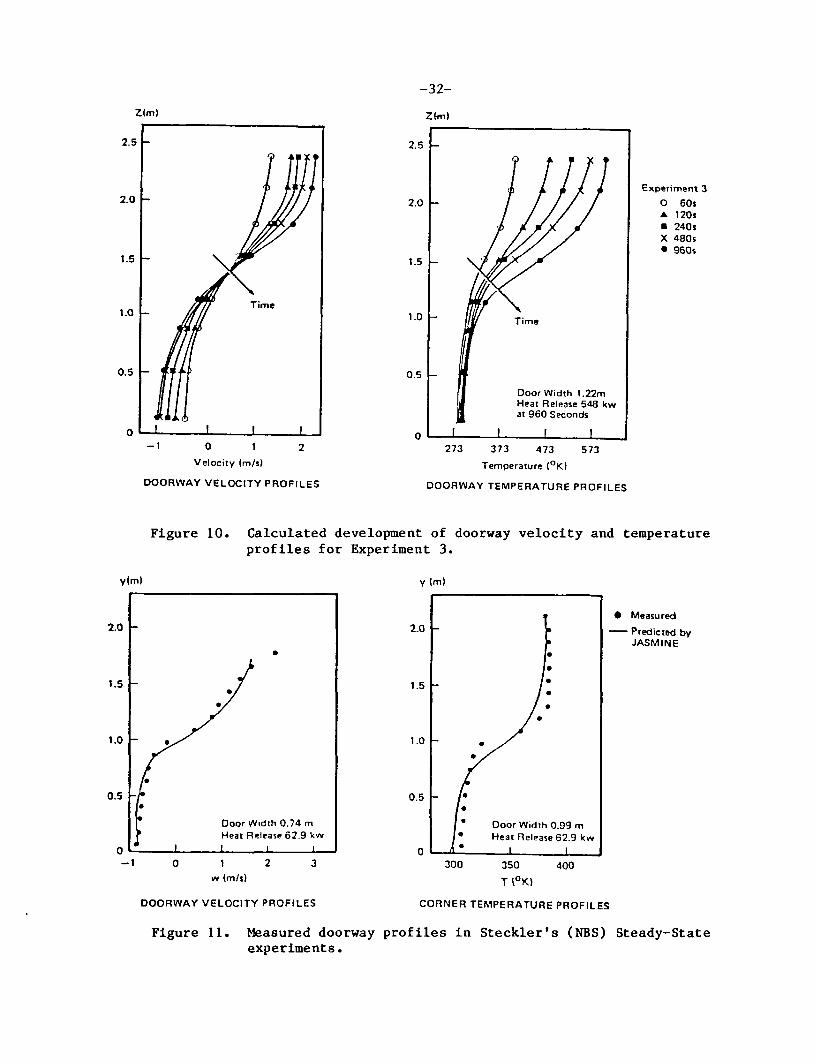
-32-
Z(m)
2.54 2.5
2.01- 2.0 ýExperiment 3
O 60sA 120sN 240sX 480s* 960s
1.51- 1.5k
1.0kTime
I F
1.0 1- Time
0.5
0
0.5
0
Door Width 1.22mHeat Release 548 kwat 960 Seconds
Li- L~L~L~ I-1 0 1 2 273 373 473 573
Velocity (mis)
DOORWAY VELOCITY PROFILES
Temperature (0
K)
DOORWAY TEMPERATURE PROFILES
Figure 10. Calculated development of doorwayprofiles for Experiment 3.
velocity and temperature
y(m) y (m)
2.0
1.5
1.0
0.5
2.0
1.5
1.0
0.5
0
* Measured
Predicted byJASMINE
0 a I I I-1 0 1 2 3
w (mIs)300 350 400
T °0K)
CORNER TEMPERATURE PROFILESDOORWAY VELOCITY PROFILES
Figure 11. Measured doorway profiles in Steckler's (NBS)experiments.
Steady-State

-33-
PHOENICS Prediction-d&Experiment 3
PHOENICS Prediction-&r Experiment 3-W-Experiment 2Temperature (°C)
500 r--r-
Temperature (OF)
T- t 932
400
300
200
100
0
752
572
398
212
Temperature (°C)
600 -- i
550
500
450
400
350
300
250
200 -
150
100
50
0
Temperature (OF)
- 1112
0) 1022932
842
11. - 752
-6622) _ 572
48213f \ 392
*• 302
212
122
020 25
I t I 13200 1500 18000 300 600 900 12
Time (Seconds)
0 5 10 15
Time (Minutes)
Temperatures are the Average of Thermocouples69.73 and 77.(1' Below Ceiling and Z from the Tray) 4" FROM SOURCE FIRE
Figure 12. Predicted and measuredtemperatures for Experi-ments 2 and 3.
Figure 14. Predicted and measuredtemperatures at severallevels for Experiment 3.
PHOENICS Prediction
Temperature (°C) -ArExperiment 3
Temperature (OC400,
-)
PHOENICS Prediction.*,.Experiment 3 Temperature (OF)
300
1' Bel
200
100
O
low Ceiling -
20' BelowC 'eiling 3'Below Ceiling
Measurements3" B o CilinI I I
572
392
212
I *=
550
500
450
400
350
300
250
200
150
100
50
I i i
1' Below Ceiling (TC73) Measurer
m 27 Below Ceilin(
Temperature (OF)
r 1112
1022
932
ment 842
g (TC74) 752
- 662
-- 572
- 482
392
:761 Z, 302
. . 212
122
2 2.20 250 0 300 600 900 12(
Time (Seconds)
00 1500 18]11 32o0 0 5 10 15
Time (Minutes)
Thermocouples are 2' in Front of Horizontal Tray
Figure 13. Predicted and measuredtemperatures at severallevels for Experiment 3.
20' FROM SOURCE FIRE
Figure 15. Predicted and measuredtemperatures at severallevels for Experiment 3.

-34-
To illustrate the overall flow pattern, a calculated velocity field forExperiment 2 at t=360 s is presented in Figure 16 in two longitudinal verticalplanes. Inspection of the velocity fields which are generated by the code re-veals the following.
Exp. 2
ELEVATION; Near the Wall; IX=NX t=360s
LL2iLL -. ---.
S ELEVATION; Near the Center, IX=1
Figure 16. Velocity Distributions in Two LongitudinalVertical Planes (Experiment 2)
* Strong upf low motion, induced by the fire source, impinges on theceiling and is deflected outward along the ceiling.
* The hotter air is removed from the enclosure through the upper part ofthe doorway.
* Cold air is drawn into the enclosure through the lower section of thedoorway. As expected, a recirculation eddy is observed between thedoor and the side wall.
Full scale Tests 1 and 2 were similar to Experiment 3 in all respects ex-cept for the presence of vertical cables above the heptane pool. These cablesalso burned, and as a result the heat release rates were higher and steeper thanthose of Experiments 2 and 3 (Figure 7). Figures 17 through 22 show the compar-isons of calculated and measured temperatures at various horizontal and verticallocations. The difference between predicted gas temperature near the cable andthe measured temperature (the thermocouples were located on the cable skin)shown in Figures 18 and 20 is plausible since it is is- due to the thermal iner-tia of the cables, which has not been included in the computational model. As

-35-
Temperature (°C) Temperature (OF)
- 1112
'redictionrement - 932
752
572
- 392
5 212
321500 1800
Temperature {°F)
--- 1 1112
932
752
572
392
212
0 300 600 900 1200Time (Seconds)
0 300 600 900 1200
Time (Seconds)1500 1800
Temperatures are the Average of Thermocouples 69. 73 and 77 Temperatures are the Average of Thermocouples 69, 73 and 77
Figure 17. Predicted and measuredtemperatures at I' belowceiling and 2' from thetray (Test 1)
Figure 19. Predicted and measuredtemperatures at 1' belowceiling and 2' from thetray (Test 2)
Temperature (OC)
500 r-'-
Temperature (OF)
1 932
Temperature (°C)
500 -Temperature (OF)
- 932
400
300
200
100
400
300
200
100
752
572
392
212
0 300 600 900 1200
Time (Seconds) ,
01500 1800
- M00 300 600 900 1200 1500 1800
Time (Seconds)
Figure 18. Predicted and measuredtemperatures at redundanttarget (Test 1).
Figure 20. Predicted and measuredtemperatures at redundanttarget (Test 2).

-36-
---- PHOENICS Prediction
-- Measurement
Temperature IOC)1100
1000
900
Temperature (OF)-2012
1832
1652
1472
1292
1112
0 5 10 15 20 25
Time (Minutes)
4" FROM FIRE SOURCE
Figure 21. Predicted and measured temperatures at several locations for Test I.
PHOENICS Prediction
Measurement
Temperature (°C)1100
1000
900
800
700
600
400 -
300
200
1000
Temperature (OF)2012
- 1832
1652
1472
1292
- 1112F4)
- 932(TC75) 1752
572
392
212- 0 1
0 10 15Time (Minutes)
20 25
20" FROM FIRE SOURCE
Figure 22. Predicted and measured temperatures at several locations for Test 1.
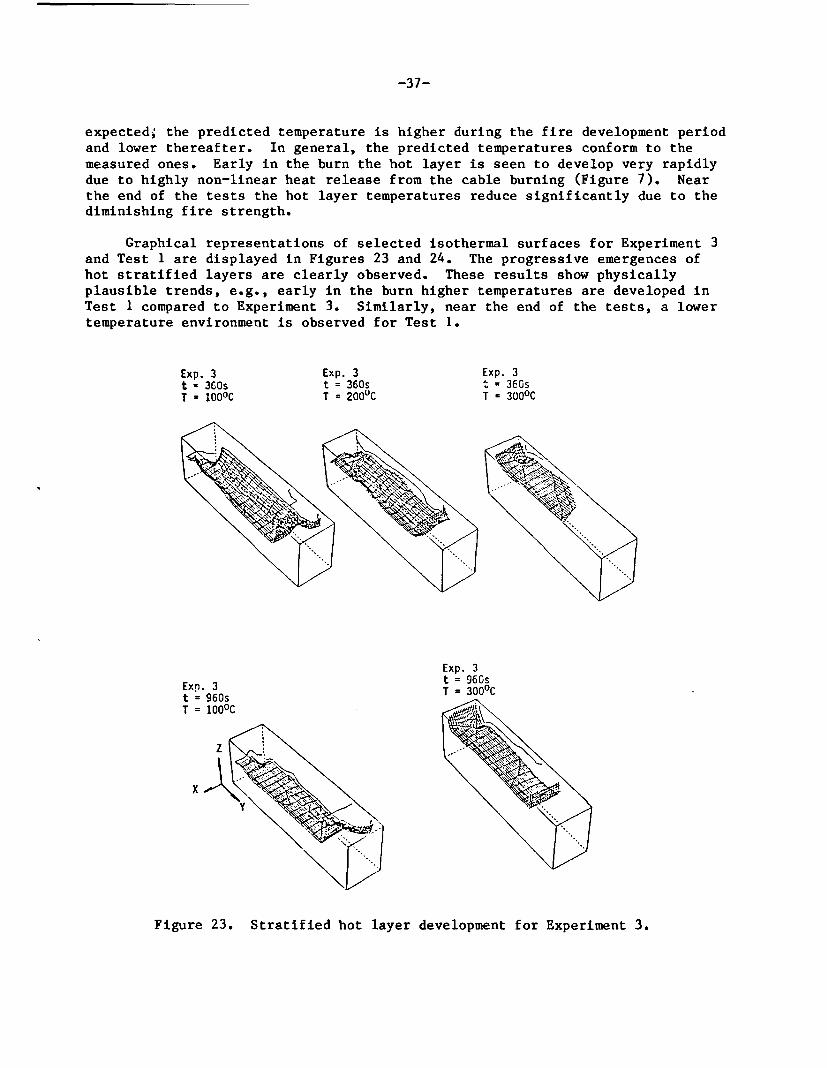
-37-
expected. the predicted temperature is higher during the fire development period
and lower thereafter. In general, the predicted temperatures conform to the
measured ones. Early in the burn the hot layer is seen to develop very rapidly
due to highly non-linear heat release from the cable burning (Figure 7). Near
the end of the tests the hot layer temperatures reduce significantly due to the
diminishing fire strength.
Graphical representations of selected isothermal surfaces for Experiment 3
and Test 1 are displayed in Figures 23 and 24. The progressive emergences of
hot stratified layers are clearly observed. These results show physically
plausible trends, e.g., early in the burn higher temperatures are developed in
Test 1 compared to Experiment 3. Similarly, near the end of the tests, a lower
temperature environment is observed for Test 1.
Exp. 3 Exp. 3 Exp. 3t = 360s t = 360s t = 360sT - 1000C T = 2000C T = 3000C
Exp. 3t = 960sExr,. 3 T =300°C
t = 960sT = 1000C
z '
Figure 23. Stratified hot layer development for Experiment 3.

-38-
Test I Test I Test '_t = 36Cs t = 3COS t = 36C3T = IUU°C T = 3C0 T = 6C'ýC
Test I t NOSt = 840s TT = I00°C
Figure 24. Stratified hot layer development for Test 1.
Calculated flow fields and temperatures are physically plausible. Velocityand temperature profiles across the doorway are similar to those reported bySteckler 1 2 for similar tests. In most respects, agreement between the calcula-ted and measured temperatures is excellent. Differences in agreement are due tothe effects of using unshielded temperature probes in areas dominated by radia-tive heat flux. The exercise has demonstrated the capability of this fieldmodel for prediction of the thermal environment within enclosures subjected to
pool/cable fires.
Benchmark Testing. The responsibility for the fire tests lies with SandiaNational Laboratory. BNL's contribution to this project consisted of assistancein establishing test matrices for the two cases of benchmarking tests to be per-formed: (1) baseline validation tests and (2) cabinet/control room tests.Additionally, BNL has provided input to aid in the selection of a test facilitywherein these validation tests will be performed.

-39-
BNL's primary contribution in this project has been via assistance in thedetermination of the necessary physical properties for validation of the mathe-matical model described previously. Interactive meetings with both SNL and theNRC have produced a set of requirements for test output data. The most promi-nent of these properties are temperature, heat release rate of the source fire,convective and radiative heat fluxes, flow velocities at various locations andcombustion species concentrations at several locations. Given these requiredproperties, instrumentation needs for the test enclosure have been specified.This process specified an important set of considerations to be utilized in theselection of a test facility.
Test matrix development was also performed within the interactive meetingframework outlined above. Once the required physical test output data had beenidentified, decisions were reached regarding the number and type of tests neededto specify the properties within the matrix parameter space consisting of geome-try, flow conditions, source fire type and strength, and obstacle configurationswithin the test enclosure. Both the physical matrix reqVirements and the timefactors generated by the matrix design represent prominent additional factors inthe test site selection process..
C. CONTROL ROOM HABITABILITY AND FIRE SAFETY STUDY PROGRAM
An additional application of the computational model recently initiated isthe study of the fire environment within the LaSalle NPP control room which isbeing performed in conjunction with the PRA analysis of the RMIE project. Fig-ure 25 presents an example of the computational cell model of the LaSalle con-trol room. Objects, such as cabinets, control consoles, etc., are modelled assolid blocks. The plan view shown is at floor level and depicts such items asconsoles, desks, chairs and other flow obstacles present at this level. Thecomplete conputational model consists of several (7) horizontal slices covering
I I I I I I I I I1.8-II owns MORE 1
16- 1 SEE NnllllIEN 0 SORENSON NEun II MEEN Eon. 1
14- I NEON REEnENE NIENENEE mass II none sEEn I
12- niou Enon II Ross I1 summEn U Enos IV 0-I EEN m ENEEEEBN U KEEN
Y 10-1 Bonn a monsoons 0 most
I EoEN U Eo gnomo on K OmUnE I8- I EoEn BEnn sEml I
I KERNE mElEE 16- 1 MilEN NENEENNE EEE**EEE*E*EE I
I BEUEsEEmEENEE oE *ENEEEENEIEEEB4- EKEENEENEENmEE EEEEENEEEEEE I
I * lnN llEEENU nE En EDEEnEneElNEK i2-I I E ENEKEEEEE EN EU EU
4I8 12 me a a 28 32 I4 8 12 16 20 24 28 32 36
X
Figure 25. Horizontal Cross-Section
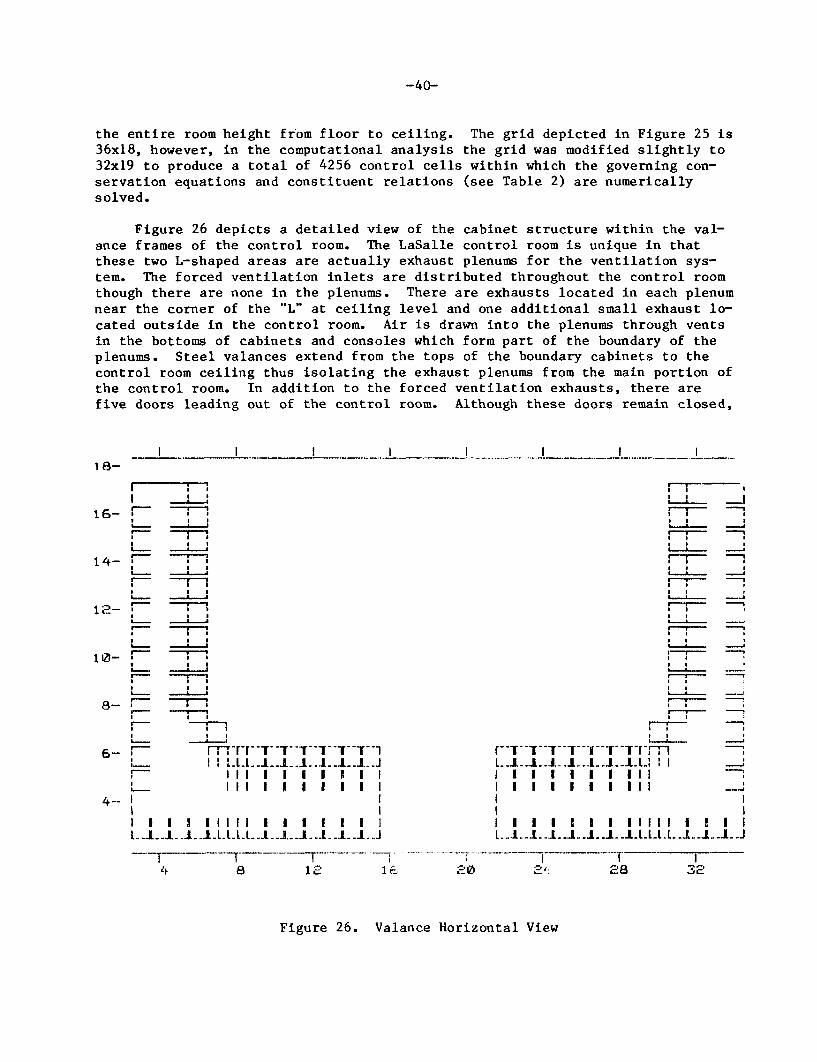
-40-
the entire room height from floor to ceiling. The grid depicted in Figure 25 is36x18, however, in the computational analysis the grid was modified slightly to32x19 to produce a total of 4256 control cells within which the governing con-servation equations and constituent relations (see Table 2) are numericallysolved.
Figure 26 depicts a detailed view of the cabinet structure within the val-ance frames of the control room. The LaSalle control room is unique in thatthese two L-shaped areas are actually exhaust plenums for the ventilation sys-tem. The forced ventilation inlets are distributed throughout the control roomthough there are none in the plenums. There are exhausts located in each plenumnear the corner of the "L" at ceiling level and one additional small exhaust lo-cated outside in the control room. Air is drawn into the plenums through ventsin the bottoms of cabinets and consoles which form part of the boundary of theplenums. Steel valances extend from the tops of the boundary cabinets to thecontrol room ceiling thus isolating the exhaust plenums from the main portion ofthe control room. In addition to the forced ventilation exhausts, there arefive doors leading out of the control room. Although these doors remain closed,
I I I I1 8-
I ; I
16-
7--
14-
12-
a a-1-, a a
* I
-'--1 a aa I
* a
* a
-rna a
~~7~~~~* a
10- ,-T-F_
18- '
6- r-'' " "''"""8- __ a : L .I . _.I . _J ..
4---11 II
,W. ._J
: --- -- ---
*
* a aI..l _l.l .l .l .l .l [_.. -.. . -.ll .
a a a20 a 8 3
I I
4 8 IJ 1 &
Figure 26. Valance Horizontal View
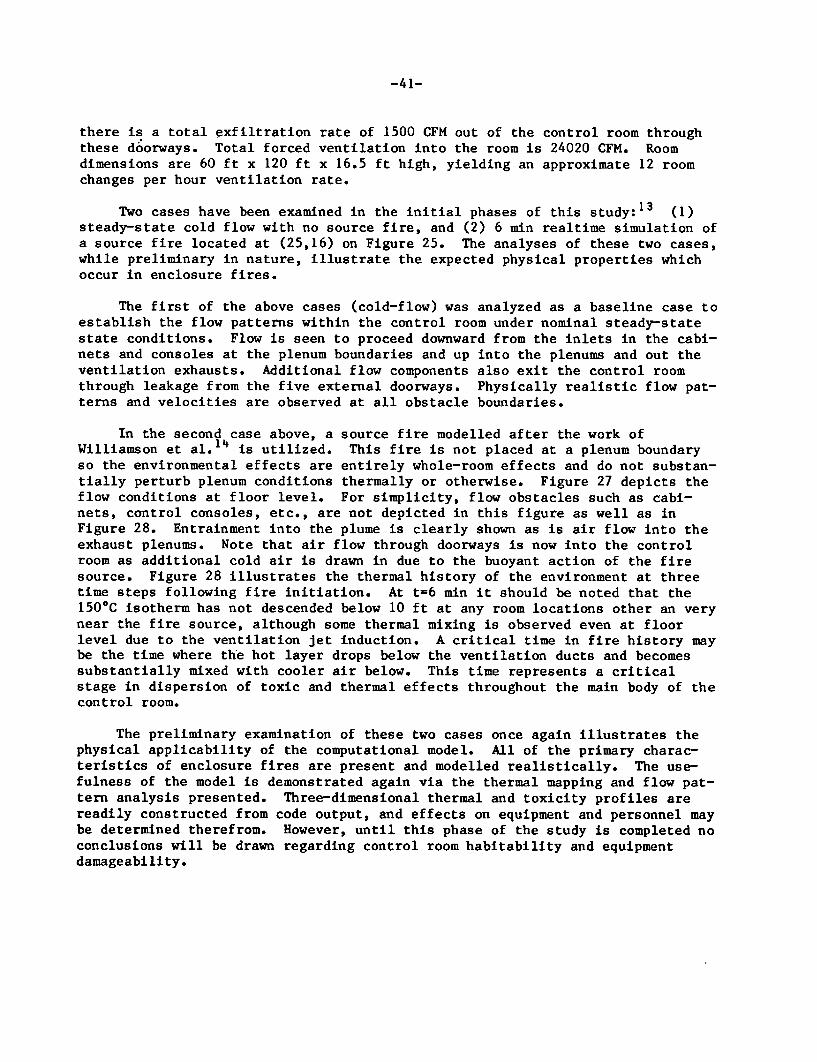
-41-
there is a total exfiltration rate of 1500 CFM out of the control room throughthese doorways. Total forced ventilation into the room is 24020 CFM. Roomdimensions are 60 ft x 120 ft x 16.5 ft high, yielding an approximate 12 roomchanges per hour ventilation rate.
Two cases have been examined in the initial phases of this study: 1 3 (1)steady-state cold flow with no source fire, and (2) 6 min realtime simulation ofa source fire located at (25,16) on Figure 25. The analyses of these two cases,while preliminary in nature, illustrate the expected physical properties whichoccur in enclosure fires.
The first of the above cases (cold-flow) was analyzed as a baseline case toestablish the flow patterns within the control room under nominal steady-statestate conditions. Flow is seen to proceed downward from the inlets in the cabi-nets and consoles at the plenum boundaries and up into the plenums and out theventilation exhausts. Additional flow components also exit the control roomthrough leakage from the five external doorways. Physically realistic flow pat-terns and velocities are observed at all obstacle boundaries.
In the second case above, a source fire modelled after the work ofWilliamson et al.14 is utilized. This fire is not placed at a plenum boundaryso the environmental effects are entirely whole-room effects and do not substan-tially perturb plenum conditions thermally or otherwise. Figure 27 depicts theflow conditions at floor level. For simplicity, flow obstacles such as cabi-nets, control consoles, etc., are not depicted in this figure as well as inFigure 28. Entrainment into the plume is clearly shown as is air flow into theexhaust plenums. Note that air flow through doorways is now into the controlroom as additional cold air is drawn in due to the buoyant action of the firesource. Figure 28 illustrates the thermal history of the environment at threetime steps following fire initiation. At t=6 mmn it should be noted that the150%C isotherm has not descended below 10 ft at any room locations other an verynear the fire source, although some thermal mixing is observed even at floorlevel due to the ventilation jet induction. A critical time in fire history maybe the time where the hot layer drops below the ventilation ducts and becomessubstantially mixed with cooler air below. This time represents a criticalstage in dispersion of toxic and thermal effects throughout the main body of thecontrol room.
The preliminary examination of these two cases once again illustrates thephysical applicability of the computational model. All of the primary charac-teristics of enclosure fires are present and modelled realistically. The use-fulness of the model is demonstrated again via the thermal mapping and flow pat-tern analysis presented. Three-dimensional thermal and toxicity profiles arereadily constructed from code output, and effects on equipment and personnel maybe determined therefrom. However, until this phase of the study is completed noconclusions will be drawn regarding control room habitability and equipmentdamageability.

-42-
Fire Strength = 600 kw
JZ=J / t = 360
S
Maximum Velocity = 0.65 m/sI Z=1
~s4
4. ~4 4 .
'4 .--
I--- -
' \ '
\\ ' -- -
.\ 1
.4 ~% . -- -
- .-I -
- , -* - I -* p I
*6 '1 ~ -.
* I ~ *I IPf
.' 4% ~ 4.* -' 4 -
- I'S -
- I.4
4
' %.4S*S 4
.4
ffQ
J
. . . I I __ .
-4
-- 4
~4~444%
4.44.4
S. ~ ~4
--- 5-
~44.
S
I
I - -
* -5--
I - - - -
F --
/ --- -/ ---- -
* S
-. 4
-4
- .1
- ,
f
I
f
.4
SY
/
I
'4----
I''
I'''
°
%
%
&
I
!
S
.4\4
'I~ I
t"p
Figure 27. Velocity distributions in horizontal plane IZ=1 at t=360S
D. PLANT-SPECIFIC CODE APPLICATION
As part of the on-call assistance program BNL is called upon to reviewlicensee-submitted requests for exemptions to Appendix R of 1OCFR50. The thesisis that a postulated, probable fire in one of the Reactor Coolant Pump (RCP)bays would not affect the operation of redundant safe shutdown equipment. Fire-induced containment temperatures and pressures were calculated, through themodels employed, to stay within acceptable limits. The scope of our review en-tailed answers to the following questions:
Are the fire scenarios analyzed, albeit somewhat simplified, reflec-tive of what may realistically occur? In other words, does the physi-cal model employed represent an adequate replication of the majorfire-related phenomena?
" Concomitantly, does the mathematical model portray adequately thesemajor physical processes?
• Does the actual scenario analyzed bound the overall problem?
" Are the conclusions drawn from the calculated results valid, uniform-ly, with the assumptions made to provide a tractable analysis?

-43-
Fire strength = 600 kwt = 120 ST = 1500C
z
7
Figure 28. Development of temperature field at various times.
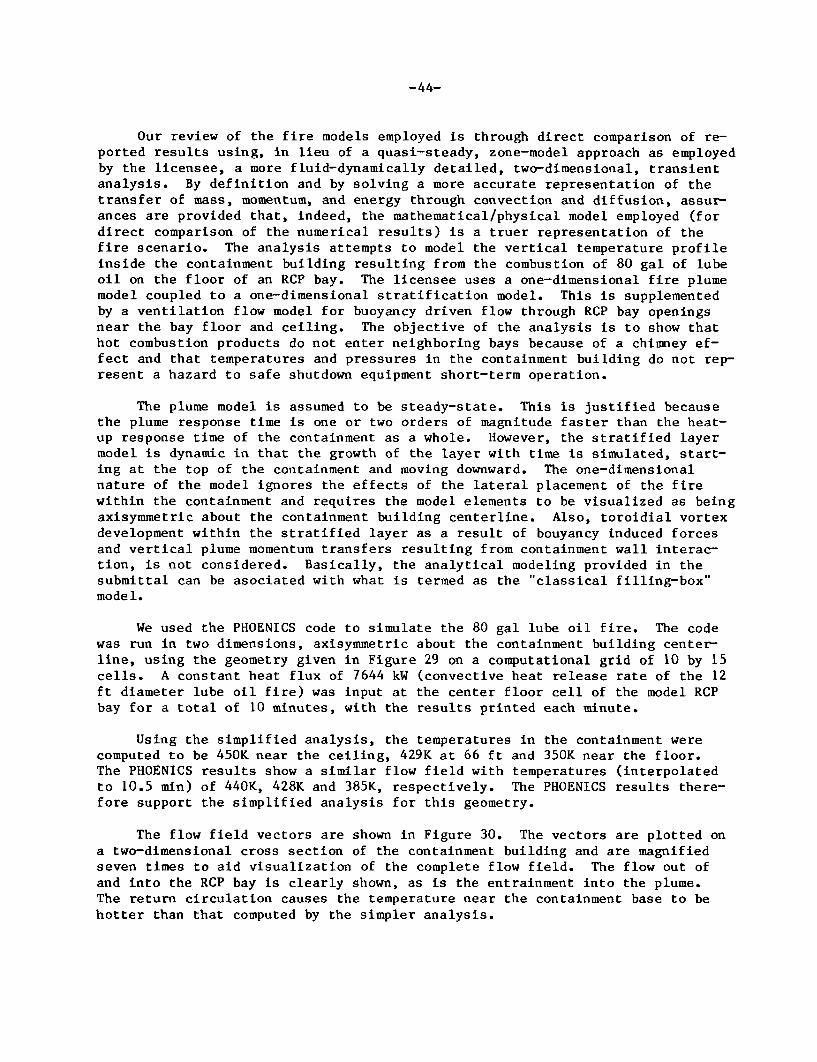
-44-
Our review of the fire models employed is through direct comparison of re-ported results using, in lieu of a quasi-steady, zone-model approach as employedby the licensee, a more fluid-dynamically detailed, two-dimensional, transientanalysis. By definition and by solving a more accurate representation of thetransfer of mass, momentum, and energy through convection and diffusion, assur-ances are provided that, indeed, the mathematical/physical model employed (fordirect comparison of the numerical results) is a truer representation of thefire scenario. The analysis attempts to model the vertical temperature profileinside the containment building resulting from the combustion of 80 gal of lubeoil on the floor of an RCP bay. The licensee uses a one-dimensional fire plumemodel coupled to a one-dimensional stratification model. This is supplementedby a ventilation flow model for buoyancy driven flow through RCP bay openingsnear the bay floor and ceiling. The objective of the analysis is to show thathot combustion products do not enter neighboring bays because of a chimney ef-fect and that temperatures and pressures in the containment building do not rep-resent a hazard to safe shutdown equipment short-term operation.
The plume model is assumed to be steady-state. This is justified becausethe plume response time is one or two orders of magnitude faster than the heat-up response time of the containment as a whole. However, the stratified layermodel is dynamic in that the growth of the layer with time is simulated, start-ing at the top of the containment and moving downward. The one-dimensionalnature of the model ignores the effects of the lateral placement of the firewithin the containment and requires the model elements to be visualized as beingaxisymmetric about the containment building centerline. Also, toroidial vortexdevelopment within the stratified layer as a result of bouyancy induced forcesand vertical plume momentum transfers resulting from containment wall interac-tion, is not considered. Basically, the analytical modeling provided in thesubmittal can be asociated with what is termed as the "classical filling-box"model.
We used the PHOENICS code to simulate the 80 gal lube oil fire. The codewas run in two dimensions, axisymmetric about the containment building center-line, using the geometry given in Figure 29 on a computational grid of 10 by 15cells. A constant heat flux of 7644 kW (convective heat release rate of the 12ft diameter lube oil fire) was input at the center floor cell of the model RCPbay for a total of 10 minutes, with the results printed each minute.
Using the simplified analysis, the temperatures in the containment werecomputed to be 450K near the ceiling, 429K at 66 ft and 350K near the floor.The PHOENICS results show a similar flow field with temperatures (interpolatedto 10.5 min) of 440K, 428K and 385K, respectively. The PHOENICS results there-fore support the simplified analysis for this geometry.
The flow field vectors are shown in Figure 30. The vectors are plotted ona two-dimensional cross section of the containment building and are magnifiedseven times to aid visualization of the complete flow field. The flow out ofand into the RCP bay is clearly shown, as is the entrainment into the plume.The return circulation causes the temperature near the containment base to behotter than that computed by the simpler analysis.

-45-
5 1.054m
I
I
MAINCONTAI NMENT
VOLUME
PENETRATIONROOM
-2C. 12:n
I14.63 m.14.02 M
6.71 m
CEILINGVENT
RCPBAY
OPERATING "iFLOOR F_ _
COOLERELEVATION
I
BASEVENT0.00 m
Figure 29. Containment model geometry.

-46-
i!s98
Figure 30. Flow vectors plotted on a 2-D cross section of the containmentbuilding. The vectors are magnified seven times for details. Theplume updraft is 6 M/S, the downdraft is 5-10 cm/s, and the inflowat the RCP bay base is I M/S. (Graffic: CHAM Copyright)

-47-
A comparison of the temperature profiles in the containment outside the
plume are shown in Figure 31. In Figure 32, we have plotted the isotherms in
the containment building at the end of the fire. The lines are contours from
386K to 450K in 2K increments and show the resulting stratification.
This comparative study has shown that PHOENICS can be used to benchmark
simplified analysis. By using a more fluid-dynamically detailed, two-
dimensional, transient analysis, we were able to closely produce the results of
the quasi-steady, zone-model approach employed and feel confident that the model
adequately portrays the major physical processes under the assumption of a sim-
plified geometric portrayal of the containment building.

-48-
PHOENICS
411
0 4 ft. DIAMETER OF FIRE tburn =!410 S.
+ 4 ft DIAMETER OF FIRE tbum= 5 6 4 0 S.
A 12ft DLAMETER OF FIRE t1•rn =62eS.
380~/
i370
360/
350
340 c
320 ---------- I
0 5 10 i5 20 25 30 35 40 45 50
ELEVATION FROM CONTAINMENT BASE (M)
Figure 31. Containment temperature profile at end of variously sized
lube oil fires.

-49-
1981I
Figure 32. Lines of constant temperature in the containment buildingafter the postulated fire. The contours range from 386Kto 450K in 2K increments.

-50-
IV. FUTURE DIRECTIONS - BNL
A. Validation with Cabinet/Control Room Test Data
This phase of the study awaits the output from the cabinet/control room
tests. These tests will enable the final set of validation simulation studieswithin the program. Additionally, these tests will provide the basis of compar-ison for including a series of upgrades within the framework of the computation-
al model. These upgrades include (1) modifications for chemical reactions, and(2) modifications for heat losses to enclosure boundaries and objects within the
enclosure. Modifications for chemical reaction include provisions for the fol-lowing: transport of toxic gases, chemical reaction with SCRS (Simple ChemicalReaction System) model, and one-step, finite-rate reaction model. The second
and third portions of this task enable the elimination of the need to specifyheat release rate data as input to the code. Modifications for heat losses in-
clude the effects of both convective and radiative heat transfer. Radiativeheat losses will be calculated eventually by the incorporation of a six-fluxradiation model. These heat loss modifications will enable the detailed examin-ation of heat flux effects on sensitive equipment located within the enclosure.
B. Parametric Study of Fires Within NPP Control Rooms
Of concern in both this study and also the RMIEP probabilistic survey is afully involved cabinet fire and its effects on adjacent and non-adjacent controlroom systems. BNL and CHAM are to utilize the code described above to modelthis control room scenario. The control room will be divided into a three-dimensional grid as detailed above, and various source fire strengths and loca-tions will be examined in the context of both deterministic and probabilisticanalyses. The effects of both the thermal environment and the toxic gas envi-ronment will be determined by utilizing the analytical techniques developed todate in this project.
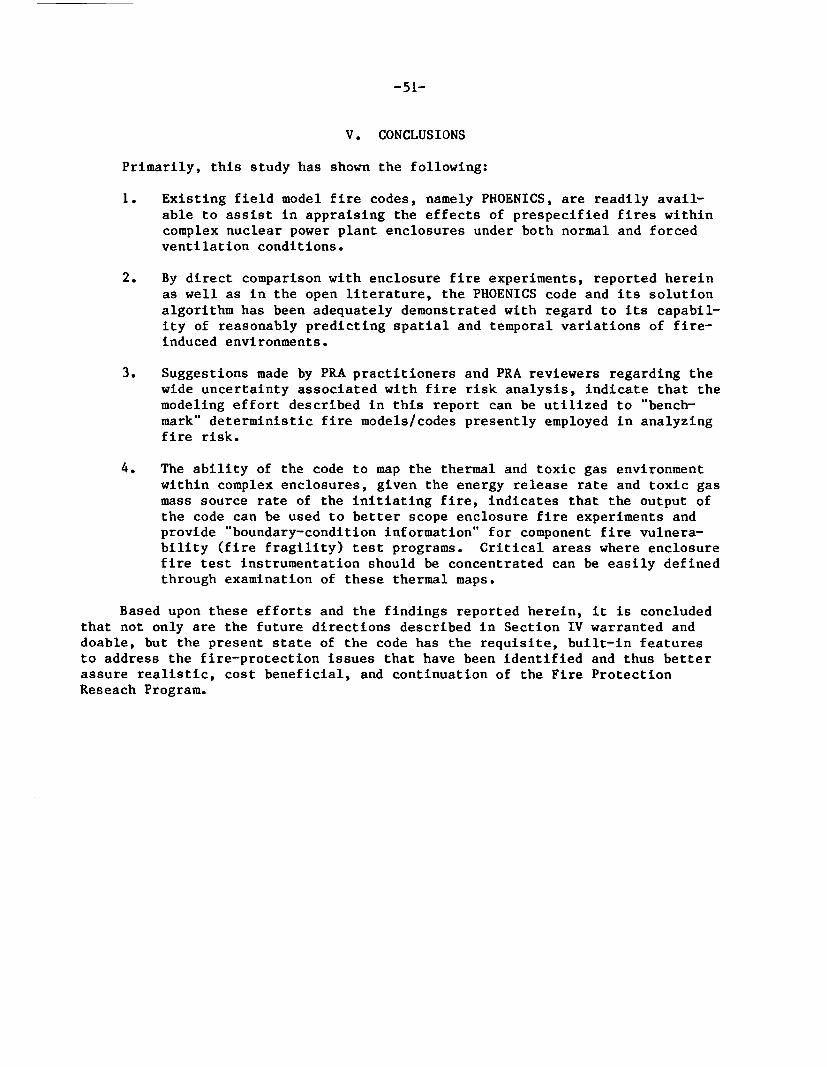
-51-
V. CONCLUSIONS
Primarily, this study has shown the following:
1. Existing field model fire codes, namely PHOENICS, are readily avail-
able to assist in appraising the effects of prespecified fires withincomplex nuclear power plant enclosures under both normal and forcedventilation conditions.
2. By direct comparison with enclosure fire experiments, reported herein
as well as in the open literature, the PHOENICS code and its solution
algorithm has been adequately demonstrated with regard to its capabil-ity of reasonably predicting spatial and temporal variations of fire-
induced environments.
3. Suggestions made by PRA practitioners and PRA reviewers regarding the
wide uncertainty associated with fire risk analysis, indicate that themodeling effort described in this report can be utilized to "bench-
mark" deterministic fire models/codes presently employed in analyzing
fire risk.
4. The ability of the code to map the thermal and toxic gas environment
within complex enclosures, given the energy release rate and toxic gas
mass source rate of the initiating fire, indicates that the output of
the code can be used to better scope enclosure fire experiments andprovide "boundary-condition information" for component fire vulnera-
bility (fire fragility) test programs. Critical areas where enclosurefire test instrumentation should be concentrated can be easily definedthrough examination of these thermal maps.
Based upon these efforts and the findings reported herein, it is concluded
that not only are the future directions described in Section IV warranted anddoable, but the present state of the code has the requisite, built-in features
to address the fire-protection issues that have been identified and thus better
assure realistic, cost beneficial, and continuation of the Fire Protection
Reseach Program.

-52-
REFERENCES
1. Cline, D.D., Von Riesemann, W.A., and Chavez, J.M., "Investigation ofTwenty-Foot Separation Distance as a Fire Protection Method as Specified in10CFR50, Appendix R," NUREG/CR-3192, SAND83-0306, October 1983.
2. Hill, J.P., "Fire Tests in Ventilated Rooms-Extinguishment of Fires inGrouped Cable Trays," EPRI Project RP 1165-1-1, Report NP-2660, prepared byFactory Mutual Research Corporation, Norwood, MA.
3. Spalding, D.B., "A General Computer Program for Fluid Flow, Heat Transferand Chemical Reaction Processes," presented at the International FEM-Con-gress, Baden-Baden, Germany, November 17-18, 1980.
4. Planning Research Corporation, "Solid Rocket Motor/Vehicle Assembly Build-ing Inadvertent Ignition Effects Study," NASA KSC-DF-441, September 1981.
5. Cox, G., "A Field Model of Fire and its Application to Nuclear ContainmentProblems," Proceedings of the CSNI Specialist Meeting on Interaction ofFire and Explosion with Ventilation Systems in Nuclear Facilities,LA-9911-C, Vol. I, p. 199, April 1983.
6. Launder, B.E., and Spalding, D.B., Mathematical Models of Turbulence, Aca-demic Press, London, 1972.
7. Markatos, N.C., Malin, M.R., and Cox, G., Mathematical Modeling ofBuoyancy-Induced Smoke Flow in Enclosures," Int. J. Heat Mass Transfer,Vol. 25, No. 1, pp. 63-75, 1982.
8. Markatos, N.C., and Cox, G., "Turbulent Buoyant Heat Transfer in EnclosuresContaining a Fire Source," Seventh International Heat Transfer Conference,Munchen, 6, p. 373, 1982.
9. Bagnaro, M., Lauuisset, M., and Lockwood, F.C., "Field Model Prediction ofSome Room Fires: Steady and Transient," The 21st National Heat TransferConference, pp. 107-114, Seattle, WA, July 1983.
10. Nowlen, S.P., "Heat Release Rates During the Sandia/UL 20 Foot SeparationTests," Letter Report prepared for Electrical Engineering Branch, Divisionof Engineering Technology, Office of Water Reactor Safety Research, U.S.Nuclear Regulatory Commission, DOE 40-550-75, NRC FIN-AlOIO, June 1984.
11. Spalding, D.B., "Mathematical Modeling of Fluid Mechanics, Heat Transfer,and Chemical Reaction Proceses," CFDU, Report No. HTS/80/1, 1980, A LectureCourse, Imperial College.
12. Steckler, K.D., Quintiere, J.G., and Rinkinen, W.J., "Flow Induced by Fire
in a Compartment," NBSIR-82-250, National Bureau of Standards, 1982.

-53-
REFERENCES (Cont'd)
13. Singhal, A.K., and Tam, L.T., Progress Report: "Fire Modeling for NuclearPower Plant Enclosures - Three Dimensional Calculations," CHAM of NorthAmerica, Inc., Prepared for BNL, Feb. 1985.
14. Williamson, R.B., Mowrer, F.W., and Fisher, F.L., Final Report: "FireSafety of Electrical Cabinets," Lawrence Berkeley Laboratory, Prepared forNRC, Jan. 1984.


NRC FORM 335 U.S. NUCLEAR REGULATORY COMMISSION I. REPORT NUMBER (Asspgnedbv TIDC. add V4 No. t a•,y)12-841NRCM 1102. NUREG/CR- 44793201.3202 BNL/NUREG- 51948
SEE INSTRUCTIONS ON THE REVERSE
2. TITLE AND SUBTITLE 3. LEAVE BLANK
THE USE OF A FIELD MODEL TO ASSESS FIRE BEHAVIOR IN COMPLENUCLEAR POWER PLANT ENCLOSURES: PRESENT CAPABILITIESAND FUTURE PROSPECTS 4. DATE REPORT COMPLETED
MONTH y EAR
S. AUTHOR(SI November 1985B. DATE REPORT ISSUED
JOHN L. BOCCIO AND JOHN L. USHER MONTH YEAR
December 19857. PERFORMING ORGANIZATION NAME AND MAILING ADDRESS (ItudeIZ1.0 Code) B. PROJECT/TASK/WORK UNIT NUMBER
BROOKHAVEN NATIONAL LABORATORY
UPTON, NEW YORK 11973 9. FIN OR GRANT NUMBER
FIN A-3252
10. SPONSORING ORGANIZATION NAME AND MAILING ADDRESS (mI.,ud# Z~p Cod.) 1 a. TYPE OF REPORT
DIVISION OF ENGINEERING TECHNOLOGY, RESOFFICE OF NUCLEAR REGULATORY RESEARCHU.S. NUCLEAR REGULATORY COMMISSION b PERIOD COVEREO ...lo.om ,date)
WASHINGTON, D.C. 20555
12 SUPPLEMENTARY NOTES
13 ABSTRACT (2I00 Words Or !ef)
This report provides a summary of the work conducted during FY84 by BrookhavenNational Laboratory (BNL), under FIN A-3252 "Fire Protection Research Program."It was undertaken under the cognizance of the Electrical Engineering Branch in theDivision of Engineering Technology within the Office of Nuclear Regulatory Research.The report describes a mathematical model for predicting the thermal environmentwithin complex nuclear power plant enclosures. It demonstrates the capability of theexisting numerical code by direct comparisons with electrical cable fire/large en-closure tests performed by Factory Mutual Research Corporation (FMRC) for the ElectricPower Research Institute (EPRI). It further demonstrates the potential usefulness ofthe existing code in addressing fire-protection issues. This is done through a para-umetric study of the thermal environment resulting from a series of fires withincabinets in a nuclear power plant control room (similar to LaSalle). Also, it presentsan example of how the code can be utilized by addressing an Appendix R exemptionrequest which deals with the vulnerability of containment fans to a fire emanatingfrom a reactor coolant pump bay. Recommendations are also given as to how the model/code can be further enhanced and where current effort is proceeding.
14 DOCUMENT ANALYSIS- 8 KEYWORDSJDESCRIPTORS 15 AVAILABILITY
fire protection pool fires STATEMENT
computer codes field modelscontrol rooms cabinet fires Unlimitednuclear power plants forced ventilation 16 SECURITY CLASSIFICATION
cable fires complex geometry ,Tr,. ,Afeb IDENTIFIERSIOPEN.ENDEO TERMS Unclassified
fTh,s IWor)
Unclassified17 NUMBER OF PAGES
18 PRICE


1 05 5500 5954US NRCACM-DIV 0F TIDCFRANCH CHIEFLIBRARY FP1Fl0WASHINGTON
2 IANIR7
DC 20553