NUREG/CR-3468, 'Hydrogen: Air: Steam Flammability Limits ... · HYDROGEN:AIR:STEAM FLAMMABILITY...
151
NUREG/CR-3468 SAND84 -0383 R3 Printed December 1986 Hydrogen: Air: Steam Flammability Limits and Combustion Characteristics in the FITS Vessel Billy W. Marshall, Jr. Prepared by Sandia National Laboratories j; Albuquerque, New Mexico 87'185!;'fid for the United States Department of En! under Contract DE-A004-76DP007,89! SF2900Q(8-81)
Transcript of NUREG/CR-3468, 'Hydrogen: Air: Steam Flammability Limits ... · HYDROGEN:AIR:STEAM FLAMMABILITY...

NUREG/CR-3468SAND84 -0383R3Printed December 1986
Hydrogen: Air: Steam Flammability Limitsand Combustion Characteristics in theFITS Vessel
Billy W. Marshall, Jr.
Prepared bySandia National Laboratories j;Albuquerque, New Mexico 87'185!;'fidfor the United States Department of En!under Contract DE-A004-76DP007,89!
SF2900Q(8-81)

NOTICEThis report was prepared as an account of work sponsored by anagency of the United States Government. Neither the UnitedStates Government nor any agency thereof, or any of their employ-ees, makes any warranty, expressed or implied, or assumes anylegal liability or responsibility for any third party's use, or theresults of such use, of any information, apparatus product orprocess disclosed in this report, or represents that its use by suchthird party would not infringe privately owned rights.
Available fromSuperintendent of DocumentsU.S. Government Printing OfficePost Office Box 37082Washington, D.C. 20013-7982andNational Technical Information ServiceSpringfield, VA 22161

NUREG/CR-3468SAND84-0383
R3
HYDROGEN:AIR:STEAM FLAMMABILITY LIMITS ANDCOMBUSTION CHARACTERISTICS IN THE FITS VESSEL
by
Billy W. Marshall, Jr.
December 1986
Sandia National LaboratoriesAlbuquerque, New Mexico 87185
*Operated bySandia Corporation
for theU. S. Department of Energy
Prepared forDivision of Reactor System Safety
Accident Evaluation BranchOffice of Nuclear Regulatory ResearchU. S. Nuclear Regulatory Commission
Washington, DC 20555Under Memorandum of Understanding DOE 40-550-75
NRC FIN A1246


ABSTRACT
For the past few years, the United States Nuclear Regulatory Commissionhas sponsored research at Sandia National Laboratories addressing thecombustion characteristics and flammability limits of combustible atmospheresthat might occur inside containment during a loss-of-coolant accident inside apressurized water reactor (PWR). Combustion of certain hydrogen:air:steamatmospheres could, at least hypothetically, threaten the integrity of thecontainment structure. To assist in the resolution of these issues, a seriesof 239 hydrogen:air:steam combustion experiments was performed in a 5.6 m3
vessel.
Experimentally observed flammability limits of hydrogen:air:steam mixturesin both turbulent and quiescent environments were measured and a correlationdeveloped that describes the three-component flammability limit. The newlydeveloped correlation can be used to estimate the flammability of a mixture atthese scales and larger scales to obtain approximate ignition conditions.
Transient combustion pressures of hydrogen:air mixtures were found toincrease with increasing hydrogen concentrations up to '-30%, at which point adecrease was observed W~ith further increases in the hydrogen concentration.More severe combustion environments occurred for tests initially at ambienttemperature ('-300 K) than for those initially at elevated temperatures('-385 K) due to decreases in the bulk gas density with increases in the gastemperature. The transient combustion-pressure data measured for thehydrogen:air:steam tests indicate that the addition of steam reduces thenormalized peak combustion pressure (Pmax/Po) as compared to equivalenthydrogen:air burns. Furthermore, turbulence was found to affect the extent ofcombustion and other cqmbustion characteristics of the lean hydrogen b~urns(i.e., •10% hydrogen by volume) where bouyancy governs flame propagation.However, burns containing richer hydrogen concentrations were not appreciablyaffect by turbulence.
The experimentally measured pressure decays were used to infer the"global" total, radiative, and convective heat transfer characteristics duringthe postcombustion cooling phase. Convection was found to dominate the time-integrated heat transfer (i.e., energy deposition) of the leaner (<10%)hydrogen:air burns, accounting for 50 to 70% of the postcombustion heattransfer. In contrast, radiation was slightly more prevalent than convectionfor the hydrogen:air burns near stoichiometry. When moderate quantities ofsteamn were added to the environment, radiation became the dominantpostcombustion (or time-integrated) cooling mechanism due to the increase inbulk gas emittance. If richer steam concentrations (i.e., >'-30% by volume)were added to the environment, radiation and convection appear to be equallyimportant heat transfer mechanisms.
iii/iv


TABLE OF CONTENTS1. INTRODUCTION . . . . . . . . . .. . . . . . . . . . . . . . . . . . .. 1
1.,1 Background ........................................................ 11.2 Literature Review ................................................. 11.3 Combustion Experiments Conducted at FITS...........................6
2. EXPERIMENTAL APPARATUS ................................................. 7
2.1 The Fully Instrumented Test Site (FITS)............................72.2 Experimental Procedures........................................... 102.3 Experimental Measurements.........................................112.4 Data Acquisition and Analysis .................................... 11
2.4.1 Data Acquisition .......................................... 112,.4.2 Data Analysis Using SMOKE ................................. 13
3. INITIAL GAS CONCENTRATIONS ............................................. 15
4. EXPERIMENTAL RESULTS AND INTERPRETATIONS............................... 17
4.1 Hydrogen:Air:Steam Flammability Results........................... 174.1.1 Development of a Correlation for the
Hydrogen:Air:Steam Flammability Limits ..................... 224.2 Hydrogen:Air Combustion Results...................................26
4.2.1 Combustion Pressure Results................................264.2.2 Peak Gas Temperature Results............................... 294.2.3 Heat Transfer Results......................................34
4.3 Hydrogen:Air:Steam Combustion Results............................. 404.3.1 Combustion Pressure Results................................404.3.2 Peak Gas Temperature Results...............................434.3.3 Heat Transfer Results......................................43
4.4 Combustion Completeness...........................................52
5. CONCLUSIONS ........................................................ 54
6. REFERENCES ............................................................ 56
7. APPENDICES ............................................................ 59
1. Corrected Initial Gas Concentrations ............................. 592. Experimental Uncertainty Analysis ................................663. Combustion Pressure Data for the Hydrogen:Air Burns .............. 684. "Global" Heat Transfer Data for the Hydrogen:Air Burns
Processed with SMOKE ............................................. 725. Combustion Pressure Data for the Hydrogen:Air:Steam Burns ........ 756. "Global" Heat Transfer Data for the Hydrogen:Air:Steam Burns
Processed with SMOKE ............................................. 797. Representative Pressure Signatures for each of
the Combustion Tests ............................................. 82
V/vi


LIST OF FIGURES
1 Flammability Limits of Hydrogen:Air:Steam Mixtures ...................... 22 Flammability Limits for Hydrogen:Air:Steam Mixtures with Fans Off f.......33 Flammability Limits for Hydrogen:Air:Steam Mixtures with Fans On ........ 44 Schematic Drawing of the 5.6-cubic-meter FITS Vessel .................... 85 Schematic Drawing of the FITS Facility with Important
Hardware Identified ........................................... 96 Flow Chart Showing the Data Acquisition System at the FITS Facility ... 127 Hydrogen:Air:Steam Flammability Data with Fans Off f..................... 188 Hydrogen:Air:Steam Flammability Data with Fans Operational ............. 209 Hydrogen:Air:Steam Flammability Limits for Steam and Nitrogen .......... 2110 Exponential Check using the Inert Mixtures of Hydrogen,
Air, and Steam ........................................................ 2211 Hydrogen:Air:Steam Flammability Data with Fans On
and Of f Shown with the Exponential Curve Fit ........................... 2412 Comparison of the Flammability Curve Fit with those
Proposed by Zabetakis and Tamm et al .. ................................ 2513 Normalized Peak Combustion Pressure for the Cold-
and Hot-wall Hydrogen:Air Burns ........................................2714 Comparison of the Experimental Peak Pressures to the AIOC
Calculated Peak Pressure for the Cold- and Hot-wallHydrogen:Air Burns ..................................................... 28
15 Combustion Duration for the Cold- and Hot-wall Hydrogen:Air Burns ...... 3016 Comparison of Two Nominally 9.5% Hydrogen Burns with
and without Fans Operational ...........................................3117 Mean Pressure Derivative for the Cold- and Hot-wall
Hydrogen:Air Burns .....................................................*3218 Normalized Peak "GClobal" Gas Temperature for the'
Cold- and Hot-wall Hydrogen:Air Burns ..................................3319 "Global" Total Peak Heat Fluxes for the Cold- and
Hot-wall Hydrogen:Air Burns ............................................ 3520 Ratio of the "Global" Peak Radiative to Total Peak
Heat Flux for the Hydrogen:Air Burns ...................................3621 Cumulative Total "Global" Energy Deposition for the
llydrogen:Air Burns .....................................................3822 Ratio of the Cumulative Radiative to Total Energy
Depositions for the Hydrogen:Air Burns .................................3923 Normalized Peak Combustion Pressure for the Hydrogen:
Air:Steam Burns, with fans on and off, as a Function ofthe Hydrogen Concentration in Hydrogen:Air only ........................ 41
24 Ratio of the Experimental Peak to AICC Calculated PeakPressure for the Hydrogen:Air:Steam Burns ..............................42
25 Normalized Peak Combustion Pressure for the Hydrogen:Air:Steam Burns, with fans on and off, as a Function ofthe Volumetric Hydrogen Concentration ..................................44
26 Combustion Duration for the Hydrogen:Air:Steam Burnswith and without Fans Operational ......................................45
vii

27 Normalized Peak "Global" Gas Temperature for theHydrogen:Air:Steam Burns with and withoutFans Operational ....................................................... 46
28 "Global" Peak Heat Flux for the Hydrogen:Air:SteamBurns with and without the Fans Operational ............................ 47
29 "Global" Peak Heat Flux for the Hydrogen:Air:SteamBurns Shown as a Function of the HydrogenConcentration in Hydrogen:Air only ..................................... 48
30 Ratio of the "Global" Peak Radiative to Total Peak Heat Flux forthe Hydrogen:Air:Steam Burns shown as a Function of the HydrogenConcentration in Hydrogen:Air only .....................................49
31 "fGlobal"f Cumulative Total Energy Deposition for theHydrogen:Air:Steam Burns with and without the Fans operational ......... 50
32 "Global" Cumulative Total Energy Deposition for theHydrogen:Air:Steam Burns shown as a Function of theHydrogen Concentration in Hydrogen:Air only ............................ 50
33 Ratio of the "fGlobal" Radiative to Total Energy Depositionfor the Hydrogen:Air:Steam Burns .......................................51
34 Combustion Completeness Data shown Plotted against thePrecombustion Volumetric Hydrogen Concentration ........................ 53
%viii

ACKNOWLED GMENTS
This work was supported by the U. S. Nuclear Regulatory Commission underthe direction of Dr. P. Worthington and Dr. J. Larkins. Special thanks to A.C. Ratzel for his constructive criticisms and support during this work. Thesuite of computer. programs developed by A. Ratzel and coworkers, referred toas SMOKE, has been extensively used to analyze many of the combustion testsdescribed in this document. .The use of this analysis tool has greatlyenhanced the results and interpretations presented.
M. Turner, G. B. StClair and J. Balkenbush of the KTech Corporationassisted in the experimental work at the FITS facility. M. Turner, inparticular, was instrumental in conducting these experiments and thesubsequent data reduction. W. Schmidt also assisted in the posttest dataprocessing. Without the professional attitude and expertise of thesepersonnel, this work would not have been so successful.
MA. Berman was also an important, integral part of this work. Without hiscontinued support, enthusiasm, encouragement, and understanding during thiswork, it would not have been published in such an extensive format. To theseand others I unintentionally failed to mention, I appreciate theirconstructive criticism, encouragement, and useful dialogue during this work.
ix/x


EXECIJTI\TE SUMMARY
For the past few years, the United States Nuclear Regulatory Commissionhas sponsored research at Sandia National Laboratories addressing thecombustion characteristics and flammability limits of combustible atmospheresthat might occur inside containment during a loss-of-coolant accident inside apressurized water reactor (PWR). Combustion of certain hydrogen:air:steamatmospheres could, at least hypothetically, threaten the integrity of thecontainment structure. Furthermore,' the survivability of safety-related,equipment and exposed cables is of concern due to the severe temperatures andheat flux conditions during and following combustion. To assist in theresolution of these issues, a series of 239 hydrogen:air:steam combustionexperiments was 'performed in the 5.6 m3 Fully Instrumented Test Site (FITS)vessel located at Sandia National Laboratories in Albuquerque, New Mexico.This test series incorporated air partial pressures of -~83 kPa (at the desiredtemperature) with both turbulent (fans on) and quiescent (fans off)preignition conditions.
This work provides an extensive data. base for hydrogen:air:steamcombustion characteristics and flammability limits at 'intermediate scale.Experimentally observed flammability limits of hydrogen:air:steam mixtures inboth turbulent and quiescent environments were measured and a correlationdeveloped that describes the three-component flammability limit. The,correlation can be used to estimate the flammability of a mixture at thesescales and at larger scales to obtain approximate ignition conditions.
'Transient combustion pressures were measured for all experiments. Thenormalized peak pressure was found to increase with increasing hydrogenconcentrations up to -30%, at which point a decrease was observed with furtheri.ncreases in hydrogen concentration. For ambient (-300 K) and elevatedtemperature (-'385 K) tests, the volume fractions of hydrogen, air and sýteamwere computed at the prevailing temperature. At elevated temperatures, fewermoles of hydrogen and oxygen (or air) would be available for combustion sincethe densities of the gases are lower. Therefore, more severe combustionenvironments would be expected to occur, and did occur, for the tests atambient temperatures. Steam was found to reduce the normalized peakcombustion pressure (Pmax/Po) compared to equivalent hydrogen:air burns.Comparison of the experimentally measured peak pressure to the calculatedAdiabatic Isochoric Complete Combustion (AICC). pressure also indicates thatrelatively complete combustion occurs (>95%) for hydrogen concentrationsgreater than -'10%. The extent of combustion for those tests containing lessthan about 10% hydrogen, by volume, appeared to be a strong function of thepreignition turbulence. For quiescent conditions, the combustion completenessappeared to decrease as the two- and/or three-component flammability limit wasapproached. The le'~el of preignition turbulence affected both the combustioncompleteness and general combustion characteristics of the lean hydrogen burnswhere buoyancy governs flame propagation in the absence of turbulence. Asexpected, preignition turbulence did not appear to significantly affect theextent of combustion or combustion characteristics of the richer hydrogenburns (i.e., >15% hydrogen by volume).
xi

The experimentally measured pressure decays were used to infer the"global" postcombustion heat transfer characteristics. The term "global"implies a spatially averaged property which is inferred from theexperimentally-measured pressure decay. The actual "local" conditions may besomewhat different for the lean hydrogen concentrations where relatively slowand incomplete burning may occur, although these "global" estimates appear tobe representative of the actual phenomena when complete and rapid combustionoccurs. The partitioning of the "global" energy depo 'sition and peak heatflux into radiation and convection was also estimated. Convection was foundto dominate the time-integrated heat transfer (i.e., energy deposition) of theleaner (<10%) hydrogen:air burns, accounting for 50 to 70% of the post-combustion heat transfer. In contrast, radiation was slightly more prevalentthan convection for the hydrogen:air burns near stoichiometry. The peak heatflux results showed that radiation was the dominant early-time heat transfermechanism for burns near stoichiometric conditions, as might be expected,while convection governed the lean hydrogen burns (<10%).
When moderate quantities of steam (<20% by volume) were added to theenvironment, radiation became the dominant postcombustion (or time-integrated)heat transfer mechanism due to the increase in bulk gas emittance. However,these steam concentrations did not appear to reduce the total postcombustionheat transfer, indicating that relatively complete combustion had occurred.For the very rich steam concentrations (i.e., above -~30% by volume), radiationand convection were equally important cooling mechanisms. Also, for theserich steam environments, the total energy deposition decreased slightlycompared to equivalent hydrogen:air burns; e.g., evaluating these results as a'f unction of the hydrogen-to-air ratio, the total energy deposition decreasedslightly with increasingly rich steam concentrations. These results areconsistent with expected trends since steam acts as an inert heat sinkreducing the bulk gas temperature and, with the addition of very rich steamconcentrations, the combustion of hydrogen with available oxygen would beinhibited. Finally, comparisons to the large-scale NTS results show that theradiative fraction of the total energy deposition was approximately half thatobserved during in the NTS tests. This is a scale phenomena and reflects thedifferences in radiation length-scales between the two facilities.
These data are useful for benchmarking existing computer codes such asI{ECTR and CONTAIN for hydrogen:air:steam combustion phenomena at these scales(-5 in3). The "global" heat transfer data and experimentally measured pressurehistories are also important for future combustion modelling and experimentalanalysis efforts.
xii
1. INTRODUCTION
1.1 Background
The U. S. Nuclear Regulatory Commission and the reactor safety communityhave long been aware of the potential threat to containment due to thecombustion of hydrogen mixtures during a hypothetical Light Water Reactor(LWR) accident. It has been postulated that combustion of hydrogen:air:steamatmospheres could lead to a breach of the containment building, due to thetransient pressures and dynamic loading of the containment structure, andultimately release radioactive material into the environment.' Equallyimportant are the extreme temperatures and heat flux conditions associatedwith combustion and postcombustion cooling. These harsh environments maydamage important safety-related equipment, hampering the normal safetyprocedures used during and following an accident.
The accident at Three-Mile Island (TMI), Unit 2, is the most recentexample of a loss-of-coolant acci-dent (LOCA) in a LWR. As the fuel rods heatedup, the Zircaloy metal cla-dding reacted with available steam to producehydrogen, some of which remained in the primary system, was dissolved in theremaining coolant, or was released by an operator through the pressurizer intothe containment building. During the accident, an estimated 280 to 370 kg ofhydrogen was generated, resulting in a nearly uniform hydrogen concentrationof 7.3 to 7.9% by volume [1] . At approximately 10 hours after the turbinestripped, a hydrogen burn occurred, resulting in a transient peak pressureinside containment which exceeded 190 kPa (28 psig) over a burn time of'-12 s.
During hypothetical LOCAs, hydrogen, air, and steam 'will be evolvedproducing a potentially flammable mixture of gases. The actual quantities andconcentrations of each of these gases will depend upon the accident scenarioconsidered. Other combustible gases may be present in the atmosphere but aregenerally assumed to be unimportant when compared to the concentrations ofhydrogen [2, 3, 41. This work considers the deflagration of mixtures ofhydrogen, air and steam but does not address issues related to detonations,flame acceleration, transition from deflagration to detonation, or diffusionflames. Furthermore, since mixtures of hydrogen, air and steam areconsidered, the "limits of flammability" (generally referring to the two-gasflammability limit) will be broadened here to include the three-componentmixture which is inerted.
1.2 Literature Review
During a hypothetical degraded-core accident, the initial conditionsinside containment prior to ignition and combustion of the atmosphere willinclude an elevated atmospheric pressure and temperature along with variousconcentrations of hydrogen and steam. The flammability limits and combustioncharacteristics of a hydrogen: air: steam environment have been considered bynumerous authors. A few of these studies are briefly reviewed below.
1

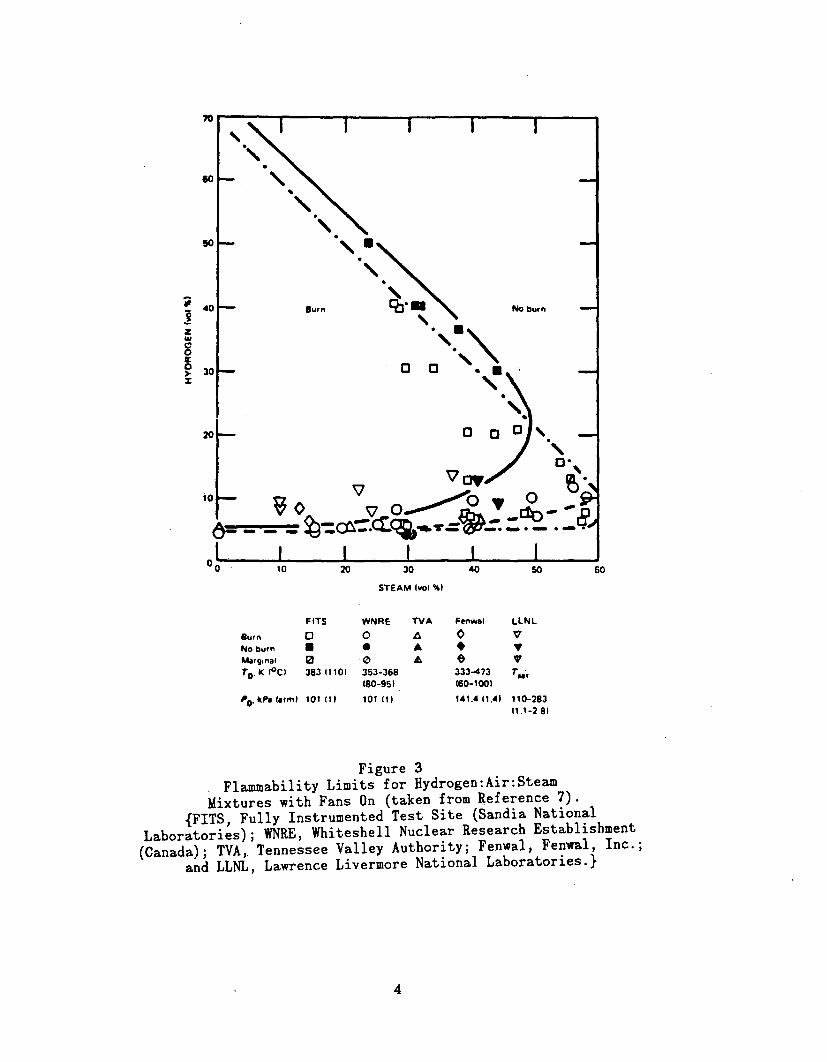
Figure 1 shows the work of Shapiro and Moffette [5] and Zabetakis [6]which define the regions of flammability of hydrogen:air:steam mixtures.Figures 2 and 3 show an accumulation of the flammability data by Berman andCummings [7] for hydrogen:air:steam mixtures which have been reported byvarious research facilities throughout the world. (Details of the experimentscomprising the data base shown in Figures 2 and 3 can be found in References 6and 8 through 14). Note that Figure 2 shows mixtures which were in aquiescent (or fans-off) state at the time of ignition, while Figure 3 showsmixtures that were in a turbulent (or fans-on) state.
The discrepancies observed from this data base have been largelyattributed to differences in initial temperature, although subtle differencesin the vessel geometry (i.e. , surface area and volume) and initial pressurewill have an effect. These differences, especially in the "knee" region ofthe curve at about 10% hydrogen, make, a clear definition of the leanflammability limit difficult. Furthermore, the current body of data forturbulent mixtures is somewhat incomplete and again difficult to drawconclusions from for reactor safety analysis. These data for turbulentenvironments are especially important in reactor safety analysis since fansand possibly sprays may be operational at the time of ignition.
100 0
80 ........... 20
297 K. 1 ATM.60 ..... ... .. ....... 4 0 -A
U' 420 K. 7.8 ATM.
40 60 20.TM
0 100100 80 60 40 20 0
% HYDROGEN
Figure 1Flammability Limits of Hydrogen:Air:Steam
Mixtures (taken from Reference 5)
2

701
60 '
50 0
~ 40\Burn%' NO burn
30 13 Z?
20
103
0 10 20 30 40 so 60STEAM (aol %)
F ITS WNRE TVA Fenwal LLNL WNRE SM
Burn 0 AV 0 0No burn U 0Marginal 0 0 A 0 Yr..K 10 C) 38331101 353-368 333-473 Ta. 314(631 42211491
480-951 460-1001
Figure 2Flammability Limits for Hydrogen:Air:Steam
Mixtures with Fans Of f (taken from Reference 7).{FITS, Fully Instrumented Test Site (Sandia National
Laboratories); WNRE, Whiteshell Nuclear Research Establishment(Canada); TVA, Tennessee Valley Authority; Fenwal, Fenwal, Inc.;
and LLNL, Lawrence Livermore National La~boratories.}
3
70
60
50
40 -Burn No buarn
0
2.0 001
20C 0w 0
10~
0 10 20 30 40 so 60
STEAM Ival %)
FITS WNRE TVA Fenwal LLNLBuwn 0 A 0No burn U A *Marginal 0 A 0rT K (0 C) 38311101 353-368 333-473 Towt
(80-951 160-1001PO' ipa(altm) 101 (11 101101I 141.401.41 110-283
Figure 3Flammability Limits for Hydrogen:Air:Steain
Mixtures with Fans on (taken from Reference 7).{FITS, Fully Instrumented Test Site (Sandia National
Laboratories); WNRE, Whiteshell Nuclear Research Establishment(Canada); TVA,. Tennessee Valley Authority; Fenwal, Fenwal, Inc.;
and LLNL, Lawrence Livermore National Laboratories.}
4

The most complete and comprehensive work related to the f lammabilitylimits of gases available in the literature has been prepared by Coward andJones of the Bureau of Mines [15]. This work reviews the limits offlammability for numerous combustible gases with air or oxygen (i.e., the two-component flammability limit). The flammability limits were defined in thiswork as:
"the borderline composition; a slight change in one directionproduces a flammable mixture, in the other direction a non-flammable mixture."
From the Coward and Jones study, the flammability limits of hydrogen:airmixtures were observed to widen as the vessel diameter increased, rapidly atfirst and more slowly afterward. In general, increases in the vessel diameterabove 5 cm rarely showed an increase of more than a few tenths of one percentin the range of flammability. The limits were also shown to not beappreciably affected by normal variations in atmospheric pressure althoughthey were narrowed slightly at elevated pressures. Increasing the bulk gastemperature was also observed to widen both the upper and lower hydrogen:airflammability limit. At standard conditions, the lower flammability limit forhydrogen:air mixtures was reported to be 4.0% hydrogen (by volume) while theupper limit was 75% hydrogen.
The characteristics of the hydrogen:air combustion process have beenstudied by numerous authors [13, 16, 17, 18, 19, 20]. ane of the most recentexperimental studies was performed by Benedick and coworkers who studied thecombustion characteristics of hydrogen:air and hydrogen: air: carbon dioxidemixtures in the Variable Geometry Experimental System (VGES) vessel located atSandia National Laboratorlies [16]. This 5-cublic-meter cylindrical vessel wasused to perform eleven test series in which over 100 combustion experimentswere conducted. During this study, it was observed that the combustionprocess of hydrogen:air mixtures containing less than -~8% hydrogen (by volume)was governed by the preignition turbulence. Higher peak pressures wereobserved for the turbulent (fans on) tests compared to equivalent quiescent(fans off) tests. This is probably due to the different horizontal anddownward propagation limits for quiescent mixtures of the hydrogen:air.Another interesting observation was the fact that the normalized peak pressure(1'max/Po) fell away from the Adiabatic Isochloric Complete Combustion (AICC)[21] calculation as the volumetric hydrogen concentrations exceeded -10%.This is contrary to expected trends since combustion of rich hydrogenconcentrations (>10%) occurs very rapidly compared to leaner (<10% hydrogen)burns, consuming most of the hydrogen and decreasing the heat transfer fromthe flame zone to the surroundings on the time-scale of combustion. Carbondioxide diluent in the combustible mixture was found to reduce the peakpressures, pressure differential, burn velocity, and pressure rise time. Itwas also determined that 54% carbon dioxide (by volume) would inert anyhydrogen: air mixture.
A study of hydrogen: air: steam combustion characteristics in a 2.3 m-diameter sphere (volume of 6.4 in
3) was performed by Kumar, Tamm, and Harrisonof the Electric Power Research Institute (EPRI) [17] . This researchdemonstrated that at low hydrogen concentrations (4 - 9%), turbulence andgratings within the vessel significantly increased the rate and extent of
5

combustion. Steam was shown to decrease the extent of combustion and also thenormalized peak combustion pressures. As in Benedick's work [16], turbulencedid not appear to greatly enhance the combustion characteristics ofatmospheres containing hydrogen concentrations greater than -"10% althoughturbulence did enhance the lean combustion experiments. Even when 40% steamwas present, complete combustion was observed for the richer concentrations ofhydrogen, although the normalized peak combustion pressure was less than thosemeasured for comparable hydrogen:air. tests.
Recently, Ratzel analyzed data collected during the EPRI/EG&G combustionstudies conducted in a ' 2048-cubic-meter spherical hydrogen dewar located atthe Nevada Test Site (NTS) [18]. Mixtures of hydrogen, air, and steam werestudied, with hydrogen concentrations ranging from 5 to 13% and steamconcentrations from 4 to 40%. Some of the experiments incorporated spraysystems, similar to those installed in LWRs, and fans which tended to enhancethe combustion rate and significantly change the postcombustion heat transfercharacteristics. The measured pressures during this series of tests indicatethat combustion of lean hydrogen -.concentrations is incomplete, with slowburning and relatively small pressure increases. As the hydrogenconcentration increases, the peak combustion pressure increased while theduration of combustion decreased as observed at smaller scales. The data-reduction program SMOKE was used to infer "global" gas temperatures andradiative, convective and total heat fluxes following combustion [22]. Theinferred gas temperatures compared reasonably well with measured gastemperatures. Global estimates of the total peak heat fluxes were typicallyless than local measurements for lean combustion and higher for mixtures above10% hydrogen. Global estimates of the radiative heat transfer were found tobe 30 to 80% of the total heat transfer depending upon the hydrogen and steamconcentration. Furthermore, for hydrogen concentrations greater than -"8%,radiation dominated the early postcombustion cooling phase, especially fortests with large initial steam concentrations. Combustion completeness datawere also analyzed, indicating that relatively complete combustion occurs forhydrogen concentrations above -"8%.
1.3 Combustion Experiments.Conducted at FITS
Combustion studies have also been conducted and reported in the 5.6 m3
FITS cylindrical test vessel located at Sandia National Laboratories inAlbuquerque, New Mexico. Currently, three studies have been reported in theliterature. In the earliest of these studies, the effects of steam and carbondioxide as a diluent were considered [13, 23] . Flammability limits ofhydrogen: air: steam mixtures were addressed, but the matrix of experiments wasincomplete and could not support any rigorous conclusions. Comparisons ofthe experimental pressure ratios to the AICC calculations [21] revealedexperimental values which exceeded the AICC results as hydrogen concentrationsexceeded about 15%. This trend contradicted those observed in similar work byBenedick et al., discussed briefly above [16]. These higher than expectedpressures were later attributed to instrumentation and- measurement problems.In particular, the harsh thermal environment during and following combustionaffected the pressure transducer diaphragm and ultimately led to themisleading data and interpretations [24].
6

A series of hydrogen: air: steam burns was also conducted to evaluate theresponse of calorimeters and some reactor saf ety related equipment duringhydrogen combustion f or the Hydrogen Burn Survival Program [25] . Gas andcomponent temperatures f rom twenty-one experiments were reported and, asexpected, were found to increase with increasing hydrogen concentrations.Although the experiments revealed interesting results about component responseduring combustion at these scales, the results could not be used to infercomponent survivability during combustion inside an LWR containment building.This was due to the fact that the burn times and associated heat transfer weresubstantially shorter in the FITS tank than would be expected during a burninside containment. These tests were intended, however, to benchmark codesimulations at small-to-intermediate scales.
Most recently, a series of hydrogen:air tests were performed to evaluatethe dynamic response of three pressure transducers during combustion [24].This work showed that the, harsh environment of combustion affected theresponse of a Precise Sensor model 111-1 gauge while not appreciably affectingthe response of the other two gauges (a Precise Sensor model 141-1 and aKulite model XT-190). Brunswick Felt Metal 1101 was also evaluated duringthis study and found to serve as an excellent thermal barrier while notaffecting the response of the transducer to the transient pressure signature(this observation was validated only for deflagrations and pressure rise timesgreater than about 10 ins).
2. EXPERIMENTAL APPARATUS
2.1 The Fully Instrumented Test Site (FITS)
All of the combustion. experiments -discussed in this report were conductedat the Fully Instrumented Test Site (FITS) located at Sandia NationalLaboratories, Albuquerque, New Mexic-o. This vessel was originally designedand built by an NRC-funded research program investigating Molten Fuel-CoolantInteraction phenomena. It was modified ,for. use by the NRC-supported hydrogencombustion behavior research program in 1981 [26].
The 5.5-cubic-meter cylindrical vessel is -~3.4 m tall with a diameter of-15m as shown in Figure 4. The vessel was built to ASME codes and has a
des-ign working pressure of 2.38 Mpa with a wall thickness of 2.86 cm. Thereis a 1.72 MIPa burst disk in place during all testing for safety reasons. Theupper head is removable and is attached to the vessel with 48 3.8 cm bolts.There are twenty-five port penetrations of various sizes most of which can beused for instrumentation access and gas feedthroughs. The port fittings andflanges were designed to high-pressure boiler standards and have been testedto 2.07 MIPa. The vessel was typically instrumented with pressure gauges atthe C- and E-port levels. Two of these ports (.C-2 and E-2) had recessedflange inserts that positioned the front surface of a pressure transducerapproximately flush with the inner tank wall., In a few tests, port E-1 wasused which did not have a recessed insert, resulting in the front surface ofthe pressure transducer being approximately 18 cm from the inner tank wall.Additionally, hydrogen, steam, carbon dioxide, and nitrogen gas feedthroughs,an igniter and gas sampling system were positioned at the F port level and a
7

4 C-LEVEL PORTS
- 1.52 m
4 E-LEVEL PORTS
.425 m SPARK AND GLOWIPLUG IGNITERS
6 F-LEVEL PORTS
.425 m
L LOWER FAN 2 G-LEVEL. PORTS
LOWER HEAD PORT
Figure 4Schematic Drawing of the 5.6-cubic-meter FITS Vessel
8

liquid-ring pump at the G-level. A schematic of the facility, including thedata acquisition and control room, is shown in Figure 5. Additionalinformation on the FITS vessel and it's capabilities are available inReferences 13, 19, 20, 23, and 24.
9940 CONTROL ROOM WITHDATA ACQUISITION SYSTEM
FITS BUILDING BOILER ROOM
STEAM BOILER I
LIQUID-RINGVACUUM PUMP::
HYDROGEN SUPPLY
DATA AND CONTROLCABLE TRAYS
Figure 5Schematic Drawing of the FITS Facility with
Important Hardware Identified
9
2.2. Experimental Procedures
The hydrogen:air:steam combustion experiments were conducted in thefollowing manner:
1. The tank was preheated to the desired temperature by injectingsteam into the vessel and circulating steam around the heatingcoils surrounding the exterior of the vessel.
2. The tank pressure was vented out the bottom and top vents toatmospheric pressure.
3. The tank was sealed and a liquid-ring pump was used toevacuate the vessel to a pressure of '-13 kPa. The tank wasthen purged with atmospheric air from the top vent. Thisprocedure (step 2 and 3) was repeated at least twice beforeeach test.
4. The tank was sealed and allowed to come to an initialequilibrium pressure and temperature and the conditionsrecorded.
5. A prescribed quantity of hydrogen, determined using partialpressure calculations, was introduced and allowed toequilibrate with the air already in the vessel. Two pneumatic14,200 LPM (500 CFM) fans were used to mix the hydrogen:airmixture. The equilibrium pressure and temperature wasrecorded for posttest calculations.
6. A prescribed quantity of steam (if desired) was added to thehydrogen:air mixture and mixed with the pneumatic fans. Theequilibrium pressure and temperature was recorded for posttestcalculations.
7. If the hydrogen:air:steam Mixture was to be ignited in aquiescent state, the fans were turned off for ten minutesprior to ignition. If the mixture was to be ignited in aturbulent state, the fans were left operational throughout theexperiment.
8. Once the desired initial conditions were achieved andrecorded, either the glow plug or spark plug ignition sourcewas energized remotely to initiate combustion.
9. The data /acquisition system recorded the variousinstrumentation signals for -5 s prior to combustion and '-30 safter ignition. The data were plotted and preliminarycomparisons to the AICO and to one-another were performedbefore the next experiment was conducted.
Additional information about general procedures is available in References 13,19, 20, 23, and 24.
10

2.3 Experimental Measurements
Two different pressure transducer models, the 141-1 gauge manufactured byPrecise Sensor Inc. and the XT-190 gauge manufactured by Kulite Inc., wereused to record the transient pressure signatures during these experiments. Adetailed experimental study of these two gauges was performed at Sandia whichindicate that these two pressure gauges record accurate pressure magnitudesand rise times for deflagration combustion experiments [24]. The Kulite XT-190, however, must be protected from the harsh thermal combustion environment(as suggested by the manufacturer) since the silicon diaphragm, on which awheatstone bridge is bonded, is sensitive to elevated static and transienttemperatures. 'The Kulite gauge has a perforated screen over the silicondiaphragm for protection, but is not designed for operation in transientthermal environments unless additional protection is provided. Therefore, aflame arrestor and thermal shield was used to protect these gauges. Thethermal protection device incorporated Brunswick 1101 felt metal held in frontof the gauge diaphragm with a steel insert. Based on the results obtained inReference 24, felt metal serves as an excellent thermal barrier fordeflagration type experiments since it does not change the transient pressuresignature, the peak pressure magnitude or the pressure rise time.
The Precise Sensor 141-1 was the second gauge-type used during thisexperimental combustion study. This gauge is relatively insensitive to thetransient thermal environment of combustion, although felt metal protectionwas incorporated in most experiments to ensure accurate results. The model141-1 is a bonded strain-gauge -type transducer with the sensing elementpositioned approximately 5 cm from the front surface of the gauge housing.The sensing element consists of a stainless-steel diaphragm and strain-cylinder combination with a four-active-arm strain gauge permanently bonded tothe cylinder. The Precise Sensor gauges were internally cooled with nitrogengas through a baffle arrangement. A nominal inlet gauge pressure of 69 kPawas provided to the cooling manifold (resulting in a volumetric flow rate ofapproximately 1.42 LPM) in all experiments. The reader should refer toReference 24 for a complete description and evaluation of the two gauges andthermal protection used in thes-e experiments.
2.4 Data Acquisition and Analysis
2.4.1 Data Acquisition
The data acquisition system at FITS, shown in a flow chart in Figure 6,empl~oys Le~roy ten-bit (model 8210) and twelve-bit (model 8212) transientAnalog-to-Digital converters (ADCs) in a Kinetic System model 1500 Camaccrate, which is controlled by an LSI 11/23 microprocessor using an RT-11operating system. Generally, the ten bit ADCs were used to record the voltageoutput of the pressure transducers, since these modules recorded approximately8200 points of data over the thirty second time interval. The period of dataacquisition for each ADC module was controlled with LeCroy 8501 programmable3-speed clock generators, allowing sample rates of 20 Hz to 2 MHz.
11

Figure 6Flow Chart Showing the Data Acquisition System at
the FITS Facility
12

Approximately 12 percent (one eighth) of the available module memory wasallocated to preignition data and the remainder was used to record thepostignition data. The ADO modules were triggered using a Transiac model 1020amplifier/trigger source. This trigger was accomplished by monitoring(through the transiac) the output voltage of a pressure transducer. When apreset voltage level was detected, a TTL "trigger signal" was sent to theclock generators and AD~s, designating time zero, and the combustion data wererecorded.
The voltage signals generated by a pressure transducer were amplifiedusing Dynamic series 7600 differential amplifiers that incorporated model7860-A strain-gauge conditioners. These amplifiers have a variable gainswitch in addition to a multiturn variable gain control, which allows theexact gains to be calibrated and set.
2.4.2 Data Analysis Using SMOKE
The experimentally measured combustion-pressure transient can be used toinfer "global" heat transfer characteristics of the postcombustion coolingphase. The term "global" implies a spatially averaged property that isinferred from a transient pressure-decay measurement. The actual "local"conditions may be somewhat different than these "global" estimates, especiallynear the flammability limits where relatively slow and incomplete combustioncan occur. However, for burns in which rapid and relatively completecombustion occurs, the inferred "global" heat transfer results are consideredrepresentative of the actual "local" phenomena.
The partitioning of the "global" total energy deposition and peak heatflux rate into radiation and convection can be estimated from theexperimentally measured pressure decay. The total heat flux rate is obtainedusing the expression
C V dF
; R i -A dt (2. 1)
and the radiative heat transfer from,
q ~e 9T 9 -a gT w(2.2)
where
q=the total heat flux rate (W/m )
q=the radiative heat flux rate (W/m )R
Cv= the specific heat capacity at constant Y6lume(J/kg-K)R = the ideal gas constant (kPa-m3 /kg-K)V = the vessel volume = 5.6 m3
13

A = the surface area of the vessel = 19.5 m2
E g the total hemispherical gas emittancea' = the Stefan-Boltzmann constant for radiation (W/m2-K
4)Tg= the bulk gas temperature (K)
a g = the total hemispherical absorptance of the gasT w= the vessel wall temperature (K)
anddP the first time derivative of the measured pressure decay.
dt
The beat transfer inside the vessel includes both convection and radiation.In this report, the convective heat transfer is assumed to be the differencebetween the total and radiative heat transfer. The energy depositions areestimated by numerically integrating the respective heat flux rates expressedin Equations (2.1) and (2.2), over time. A suite of computer codes, referredto as SMOKE, was developed by A. Ratzel and coworkers at Sandia to analyzeexperimentally measured combustion data [18, 22]. A summary of these computercodes and their functions will be briefly reviewed here for convenience. Foradditional information, the reader should consult these cited References.
SMOKE is a series of computer codes developed at SNLA to analyzecombustion data taken at FITS, VGES, and the NTS hydrogen combustion dewar.A two-step process was used to reduce the combustion data. In the first step,the raw data was smoothed and curve fit such that continuous first derivativescould be calculated from the experimentally-measured pressure signals. In thesecond step, the desired modules of SMOKE were run on the "smoothed" data andthe results stored for review. Each of these processes will be brieflyreviewed here.
Preliminary Reduction using SMOOTH
The data collected at the FITS facility was prepa red for data processingin SMOKE in two steps. The first step was to selectively cull and format thedata into 300 to 500 time-voltage pairs. These data pairs were then smoothedusing the computer code SMOOTH to provide continuous signals and firstderivatives needed for processing.
The computer code SMOOTH operates on the data using a smoothing filtersuch as a Hanning filter or a rational function fit. The rational functionfitter was particularly useful for obtaining continuous first derivatives ofthe postcombustion pressure data which was used to estimate the "global' totaland radiative heat transfer characteristics.
SMOKE.
Upon completion of the smoothing and filtering processes, the suite ofcomputer codes comprising SMOKE was used to analyze the data. The version ofSMOKE used to analyze these data consisted of two separate computer modules,MERGE and PRESS, which are briefly discussed below.
MERGE
MERGE is the initialization code which gathers information aboutthe experiment, such as initial concentrations of the gases,initial gas temperature and pressure, the type of instrumentation
14
and their respective locations, amplifier gains, any associatedcalibration, and other pertinent information important to theprocessing of the signals. MERGE then configures this informationinto data files for further use by the remaining modules of SMOKE.Adiabatic Isochloric Combustion (AIC) calculations were alsoperformed in the MERGE Module and stored for comparison 'with theexperimental data.
PRESS
The code PRESS is capable of processing up to three pressuretransducer signals. Basically, PRESS uses the informationobtained in MERGE to calculate the associated pressure inengineering units and then estimates the "global" radiative andtotal peak heat fluxes and cumulative energy deposition from thepressure decay. Output from PRESS include the absolute peakpressure and rise time, the absolute peak temperature 'which isinferred from the peak pressure, ratio of the peak to initialpressure, ratio of the peak to AIC peak pressure, and the "global"total and radiative postcombustion heat transfer conditions."Hot-wall" (no condensation occurs) and "cold-wall" (condensationis allowed to occur) analyses were also incorporated in PRESS.
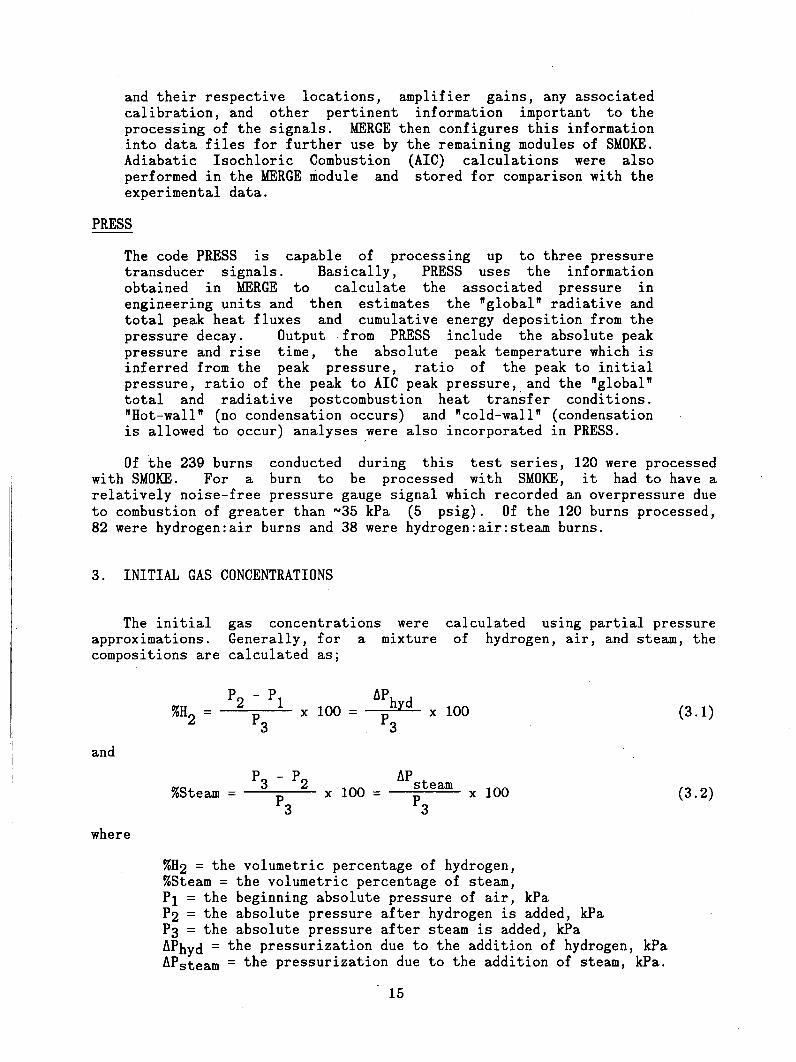
Of the 239 burns conducted during this test series, 120 were processedwith SMOKE. For a burn to be processed with SMOKE,' it had to have arelatively noise-free pressure gauge signal which recorded an overpressure dueto combustion of greater than -35 kPa (5 psig). Of the 120 burns processed,82 were hydrogen:air burns and 38 were hydrogen:air:steam burns.
3. INITIAL GAS CONCENTRATIONS
The initial gas concentrations were calculated using partial pressureapproximations. Generally, for a mixture of hydrogen, air, and steam, thecompositions are calculated as;
%H2 =- x 100 = APdxl100 (3.1)
and
P3 -P2 APsteam%Steam P xl100 xl100 (3.2)
where
%H2 = the volumetric percentage of hydrogen,%Steam = the volumetric percentage of steam,P1 = the beginning absolute pressure of air, kPa
P2= the absolute pressure after hydrogen is added, kPaP3 = the absolute pressure after steam is added, kPaAPhyd = the pressurization due to the addition of hydrogen, kPaAPsteam = the pressurization due to the addition of steam, kPa.
15
These equations are accurate as long as the temperature within the fixedvolume remains constant and the behavior of the gases can be represented usingideal gas laws.
Experimentally,'the temperature of the gases within the FITS vessel maychange in time for the "hot-walled" tests where heat transfer from the vesselwalls becomes important. To provide more accurate determinations of theprecombustion gas concentrations in the vessel, the change in pressure due tothese temperature fluctuations during the filling process 'Was accounted for.
Assuming ideal gas laws apply, the pressure in the chamber after the firstfill (state 2) can be expressed as,
P2 =C n2 T2 , C =R/V (3.3)
where the number of moles in the second state is given by
n2 =nhyd + nair (3.4)
The initial number of moles of air in the volume ('state 1) can be written as
nai= P (3.5)air CT1
Substituting Equation (3.4) and (3.5) into Equation (3.3) and rearranging,gives the following expression for the number of moles of hydrogen:
nhd1 ~2 1l (3.6)
Similarly, the number of moles of hydrogen can be written in terms of thepartial pressure of hydrogen as
AP yn hyd _CT 2 (3.7)
Substitution of Equation (3.7) into Equation (3.6), yields the followingexpression:
APhy P2 - P1 jT2 (3.8)hyd T2 T1 2
In a similar manner, the pressure in the vessel due to steam can be developedas
16

A~'ta [ P3 - '2 ]T3 (3 .g.)stam T3 T2 3
The corrected partial pressures for hydrogen and steam addition can now beused to obtain accurate concentrations of the gases using Equations (3.1) and(3.2), respectively. The pressure and temperature used in these calculationswere taken from the preignition experimental data after each fill process andafter A steady-state condition was achieved. The initial hydrogen and steamconcentrations for each experiment have been calculated using this techniqueand the results are presented in Appendix 1. These corrected concentrationsare reported throughout this text. The corresponding uncertainty in thesecalculations is addressed in Appendix 2. In general, the uncertainty of thesecalculated initial volumetric percentages for hydrogen and steam was less than+7.5% and +2.2%, respectively, of the calculated concentrations.
4. EXPERIMENTAL RESULTS AND INTERPRETATIONS
For convenience, the presentation of the results from the FITS testing hasbeen split into four major sections. In the first section, the flammabilitylimits of hydrogen:air:steam are discussed. The second and third sectionspresent the combustion pressure and heat transfer results for the hydrogen:airand hydrogen:air:steam burns, respectively. In the final section, thecombustion completeness data is presented.
4.1 Hydrogen:Air:Steam Flammability Results
One of the goals of this work was to provide a more complete data base forthe flammability limits for hydrogen:air:steam mixtures, both in quiescent andturbulent environments, at intermediate-scale. Experimentally, a mixture wasclassified as a "no-burn" if no appreciable pressure rise was detected(generally much less than 6 kPa), while a mixture was classified a "marginalburn' if the measured overpressure was less than 10% of the AICO calculatedoverpressure for the same initia conditions. (This definition is somewhatarbitrary, but gives a consistent method of defining a "marginal burn.")Those tests in which the combustion overpressure exceeded 10% of the AICOcalculated overpressure were classified "burns."
In Figure 7 the three-component flammability results are shown forquiescent (fans off) mixtures of hydrogen, air and steam with air partialpressures of one Albuquerque atmosphere (- 83 kPa) and an initial temperatureof approximately 110*C. The shaded symbols represent a mixture which did notignite, the unshaded symbols represent one which ignited and the crossedsymbols represent the marginal burns according to the definition above.
The experimental procedure used to define the flammability of a mixturewas as follows:
1. Attempt to ignite the mixture with a spark plug ignitionsource. If no ignition (i.e., pressure rise) was detected,two more spark ignitions were attempted.
17

zuLj00
00
80-
70-
60-
50-
40-
30]
20-
INITALCONDITIONS,IFANS OFFI
HOT TANK 0383 K)
PAN 180 ~
0
NO BURN
BURN
0
0 co oz 0 p0 0 I is c~1 00
I
V T-?
0 10 20 30 ~40 50 60
% STEAM
LEGED:]0BURN
S MRGIALBURNNO BURN
Figure 7Hydrogen:Air:Steam Flammability Data with Fans Of f
18

2. If no ignition was detected with the spark plug source, a glowplug was energized for -1 min.
3. If still no ignition was detected, the fans were turned on anda spark ignition attempted-one more time. If no ignition wasobserved, one final ignition was attempted with the glow plugenergized for -'1 minute while the fans were operational.
Following this procedure, an inert mixture was defined for both turbulent andquiescent conditions. In one case, ignition occurred in a turbulentenvironment while no ignition occurred in the quiescent environment (i.e.,steps 1 and 2). This result has been included as a "no-burn" in the quiescentflammability data base while it was'classified as a "burn" or "marginal-burn,"which ever the case, in the turbulent data base.
The results shown in Figure 7 also indicate that any combustible hydrogen:air mixture is inerted in the FITS vessel with -v52% steam by volume. This isrelatively close to the 54% carbon dioxide inerting percentage found in theVGES tank which is of comparable volume [16].
In Figure 8, the flammability results of hydrogen, air and steam mixturesin a turbulent (fans on) environment are presented. Similar to the quiescentmixtures shown in Figure 7, the air partial pressure was -83 k~a with aninitial precombustion temperature of -1100C. These results also indicate thatcomplete inerting occurs at around 52% steam.
The flammability limits are-a function of one or more of several initialand boundary conditions. These conditions included, the initial temperatureand pressure, the presence of suspended liquid droplets, the preignitionturbulence and the strength and location of the ignition source. ComparingFigures 7 and 8, the importance of preignition turbulence is apparent near theflammability limit; very few marginal burns are observed for a turbulentenvironment, while numerous burns are observed for the quiescent environment.Buoyancy-driven flame propagation is the dominant process governing thecombustion of quiescent mixtures near the flammability limits. If a mixtureis capable of local ignition,. preignition turbulence results in more extensiveflame propagation and larger fractions of hydrogen being consumed. Pre-ignition turbulence affects the combustion completeness and, therefore, thechamber pressurization of the lean hydrogen concentrations near theflammability limits. Thus, qualitatively different characteristics would beexpected for turbulent versus quiescent mixtures near their respectiveflammability limits.
The scatter in the marginal and no-burn flammability data shown in Figure7 and 8 are unavoidable at these scales. Marginal burns appear to be randomin nature and their appearance cannot be correlated to any one initial orboundary condition, except possibly preignition turbulence. If a mixture iscapable of "marginal" flame propagation in a quiescent environment,preignition turbulence allows the flame to propagate resulting in a "burn"classification. Furthermore, the scatter in the data may also be a result ofsmall variation in one or all of the initial and boundary conditions mentionedabove. Generally, these deviations from desired conditions are small andunavoidable at these scales.

80-
70-
60-~
509
1
INITIAL CONDITIONS:FASOPERATIONAL
HOT TANK 0383 K)
00 0
zwJ00od
0K
0 40NO BURN
0%0 0a 0 0
201
10j
0.0 00BURN
0 0 * JB000 0
0c
00
~00 00
0
0004~
0.00 so
0 to9*
0 10 20 30 40 50 60
% STEAM
LEGEND0BURNIDMARGINAL BURN
NO BURN
Figure 8Hydrogen:Air:Steam Flammability Data with Fans Operational
20

*Finally, the flammability limits of hydrogen: air and a diluent may bedirectly related to the heat capacity (and therefore the molecular structure)of the diluent gas. Steam is a triatomic gas that may suppress the combustionprocess more effectively than a diatomic gas such as nitrogen. In Figure 9,the hydrogen:air:steam flammability correlation developed in the next sectionis shown plotted against the flammability curve for nitrogen as reported byDrell and Belles in 1975 [27]. Also, inerting limits similar to those shownfor steam were experimentally observed by Benedick et al., [16] for carbondioxide in a similar sized vessel. The nitrogen curve, shown in Figure 9,indicates that larger concentrations of the diatomic gas are needed to inhibitthe combustion process. Furthermore, it appears likely that if a monatomicgas such as helium were used as the diluent gas, the three-componentflammability limits would approach the lean oxygen and hydrogen flammabilitylimits. Hence, not only are the flammability limits affected by initial andboundary conditions, they are also governed by the heat capacity of thediluent gas.
80
70
60
Z 50wL0009 40
30
20
10
00 10 20 30 40 50 60 70 80 90 100
% DILUENT GAS
Figure 9Hydrogen:Air:Steam Flammability Limits for
Steam and Nitrogen
21

4.1.1 Development of a Correlation for the Hydrogen:Air:Steam FlammabilityLimits
One of the contributions of this work, other than adding to the existingdata base, is the ability to curve fit these flammability results with anexponential-type equation. This was achieved by using a piecewise exponentialcurve fitting technique resulting in a single exponential equation whichdescribes the entire region of flammability. The technique is brieflydescribed below.
As is well known, if an exponential such as
Y(x) = A e-Bx (4.1)
is plotted on a linear-log scale, a straight line results and the constants Aand B can be defined using a standard linear regression curve-fittingtechnique.. In Figure 10 the initial air concentration is plotted on alinear-log grid against the hydrogen concentration for the inert mixtures.From this plot, the influence of two distinct exponential are observed; oneover the range of 0 - 10% hydrogen and a second for hydrogen concentrationsgreater than 15%.
A computer program was written whichroutine to fit the data presented inconcentrations from the different "no-burn"calculate a conservative expression forlimit.
incorporated a linear regressionFigure 10. Hydrogen and airflammability tests were used to
the three-component flammability
100
-h
0
100 10 20
VOL/,30 40Q 50 60
HYDROGEN
Figure 10Exponential Check using the Inert Mixtures of
Hydrogen, Air, and Steam
22

The first least-squares curve fit incorporated data greater than 15%hydrogen and resulted in the following expression:
ln(%Airl) = 3.62 - 0.007%H2 . (4.2)
The influence of this exponential term was subtracted from the data base and asecond f it calculated using the data between 0 and 10% hydrogen resulting inthe expression:
ln(%Air2) = 6.25 - 0.488%H2 (4.3)
Combining these two equations and accounting for the fact that the combustibleatmosphere consists of only hydrogen, air and steam, the steam content can beexpressed in terms of the hydrogen concentration as follows;
%Steam = 100-%H2--37.3 e-0 .007%112 - 518.0 eO0 4 88%H2 (4.4)
The approximate flammability of a mixture can be determined with thiscorrelation given a volumetric concentration of hydrogen. In Figures 11A and11B, this correlation is plotted with the experimental data previouslyreported in Figures 7 and 8, respectively. As shown, the correlation providesa relatively good fit over the entire flammability region. Even at the kneeof the curve, the correlation compares reasonably. well with the scatter in thedata. Furthermore, this single correlation provides a. conservativeapproximation of the flammability limits for both quiescent and turbulentconditions since only the "no-burn" data was used.
Comparison of this correlation to the curves proposed by Zabetakis [6] andTamm, et al., [91 are shown in Figure 12. The correlation compares reasonablywell with the fans-on curve fit of Tamm for the lean hydrogen concentrations.However, the correlation overpredicts the flammability limits with fans-off asproposed by Tamm. or the curve introduce by Zabetakis. These differences maybe attributed to geometric differences such as the characteristics lengthscales of the different vessels, the volume-to-surface area ratio of thevessel, and the location and ignition energy of the igniters.
Zabetakis was the first to propose a curve for the entire region offlammability, but his curve is significantly different than that developed inthis and other work. It predicts much narrower flammability' limits in theknee region of the curve around 10% hydrogen. The curves proposed byZabetakis and Tamm were generated using engineering judgement to "hand-fit"the data base. The technique described in this report defines a method ofcurve fitting the data base with an expression usin Ig existing techniques.This method does not require engineering judgment to fit the curve and,therefore, should yield more credence to the resulting curves.
An expression of the type defined in Equation (4.4) could be easilyimplemented into currently available reactor safety analysis tools such asHECTR [28,29] and MAAP [30]. However, before an expression of this type isused in such codes, an expression of the current world's data base should bedeveloped using this technique. Note that care must be taken in choosing the
23

80 III Iii I jil IIj II jilliji
zwj000ý
70L
60L
50-
30..
201
101
0-
INITALCONDITIONS, -
IFANS OFFHOT TANK 0-383 K)-
0
/ /-,XPONENTIAL CU RVE RT -
e ~NO BURN-
0 s
BURN
00
0 0 -P
IoBURRIEMARGINAL BURN
2 10 20 30 .40 50 50% STEAM
8'
7'
64
5400
24
14
0
0
0
0
0 0 0 NO BURN I OBUR NeMR0A BUR
NOURNR
0 00
0 000 00 030 04 50 6
% STEAM
Figure 11Hydrogen:Air:Steam Flammability Data with Fans On
and Off Shown with the Exponential Curve Fit.
24

z00
80
70
60
50
~40
30
20
10
00 10 20 30 40 60
% STEAM
Comparison-ofProposed by
Figure 12the Flammability Curve FitZabetakis [6] and Tamm, et
with thoseal., [9]
largest vessel geometries available from the existing data base to provide arepresentative correlation for containment sized volumes. The expressionprovided in this work will provide a much more accurate representation of theflammability limits than currently exists in most of these combustion codes.
25

4.2 Hydrogen:Air Combustion Results
4.2.1 Combustion Pressure Results
The experimental combustion peak pressure data for each of thehydrogen:air burns are included in Appendix 3 along 'with the AdiabaticIsochloric Complete Combustion (AICC) theoretical maximum pressures forreference. Also, representative pressure signatures are included in Appendix7 for each combustion experiment. Graphical representation of these resultswill be presented and discussed in this section.
Figure 13 shows the ratio of the peak-to-initial pressure as a function ofthe initial hydrogen concentration for both the quiescent and turbulent burnsin cold-wall and hot-wall tests. As observed by other investigators [16,17],preignition turbulence tends to promote more complete burning for lean ((10%)hydrogen concentrations while preignition turbulence is relatively unimportantfor the richer burns. For lean quiescent burns, incomplete burning is mostlikely a result of the downward and horizontal flame propagation limits; e.g.,the flame kernel is able to propagate only upward due to buoyancy effects. Incontrast, turbulence induced by fans causes unburned gases to be "f 'ed" intothe flame zone, burning gases which otherwise might not be combusted. Forthe richer burns (>10% hydrogen), the flame is able to propagate uniformly inall directions independent of the preignition turbulence eliminating thisdependence.
The normalized peak pressure was also observed to increase to a maximum atabout 30% hydrogen by volume and then decreases with increasing hydrogenconcentration. For hydrogen concentrations greater than stoichiometry, themixture becomes oxygen lean and is unable to react with all the availablehydrogen. Thus, the extra hydrogen acts as a diluent, similar to nitrogen,reducing the combustion peak pressures. Furthermore, preignition turbulencewas found to be unimportant for these rich hydrogen concentrations; i.e., thedata for quiescent burns are with the *scatter of the turbulent burn results.
The importance of the preignition gas temperature is also evident when theresults from these two figures are compared. At stoichiometry, a decrease of-20% in the normalized peak combustion -pressure is observed for burns atelevated preignition temperatures (-385 K, referred to as hot-wall) compared-to equivalent burns at ambient temperatures ('-300 K, referred to as cold-wall). This is essentially due to the decreased quantity of hydrogen andoxygen available for combustion. At elevated temperatures, fewer mole ofhydrogen and oxygen (or air) are available for combustion since the densitiesof the gases are lowered as the temperature is increased. Therefore, moresevere combustion environments would be expected to occur, and did occur, forthe tests at ambient temperature.
Comparisons of the experimental peak pressures to the AICC theoreticalmaximums are shown in Figure 14. These plots indicate that as the hydrogenconcentration increases from -5% to -10%, the ratio of the experimental toAICC peak pressure also increases. For hydrogen concentrations richer than-10%, this ratio tends to level off between 0.9 and 1.0 and then begins aslight decrease for hydrogen concentrations exceeding about 30%.
26

aa-N
a-
10
9
8
7
6
5
4
3
2
1
00 10 20 30 40 50 60 70 s0
Vol/, HYDROGEN
aa-N
K
10
9
8
7
6
5
4
3
2
1
0
IO 7 :II
090
HTWALL BURNS6b0-FANS ON
~SFAN FF
0 10 20 30Vol/*
40 50HYDROGEN
60 70 80
Figure 13Normalized Peak Combustion Pressure for the Cold-
and Hot-wall Hydrogen:Air Burns
27

'IL
0.
I.
50
% HYDROGEN
1.:
I- A 0AO
00
0 0 0 C
~.1'-p
a.
0.
0.6 -
0.4-
0.2-HOT-WALL BURNSAýFANS ON-0 FANS OFF
4 .I I I I
0 0 10 2'0 3'0 4'0 5'0 60 70
% HYDROGEN
Figure 14Comparison of the Experimental Peak Pressures to the
AICO Calculated Peak Pressure for the Cold-and Hot-wall Hydrogen:Air Burns
28

The duration of combustion, as measured by the time from combustioninitiation to the time of peak pressure, is plotted in Figure 15 against theinitial hydrogen concentration and is shown in tabular form in Appendix 3.Here, the hot- and cold-wall-tests are shown together for both quiescent andturbulent burns. As expected, the duration of combustion is significantlylonger for the lean quiescent burns compared to similar turbulent burns. Thisobservation is more clearly shown in Figure 16 where the pressure signaturesof two nominally 9.5% hydrogen:air burns are shown. The most strikingdifference is the, overall pressure signature recorded for these twoexperiments. For the quiescent burn, the initial pressure rise from thepreignition pressure to the first "bump" in the signature is probably due toflame propagation in essentially an upward direction. Once the flame reachesthe top of the vessel, it then propagates down the vessel walls, burning some(or all) of the remaining gases. Downward and horizontal flame propagationprobably also occurred during the initial pressure rise but moved very slowlycompared to the upward moving flame kernel. Furthermore, any upward movementof the bulk gases would retard the propagation of the flame in the downwarddirection until the top of the vessel is reached.
Another measure of the combustion severity can be obtained by consideringthe mean pressure derivative (calculated as the measured overpressure dividedby the pressure rise time) as a function of the initial concentration ofhydrogen, as shown in Figure 17. These results indicate that there is verylittle difference between the turbulent and quiescent burns nearstoichiometry. However, more distinct differences are observed for thosehydrogen burns containing less than 10%; the mean pressure derivative isgreater for the turbulent burns than for the quiescent burns, indicating thatthe chemical energy release rate is higher for turbulent burns than forquiescent burns. Additionally, the mean pressure derivative for the burns atambient temperature are generally greater than for *the burns at elevatedtemperature, indicating again that more energy is released and combustion isgenerally more severe at the lower initial temperature. These trends areconsistent with those already presented and serve as an additional check pointfor the observations and conclusions discussed previously.
4.2.2 Peak Gas Temperature Results
The "global" peak gas temperatures inferred from the pressure signalsusing SMOKE have also been provided in Appendix 3 with the combustion pressureresults for reference. In Figures 18A and 18B, the normalized peak gastemperatures are shown for the combustion experiments at ambient and elevatedinitial temperatures, respectively. For these results, there appears to bevery little difference in the peak gas temperature between the turbulent andquiescent burns, although some differences would be expected in the very leanhydrogen burns. There is, however, a significant dependence of the resultsupon the preignition temperature as might be expected from the previousdiscussion. The burns initially at ambient temperature (cold-wall) generallyachieve higher peak gas temperatures than do comparable burns at elevatedtemperature (hot-wall). These results again suggest that the heat fluxes andenergy depositions are more severe during cold-wall burns than during hot-wallcombustion due, as noted before, to the larger quantities of hydrogenavailable for combustion in the cold-wall burns.
29

0
0
1=
0
0
0
z0I-
0
U
10:
17:
0.1
HOT-WALL BURNS*AFANS ON-* FANS OFF -
Ac
00
0 70 0
I
19.............................................
0 10 20 30 40Q 50 60 70
0 10 20 30 40 50 60 70
% HYDROGEN
Figure 15Combustion Duration for the Cold- and Hot-wall
Hydrogen:Air Burns
30

3-O UIESCENT CONDrITON4
LU
0 5 1015 20TIME. SECONDS
Figure 16Comparison of Two Nominally 9.5% Hydrogen Burns with
and without Fans Operational
31

(o 1000-
> 0
00
Cie
(n 1- 0U.J COLD-WALL BURNS'=
0- A FANS ON20 0 FANS OFF
0110 20 30 40 50
% HYDROGEN
U 1000 ..LU
00 0100- 0
LJ> 00
~ tA
LUJ0 1
CAI
Wj HOT-WALL BURNSod 0.17 0 A FANS ON
o oFANS OFF
0 10 20 30 40 50 60 70 80
% HYDROGEN
Figure 17Mean Pressure Derivative for the Cold- and
Hot-'wall Hydrogen:Air Burns
32

LLU
LUI.-
LU
LU
0z
10-
7-
6-
5-4-
3-
2-
0-
000
COLD-WALL BURNS_6 FANS ON
o - FANS OFF
0 10 20 30% HYDROGEN
40 50
LUCie:-
LUCie
LU
LU
Cie
0LU
10
9
8
7
6
5
4
3
2
00 10 20 30 40 50
% HYDROGEN60 70 80
Figure 18Normalized Peak "Global" Gas Temperature for the
Cold- and Hot-wall Hydrogen:Air Burns
33

4.2.3 Heat Transfer Results
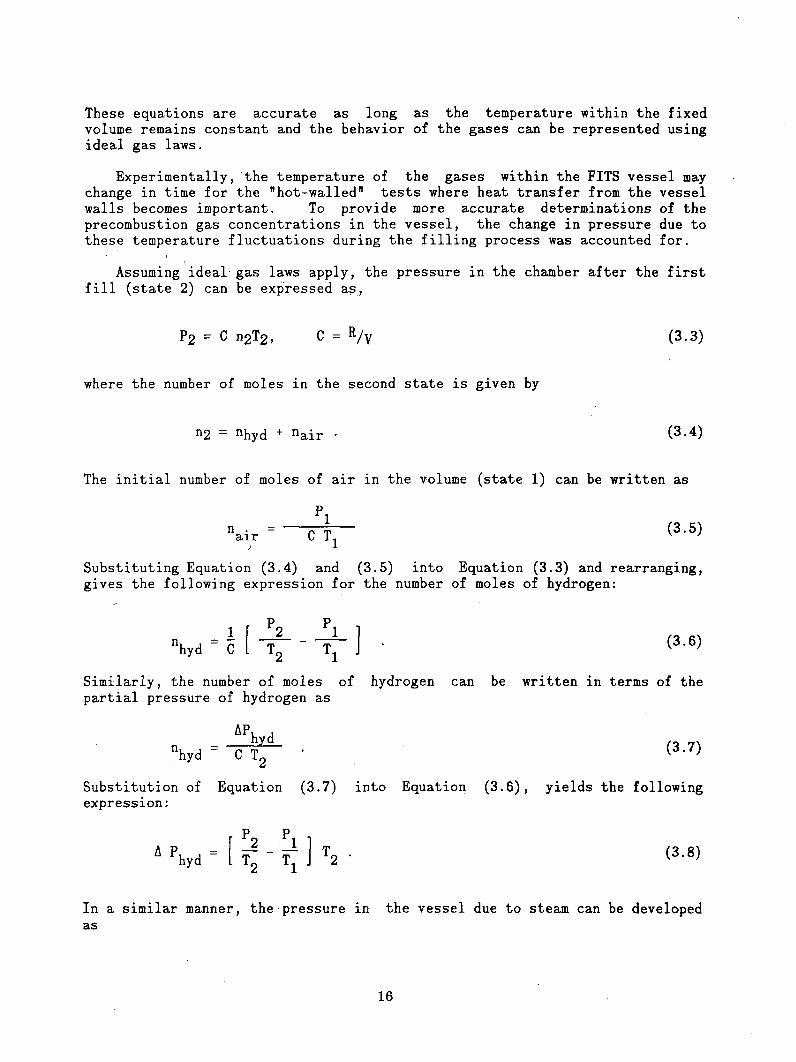
The "lglobal"I heat flux and energy depositions have been inferred from thepressure signals using the suite of computer programs referred to as SMOKE andare reported in tabular form in Appendix 4. In Figure 19, the "global" totalpeak heat fluxes for the combustion experiments at elevated (hot-wall) andambient (cold-wall) preignition temperatures are shown. Comparing the lean(-10%) and stoichiometric precombustion conditions, the total peak heat fluxincreases by a factor of -10 for the hot-wall burns and by '-12 for the cold-wall burns. Furthermore, stoichiometric cold-wall burns are -~20% more severethan comparable hot-wall combustion tests. This is a further evidence thatcombustion severity increases as the preignition temperature decreases.
Analyses show that the heat transfer processes during and after combustionare dominated by convection and radiation. Results from SMOKE indicate, asshown in Figure 20, that during and immediately following combustion, heattransfer is governed by radiation for hydrogen concentrations greater than-~20%, while convection becomes more important for burns with less than 10%hydrogen. For the lean burns, the ratio of the radiative to the total peakheat flux is generally less than 50% indicating that postcombustion beattransfer is dominated by convection. This observation occurs at both elevatedand ambient preignition temperatures, implying that the mechanisms of heattransfer at early times after combustion are unaffected by the initial gastemperature, at least for the lean cases (<10%). Near stoichiometry,radiation accounts for -90% of the early postcombustion heat transfer for thecold-wall tests and -~75% for similar hot-wall burns. Radiation dominated heattransfer would be expected for the rich hydrogen burns since radiation isproportional to the fourth-power of the gas temperature and is moresignificant at elevated gas temperatures than convection which is proportionalto the first-power of the gas temperature. Thus, although similar trends inthe heat transfer mechanisms are observed for lean burns at both ambient andelevated preignition temperatures, some differences do exist between the twoat concentrations near stoichiometry.
Results from the large-scale NTS combustion tests [18] appear similar tothese reported here. Ratzel reported that the ratio of the peak radiative tototal heat flux varied from '0.34 at 6.0% hydrogen (test NTSP9P) to 0.56 at9.9% hydrogen (test NTSP15). It should be noted that a dramatic increase inthis ratio was observed for concentrations near 8%. Specifically, for testNTSPOO with 6.6% hydrogen, the ratio of the two peak heat fluxes was 0.31while for test NTSP13 with 7.8% hydrogen, the ratio increased to 0.53.Although the number of "'dry" burns in the NTS series was relatively small,these four tests seem to fall within the general scatter of the resultsobtained from the combustion experiments in the FITS vessel. However, due tothe increased vessel geometry and the characteristic radiation length-scale,the integrated radiation heat transfer would be expected to be moresignificant in the NTS combustion dewar than in the FITS vessel [31].
The time-integral of the heat flux, or cumulative energy deposition, hasalso been estimated using SMOKE. The cumulative energy deposition is anintegral measure of the postcombustion heat transfer and indicates the total
34
1000
E
1:00
~10
0-
0 10 20 30 40 50 60 70 80%o HYDROGEN
Figure 19'Global" Total Peak Heat Fluxes for the Cold- and
Hot-wall Hydrogen:Air Burns
35

10~.9
~0.7
0.61.5O.5
<r-
~0.3
u.0.200 0.1
0 10 20 30 40 50 60 70 80X HYDROGEN
Figure 20Ratio of the "Global" Peak Radiative to Total Peak
Heat Flux for the Hydrogen:Air Burns
36

energy absorbed by the vessel surfaces over the data recording period ('-30 s).The time-rate of energy deposition (i.e., heat flux profiles) may also be animportant parameter when considering the heat transfer phenomena associatedwith combustion, but is not presented here. It is safe to say, however, thatthe decay-of the heat flux with time is directly related to the pressure decaysince this decay represents the cooling processes within the vessel. However,the "local" conditions may be somewhat different from the "global" conditions,especially for lean hydrogen burns where relatively slow, incomplete andlocalized burning can occur. I 'f relatively uniform combustion occurs, thedifferences between the local and global postcombustion heat transfer shoulddiminish.
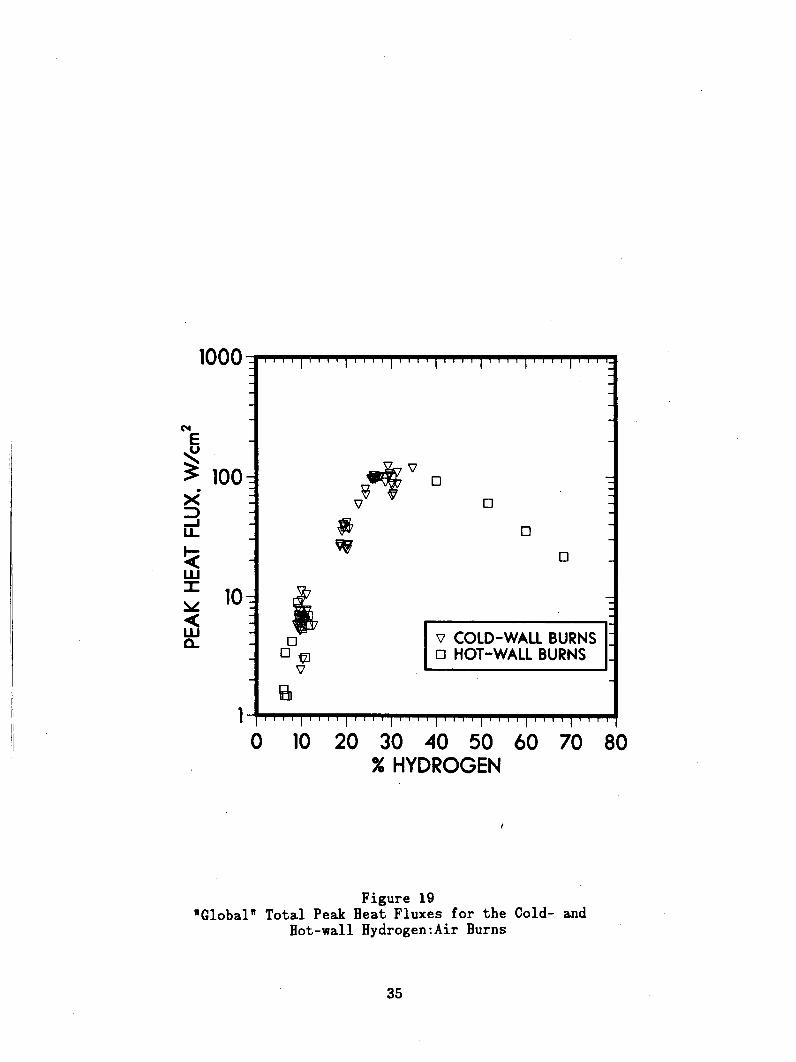
If the cumulative total energy deposition is plotted as a function of theinitial hydrogen concentration, as shown in Figure 21, the difference inpostcombustion heat transfer due to the initial precombustion gas temperatureis evident. An increase of '-30% in the total energy deposition is observedfor burns at ambient temperature compared to equivalent burns at elevatedtemperature and at hydrogen concentrations near stoichiometry. The totalenergy depositions for the hot-wall combustion experiments were observed toincrease from '-10 J/cm2 near the lean flammability limit ('-5% hydrogen) to '-80J/cm2 near stoichiometric ('-30% hy dro en) while the cold-wall counterpartsincreased from '-15 J/cm2 to '-95 J/cm§ over the same range. As observedbefore, this is a result of more hydrogen and oxygen available for combustionat lower preignition temperatures.
If the ratio of the radiative to total energy deposition is considered asa function of the initial volumetric hydrogen concentration, as shown inFigure 22, convectioxi is observed to be the dominant integral postcombustionheat transfer mechanism for mixtures less than '-10% hydrogen. Thus, at thisscale, postcombustion. heat transfer for the lean hydrogen burns is governedby convection during both early and late periods after combustion. Radiationand convection were found to play approximately equal roles in thepostcombustion cooling process for burns greater than 15%. Furthermore, thistrend continues for the very rich hydrogen burns (>30%) indicating that theexcess hydrogen does not greatly influence -the postcombustion cooling heattransfer mechanisms. These integral heat transfer results are true in spiteof the fact that radiation was observed to be the dominant mechanism of heattransfer shortly after combustion for the rich burns (refer back to the peakheat flux results). Convection is the dominant mechanism of heat transfer atlate times after combustion, for both rich and lean hydrogen concentrations,since it is proportional to the gas temperature difference and radiation isweakly proportional to'the fourth-power of the gas, temperature. Thus, as thebulk gas temperature decreases, convection will ultimately become the dominatemode of heat transfer.
If these experimental results are compared to the large-scale NTS data,some differences become apparent. Ratzel reported that the ratio of thecumulative radiative to total energy deposition varied from 0.33 at 6.0%hydrogen (test NTSP9P) to 0.47 at 9.9% hydrogen (test NTSP15). If these NTS-inf erred results are compared to the FITS results, radiation accounts for alarger partition of the total heat transfer at large-scale than atintermediate scales. As evident from Figure 22, the NTS data areapproximately twice that of the FITS data. Thus, although convectionmechanisms will eventually dominate the postcombustion heat transfer
37
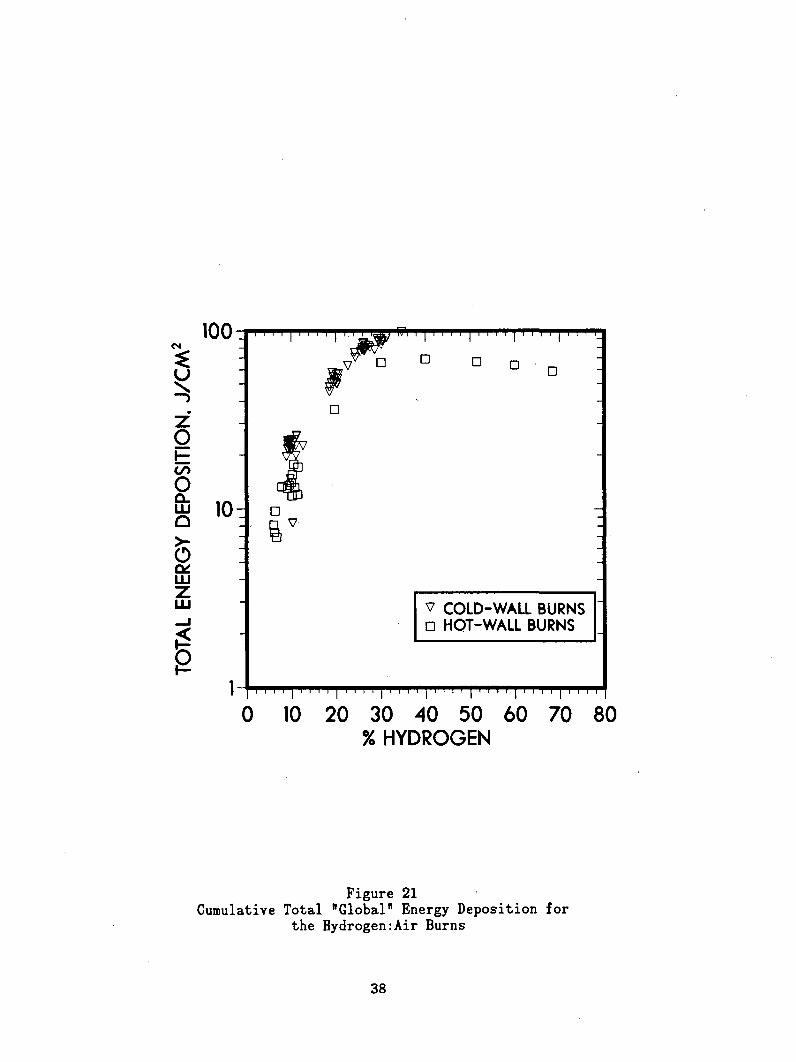
00-
z
01.
100-
10.
0 10 20 30 40 50 60 70 80% HYDROGEN
Figure 21Cumulative Total "Global" Energy Deposition for
the Hydrogen:Air Burns
38

z0
0
z
w
00ti-ad
1
0.90.80.7
0.6
0.5
0.4
0.30.2
0.1
00 10 20 30 40 50
% HYDROGEN60 70 80
Figure 22Ratio of the Cumulative Radiative to Total Energy
Depositions for the Hydrogen:Air Burns
39

processes, the importance'of radiation during the postcombustion cooling phasemust increase relati've. to the vessel volume. These observations have alsobeen observed and "reported by Ratzel and Shepherd [31]. Briefly, the*radiative heat transfer is directly related to the characteristic length scalefor radiation; in particular, the effective emittance of the gases in thevolume increases as the vessel size increases. Due to the large differencesin vessel volume and geometry, the emittance would be expected to increase bya factor of '-2 resulting in an approximate equal increase in the radiativeheat transfer for the NTS combustion tests [31] and [32]. Therefore, thedifferences between the FITS data and the large-scale NTS data are attributedsolely to the differences in scale.
4.3 Hydrogen:Air:Steam Combustion Results
4.3.1 Combustion Pressure Results
The experimentally measured peak pressures and ATOC calculated peakpressures for each of the hydrogen:air:steam experiments are presented inAppendix 5. Also, representative pressure signatures are presented inAppendix 7 for each combustion experiment for future reference. These resultsare presented graphically in this section and are discussed in detail.
The measured pressures during combustion of the hydrogen:air:steammixtures indicate that the normalized peak pressure (i.e., the ratio of thepeak-to-initial pressure) decreases with increasing steam, as shown inFigure 23. (Note that in this figure and those to follow, comparisons of theburns with and without steam are made relative to the hydrogen concentrationin hydrogen:air only. Comparison on a volumetric basis will be presented in alater part of this section.) Turbulent lean burns are affected by theaddition of steam compared to the hydrogen:air counterpart, although not asmuch as the quiescent burns; up to a 50% reduction is observed for thequiescent burns. This again implies that preignition turbulence may be one ofthe most important condition determining the combustion characteristics oflean mixtures of hydrogen with and without steam. Furthermore, steam wasfound to affect the combustion pressurization of the richer hydrogenconcentrations (>15%) for both turbulent and quiescent conditions; a reductionin the normalized peak pressure of up to '-50% was observed depending upon thesteam concentration. Thus, as might be expected, steam acts as an inert heatsink and reduces the bulk gas temperatures and chamber pressurization duringcombustion of the available hydrogen with oxygen.
As the hydrogen concentration increases away from a particularhydrogen:air:steam flammability limit, increasing fractions of hydrogen areconsumed during the combustion process. This general trend is shown in,Figure 24 as the ratio of the measured peak to AICC calculated peak pressure.Substantial decreases in this ratio are observed for the quiescent lean burnsindicating decreasing amounts of hydrogen are consumed during combustion asthe steam concentration increases. The turbulent burns, on the other hand,appear to be less affected by the addition of moderate concentrations ofsteam; again preignition turbulence is an important factor. The combustion ofnear-stoichiometric concentrations also appear to be affected by moderate tohigh concentrations of steam for both turbulent and quiescent environments.
40
10 1 1 1
9I TURBULENT CONDITIONS+ - *DRY' BURNS& a ,0-20% STEAM
WU o - 20-30% STEAMv - 30-40% STEAM
7 o a0),40% STEAM
4. +A
0.. +
< to +
4 +
0U 0 A
N 10 2v0 30 400 5 0 0
Zi HYROE INHD ENAROL
0~~ ~ 10 )20~ STEAM060 70 s
3ý0-20% STEAMCL 0 - 40% STEAM
o 4 +us A
0 0 Y 0
+ 00
09 2 A 00 0
0
0 1 . . -
0 10 -20 30 40 s0o 6 70 80
X HYDROGEN IN HYDROGEN:AIR ONLY
Figure 23Normalized Peak Combustion Pressure for the Hydrogen:Air:Steam
Burns, 'with fans on and off, as a Function of the HydrogenConcentration in Hydrogen:Air only
41

111
0.9 6+
0.8 +
0.7 +7 0~0.+
+
Lo 0.46_________
0.3 TUBUEN
0.3 + - "DRY' BURNSa - ),0-20% STEAM
0.2 0: 20-30% STEAMv 30-40% STEAM
0.1 -. )40% STEAM
0 .....
o 10 20 30 40 50 60 70 80% HYDROGEN
0 .1 ++0.9 ++ +
0.8 0 0 %
.0.6 0
~0.0 0
p0.5 0
S0.4 It_______
0 QUIESCENT CONDITIONS0.3 + - DRY'BURNS 1A -0~-20% STEAM I
0.2 20:O-30% STEAM IS30-40% STEAM *
0.1 o= )40% STEAM
0o 10 20 30 40 50 60 70 80
% HYDROGEN
Figure 24Ratio of the Experimental Peak to AICO CalculatedPeak Pressure for the Hydrogen:Air:Steam Burns
42

The results presented in Figures 23 and 24 show that if the hydrogenconcentration is considered on a hydrogen-in-air basis only, steam affects thecombustion of hydrogen with oxygen for both turbulent and quiescentconditions. If, however, these data are considered as a function of thevolumetric hydrogen concentration as shown in Figure 25, relatively smalldifferences exist between the lean turbulent burns with and without steam.The quiescent burns, on the other hand, are affected. Buoyancy is thought todominate the flame propagation of lean hydrogen burns in a quiescentenvironment, while similar turbulent burns are less affected. For turbulentpreignition conditions, steam acts only as an inert gas, similar to nitrogenin air,, and combustion properties are similar to those observed for similarhydrogen:air burns with the same total volumetric hydrogen concentrations.For example, a turbulent burn containing (by volume) -'8% hydrogen and 20%steam would be similar to one containing no steam and -'8% hydrogen.Therefore, on a volumetric basis, the combustion characteristics of leanturbulent mixtures containing steam are not significantly affected by theaddition of moderate quantities of steam compared to similar hydrogen:airburns. For the richer burns, however, buoyancy is not the dominant role offlame propagation and steam acts as a diluent, equally reducing the combustionpressures of quiescent and turbulent burns.
The duration of combustion was found to increase with increasing steamcontent compared to equivalent hydrogen:air burns. As shown in Figure 26, thequiescent burns are more influenced by the addition of steam than turbulentburns. The duration of combustion increases for the -lean hydrogen:airconcentrations in both turbulent and quiescent burns. Quiescent burnscontaining more than -10% hydrogen in air seem to be most affected by theaddition of steam, increasing the duration of combustion by as much as twoorders-of-magnitude. Similar turbulent burns do not appear to be as affectedunless rich steam concentrations (>40%) are present. Thus, the duration ofcombustion for hydrogen:air:steam burns is related not only to the quantitiesof steam available in the volume but also to the preignition turbulence.
4.3.2 Peak Gas Temperature Results
The "global" normalized peak gas temperatures were obtained from thehydrogen:air:steam burns processed with SMOKE and are presented in Appendix 5with the combustion pressure results for reference. These results are shownin Figure 27. For the lean turbulent burns with steam, the normalized peakgas temperatures are generally equal to or slightly less than equivalenthydrogen:air burns. Quiescent lean burns are, however, significantly affectedby the addition of steam. In both cases, the very rich hydrogen burns aremore, dramatically affected by the addition of steam, lack of sufficient oxygenfor combustion, and diffusion rate of oxygen and hydrogen.
4.3.3 Heat Transfer Results
The "global" heat flux and energy deposition results have been calculatedusing SMOKE for the hydrogen:air:steam burns. The numerical results arepresented in Appendix 8. The total peak heat flux results, shown in Figure28, indicate that early-time combustion heat transfer is significantly reduced
43

I0 I I I I I
I ft ft* PL. ak* .. IaL.e I9 HUEDULCRIIi.JIuIFI+Iw DRY*BURNSS
a8 -- 0 STEAMo -20-0%STEAMv a30-0XSTEAM
7 o - 3,401 STEAM
+
A( ++CL 4 +3 +
+ 0 A
2 %.
0O
0 10 20 30 40 50 60 70 80
Vol/. HYDROGEN
7 I QUIESCENT CONDITIONS* 0-20% STEAM
6 o a20-30X STEAM-30-40X STEAM
o+ -)40% STEAM j
x 4 +
a.0 02 +a 0
A 00
0 . . . ..
0 10 20 30 40 50 60 70 so
Vol/. HYDROGEN
Figure 25Normalized Peak Combustion Pressure for the Hydrogen:Air:Steam
Burns, with fans on and off, as a Function ofthe Volumetric Hydrogen Concentration
44

0
z0
0
U
100
10
0.
0.01
TURBULENT CONDITIONS* = 'DRY* BURNS
3 a - 3-0-20% STEAM*0- 20-30% STEAM7 w 30-40% STEAM
+ 00 0 0 o )40X STEAM
00
* ý- 13 00
+
+ 0
0 10 20 30 40 50 60 70 80% HYDROGEN IN HYDROGEN:AIR ONLY
VuJ
0
z0Fo
0
0
100
10
0.1
0.010 10 20 30 40 50 60 70 80
% HYDROGEN IN HYDROGEN:AIR ONLY
Figure 26Combustion Duration for the Hydrogen:Air:Steam
Burns with and without Fans Operational
45

LU
U)'UIx
LU
0uJ
10
9
8
7
6
5
3
2
00 10 20 30 40 50 60 70 80
% HYDROGEN IN HYDROGEN:AIR ONLY
'U
a-
LU
'U
at
0Z
10
9
8
7
6
5
3
2
00 10 20 30 40 50 60 70 80
% HYDROGEN IN HYDROGEN~AIR ONLY
Figure 27Normalized Peak "Global' Gas Temperature for the
Hydrogen:Air:Steam Burns with and without Fans Operational
46

1000
-%100
-jLL- 10
I-
0.1
I---. I
+ 4&
60
a+-"DY BURNSa m20-0%STEAMv -30-0%STEAMo -)-0%STEAM
0 10 20 30 40 50 60 70 80
% HYDROGEN
Figure"Global" Peak Heat Flux for
Burns with and without
28the Hydrogen:Air:Steam
the Fans Operational
47

by the addition of relatively large concentrations of steam. There are,however, numerous lean hydrogen burns in which the addition of moderatequantities of steam have increased the peak heat fluxes. As discussedearlier, the severity of a hydtogen:air:steam burn is clearly related to thehydrogen concentration relative to air (or more correctly the oxygen). If thetotal peak heat flux is plotted against the hydrogen percentage in air, asshown in Figure 29, a decrease in the peak heat flux due to the addition ofsteam is observed for all cases. This is consistent with expected trends.Steam provides a formidable heat sink, reducing the bulk gas temperature andretarding the normal combustion of hydrogen with oxygen. The partitioning ofthe early-time heat transfer (i.e., ratio of the radiative-to-total peak heatflux) is shown in Figure 30 plotted against the hydrogen concentration in airfor the burns with and without steam. Here we observe that heat transfershortly after combustion of a lean hydrogen:air environment is dominated byconvection. With the addition of steam to the atmosphere, radiation begins toplay a larger role in the early-time postcombustion heat transfer process dueto the increased gas emittance and *absorptance. However, as thehydrogen:air:steam flammability limits are approached by the addition of veryrich steam concentrations, convection again becomes the prevalent heattransfer mechanism due to the reduced combustion severity and lower post-
100
Uj
U-
a.-
0.1
0
+V 0
zb 0
++ 0 0
0BURN
L- -V 0 STEAM -
STEA04%STEAM
0 4)4%STEAM
0 10 20 30 40 50 60 70 80
% HYDROGEN IN HYDROGEN:AIR ONLY
Figure 29"Global" Peak Heat Flux for the Hydrogen:Air:Steam
Burns Shown as a Function of the HydrogenConcentration in Hydrogen:Air only
48

00.9 0
0. 0 + +3
0.8 7 0+ 0
~0.6 + 0
~0.5 + 00
~ .5+ 00 0S0.4 .+mDYBUN
+4
4r 0.3 a-)02%S]A
02 30 STE 20-30% STEAM
0.2. v7 - 30-40% STEAM
0 10 20 30 40 50 60 70 80
%HYDROGEN IN HYDROGEN:AIR ONLY
Figure 30Ratio of the "Global" Peak Radiative to Total Peak Heat
Flux for the Hydrogen:Air:Steam Burns shown as a Functionof the Hydrogen Concentration in Hydrogen:Air only
combustion gas temperatures. Therefore, for a particular hydrogen concentra-tion relative to air, the partitioning of the early postcombustion heat,transfer is governed by the extent of combustion and the quantity of steam inthe volume.
In Figure 31 the total energy deposition (i.e., the time-integrals of thecalculated heat fluxes) for the hydrogen:air:steam burns is shown plottedagainst the volumetric hydrogen concentration. From this plot, the combustionseverity again appears to increase with increasing steam content, especiallyfor burns containing less than -25% hydrogen by volume. Furthermore, theburns containing more than 40% steam by volume resulted in the greatest totalenergy depositions. If the same data are plotted against the hydrogenconcentration in air, as shown in Figure 32, the influence of steam is lessobvious. For moderate quantities of steam, the integral heat transfer is notappreciably changed since combustion is not significantly inhibited; i.e.,approximately the same combustion energy is released for these burns as the"dry" burns. However, the rich steam quantities begin to inhibit the normal
49

C4.E 100
0
00-LL 00~
z-LJ
0 1
00 +
4V0
+0+jt
+
+ + DYBURNS
* a20-0%STEAM* n30-0%STEAM0 -A0%STEAM
0 10 20 30 40 50 60 70 80
% HYDROGEN
"Global" CumulativeSteam Burns
Figure 31Total Energy Deposition for the Hydrogen:Air:with and without the Fans Operational
100
0U,
adW
z
0
40 000: 0 0
0P
,7 0 0 0
A 0
04-+ +
10 +
a * DY BURNS* 02%STEAM
E3- 0-0%STEAM7 -30-0%STEAM
0-)4%STEAM I
+
I. .1.... I I . . . . I . . . . I1
0 10 20 30 40 50 60 70 80
% HYDROGEN IN HYDROGEN~AIR ONLY
Figure 32"Global" Cumulative Total Energy Deposition for the Hydrogen:Air:
Steam Burns shown as a Function of the HydrogenConcentration in Hydrogen:Air only
50

combustion process and the total energydeposition) is correspondingly less. k~addition of more than -40% steam reduceEto -'50 J/cm2.
released (or equally the total energyan example, around stoichiometry thethe energy deposition from '-70 J/cm2
The partitioning of the heat transfer is significantly changed by theaddition of steam, as shown in Figure 33 where the ratio of the radiative tototal heat transfer quantities are shown against the volumetric hydrogenconcentration. The addition of steam greatly influences the radiative heattransfer mechanisms during the postcombustion cooling processes. For burnscontaining less than -10% hydrogen, the radiative heat transfer increases from'-50% of the total transfer for burns without steam to as much as -70% forthose with steam. Thus, radiation heat transfer is the dominant gas coolingmechanism following combustion of the lean burns with steam, although naturalconvection would be expected to ultimately dominate the late-time heattransfer process.
1
0.9
0.8
z 0.7
t0.60
W 0.5
a 0.4
0 0.3
0.2
0.1
0
A 00
OA 0+ A~0 0 An
0 0 0 0+-
+ - *DRY* BURNSA - >0-20% STEAM 7:o - 20-30% STEAMV -30-40% STEAM0 ->40% STEAM
0 10 20 30 40 50 60 70 80
% HYDROGEN IN HYDROGEN:AIR ONLY
Figure 33Ratio of the "Global" Radiative to Total Energy
Deposition for the Hydrogen:Air:Steam Burns
51
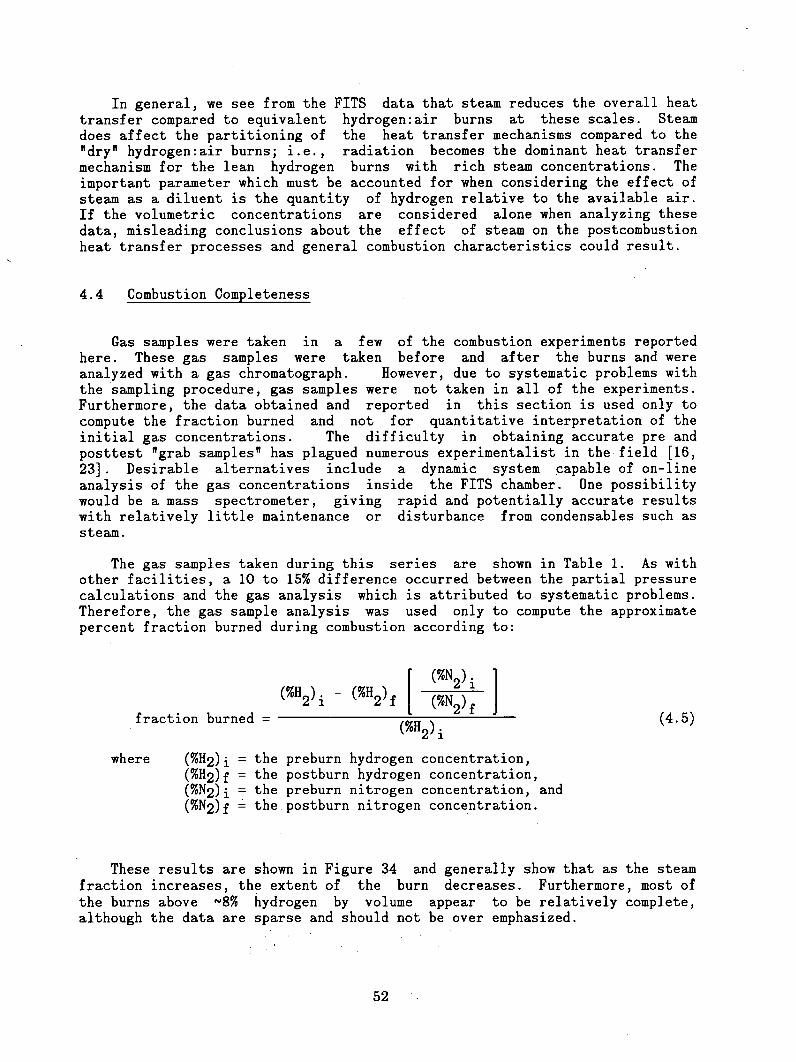
In general, we see from the FITS data that steam reduces the overall heattransfer compared to equivalent hydrogen:air burns at these scales. Steamdoes affect the partitioning of the heat transfer mechanisms compared to the"dry" hydrogen:air burns; i.e., radiation becomes the dominant heat transfermechanism for the lean hydrogen burns with rich steam concentrations. Theimportant parameter which must be accounted for when considering the effect ofsteam as a diluent is the quantity of hydrogen relative to the available air.If the volumetric concentrations are considered alone when analyzing thesedata, misleading conclusions about the effect of steam on the postcombustionheat transfer processes and general combustion characteristics could result.
4.4 Combustion Completeness
Gas samples were taken in a few of the combustion experiments reportedhere. These gas samples were taken before and after the burns and wereanalyzed with a gas chromatograph. However, due to systematic problems withthe sampling procedure, gas samples were not taken in all of the experiments.Furthermore, the data obtained and reported in this section is used only tocompute the fraction burned and not for quantitative interpretation of theinitial gas concentrations. The difficulty in obtaining accurate pre andposttest "grab samples" has plagued numerous experimentalist in the field [16,23]. Desirable alternatives include a dynamic system capable of on-lineanalysis of the gas concentrations inside the FITS chamber. One possibilitywould be a mass spectrometer, giving rapid and potentially accurate resultswith relatively little maintenance or disturbance from condensables such assteam.
The gas samples taken during this series are shown in Table 1. As withother facilities, a 10 to 15% difference occurred between the partial pressurecalculations and the gas analysis which is attributed to systematic problems.Therefore, the gas sample analysis was used only to compute the approximatepercent fraction burned during combustion according to:
(%H) - (%H )f[ (%N 2).i
,fraction burned 2 = % % 2)f (4.5)
where (%112)i = the preburn hydrogen concentration,(%H12)f = the postburn hydrogen concentration,(%N2)i = the preburn nitrogen concentration, and(%N2)f = the-postburn nitrogen concentration.
These results are shown in Figure 34 and generally show that as the steamfraction increases, the extent of the burn decreases. Furthermore, most ofthe burns above -8% hydrogen by volume appear to be relatively complete,although the data are sparse and should not be over emphasized.
52

Table 1Pre and Posttest Gas Sample Analysis for 14 Combustion Tests.
Burn Test %H2 %N2 %H2 %2FractionNumber ID Precombustion Postcombustion Burned
129 HECTRS 6.25 73.53 5.45 74.03 0.13130 HECTR6 7.11 75.97 5.73 74.41 0.18131 HECTR7 11.41 69.18 TRACE 85.89 1.00132 HECTR8 13.18 67.91 N.D. 84.85 1.00133 HECTR9 13.43 67.89 3.55 83.77 0.85134 HECT10 16.58 65.53 N.D. 87.44 1.00137 HECT13 5.40 75.09 0.68 80.01 0.88138 HECT14 7.80 73.47 N.D. 81.96 1.00139 HIECT15 10.04 70.43 N.D. 82.94 1.00140 HECT16 7.01 74.24 3.95 76.71 0.46142 HECT18 10.93 70.27 TRACE 82.73 1.00143 HECT19 13.52 68.55 N.D. 86.10 1.00144 HECT20 14.03 67.28 2.35 81.86 0.86145 HECT21 17.06 65.191 N.D. 87.75 1.00
TRACE = Trace amounts were detected in the sample.N.D. = None detected* Results are based on H2 +(02+AR) + N2 =100%" These gas analyses were performed by Sandia's Analytical
Chemistry Division and do not account for any water vaporpresent in the sample (i.e., dry gas analysis).
110
% t100
~70~60
0V 50
0 40S30
S20
0 10
0
'DRY* BRNSI+20XSTEAMI
4 OZ STAM
0 2 4 6 a 10 12 14 16 18 20
PREIGNITION HYDROGEN CONCENTRATION IN HYDROOEN&AIR ONLY
Figure 34Combustion Completeness Data shown Plotted against the
Precombustion Volumetric Hydrogen Concentration
53
5. CONCLUSIONS
This work has provided a complete data base for hydrogen:air:steamcombustion characteristics and flammability limits at intermediate scale.Experimentally observed flammability limits for hydrogen:air:steam mixtures inturbulent and quiescent environments were measured to within an average of+7.5 and +2.2% of the calculated hydrogen and steam concentration,respectively. An exponential peeling routine was used to define a correlationfor these data which describes the entire region of flammability and is givenby;
%Steam =100 - %H 2-~ 37. 3e-0 .0 07%11 2 - 518.0-e-0 .488%H2 (5.1)
This correlation may be used in reactor safety analysis codes for determiningthe flammability of a calculated mixture. It could also be used to estimatethe earliest time into an accident sequence that ignition of a hydrogen:air:steam environment could occur assuming an ignition source were available.
Transient combustion pressures have been measured for most of theseexperiments. The normalized combustion peak pressure (Pmax/Po) was found toincrease with increasing hydrogen concentrations of up to -30%, at which pointa decrease was observed for further increases in hydrogen concentration.Steam was found to decrease the normalized peak pressures compared to thehydrogen:air counterpart. Comparison of the experimentally measured peakpressure to the AICO calculated peak indicates that relatively completecombustion occurs (>95%) for hydrogen concentrations greater than -10%, whilelesser quantities of hydrogen are burned as the lean hydrogen:air flammabilitylimit is approached. Turbulence was found to increase the extent ofcombustion and combustion characteristics of the lean burns, while notappreciably affecting the combustion characteristics of rich burns. Ambientpreignition temperatures of '-300 K resulted in more severe combustionenvironments than equivalent burns at elevated temperature (-385 K). Thisresult is directly related to the decrease in hydrogen and oxygen mass as thebulk temperature increases for a given fixed volume (e.g., for a fixed volumeand air partial pressure, increases in the bulk gas temperature result inlesser quantities of hydrogen being introduced into the vessel to achieve thesame partial pressure condition). Thus, as we observed, more severe burns forcombustion experiments at lower preignition temperatures would be expected.
The experimental pressure signatures were used to infer the "~global"~total, convective and radiative postcombustion energy deposition (or thermalloading) and peak heat fluxes. These results indicate that burns at lowerpreignition temperatures tended to be more "severe than those at elevatedtemperatures. Convection was found to play the dominant role in the leaner(<15%) hydrogen:air burns, accounting for 70 to 90% of the postcombustion heattransfer while radiation and convection played equal roles near stoichiometry.Steam was found to increase the total energy deposition and peak heat fluxesif considered as a function of the volumetric hydrogen concentration,especially for hydrogen concentrations of 25% or less. If, however, the heattransfer results are considered as a function of the hydrogen concentration in
54

air, the addition of steam tends to decrease the total energy deposition andpeak heat fluxes. Thus, the postcombustion heat transfer characteristics aregoverned by the hydrogen concentration in air.
Radiation was found to dominate the postcombustion heat transfer processesfor lean hydrogen burns containing steam. Furthermore, comparisons to thelarge-scale NTS results show that the radiative fraction of the total energydeposition at this scale was approximately half that observed at large-scale.This result is a scaling phenomena; the partitioning of the radiative heattransfer is directly related to the characteristic length-scale for radiation.In particular, the gas emittance would be expected to approximately double dueto the increased radiation length scale; e.g., an increase in the radiationlength scale will effectively increase the gas emittance. Based ondifferences in vessel geometry and volume, the bulk gas emittance andradiative partition in the NTS tests would be expected to increase byapproximately twice the values observed in the FITS vessel.
Generally, the combustion pressures, "global" gas temperatures, and"global" heat transfer data provided in this report should be useful inassessing the importance of hydrogen:air:steam flammability limits andcombustion characteristics for nuclear reactor safety analyses. The dataprovide useful reference points for benchmarking existing and newly developedcomputer codes for hydrogen:air:steam combustion characteristics and forcontainment response modelling. These data should also provide usefulinformation for determining the response of safety-related equipment tohydrogen burns.
55

6. References
1. R. G. Zalosh et al., Analysis of the Hydrogen Burn in the TMI-2Containment, EPRI NP-3975, Factory Mutual Research Corporation,Massachusetts, April 1985.
2. Core-Meltdown Experimental Review, NUREG/CR-0205, SAND 74-0382(Revision), Sandia National Laboratories, Albuquerque, NM, March 1977.
3. M. P. Sherman et al., The Behavior of Hydrogen During Accidents in LightWater Reactors, NUREG/CR-1561, SAND8O-1495, Sandia National Laboratories,Albuquerque, NM, August 1980.
4. A. L. Camp et al., Light Water Reactor Hydrogen Manual, NUREC/CR-2726,SAND82-1137, Sandia National Laboratories, Albuquerque, NM, August 1983.
5. A. M. Shapiro and T. R. Moffette, Hydrogen Flammability Data andApplications to PWR LOCA, WARD-SC-545 Bettis Plant, 1957.
6. M. G. Zabetakis, Research on the Combustion and Explosion Hazards ofHydrogen-Water Vapor-Air Mixtures, Bureau of Mines, Pittsburgh,Pennsylvania, AECU-3327, September 1956.
7. M. Berman and J. C. Cummings, "Hydrogen Behavior in Light WaterReactors," Nuclear Safety, Vol. 25, No. 1, January-February 1984.
8. M. Berman et al., Light Water Rector Safety Research Program SemiannualReport, April-September 1982, NUREG/CR-3407, SAND83-1576, Sandia NationalLaboratories, Albuquerque, NM, October 1983.
9. H. Tamm et al., "A Review of Recent Experiments at WNRE on HydrogenCombustion," Proceedings of the Second International Conference on theImpact of Hydrogen. on Water Reactor Safety, M. Berman, J. Carey, J.Larkins, and L. Thompson (technical program committee), NUREG/CP-0038,EPRI RP 1932-35, SAND82-2456.
10. W. E. Lowry et al., Final Results of the Hydrogen Igniter ExperimentalProgram, NUREG/CR-2486, UCRL-53036, February 1982.
11. Tennessee Valley Authority, Sequoyah Nuclear Plant, Research Program onHydrogen Combustion and Control Quarterly Report #3, Appendix A.2, June1981.
12. D. Renfro et al., "Development and Testing of Hydrogen Ignition Devices,"Proceedings of the Second International Conference on the Impact ofHydrogen on Water Reactor Safety, M. Berman, J. Carey, J. Larkins, and L.Thompson (technical program committee), NUREG/CP-0038, EPRI RP 1932-35,SAND82-2456.
56
13. S. F. Roller et al., "Medium-Scale Tests of H2:Air:Steam Systems,"Proceedings of the Second International Conference, on the Impact ofHydrogen on Water Reactor Safety, M. Berman, J. Carey, J. Larkins, and L.Thompson (technical program committee), NUREG/CP-0038, EPRI RP 1932-35,SAND82-2456.
14. D. D. S. Liu et al., Canadian Combustion Studies Related to NuclearReactor Safety Assessment, Available as Atomic Energy of Canada ReportAECL-6994, October 1980.
15. H. F. Coward and G. W. Jones, Limits of Flammability of Gases and Vapors,Bulletin 503, U. S. Bureau of Mines, Washington D. C., 1952.
16. W. B. Benedick et al., Combustion ofCylindrical Tank, NUREG/CR-3273,Laboratories, Albuquerque, NM, May 1984.
Hydrogen:Air Mixtures in the VGESSAND83-1022, Sandia National
17. R. K. Kumar et al., Intermediate-Scale Combustion Studies of Hydrogen-Air-Steam Mixtures, EPRI NP-2955, Electric Power Research Institute, June1984.
18. A. C. Ratzel, Data Analyses for NeCombustion Tests, NUREG/CR-4138,Laboratories, Albuquerque, NM, May 1985.
vada Test Site (NTS)SAND85-0135, Sandia
PremixedNational
19. B. W. Marshall, Jr., Flammability Limits and Combustion Characteristicsof Hydrogen:Air:Steam at Intermediate Scale, Proceedings of the ANS/ENSTopical Meeting on the Operability of Nuclear Power Systems in Normal andAdverse Environments, Albuquerque, NM, September" 29 - October 3, 1986.
20. B. W. Marshall, Jr., Hydrogen:Air:Steam Flammability Limits andCombustion Results at Intermediate Scale, Presented at the 1986 SpringTechnical Meeting of The Combustion Institute, Banff, Alberta, Canada,April 28 - 30, 1986.
21. S. Gordon and B. J. McBride, Computer Program for Calculation of ComplexChemical Equilibrium Compositions, Rocket Performance, Indicent andReflected Shocks, and Chapman-Jouguet Detonations, NASA SP-273,Washington DC: Scientific and Technical Info Of c, NASA, 1971.
22. A. C. Ratzel, S. N. Kempka, J.Reduction Package for AnalysisSAND83-2657, Sandia National1985.
23. S. F. Roller, Pressure Measure:Hydrogen-Air Combustion Test S,3721 (1 of 2), SAND83-2621Albuquerque, NM, March 1985.
24. B. W. Marshall, Jr. and A.Hydrogen Combustion EnvironmiTransducers, NUREG/CR-3721 (!National Laboratories, Albuque:
E. Shepherd, and A. W. Reed, SMOKE: A Dataof Combustion Experiments," NUREG/CR-4136,Laboratories, Albuquerque, NM, September
rients in a Hydrogen Combustion Environment:,ries 1 and 2 in the FITS Tank, NUREG/CR-(1 of 2), Sandia National Laboratories,
Ratzel III, Pressure Measurements in amnt: An Evaluation of Three Pressure!of 2), SAND83-2621 (2 of 2), Sandia
-que, NM, May 1984.
57

25. E. H. Richards and J. J. Aragon, Hydrogen-Burn Survival Experiments atFully Instrumented Test Site (FITS), NUREG/CR-3521, SAND83-1715, SandiaNational Laboratories, Albuquerque, NM, August 1984.'
26. M. Berman, ed., Light Water Reactor Safety Research Program SemiannualReport, April-September 1981, NUREG/CR-2481, SAND82-0006, Sandia NationalLaboratories, Albuquerque, NM, October 1982.
27. 1. L. Drell and F. E. Belles, Survey of Hydrogen Combustion Properties,National Advisory Committee for Aeronautics, Report 1383, 1958, Update1975.
28. C. C. Wong, HECTR Development and As sessment, SAND85-1792C, Proceedingsof the 13th-l Water Reactor Safety Research Information Meeting,Gaithersburg, MD, October 1985.
29. A. L. Camp, M. J. Wester, and S. E. Dingman, HECTR Version 1.0 User'sManual, NUREG/CR-3913, SAND84-1522, Sandia National Laboratories,Albuquerque, NM, February 1985.
30. R. E. Henry, et al., Technical Report 16.2-3 MAAP Modular AccidentAnalysis Program User's Manual-Vol. I, Industry Degraded Core RulemakingProgram, August 1983.
31. A. C. Ratzel and J. E. Shepherd, "Heat Transfer Resulting from PremixedCombustion," Heat Transfer and Fire and Combustion Systems, HTD-Vol.. 45,Published by ASME, SAND84-2262C, August 1985, pp 191-202.
32. S. N. Kempka, A. C. Ratzel, A. W. Reed, and J. E. Shepherd,Postcombustion Convection in an Intermediate-Scale Vessel, Proceedings ofthe joint ANS/ASME conference on design, construction, and operation ofNuclear Power Plants, Portland, Oregan, SAND83-2180C, August 1984.
58

APPENDIX 1
Corrected Initial Data
This appendix presents the corrected initial precombustion gasconcentrations of hydrogen and steam as well as the initial temperature andpressure for each of the 239 burns performed in this test series. Forconvenience, the burn have been numbered to provide a method of correlatingthe initial data to the combustion pressure and "global" heat transfer resultspresented in subsequent appendices and throughout this report. The type ofignition for each test was classified according to the following:
S = Spark plug ignition;G = Glow plug ignition;M = Marginal ignition (i.e., AP/APaicc •0.1);N = No detectable ignition.
The preignition gas turbulence is either given a fans-on designation ('0') ora fans-off designation ('F') depending upon the condition of the fans at thetime of ignition.
59

BURN TEST ID % 112 %H20 P0 To IGN. FAN(atm) (K)
12345678910111213141516171819202122232425262728293031323334353637383940414243444546
1106S30S301106S301105S30H05S30110530S05H130S05H130S06H130S07111107S40071140S06HS54005HS401105S401105S401107S501106S50S501106S501105O0ilSOSOSESOS50SH051108550S501108HlOS501113S50Hl10S551110S60Hl10S60101H60S11110S55H108H120S45H120S50S50H120S501120H120S48S481120H130S431130S43H130S401130S38101H20SH130S3540S30H1S451130
7.676.615.746.266.516.877.529.048.84
10.258.136.897.377.177.499.008.268.518.316.178.476.039.329.44
11.6615.4111.419.927.658.979.978.8119.9422.7522.3321.2821.5720.8830.9231.2830.5330.608.96
30.4131.0230.97
26.1629.4630.0726.5124.8830.7827.9829.3329.4334.1038.0738.0838.0337.5136.8447.8645. 1142.7145.3845. 1141.7046.4445.5445.7143.9138.0644.4549.7550.6150.330.00
45.4837.1141.3044.2046.0143.4745.2941.0741.1739.3936.7722.9633.6738.0443.30
1.181.231.211.181 .151.251.211.261.251.401 .471 .421.411.401.371.761.631.611.671.641.671.671.761.801.821.701.801.941.871.910.891.751.952.172.432.382.252.272.762.752.522.351.132.182.482.98
368.85370.75379.35363.85355.45373.45367.25379.65379.25366.45379.65379.85380.35374.05374.45392.55378.45369.35381.05379.15364.85382.75383.15382.35379.25376.45375.95
381.05378.45359.45379.65379.85384.55382.55381.95378.85383.45385.95386.25376.05386.35382.05375.35384.35385.75
60

BURN TEST ID % 112 %H20 P0 To IGN. FAN(atm) (K)
4748495051525354555657585960616263646566676869707172737475767778798081828384858687888990
43SH13030HS40H140S30H140S3510HS1540H33S30SH14033SH14006HS3030SH10607HS40S4007H150SH107H150S25S30H140S3040H130H1S35S4520H1H4030S50SH20S 501115151140S30S15H150H1S10H150S205011S20i5SS1511SI 01115H12015Sl0S13H1H5HF1111F1161F11F51111F5118HFW811WF60H110SH160S5115025SFW8HH16010S10111H160Sl5
30.9130.6239.8937.378.44
41.8741.2041.255.725.546.776.646.81
50.3921.2340.4429.8020.2640.2920.2614.9214.2915.2749.2950.4650.3614.4014.4018.9411.893.445.035.545.005.606.967.77
60.6758.7750.568.4357.239.41
57.18
41.2739.1830.8337.3118.1330.9928.3331.5330.4530.3839.2840.4248.9125-0347.9729.5235.3044.4029.6648.1249.3240.5229.1810.8319.3019.4717.1413.5617.2214.180.000.000.000.000.000.000.009.076.80
24.300.007.850.0016.86
2.752.542.603.011.082.802.472.771.241.241.461.481.793.122.522.592.262.212.582.502.171.711.421.992.592.621 .171.111.251.070.840.830.830.830.830.840.852.642.273.080.882.410.923.10
388.55375.85395.65391.75395.75386.55381.05385.25384.95385.55377.45385.75383.55387.35382.85381.65387 .05
388.65382.65379.95389.75387 .15
391.35391.25384.65392.45391.15S403 .0S397.55392.75384.75406.15393.75394.45389.35311.55352.25393.25396.35393.55311 .05382.55392 .0S377.85
NGGNSNMNMGMSSNGGGGCGGSCGGCSSSSNNSNNSSGGNSCSN
61

BURN TEST ID % H2 %H20 P0 To IGN. FAN(atm) (K)
919293949596979899100101102,103104105106107108109110ill112113114115116117118119120121122123124125126127128129130131132133134135136
S5010HH1010SGC06GC08INIT1INIT2INIT3INIT4INIT5INIT6INIT7INIT8INITOFLANKiFLAMM2FLAWMFLAMM4FLAMM5FLAMM6FLAMM7FLAMM8FLAIAM9FLAM10FLAY11FLAM12FLAM13FLAM14FLAM15FLAM16FLAM17FLAN18FLAM19FLAM20FLAM21HECTRlHECTR2HECTR3HECTR4HECTR5HECTR6IIECTR7HECTR8HECTR9HECT10HECT11HIECT12
10.958.705.867.249.309.43
11 .5510.0214.4920.176.419,8311.1910.9111.4111.1511.1411 .2013.8013.7212.4812.6613.2315.5016.5417.1217.6417.6717.048.238.379.039.098.836.284.946.3810.804.866.368.88
11 .479.73
10.686.246.74
42.8515.680.000.000.000.000.000.000.000.000.00
0.00
46.6853.5650.8552.9754.8554.6752.3151.1252.2349.2248.0144.8748.7545.4852.3548.0148.6348.8849.1254.5351.720.000.000.000.0020.4421.0421.6521.3738.7741.230.000.00
1.811.120.860.870.900.940.980.900.951.020.860.900.922.062.402.222.282.432.642.442.262.362.242.302.132.442.262.842.341.941.971.982.382.110.870.840.850.951.111.121.161.211.571.690.880.88
385.55392.65292.65293.85296.25296.85296.25293.85296.25298.55302.75296.25298.05393.85382.05392.65384.35384.95393.85384.35398.55392.65384.95395.05387.35396.25386.75404.45380.85396.25400.35390.85392.65390.25374.35373.15373.15380.85384.35382.55384.35368.95387.95390.85383.15393.85
62

BURN TEST ID % H2 %H20 P0 To ION. FAN(atm) (K)
137138139140141142143144145146147148149150151152153154155156157158159160161162163164165166167168169170171172173174175176177178179180181182
HECT13HIECT14HECT15HECT16HECT17BIECT18BECT19HECT20HECT21H20HDýARTiART2ART3ART4ARTSART6PRES1PRES2PRES3PRES4PRESSPRES6PRES7PRES8PRESOPRES10PRES11PRES12PRES13PRES14PRES15PRES16PRES 17PRES18PRES19PRES20PRES21PRES22PRH10QAPRH 10BPRH20APRH20BPRH25APRH25BPRH30APRH30B
6.037.8310.196.638.538.879.709.09
10.0116.855.62
12.9114.7415.768.02
15.569.90
18.9529.539.29
19.319.36
20.5231.3210.2611 .0519.459.67
10.369.259.62
22.65Ii1.479.5310.129.1319.6911.439.349.36
20.0918.9824.3224.1629.23
0.000.000.0018.8117.9716.6219.3936.3437.430.000.000.000.000.000.000.000.000.000.000.000.000.000.000.000.000.000.000.000.000.000.000.000.000.000.000.000.000.000.000.000.000.000.000.000.000.00
0.870.880.911.081.101.091.141.461.530.980.840.950.960.960.870.950.911.011.140.891.020.911.031 .170.920.911.010.890.910.900.911.060.940.940.930.921.050.940.870.860.960.941.011.051.131.16
383.75393.85392.65387.35384.35389.65388.55385.55383.75384.35376.65377.25387.35377.85295.65295.05296.85298.05300.95306.25306.85296.85297.45300.35305.65305.65305.65298.05295.0OS296.85298.55296.25370.75374.35379 .0S355.35359.55398.55293.25296.85297.45300.35303.35295.05299 .15
303.35
63

BURN TEST ID % H2 %H2 0 P0 T IGN. FAN(atm) (K)
183184185186187188189190191192193194195196197198199200201202203204205206207208209210211212213'214215216217218219220221222223224225226227228
PRH10CPRH20CPRH10DPRH30CPRH35APRH10HPRH20SPRSH20PRH50APRH60APRH30DPRH40APRH40SPRSH40PR40HSPRH70AH1OHDLASTILAST2LAST3LAST4LASTSLAST6LAST7LAST8LAST9LAST10LAST11LAST12LAST 13LAST14LAST15LAST16RANGE 1RANGE2RANGE3RANGE4RANGESRANGE6RANGE7RANGE8RANGE9RANG10RANG 11RANG 12RANG13
10.9819.1811. .24'31.3334.7410.5519.0319.0651.5359.9330.0839.9937.5338.8638.5268.377.0910.2110.6826.1827.5826.34
25.8626.4328.6525.9926.8225.8326.3426.6925.4326.359.78
18.5110.288.94
18.939.9711.1418.5327.9710.0620.7630. 1610.80
0.000.000.000.000.000.0022.2715.710.000.000.000.0023.7821.7617.410.000.000.000.000.000.000.000.000.000.000.000.000.000.000.000.000.000.000.000.000.000.000.000.000.000.000.000.000.000.000.00
0.961.100.941.221 .320.921 .391.211.642.021.171.372.042.051 .822.580.870.930.921.121.121.121.121.121.121.151.141.141.121.131.141.121.140.901.010.910.891.000.900.911.021.140.911.031.180.93
308.65307.45301.55301.55306.85370.15382.55384.95377.25378.45358.95355.95382.55393.25389.65392.05390.85306.8S305.65293.85306.25296.25302.15305.65310.45313.95298.55303.95308.65310.45315.15318.15S318.75293.15292.65296.25296.25296.85293.25296.25300.95300.95304.55303.95306.8S296.25
SSSSSSS.SSSSSSSSSSGGSSSSSGGGSGSGGGSSSSSSSSSSSSS
64

BURN TEST ID % H2 %H20 P0 To ION. FAN(atm) (K)
229 RANG14 20.41 0.00 1.04 296.25 S a230 RANG15 30.42 0.00 1.18 300.35 S a231 RANG16 12.65 0.00 0.95 305.65 S 0232 RANG17 20.16 0.00 1.04 308.05 S 0233 RANG18 9.31 0.00 0.91 297.45 S 0234 RANG19 19.79 0.00 1.04 298.55 S 0235 RANG20 30.17 0.00 1.19 302.75 S 0236 RANG21 9.99 0.00 0.92 308.65 S a237 RANG22 20.11 0.00 1..04 309.25 S 0238 RANG23 30.02 0.00 1.19 294.45 S 0239 RANG24 9.98 0.00 0.92 302.15 S 0
65

APPENDIX 2Experimental Uncertainty Analysis
As discussed in Section 3 of this report,. the volumetric gas compositionswere calculated using partial pressure calculations. The error or uncertaintyassociated with these calculations .can be estimated using a Kline-McClintockuncertainty analysis [2.1]. In this analysis, the uncertainty associated witha calculated results r can be estimated as
ar w r r ) I8n x 0.5a'x1 x.1 I +[ 2 Wx2 I+ +[L(A2-1)
where xj, x2, ... ,I and Xn are the independent variables and wxl, wx2, ... , andwxn are the uncertainties associated with each experimental measurement.
Using this technique, the uncertainty associated with the partial pressurecalculations defined by Equations (3.1), (3.2), (3.8), and (3.9) can beestimated. If this technique is applied to the equation defining the hydrogenpartial pressure (Equation (3.8)), the uncertainty associated with thiscalculation is given by;
Phyd ( I 13 ] 2o[w2 + (P2
T2
2 2 0.w T2 ) (A2-2)
In a like manner, the uncertainty associated with the steam partial pressurecalculation (Equation (3.9)) is
w stm 1 1 + T3 T 2T 2 I0 r 2
wP + ( P2 2 w2 ] }0.5 (A2-3)
If the hydrogen and steam concentrations are calculated using Equations (3.1)and (3.2), respectively, then the uncertainty associated with these calculatedresults can be expressed as
w %hyd={ [P stm
2I + wpair
P stm
12+ Phyd- air
P stm
2 j0.5V stml
(A2-4)
and
w sm= f[ P stm
12 I P stm) * Psm] . (A2-5)
Therefore, the uncertainty associated with these calculations can be estimatedif the uncertainty of each measurement is known.
66
For this analysis, the uncertainty of the experimental measurements areassumed to be +10C for the temperature measurements and +0.0073 kPa (0.5 psia)of the static pressure measurement.' On the average, the uncertainty of thecalculated initial volumetric percentages for hydrogen and steam were within+7.5 % and +2.2 %, respectively, of the calculated concentration.
The experimental error of the dynamic pressure measurements can beestimated by considering each component in the data acquisition system at thefacility. Generally, the pressure gauges used during this experimental serieswere found to be accurate to within + -"5% over the entire range of the gaugeresponse. The dynamic amplifiers are reported as being accurate to within0.1% of the gain setting which has been checked and calibrated during thecourse of testing. The ADCs are accurate to within +9.8 mV (equivalent toone-bit of resolution) of the actual voltage which was generally smallcompared to the actual voltage reading and should introduce relatively smallerrors (i.e., < 1%). Thus, the integral error associated with the transientcombustion pressure measurements were estimated to be within -"10%.
The uncertainty associated with the heat transfer calculations as inferredfrom the pressure signals has not been addressed in this work, but the readershould refer to Reference 2.2 for information pertaining to these codes.
References
2.1. J. P. Holman, Experimental Methods for Engineers, Third Edition,McGraw-Hill Book Company, 1978.
2.2. A. C. Ratzel, S. N. Kempka, J. E. Shepherd, and A. W. Reed, SMOKE: AData Reduction Package for Analysis of Combustion Exper iments,"NUREG/CR-4136, SAND83-2657, Sandia National Laboratories, Albuquerque,NM~, September 1985.
67
APPENDIX 3
Combustion Pressure Data for theHydrogen: Air Burns
This appendix presents combustion pressure data for each of the hydrogen:air burns conducted. Included are the normalized peak pressures, the ratio ofthe measured peak to AICO calculated peak pressure, the combustion duration(measured as the time from ignition to the peak pressure), the mean pressurederivative, and the "global" bulk gas temperature as inferred from thecomputer programs referred to as SMOKE. Note that if the experimental datawere not available due to hardware failures or experim *ental difficulties, thecolumns are appropriately marked with "NA" (Not Available). If the test wasnot processed using the suite of computer programs referred to as SMOKE, thegas temperature column is appropriately label with "NP." Also, the burnnumber is given and Appendix 1 should be referenced for the initial conditionsof the burns reported.
68

Q max Pmax AP (atm) TmaxBurn %H2 in air %H20 -At
PO Paicc (S) At(s) T
31798283878993949596979899
100101102103125126127128135136137138139146147148149150151152153154155156157158159160161162163164
9.975.546.967.778.439.415.867.249.309.4311.5510.0214.4920. 176.419.8311.196.284.946.3810.806.246.746.037.83
10.1916.855.62
12.9114.7415.768.02
15.569.90
18.9529.539.29
19.319.36
20.5231.3210.2611 .0519.459.67
9.975.546.967.778.439.415.867.249.309.43
11.5510.0214.4920. 176.419.83
11 .196.284.946.38
10.806.246.746.037.83
10.1916.855.62
12.9114.7415.768.02
15.569.90
18.9529.539.29
19.319.36
20.5231.3210.2611 .0519.459.67
0.000.000.000.000.000.000.000.000.000.000.000.000.000.000.000.000.000.000.000.000.000.000.000.000.000.000.000.000.000.000.000.000.000.000.000.000.000.000.000.000.000.000.000.000.00
2.951 .622.322.682.592.721.662.281.683.213.694.285.356.612.094.054.381.511.492.302.832.031.932.102.732.914.932.303.203.994.133.125.143.766.157.713.606.153.626.197.803.633.455.963.81
0.810.670.710.840.800.830.540.650.410.780.780.990.980.990.660.960.950.560.630.840.770.770.720.810.930.841.000.910.780.910.890.840.890.880.950.970.900.970. 880.910.970.850.770.930.91
1.222.452.790.890.900.524.707.841 .320.88NA
0.400.200.139.300.360.332.404.841.080.550.740.800.730.510.47NA
4.770.690.200.140.780.220.510.070.030.460.070.560.080.030.461.030.090.43
1 .430.210.401.611.903.080.120.140.462.35NA
7.4421.0644.00
1.017.609.510.180.091 .092.931.201.031.302.963.71NA
0.233.03
14.1621.462.3617.624.93
80.00263.8
4.9973.774.28
66.96283.9
5.272.17
55.675.88
3.1l1I1.672.412.803.082.861.722.581.763.37
NP4.515.787.362.174.274.641.551.532.383.002.102.002.172.843.08NP
2.373.434.324.503.265.583.966.818.893.786.823.816.909.003.833.666.624.01
69

%H2 Pmax Pmax AP (atm) TmaxBurn %H12 in air %H120 -At
PO Paicc (S) At(s) T
165166167168169170171172173174175176177178179180181182183184185186187188191192193194198199200201202203204205206207208209210211212213214
10.369g.259.62
22.6511.479.5310.129.1319.6911.439.439.36
20.0918.9824.3224. 1629.2329.4710.9819.1811.2431.3334.7410.5551.5359.9330.0839.9968.3711.4610.2110.6826.1827.5826.3427.2825.8626.4328.6525.9926.8225.8326.3426.6925.43
10.369.259.62
22.6511.479.5310.129.1319.6911.439.349.36
20.0918.9824.3224. 1629.2329.4710.9819.1811.2431.3334.7410.5551.5359.9330.0839.9968.3711.4610.2110.6826.1827.5826.3427.2825.8626.4328.6525.9926.8225.8326.3426.6925.43
0.000.000.000.000.000.000.000.000.000.000.000.000.000.000.000.000.000.000.000.000.000.000.000.000.000.000.000.000.000.000.000.000.000.000.000.000.000.000.000.000.000.000.000.000.00
3.673.693.536.653.162.812.793.114.852.743.883.956.546.077.267.337.667.633.486.063.817.637.763.205.42,4.646.666.373.722.892.982.507.787.317.907.567.437.337.167.707.537.347.297.317.29
0.830.910.850.920.810.820.790.890.870.750.940.960.980.950.990.980.960.960.790.960.840.950.990.860.960.920.990.960.880.780.710.570.990.951.010.980.990.980.931.000.980.990.980.991.01
0.530.530.620.050.461.161.270.930.091.100.470.430.060.090.030.030.020.030.460.070.410.030.020.380.040.080.030.030.24
NA4.017.00
NA0.030.030.030.030.030.030.030.030.030.040.030.03
4.554.533.70
125.84.471 .461.312.08
47.031 .495.205.90
83.1353.60
185.9229.0327.4307.6
5.1476.306.44
310.8447.813.08
176.788.00
207.4238.229.09NA0.460.20NA
207.9309.1262.4218.2253.2283.4305.5256.7,236.7203.1239.9234.7
3.883.883.717.493.372.962.953.265.392.914.014.157.286.728.238.308.838.803.696.724.058.818.943.386.045.087.687.263.99
NA3.152.65
NA8.338.808.658.338.308.198.548.448.268.298.098.01
70

%H max Pmax, AP (atm) TmaxBurn %H2 in air %H20 -At
PO Paicc (S) At(s) T
215 25.35 25.35 0.00 7.22 1.00 0.03 236.3 8.00216 9.78 9.78 0.00 2.83 0.66 4.10 0.40 2.97217 18.51 18.51 0.00 5.60 0.87 0.14 33.34 6.18218 10.28 10.28 0.00 2.96 0.68 3.78 0.47 3.13219 8.94 8.94 0.00 3.52 0.89 1.23 1.83 3.69220 18.93 18.93 0.00 6.04 0.94 0.13 38.99 6.68221 9.97 9.97 0.00 3.68 0.85 0.91 2.65 3.88222 11.14 11.14 0.00 3.90 0.84 0.35 7.49 4.14223 18.53 18.53 0.00 5.56 0.87 0.06 79.65 6.01224 27.97 27.97 0.00 6.22 0.80 0.12 49.18 NP225 10.06 10.06 0.00 3.62 0.86 0.40 6.00 3.82226 20.76 20.76 0.00 5.90 0.88 0.05 107.4 NP227 30.16 30.16 0.00 7.40 0.94 0.03 260.7 8.55228 10.80 10.80 0.00 3.71 0.82 0.34 7.42 3.93229 20.41 20.41 0.00 6.02 0.89 0.09 54.77 6.71230 30.42 30.42 0.00 7.63 0.95 0.03 270.9 8.82231 12.65 12.65 0.00 3.43 0.70 0.40 5.77 3.67232 20.16 20.16 0.00 5.71 0.88 0.11 43.74 6.36233 9.31 9.31 0.00 3.48 0.85 0.44 5.21 3.65234 19.79 19.79 0.00 5.79 0.88 0.12 43.30 6.43235 30.17 30.17 0.00 7.48 0.94 0.03 233.5 8.63236 9.99 9.99 0.00 3.50 0.85 0.40 5.72 3.70237 20.11 20.11 0.00 5.63 0.88 0.10 48.20 6.27238 30.02 30.02 0.00 7.80 0.95 0.07 124.5 9.02239 9.98 9.98 0.00 3.58 0.85 0.47 5.10 3.78
71

APPENDIX 4
Global Heat Transfer Data for theHydrogen:Air Burns Processed with SMOKE
This appendix presents the "global" heat transfer data for the hydrogen:air burns processed with the suite of computer program referred to as SMOKE.Included are data for the total and radiative peak heat flux and cumulativeenergy depositions. Note that the maximum energy deposition calculated usingadiabatic isochoric combustion conditions are presented for each burnprocessed for comparison. Also shown are comparisons (i.e., ratios) of theradiative and total energy depositions and peak heat fluxes, indicating thepartitioning of the postcombustion heat transfer. The burn number for eachtest is given and Appendix 1 should be referenced for the initial conditionsof the burns reported.
72

Burn %H2 Q(AIC) Q(TOT) Q(RAD) Q(A) q(TOT) q(RAD) qRD
J/CM2 - Q(T0T) W/cm2-L- q(TOT)
31125127'128135136137138139153155156157158159160161162163164165166167168169170171172173174175176177178179180181182183184185186187188191
9.976.286.38
10.806.246.746.037.83
10.199.90
29.539.29
19.319.36
20.5231-3210.2611 .0519-459.67
10.369.259.62
22.6511.479.53
10.129.13
19.6911 .439.349.36
20.0918.98
24.1629.2329.4710.9819.1811 .2431.3334.7410.5551.53
25.6115.1215.96
26.0014.2715.5213.9618.0024.4331.12100.827.7664.5829.5471.40105.432.0734.0264.9829.8432.7428.8830.0580.2030.2224.5425.6224.2957.7827.8028.2427.9565.1960.1378.7584.0296.57101.735.2369.4135.92109.5116.027.3792.30
14.013.059.72
13.137.366.908.10
13.3015.5024. 1187.4821.6554.9022.5657.1690.9622.6519.9551.2023.7923.3623.0221.8263.2717.1113.5511.8113.0235.8812.0023.7723.9956.7450.7570.6075.3690.1987.9622.4958.0425.5092.8098.9617.7666.45
6.541.693.168.492.112.132.445.177.135.84
41.635.63
30.616.01
32.6139.746.496.30
32.206.186.885.746.08
36.897.456.005.585.15
21.846.486.436.89
33.5126.8043.1043.2438.6939.036.79
32.607.72
47.5440.34
7.8536.89
0.470.550.330.650.290.310.300.390.460.240.480.260.560.270.570.440.290.320.630.260.300.250.280.580.440.440.470.400.610.540.270.290.590.530.610.570.430.440.300.560.300.510.410.440.56
5.620.203.393.091.471.471.664.245.419.27
101.76.66
39.885.92
36.57109.6
6.8910.4538.067.515.997.915.20
58.905.826.676.798.95
38.176.996.547.00
41.1234.9470.7278.76
123.5106.4
6.3539.467.74
87.13118.6
6.6560.38
2.960.120.842.910.510.480.592.353.573.59
75.903.26
34.903.07
33.7676.973.603.03
31.453.803.463.382.88
43.614.192.442.762.96
25.593.363.654.09
39.1530.3765.9365.0177.5776.183.46
34.184.45
77.4679.314.49
48.87
0.530.600.250.940.350.330.360.550.660.390.750.490.880.520.920.700.520.290.830.510.580.430.550.740.720.370.410.330.670.480.560.580.950.870.930.830.630.720.550.870.580.890.670.680.81
73

Q(RAD) q(RAD)Burn %H2 Q(AIC) Q(TOT) Q(RAD) - q (TOT) qfRAD)
J/cm2 Q(TOT) - W/cm - q(TOT)
192193194198203204205206207208209210211212213214215216217218219221222223225227228229230231232233234235236237238
59.9330.0839.9968.3727.5826.3427.2825.8626.4328.6525.9926.8225.8326.3426.6925.4326.359.78
18.5110.288.949.97
11.1418.5310.0630.1610.8020.4130.4212.6520.169.31
19.7930.179.99
20. 1130.02
94.7386.6098.0591.1894.2894.7295.0390.6990.4096.1994.9095.0689.5290.9991.2785.7889.5131.0264.3832.6727.6031.5536.1063.5831.10103.534.9271.67106.340.5268.4929.2069.46105.830.6667.92108.9
63.6965.9369.0258.7980. 6485.8882.5780.2978.6377.9385.4283.2478.3979.2678.8476.0976.7614.6948.13
8.3019.5521.5525.7045.1922.6483.7024.2953.8387.8622.5049.9321.4651.8487.4721.3350.3790.73
32.1639.7440.8524.2944.0143.6744.6744.9644.4349.2544.8645.3645.1344.7342.9941.9843.343.93
30.921.236.305.907.53
26.895.72
44.726.28
27.3448. 116.47
28.364.89
27.7647.605.63
28.5949.30
0.510.600.590.410.550.510.540.560.570.630.530.550.580.560.540.550.570.270.640.150.320.270.290.600.250.530.260.510.550.290.570.230.540.540.260.570.54
35.3099.8192.7121.74
100.5102.999.8297.2396.3890.38
103.498.7994.8295.5798.7296.0196.792.43
26.122.985.84
11 .18
7.5427.476.94
69.286.62
27.1972.185.76
24.775.41
25.2285.196.37
26.9488.22
27.9973.2974.0713.6274.1574.3274.2873.0673.2174.2974.1774.3172.7773.1873.5472.1473.14
1.0424.050.252.573.044.45
21.343.46
68.863.51
26.9971.923.32
24.772.55
25.1576.273.20
26.9476.86
0.790.730.800.630.740.720.740.750.760.820.720.750.770.770.750.750.760.430.920.080.440.270.590.780.500'. 990.530.991.000.581.000.471.000.900.501.000.87
74

APPENDIX 5
Combustion Pressure Data for theHydrogen: Air:Steam Burns
This appendix presents the combustion pressure information for each of thehydrogen:air:steam burns which were conducted in this test series. Includedare the normalized peak pressures, the ratio of the measured peak to AIOCcalculated peak pressure, the combustion duration (measured as the time fromignition to the peak pressure), the mean pressure derivative, and the 'global"bulk gas temperature as inferred from the suite of computer programs referredto as SMOKE. Note that if the experimental data were not available due tohardware failures or experimental difficulties, the columns are appropriatelymarked with "NA" (Not Available). If the test was not processed using thesuite of computer programs referred to as SMOKE, the gas temperature column isappropriately label with "NP." As in the previous appendices, the burn numberis given and .Appendix 1 should be referenced for the initial conditions of theburns reported.
75

Results for burns with 0 to 20%_steam by volume
%H12 Pmax Pmax AP (atm) TmaxBurn %H2 in air %H2 0 At
I'0 Paicc (S) At(s) T
51 8.44 10.30 18.13 2.02 0.68 6.21 0.18 2.1270 49.29 55.28 10.83 4.04 0.86 0.34 17.99 4.4171 50.46 62.54 19.30 3.27 0.83 1.33 4.44 3.5072 50.36 62.53 19.47 2.97 0.76 2.00 2.59 3.1873 14.40 17.37 17.14 3.61 0.87 0.51 5.98 3.9074 14.40 16.66 13.56 3.69 0.91 0.36 8.39 3.9875 18.94 22.88 17.22 4.58 0.96 0.10 43.82 5.0676 11.89 13.85 14.18 3.25 0.88 0.76 3.18 3.4684 60.67 66.72 9.07 3.06 0.76 1.12 4.87 3.2785 58.77 63.05 6.80 3.68 0.85 0.36 16.86 3.9788 60.67 6.0 9.07 3.82 0.85 0.42 16.19 4.1492 8.70 10.32 15.68 2.40 0.79 2.30 0.68 2.51
140 6.63 8.17 18.81 1.60 0.61 1.02 0.64 1.66141 8.53 10.40 17.97 2.55 0.84 0.80 2.15 2.67142 8.87 10.64 16.62 2.54 0.82 0.79 2.15 2.65143 9.70 12.03 19.39 2.84 0.87 0.63 3.33 2.99190 19.06 22.61 15.71 4.65 0.94 0.12 48.91 5.14197 38.52 46.64 17.41 NA NA NA NA NP
Results for burns with 20-30% steam by volume
%H2 Pmax Pmax AP(atm) TinaxBurn %H12 in air %H20 At
PO Paicc (S) At(s) To
1 7.67 10.39 26.16 1.18 0.40 5.65 0.04 1.232 6.61 9.36 29.46 1.14 0.43 3.98 0.12 1.185 6.51 8.66 24.88 1.28 0.47 3.52 0.09 1.328 9.04 12.79 29.33 1.13 0.36 5.43 0.03 1.199 8.84 12.52 29.43 1.28 0.42 3.56 0.10 1.34
43 8.96 11.63 22.96 2.28 0.73 4.59 0.31 2.3953 41.20 57.48 28.33 3.26 0.83 1.34 4.15 3.4962 40.44 57.38 29.52 2.90 0.75 1.26 3.87 3.0965 40.29 57.29 29.66 2.97 0.77 1.81 2.81 3.1869 15.27 21.56 29.18 3.74 0.90 0.47 8.28 4.06
129 4.86 6.11 20.44 1.06 0.47 16.83 0.004 1.08130 6.36 8.05 21.04 1.18 0.46 5.54 0.04 1.22131 8.88 11.34 21.65 2.50 0.83 0.65 2.67 2.72132 11.47 14.59 21.37 2.90 0.78 0.53 4.05 3.09189 19.03 24.48 22.27 4.75 0.97 0.13 41.07 5.26195 37.53 49.24 23.78 NA NA NA NA NP196 38.86 49.66 21.76 NA NA NA NA NP
76

Results for burn with 30-40% steam by volume
%H max Pmax AP (atm) TmaxBurn %H2 in air %H20 At
10 10.25 15.55 34.10 1.35 0.39 4.06 0.12 1.4311 8.13 13.12 38.07 1.21 0.42 6.62 0.05 1.2712 6.89 11.12 38.08 1.10 0.42 3.92 0.04 1.1426 15.41 24.88 38.06 3.37 0.79 0.95 4.24 3.6533 19.94 31.71 37.11 3.29 0.71 0.84 5.31 3.6344 30.41 45.86 33.67 NA NA NA NA NP45 31.02 50.07 38.04 3.00 0.79 2.15 2.31 3.2148 30.62 50.34 39.18' 2.92 0.77 2.78 1.76 3.1349 39.89 57.66 30.83 2.66 0.72 2.91 1.49 2.8455 5.72 8.22 30.45 1.13 0.47 8.54 0.02 1.1756 5.54 T~.95 30.38 1.15 0.49 6.83 0.03 1.1857 6.77 11.15 39.28 1.18 0.45 7.05 0.04 1.2263 29.80 46.07 35.30 3.52 0.86 0.62 5.70 3.80
133 9.73 15.89 38.77 2.17 0.69 0.90 1.94 2.29144 9.09 14.28 36.34 2.23 0.73 0.98 1.84 2.34145 10.01 16.00 37.43 2.83 0.87 0.89 4.05 2.99
77

Results for burns with greater than 40% steam by volumeResults for burns with greater than 40% steam by volume
%H12 Pmax Pmax AP (atm) TmaxBurn %H2 in air %H20 At
PO Paicc (S) At(s) T
1617181921232425272930373858596164666768
104106107ill113114115117119120121122134
9.008.268.518.318.479.329.44
11.6611.417.658.97
21.5720.886.646.81
21.2320.2620.2614.9214.2910.9111.1511.1412.4813.2315.5016. 5417.6417.048.238.379.03
10.68
17.2615.0414.8615.2114.5317.11
.17.3820.7820.5415.4918.0738.1638.1711.1413.3340.8036.4439.0629.4424.0320.4622.6823.7025.5326.0529.8230.0032.3632.7716.0316.3717.7418.17
47.8645. 1142.7145.3841.7045.4445.7143.9144.4550.6150.3343.4745.2940.4248 .9147.9744.4048.1249.3240.5246.6850.8552.9751 .1249.2248.0144.8745.4848.0148.6348.8849.1241.23
1.231 .121.161.091.331.401.40NA2.581.251.153.472.841.211.212.903.262.792.793.552.232.081.101.902.582.113.252.833.061.221.181.222.80
0.420.390.390.380.440.460.45NA
0.730.450.380.850.720.480.470.780.810.730.710.900.680.630.330.540.690.530.770.690.760.440.420.410.85
3.9210.506.919.404.00
14.8411.93NA1.974.703.741.241.974.064.452.741 .054.022.650.605.887.25
19.059.295.167.401.742.842.933.403.213.570.75
0.100.020.040.020.140.050.06NA
1.450.100.074.462.130.080.081.754.761.121.477.310.430.330.010.220.690.352.771.461.650.130.110.123.94
1.291.171.211.141 .391.471.47NP
2.741.301.203.753.071.251.253.113.533.003.033.832.362.211.172.032.772.293.553.073.311.281.241 .282.97
78
APPENDIX 6
Global Heat Transfer Data for theHydrogen:Air:Steam Burns Processed with SMOKE
This appendix presents the "global" heat transfer data for the hydrogen:air:steam burns processed with the suite of computer program referred to asSMOKE. Included are data for the total and radiative peak heat flux andcumulative energy depositions. Note that the maximum energy depositioncalculated using adiabatic isochoric combustion conditions are presented foreach burn processed for comparison. Also shown are comparisons (i.e., ratios)of. the radiative and total energy depositions and peak heat fluxes,,indicatingthe partitioning .of the postcombustion heat transfer. Furthermore, as in theprevious appendices, the burn number for each test is given and Appendix 1should be referenced for the initial conditions of the burns reported.
79

Results for burns with 0 to 20% steam by volume
%H12 Q(RAD) q(RAD)Burn %H12 in air %H120 Q(AIC) Q(TOT) Q(RAD) - q(TOT) q(RAD)
J/cm2 Q(TOT) -W/cml 2 q(TOT)
73 14.40 17.37 17.14 46.14 27.21 23.22 0.85 11.13 11.13 1.0074 14.40 16.60 13.56 42.11 26.87 22.40- 0.83 12.39 12.39 1.0075 18.94 22.88 17.22 62.88 42.82 38.17 0.89 28.19 28.19 1.0076 11.89 13.85 14.18 34.73 20.89 16.30 0.78 7.53 7.53 1.0084 60.67 66.72 9.07 90.38 45.31 28.54 0.63 10.84 7.64 0.7085 58.77 63.05 6.80 87.86 51.68 35.94 0.70 19.42 15.49 0.8088 57.23 62.10 7.85 98.17 53.78 36.71 0.68 21.32 16.30 0.7792 8.70 10.32 15.68 26.35 11.92 7.55 0.63 4.17 2.28 0.55140 6.63 8.17 18.81 19.50 5.40 2.73 0.51 0.91 0.38 0.42141 8.53 10.40 17.97 26.08 15.29 8.14 0.53 4.09 2.76 0.68142 8.87 10.64 16.62 26.74, 15.18 8.01 0.53 4.29 2.77 0.65143 9.70 12.03 19.39 30.70 18.92 10.21 0.54 6.34 4.66 0.74190 19.06 22.61 15.71 63.39 44.64 30.62 0.69 31.42 31.42 1.00
Results for burns with 20-30% steam by volume
%H12 Q(RAD) q(RAD)Burn %H12 in air %H120 Q(AIC) Q(TOT) Q(RAD) - q(TOT) qý(RAD)
J/cm2 - Q(TOT) -W/cm4- q(TOT)
43 8.96 11.63 22.96 28.45 11.49 8.13 0.71 2.62 1.81 0.6969 15.27 21.56 29.18 60.87 35.54 30.92 0.87 13.77 13.77 1.00
132 11.47 14.59 21.37 37.93 19.63 9.85 0.50 7.100 4.48 0.64189 19.03 24.48 22.27 74.02 54.29 35.77 0.66 -36.03 36.03 1.00
80

Results for burns with 30-40% steam by volume
%2Q(RAD) q(RAD)Burn %H2 in air %H20 Q(AIC) Q(TOT) Q(RAD) - q(TOT) qfRAD)
J/cm2 - Q(TOT) -W/cm6- q(TaT)
45 31.02 50.07 38.04 93.43 48.20 26.80 0.56 12.83 7.48 0.58133 9.73 15.89 38.77 41.39 16.31 9.78 0.60 2.56 1.98 0.77144 9.09 14.28 36.34 38.11 12.91 6.79 0.53 2.35 1.73 0.74145 10.01 16.00 37.43 44.06 22.22 11.27 0. 51 '7.89 4.22 0.54
Results for burns with greater than 40% steam by volume
%H12 Q(RAD) q(RAD)Burn %H2 in air %H20 Q(AIC) Q(TOT) Q(RAD) - q(TOT) q(RAD)
J/CM2 - Q(TOT) -W/cm6- q(TOT)
27 11.41 20.54 44.45 61.02 30.47 13.55 0.45 7.87 3.61 0.4638 20.88 38.17 45.29 95.29 51.48 30.65 0.60 15.65 9.58 0.6161 21.23 40.80 47.97 95.94 51.79 25.36 0.49 13.11 6.66 0.5064 20.26 36.44 44.40 94.99 58.17 39.30 0.68 19.73 14.47 0.7366 20.26 39.06 48.12 98.37 50.11 22.91 0.46 13.06 5.65 0.4368 14.29 24.03 40.52 70.51 42.59 33.88 0.80 15.16 14.20 0.94
104 10.91 20.46 46.68 63.77 21.02 14.64 0.70 .2.83 2.37 0.84106 11.15 22.68 50.85 71.44 20.92 11.85 0.57 3.98 1.89 0.48111 12.48 25.53 51.12 80.16 15.25 11.62 0.76 1.46 1.30 0.89113 13.23 26.05 49,22 86.64 38.65 18.08 0.47 10.25 4.42 0.43114 15.50 29.82 48.01 101.2 21.07 14.62 0.69 2.52 2.06 0.82115 16.54 30.00 44.87 101.1 43.72 26.70 0.61 20.16 10.01 0.50117 17.64 32.36 45.48 102.3 44.22 22.66 0.51 12.57 6.58 0.52119 17.04 32.77 48.01 102.2 51.98 23.94 0.46 14.88 7.01 0.47121 8.37 16.37 48.88 45.91 9.43 2.26 0.24 3.47 0.19 0.06134 10.68 18.17 41.23 49.80 28.65 17.22 0.60 7.88 5.63 0.71
81
APPENDIX 7
Representative Pressure Signatures foreach of the Combustion Tests
In this appendix, representative pressure signatures from two types ofgauges (the Precise Sensor model 141-1 and the Kulite model XT-190) are shownfor comparison and reference. For all of the tests in which combustionoccurred and the data is available for posttest processing, the pressuretransients are shown for the two gauge types whenever possible. The two gaugetypes are ýdistinguished using a solid line to represent the pressure transientrecorded by a Precise Sensor Model 141-1 and a dashed line to represent thatrecorded by a Kulite Model XT-190. Both gauge types were not available in alltests,' but comparisons of the two are presented whenever possible. Also notethat in some cases, a small offset in time between the two curves is apparent.This is simply due to the fact that the entire data set is plotted on thesecurves (i.e., time on these plots is relative) and in many cases the data forthe two gauges were recorded on two different digitizing modules. Therefore,the number of pretrigger data points were generally different resulting in thesmall time shift. However, comparison of the two pressure transients from thetime of ignition (i.e., the first deviation from the baseline) generallyreveals identical combustion-pressure signatures and magnitudes.
82
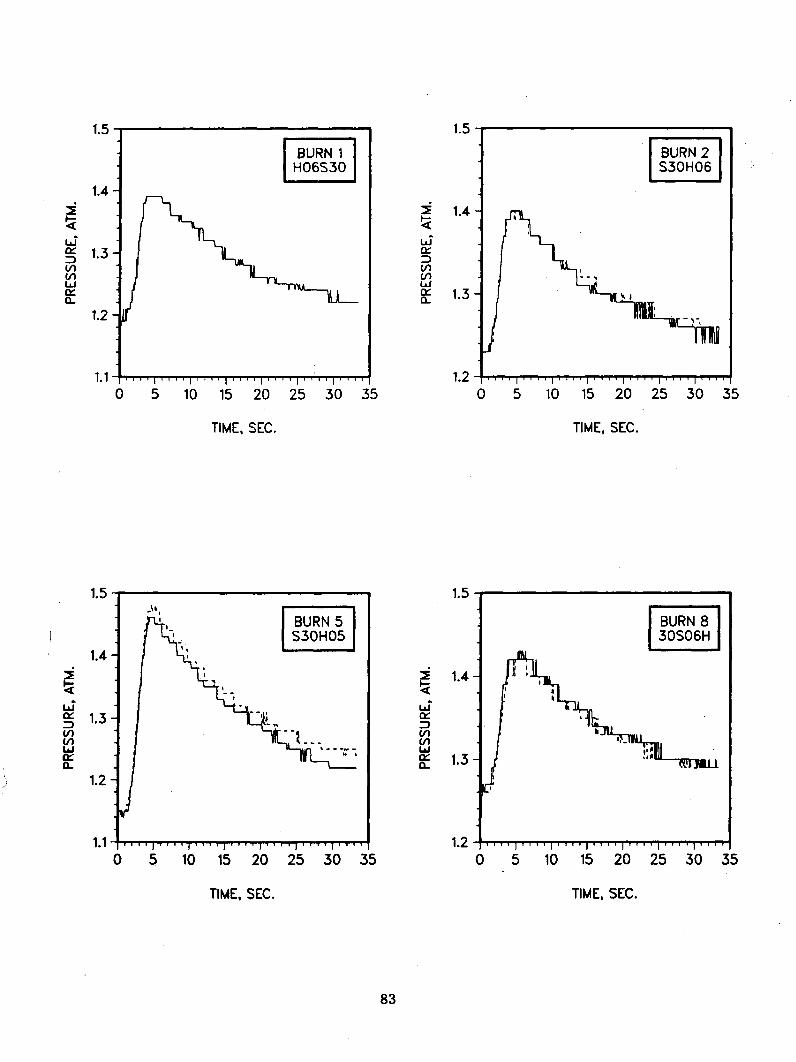
1.515 1.5
1.4-
~1.3-V) V)V) (nLi LiJw~ x 1.3
1.2-
1.-1.2- 1l!T0 5 10 1520 2530 35 0 510 15 202530 35
TIME, SEC. TIME, SEC.
1.5- 1.5-
BURN 5
1.4 I
~1143
S~ 1.3-
1.2
1.1.2
0 510 15 202530 35 0 5 10 15202530 35
TIME, SEC. TIME, SEC.
83

2
1.8
1.4
0-
Li
LI)
CL
1.6
1.4
1.20 5 10 15 20 25 30 35 0 5 10 15 20 25 30 35
TIME, SEC. TIME, SEC.
2
Dal
Li(x1.6
1.4
1.6
Ld
S1.5
1.40 5 10 15 20 25 30 35 0 5 10 15 20 25 30 35
TIME, SEC. TIME, SEC.
84

2.5
II-~2.1&
(~1
2
1.9
CLS 1.8
1.60 5 10 15 20 25 30 0 5 10 15 20 25 30 35
TIME, SEC.TIME, SEC.
U-
S 1.8(,1
Li;S 1.8
C,)
CL&
0 5 10 15 20 25 30 35
TIME, SEC.TIME, SEC.
85
<2.1
V)1.9
Li
V)V)
ar-
2.5
2.3
2.1
1.9
1.7
1.50 5 10 15 20 25 30 35 0 5 10 15 20 25 30 35
TIME, SEC. TIME, SEC.
3
~2.5Li
Qý 2a_
Lii
a-
0 5 10 15 20 25 30 35 0 5 10 15 20 25 30 35
TIME, SEC.TIME, SEC.
86

5
.4
3.5
-35
2.4
2.3
~2.2
LiiOf 2.1(1)Lii
S 2CL
1.9
1.80 5 10 15 20 25 30 35 0 5 10 15 20 25 30 35
TIME, SEC. TIME, SEC.
2.3-
2.2 -
~2.1
1.8-
BURN 31O60
42Lii
(Al 1.5CLi
(I i i i i I I I
) 5 10 15 20 25 30 35 0 5 10 15 20 25 30 35
TIME, SEC. TIME, SEC.
87

7
6
S5LIS
Qý 4
S3
2
1
8
7
S 6
c~ 5
a- 4
3
25 10 15 20 25 30
TIME, SEC. TIME, SEC.
i-
Li
7
6
5
4
3
2
I-
Id
UlU,Id
0..
3
2.5
2
1.5
10 5 10 15 20 25 30 35 0 5 10 15 20 25 30 35
TIME, SEC. TIME, SEC.
88

8
7
S6
La,
3
2
Li)C,,D~V)
8
7
6
5
4
3
2
TIME, SEC. TIME, SEC.
7
6
i, 4
3
2
2.5
S 2
Li,
ui,
S1.5
TIME, SEC. TIME, SEC.
89

9
8
7
Li 6
(/) 5Li
O4
3
2
1.5
Li
w 1.3
1.20 5 10 15 20 25 30 35
TIME, SEC.
0 5 10 15 20 25 30 35
TIME, SEC.
~1.4
IJ;
~1.3
1.8
1.7
Li-S1.6
C,,
1.5
1.40 5 10 15 20 25 30 35 0 5 10 15 20 25 30 35
TIME, SEC. TIME, SEC.
90
1.9
1.8
~1.7
LA;
(n1.6a-
1.5
1.4
2.3
2.2
S2.1
LiJS 2
V)Lnwx 1.90-
1.8
1.7o 5 10 15 '20 25 30 35
TIME, SEC.
o 5 10 15 20 25 30 35
TIME, SEC.
8
7
S6
w 5D
S40-
3
2
Li,
(A,L&j
8
7
6
5
4
3
20 5 10 15 20 25 30 35 0 5 10 15 20 25 30 35
TIME, SEC. TIME, SEC.
91

8 8
7
S 6i-
4a-
3
2
8
7.
S 6
£k 5
0: 4a_
Lii
L/)
Lii
0-
2 +.0o 5 10 15 20 25 30 35
TIME, SEC.
5 10 15 20 25 30 35
TIME, SEC.
Lii
(0
Liiw~
7
6
5
4
3
20 5 10 15 20 25 30 35 0 5 10 15 20 25 30 35
TIME, SEC. TIME, SEC.
92

I-4Lii
(I,LI,Lii
a-
7
6
5
4
3
2
6
Itii
Lii
0-
0 5 10 15 20 25 30 35
TIME, SEC.
0 5 10 15 20 25 30 35
TIME, SEC.
44
LI 3
a-
9
8
7
<6
LiiS 5
Lnl
Lii 4a.
3
2
10 5 10 15 20 25 30 35
TIME, SEC.
0 5 10 15 20 25 30 35
TIME, SEC.
93

9 9 88mIBURN 71 I8 :'\ 1H50S201
6
S 6-
5w) 44-
33
2 2
1- 1-0 5 1015 202530 35 0 5 1015 20
TIME, SEC. TIME, SEC.
5- 5-
BURN 733
4- 4-
I-r
0 5001 02 0 55 1 52
TIE SE.TMSC
94

6
5
Ir-
a_
4
3
2
CLA
4
3.5
3
2.5
2
1.5
1
TIME, SEC. TIME, SEC.
1.5 2
LiJ
(/)
a_
I-4
LA;
(/1c/iLii
a-
35
TIME, SEC. TIME, SEC.
95

2.5
2
Liir1.5
0.5
9
8
4i
V)
(/1
a_
9
8
7
6
5
4
3
25 10 15 20 25 30 35 0 5 10 15 20 25 30 35
TIME, SEC.TIME, SEC.
:i-4z
Li
Ck:a-
7
6
5
4
3
2.5
42
CA 1.5a-
1
0.5
3
20 5 10 15 20 25 30 35 0 5 10 15 20 25 30 35
TIME, SEC.TIME, SEC.
96

10
9
8
LiJS6
LJ 5*a-.
4.
3.
3
2.5
S 2LiJ
V)(/1 1.5ua
a_.
0.50 5 10 15 20 25 30 35
TIME, SEC.
0 5 10 15 20 25 30 35
TIME, SEC.
Li
IL
2-
S1.5 -
Li
V),'Lau 1ix
BURN 93
GC06
0.5 -----------0 5 10 15 20 25 30 35 0 5 10 15 20 25 30 35
TIME, SEC. TIME, SEC.
97

2 2
~1.5
a-
2-
0c .5-
3-
0 .5-
Li
CL
0.535 0 5 10 15 20 25 30 35
TIME, SEC. TIME, SEC.
4
3.5
3
L. 2.5
a_ 1.5
1.
0.5
TIME, SEC. TIME, SEC.
98

6
5
4
CL
0
7
Lii
V*)
a-
0 5 10 15 20 25 30 35
TIME, SEC.
0 5 10 15 20 25 30 35
TIME, SEC.
2
Li
0.5
4
3.5
3
Li 2.5
V) 2La
a- 1.5
1
0.5o 5 10 15 20 25 30 35
TIME, SEC.
0 5 10 15 20 25 30 35
TIME, SEC.
99

4.5
4
3.5
4ýj3L2
~2.5
Li2
1.5
1
0.5
5
4.5
4
Li
cy- 3
2.5
20 5 10 15 20 25 30 35
TIME, SEC.
0 5 10 15 20 25 30 35
TIME, SEC.
5
4.5
4
~3.5V)
0~
2.5
2
3 -1
2.8 -
S2.67
CL
2.2 -
2-
BURN 107
I I I I
0 5 10 15 20 25 30 35
TIME, SEC.
0 5 10 15 20 25 30 35
TIME, SEC.
100

5
4.5
4
~3.5V)0iLicx 3a-
2.5
2
6
LLi
(I)
CLj
5
4
3
25 10 15 20 25 30 35 0 5 10 15 20 25 30 35
TIME, SEC. TIME, SEC.
5
4
LA;
0ý 3
2
:i
LiJ
m-
7
6
5
4
3
20 5 10 15 20 25 30 35
TIME, SEC.
0 5 10 15 20 25 30 35
TIME, SEC.
101

7
6
8
7
6
5Lii
(ALiim-
5Lii
(A
CLi4
4
3
2
3
20 5 10 15 20 25 30 35
TIME, SEC.TIME, SEC.
2.6-
2.4-
BURN 120 2.4 -f
LiiS2.2-
(A
a_2-
[URN 12
tFLAM17I-
U
(A(ALii
0~
2.2 -
2-
BURN 121I -
1.8-4 1.80.. 5 10 1 20 ...215 3 10 3 15 0 5 10 15 20 25 30 35
TIME, SEC. TIME, SEC.
102

2.5
2.4
2.3
~2.2
~2.1
1.6
1.5
1.4 BURN 125
1.3 L ¶L1.2
0n 0.9 -
CL0.
0.71
0.67
0.5-0 5 10 15 20 25 30 35
TIME, SEC.
0 5 10 15 20 25 30 35
TIME, SEC.
1.3-
1.1-
Li
(I)
0.7-
2.52
BURN 126IWFCTR2 I
I -~ LZJ'ZJ5-
- ----
ui
2
1.5
1
0.5 -4. 0.50 5 10 15 20 .25 30 35
TIME, SEC. TIME, SEC.
103

Lil
(A0LJ
3
2.5
2
1.5
1
0.5
1.2
i-
Li
1.1
10 5 10 15 20 25 30 35
TIME, SEC.
0 5 10 15 20 25 30 35
TIME, SEC.
1.4-
1.3 -
'~1.2-V)
0-
3
BURN 130
HEC.6a I. -
2.5
Li.
V)
2
1.5
0 5 10 15 20 25 30 35
TIME, SEC.
0 5 10 15 20 25 30 35
TIME, SEC.
104

3.5-
3-
2.5-Li
C" 2-
1.5-
I'I'
I S
BUN 32
3.5-
3-
2.5-LuI
V)S 2-
1.5-
IS BURN 13
I'** I**I~~p *.
0 5 .0.15 206'' 2 5 3 10 13 15 ) 5 10 15 .20.. 2,5.. 30 35
TIME, SEC.TIME, SEC.
5
.5!4
*3.5
a_ 2.5
2
S 1.5
w
(I)
S1
0.50 5 10 15 20 25 30 35 0 5 10 15 20 25 30 35
TIME, SEC. TIME, SEC.
105

2
::91.5
tii
Li
V)
ay-
1.5
Li
Lna~: 1a_
0.50 5 10 15 20 25 30 35 0 5 10 15 20 25 30 35
TIME, SEC. TIME, SEC.
2.5 3
I-
LLrck:
Lu,(jlLiii:0~
2
1.5
2.5
<2Li
V)(A 1.5
a_
0.5
1
0.55 10 15 20 25 30 35 5 10 15 20 25 30
TIME, SEC. TIME, SEC.
106
2 3
F511.82
2.5
Li
LI)
CLi
1.2
* 4I 4
I 44 4* S
I SI ** S
I-4L
LI)CI)Lii
0~
2
1.5
1 - - - - - - - - - - - - - 10 5 10 15 20 25 30 35
TIME, SEC.
0 5 10 15 20 25 30 35
TIME, SEC.
3
2.5
S2
C,,
1.5
1
3.5
3-
42.5-
LI)0/ 2-(L
44I 4I 4I II I4 II 4I 4I 4
I -I -
BURN 143
I m- --I-
35 0 .5 10 15 20 25 30 35
TIME. SEC. TIME, SEC.,
107

3.5
3
S2.5-
wg 2
2-
1.5-
1 -
4i
La
4.5
4
3.5
3
2.5
2
1.50 5 10 15 20 25 30 35
TIME, SEC.
0 5 10 15 20 25 30 35
TIME, SEC.
2
1.
L;
V)
0.5
3.5
3
~2.5Li
~X 2
a_
1
0.55 10 15 20 25 30 35 0 .5 10 15 20 25 30 35
TIME, SEC. TIME, SEC.
108

4-
3.5 -
3-
S2.5-
g:) 2-0~
0.5
BURN 14
Li
Lii
a-
4.5
4
3.5
3
2.5
2
1.5
1
p *. .. 0.50 S .10 .. 15 " 2 10 2 15 3 '0 3 15 0 5 10 15 20 25 30 35
TIME, SEC. TIME, SEC.
Li5
CL/
3
2.5
2
1.5
1
0.5
Li,toD0-
5
4
3
2
1
0
TIME. SEC. TIME, SEC.
109

3.57 7
6-
~2.5
L;~'ý 20(n
1.5
4lii-
C,-)0Li
a-
4-2
0.-
BURN 154PRES2
I I'*I'I* I..
0 5 10 15 20 25 30 35 0 5 10 15 20 25 30 35
TIME, SEC.TIME, SEC.
9
8
7
S6
LI 5
o4
S3
2
1
0
3-
S2.5-
LiS2-
ui -Q: 1.5-
0.5-
9 9
BURN 156[ RES4
9.
0 5 .. 10,. .15' 2,0.. 25ý. 3 ,0 3 ,5
TIME, SEC. TIME, SEC.
110
I-
L2~(I,
61
5'
4 I
3:
2:
0
.3.5
BURN1571L RES5
I-
(I)
a_
3-
2.5-
2-
I'
I I
I *
I S
I S
BURN15LRE6J
50.5 -4.
10 15 20 25 30 3 5Iii ! . . . . I . . 1 1 , ' ' I
05 10 15 20 25 30 35
TIME, SEC. TIME, SEC.
La
0~
7
6
5
4
3
2
1
0
t/iLa
ar-
10
8
7
6
5.4
3
2
1
00 5 10 15 20 25 30 35
TIME, SEC. TIME, SEC.
ill

3.5
I-4Id
(/1(i1Id
3-
2.5 -
2-
1.5 -1
Itii FU~T~6l
I'
I S
* S
BUR 16
X
Lii
CLi
3.5
3
2.5
2
1.5
1
0.5 I 0.50 5 10 1 2 0 .. 2 15 .. 13 10 35 0 5 10 15 20 25 30 35
TIME, SEC.TIME, SEC.
I-4L
(~1(ilId
0~
7
6
5
4
3
2
1
0
Lii
VI)
CLi
3.5-
3-
2.5 -
2-
I'
I S
BURN 164PRES2 I
0.5 -4
0 5 10 15 20 25 30 35
TIME, SEC.TIME, SEC.
112

3.5
3-.
S2.5-
S2-
am 1.5-
Y
Ii
I,I II II II II II I
I -I -
BURN 165PRES13
I
3!ti
D~
V)V)
0.5 I I I I I-Y
0 5 10 15, 20 25 30 35
TIME, SEC.
0 5 10 15 20 25 30 35
TIME, SEC.
3.5
3-
S2.5-7
S2-If)
mn 1.5-:
II
I S
BURN 167
4
CA
CLJ
8
7
6
5
4
3
2
0I I I*~I** I
050 5 10 15 20 25 30 35
TIME, SEC.
0 5 10 15 20 25 30 35
TIME. SEC.
113
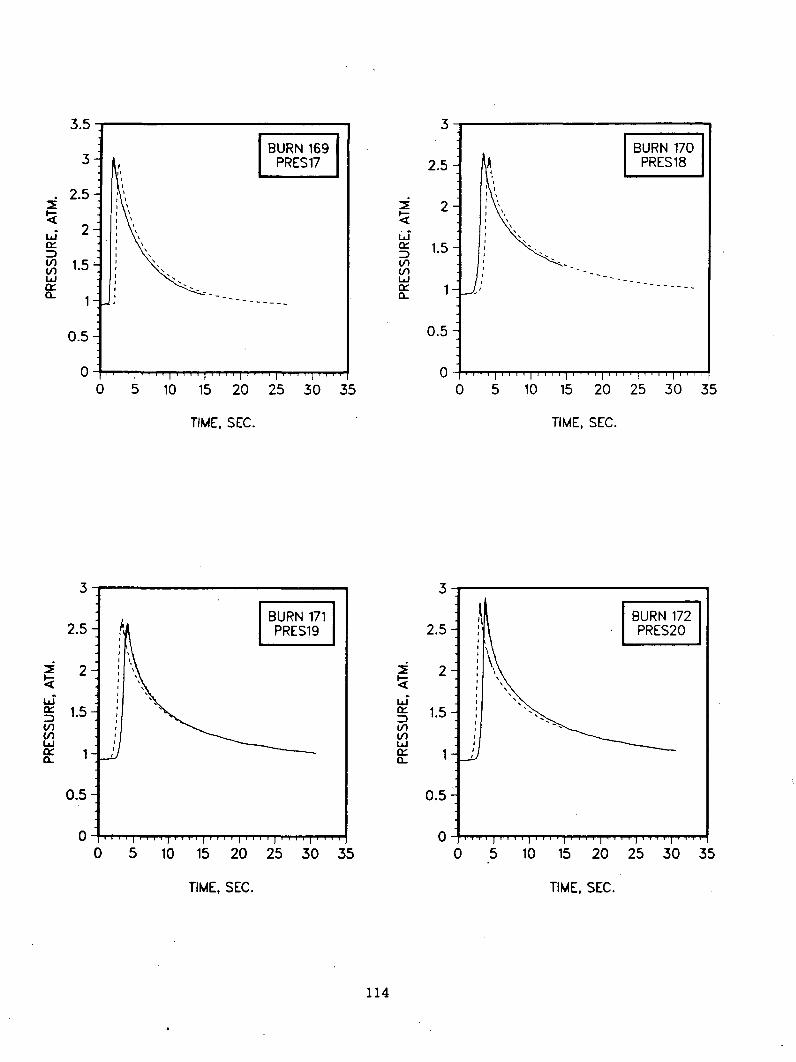
3.5
3
~2.5
2-
En 1.5-Li
4
0-
0.5-
0-
3
2.5
S 2
S1.5(A(ALiicr- 1CL
0.5
00 5 10 15 20 25 30 35 0 5 10 15 20 25 30 35
TIME, SEC.TIME, SEC.
3 -1-
2.5 -
S 2-
1.-
0~ .5-
0.-
BURN 171PRS1
3
2.5
S 2
S1.5
Lix
0..5
00 5 10 .. 15.. 20 .. 2 15 -3 0 3 15 0 5 10 15 20 25 30 35
TIME, SEC. TIME, SEC.
114
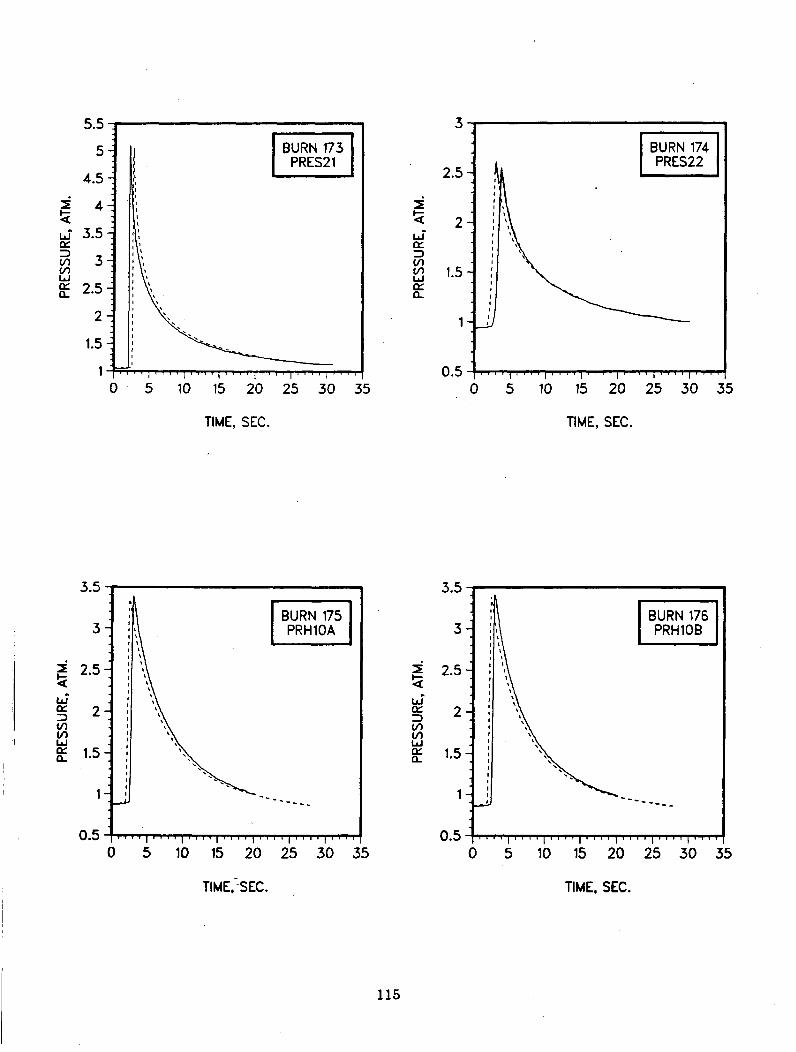
5.53 3
5
4.5
4
LL 3.5
(/, 3
am2.5
2
1.5
1~
3.5 -
3-
S2.5-U;
o:: 2-V)
cw 1.5-
0.5 -
2.5
:i
Li
V)'/,ui
CL
2
1.5
1
0.55 10 15 20 25 30 35
TIME, SEC. TIME, SEC.
3.5
3
~2.5
Liicr 2
LnW_ 1.5
0.5
TIME,.-SEC. TIME, SEC.
115

7
6
5
4
Li
0- 2
1
0
5-
:g
VI)VI)
CL
4-
.3-
2-
IPRH20BI
0 I I I I
0 5 10 15 20 25 30 35
TIME, SEC.
0 5 10 15 20 25 30 35
TIME, SEC.
8
7
6
!R4 5.LIS
S4.
fjl
3i
a_2-
V)0,Lia-Q-
8
7
6
5
4
3
2
1
000 5 10 15 20 25 30 35
TIME, SEC. TIME, SEC.
116

7
LiJ
a.
6
5
4
3
I-ti
LiJ
a_
2
05 10 ý 15 20 25 30 35 0 5 10 15 20 25 30 35
TIME, SEC. TIME, SEC.
3.5 -.9
3-,
S2.5 -2-
1.5
CL 7
0.5-
I BURN 183PRH10
.a
C/iCLla.
7
6
5
4
3
2
1
9 I I 00 5 6 '10 15 .20 .. 25 30 35 0 .5 10 15 20 25 30 35
TIME, SEC. TIME, SEC.
117

Li
0::
4
3.5
3
2.5
2
1.5
1
0.5
V-
(I)
10 -
87'
77
6+75-
4-
3--
2-
1-
0-
BURN 186PRH30C
4.
35 0 ... 1 0 15. 20 25.. 3,0 ..3 ,5
TIME, SEC. TIME, SEC.
(I)
00ý
11
107-
7+
6+
57
4-
BURN 187PR H35A
- - - - - - - - - - -
I
a:gtii
LAUA
w~
3
2.5
2
1.5
1
0.5I . .. I . . . I '' . . . . . I , 1 1 ' I0 5 10 15 20 25 30 35 5
TIME, SEC. TIME, SEC.
118

7
6
4
Li
2
1
:i
Li
6
5
4
3
2
10 5 10 15 20 25 30 35
TIME, SEC.TIME, SEC.
9
7
*~ 6
cx 5
CLi
3
2
1
LiiQ::
CL
107-
9-
7+
6+
5+
3-
2-:
BUR12A
-R OI 6
10 5 10 15 20 25 30 35
TIME, SEC.
0o 10 15 20 25 30 35
TIME, SEC.
119j

8
7
6
Li5
0) 4Ln
Q3
2
1
Ld
Li0r-
9
8
7
6
5
4
3
2
10 5 10 15 20 25 30 35
TIME, SEC.
0 5 10 15 20 25 30 35
TIME, SEC.
10
9
8
Ir-
a-
7
6
5
3
2.5
S 2
LaS1.5
(ALa
0.5
0
4
3
2
110 15 20 25 30 35
TIME, SEC. TIME, SEC.
120

33 3
2.5
<2
(L
0.5
2.5
:i
D
0)(nLuJix
2
1.5
1
0.50 5 10 15 20 25 30 35
TIME, SEC. TIME, SEC.
6
5
4
0
4
LlJ
3
2.5
2
1.5
1
0.55 10 15 20 25 30 35
TIME, SEC. TIME, SEC.
121

3.57 7
3
~2.5Li
Q: 2
0.5
6
Lii
Lii
5
4
3
2
1
05 10 15 20 25 30 35 0 5 10 15 20 25 30 35
TIME, SEC.TIME, SEC.
3.5
3
~2.5
LiiLk 2
ax1.5
1*
0.5-
Lii
CLi
3.5
3
2.5
2
1.5
0.50 5 10 15 20 25 30 35 0 5 10 -15 20 25 30 35
TIME, SEC.TIME, SEC.
122

4
Li
La-
LiJ
7
6
5
4
3
2
1
00 5 10 15 20 25 30 35 0 5 10 15 20 25 30 35
TIME, SEC. TIME, SEC.
~2.5
om1.5
:9
LiJ0:
TIME, SEC. TIME, SEC.
123

3.5 7
3.5 7
~2.5-ti -
Li Li 4
S2-
cii
1 1
0.5- 0-0 5 10 1520 2530 35 0 5 1015 20 2530 35
TIME, SEC. TIME, SEC.
9- - 3.5-
8-, BURN 230 BURN 231[ANG1 3-RN1
S6 2.5
(A /
a-~ 3 1.5
2
0 0.5-0 5 101520 2530 35 0 5 1015 202530 35
TIME, SEC. TIME, SEC.
124

6 6 3.5
5
4
1
0
3
S2.5
S 2
1.5
1
0.50 5 10 15 20 25 30 35 5 10 15 20 25 30
TIME, SEC. TIME, SEC.
7
6
.5
La4
0.42
02
ui
CixCL
9
8-
7
6
5
4
3
2
1
00 5 10 15 20 25 30 35
TIME, SEC.
0 5 10 15 20 25 30 35
TIME, SEC.
125

3.5
3
~2.5
Li'~ 2
Li
0.5
6
5
ILi
V~)Ln~
a_
4
3
2
1
0
TIME, SEC. TIME, SEC.
10
9
8
7
ILi'lý 5V)
(14CL '
3.5
3
~2.5
ILi
cy 1.5
1_
0.50 5 10 15 20 25 30 35 0 5 10 15 20 25 30 35
TIME, SEC. TIME, SEC.
126

U. S. Government Printing OfficeReceiving Branch (Attn: NRC Stock)8610 Cherry LaneLaurel, MD 20707250 Copies for R3
U. S. Bureau of MinesPittsburgh Research CenterP. 0. Box 18070Pittsburgh, PA 15236Attn: M. Hertzberg
U. S. Nuclear Regulatory Commission (3)Office of Nuclear Regulatory ResearchWashington, DC 20555Attn: R. T. Curtis
J. T.* LarkinsP. Worthington
U. S. Nuclear Regulatory Commission (3)Office of Nuclear Regulatory ResearchWashington, DC 20555Attn: B. S. Burson
M. SilverbergR. W. Wright
U. S. Nuclear Regulatory Commission (6)Office of Nuclear Reactor RegulationWashington, DC 20555Attn: J. K. Long
J. F. MeyerR. PallaK. I. ParczewskiG. QuittschreiberD. D. Yue
U. S. Nuclear Regulatory Commission (6)Office of Nuclear Reactor RegulationWashington, DC 20555Attn: V. Benaroya
W. R. ButlerG. W. KnightonT. M. SuZ. RosztoczyC. G. Tinkler
DIST-127

U. S. Nuclear Regulatory CommissionPhillips Building7920 Norfolk AvenueBethesda, MD 20014Attn: C. J. Anderson
U. S. Department of Energy (2)Operational Safety DivisionAlbuquerque Operations OfficeP. 0. Box 5400Albuquerque, NM 87185Attn: J. R. Roeder, Director
Dr. 1.. Peehs
Acurex Corporation485 Clyde AvenueMountain View, CA 94042
American Electric Power Service Corp.,Room 1158-D2 BroadwayNew York,'NY 10004Attn: K. Vehstedt
Applied Sciences Association, Inc.P. 0. Box 2687Palos Verdes Pen., CA 90274Attn: D. Swanson
Argonne National Laboratory (2)9700 South Cass AvenueArgonne, IL 60439Attn: H. M. Chung
R. P. Anderson
Battelle Columbus Laboratory (2)505 King AvenueColumbus, OH 43201Attn: P. Cybulskis
R. Denning
Bechtel Power CorporationP. 0. Box 3965San Francisco, CA 94119Attn: R. Tosetti
Bechtel Power Corporation (2)15740 Shady Grove RoadGaithersburg, MD 20877Attn: D. Ashton
D. Patton
DIST-128

Boeing12517 SE 42nd StreetBellevue, WA 98006Attn: T. M. Murray
Brookhaven National LaboratoryUpton, NY 11973Attn: R. A. Bani
T. Pratt
Cleveland Electric Illuminating Co.Perry Nuclear Plant10 Center RoadNorth Perry, OH 44081Attn: Rt. Stratman
Combustion Engineering Incorporated1000 Prospect Hill RoadWindsor, CT 06095Attn: J. D. Boyajian
(2)
Donald C.Indiana &P. 0. BoxBridgman,Attn: D.
Cook Nuclear StationMichigan Electric Company458MI 49106Nelson
Duke Power CompanyP. 0. Box 33189Charlotte, NC 28242Attn: F. G. Hudson
A. L. Sudduth
EG&G IdahoWillow Creek Building, W-3P. 0. Box 1625Idaho Falls, ID 83415Attn: Server Sadik
(2)
Electric Power Research3412 Hillview AvenuePalo Alto, CA 94303Attn: J. J. Haugh
R. LeyseK. A. NilssonG. ThomasL. B. Thompson
Factory Mutual ResearchP. 0. Box 688Norwood, MA 02062Attn: R. Zalosh
Institute
Corporation
(5)
DIST-129

Fauske & Associates (2)627 Executive DriveWillowbrook, IL 60521Attn: R. Henry
M. Plys
CPU Nuclear100 Interpace ParkwayParsippany, NJ 07054Attn: J. E. Flaherty
General Electric Co.175 Curtner AvenueMail Code N 10157San Jose, CA 95125Attn: K. W. Holtzclaw
General Physics Corp~oration (8)1000 Century PlazaColumbia, MD, 21044Attn: S. B. Coon
C. J. DicklemanE. E. HuffC. KupiecW.J. NewellJ. M. SutchE. H. TrottierJ. N. Zerbo
General Public UtilitiesThree Mile Island Nuclear StationP. 0. Box 480Middletown, PA 17057Attn: N. Brown
Indiana and Michigan Electric CompanyP. 0. Box 458Bridgman, MI 49106Attn: J. Dickson
Institute of Nuclear Power Operations (2)1820 Water PlaceAtlanta, GA 30339Attn: S. Visner
E. Zebroski
Los Alamos National Laboratory (4)P. 0. Box 1663Los Alamos, NM 87545Attn: H. S. Cullingford
R. GidoJ. Carson MarkG. Schott
DIST- 130
Massachusetts Institute of TechnologyRoom 1-276Cambridge, MA 02139Attn: M. N. Fardis
University of MichiganDepartment of Aerospace EngineeringAnn Arbor, MI 47109Attn: Martin Sichel
Mississippi Power & Light (3)P. 0. Box 1640Jckson, MS 39205Attn: D. Bigbee
S. H. HobbsJ. Richardson
New Mexico State UniversityMechanical Engineering DepartmentLas Cruces, NM 88001Attn: G. P. Mulholland
Northwestern UniversityChemical Engineering DepartmentEvanston, IL 60201Attn: S. G. Bankoff
NUS Corporation4 Research PlaceRockville, MD 20850Attn: R. Sherry
Offshore Power System (2)8000 Arlington ExpresswayBox 8000Jacksonville, FL 32211Attn: G. M. Fuls
D. H. Walker
Pennsylvania Power and LightSusquehanna SESP. 0. Box 467Berwick, PA 18603Attn: R. DeVore
Power Authority State of NY (2)10 Columbus CircleNew York, NY 10019Attn: R. E. Deem
S. S. Iyer
Purdue UniversitySchool of Nuclear EngineeringWest Lafayette, IN 47907Attn: T. G. Theofanous
DIST-131

Sandia National Laboratories (20)Organization 6427P.O. Box 5800Albuquerque, NY 87185Attn: G. Shaw
Sandia National Laboratories (6)Livermore, CA 94550Attn: W. T. Ashurst, 8523
K. D. Marx, 8523W. J. McLean, 8360M. A. Pound, 8024B. R. Sanders, 8523P. K. Barr, 8363
Stone & Webster Engineering Corporation245 Summer Street/9Boston, MA 02143Attn: G. Brown
Dr. Roger Strehiow505 South Pine StreetChampaign, IL 61820
TVA400 CommerceW9C1 57-CDKnoxville, TN 37902Attn: Wang Lau
Technology for Energy Corporation (2)10770 Dutchtown RoadKnoxville, TN 37922Attn: J. Carter
E. L. Fuller
Thompson Associates639 Massachusetts AvenueThird FloorCambridge, MA 02139Attn: Timothy Woolf
UCLANuclear Energy Laboratory405 Hilgard AvenueLos Angeles, CA 90024Attn: I. Catton
Virginia Electric & Power Company (3)Northanna Power StationP. 0. Box 402Mineral, VA 23117Attn: A. Hogg
A. K. WhiteE. L. Wilson
DIST-132

Virginia Electric & Power CompanyP. 0. Box 26666James River PlazaRichmond, VA 23261Attn: R. Garner
Westinghouse Corporation (3)P. 0. Box 355Pittsburgh, PA 15230Attn: N. Liparulo
J. OlhoeftV. Srinivas
Westinghouse Electric CorporationMonroeville Nuclear CenterMonroeville, PA 15146Attn: P. Lain
Westinghouse Hanford Company (3)P. 0. Box 1970Richland, WA 99352Attn: C. R. Bloom
L. MuhlsteinR. D. Peak
University of WisconsinNuclear Engineering Department1500 Johnson DriveMadison, WI 53706Attn: M. L. Corradini
Zion Nuclear Power StationCommonwealth Edison CompanyShiloh Blvd. and Lake MichiganZion, IL 60099Attn: C. Schultz
Director of Research, Science & EducationCECRue De La Loi 2001049 Brussels.BELGIUMAttn: B. Tolley
AEC, Ltd. (2)Whiteshell Nuclear Research EstablishmentPinawa, ManitobaCANADAAttn: D. Liu
H. Tamm
DIST- 133

McGill University (3)315 QuerbesOutremont, QuebecCANADA H2V 3W1Attn: John H. S. Lee
Battelle Institut E. V.Am Roemerhof 356000 Frankfurt am Main 90FEDERAL REPUBLIC OF GERMANYAttn: Dr. Werner Baukal
Gesellschaft fur Reaktorsicherheit (ORS)Postfach 101650Glockengasse 25600 Koeln 1FEDERAL REPUBLIC OF GERMANYAttn: Dr. M. V. Banaschik
Gesellschaft fur Reaktorsicherheit (GRS mbH) (2)8046 GarchingFEDERAL REPUBLIC OF GERMANYAttn: E. F.Hicken
H. L. Jahn
Kernforschungszentrum Karlsruhe (3)Postfach 364075 KarlsruheFEDERAL REPUBLIC OF GERMANYAttn: Dr. S. Hagen
Dr. J. P. HosemannDr. M. Reimann
Kraftwerk UnionHammerbacherstrasse 12 & 14Postfach 3220D-8520 Erlangen 2FEDERAL REPUBLIC OF GERMANYAttn: Dr. K. Hassman'
Technische Universitaet MuenchenD-8046 GarchingFEDERAL REPUBLIC OF GERMANYAttn: Dr. H. Karwat
CNEN NUCLITRomeITALYAttn: A. Morici
Swedish State Power BoardEl-Och VaermeteknikSWEDENAttn: Eric Ahistroem
DIST-134

AERE Harwell (2)DidcotOxfordshire OX11 ORAUNITED KINGDOMAttn: J. Gittus, AETB
J. R. Matthews, TPD
Berkeley Nuclear LaboratoryBerkeley GL 139PBGloucestershireUNITED KINGDOMAttn: J. E. Antill
British Nuclear Fuels, LtdBuilding 396Springfield WorksSalwick, PrestonL an csUNITED KINGDOMAttn: W. G. Cunliffe
National Nuclear Corp. Ltd.Cambridge RoadWhetestone, Leicester, LE83LHUNITED KINGDOMATTN: R. MAY
Simon Engineering Labora~toryUniversity of ManchesterM139PLUNITED KINGDOMAttn: Prof. W. B. Hall
Anthony R. TaigGDCD/CEGBBarnwood, GloucesterGloucestershireUNITED KINGDOM
UKAEA Safety & Reliability DirectorateWigshaw Lane,'CulchethWarrington WA34NECheshireUNITED KINGDOM (3)Attn: J. C. Collier
S. F. Hall
UKABA ABE Winfrith214/A32DorchesterDorset DT2 8DHUNITED KINGDOMAttn: A. J. Wickett
DIST- 135

Sandia Distribution:1131 W. B. Benedick1512 J. C. Cummings1513 A. C. Ratzel6400 A. W. Snyder6410 J. W. Hickman6411 A. S. Benjamin6412 A. L. Camp6414 D. M. Ericson, Jr.6415 F. E. Haskin6415 S. E. Dingman6420 J. V. Walker6421 P. S. Pickard6422 D. A. Powers6422 W. W. Tarbell6423 K. Bolt6425 W. J. Camp6427 MA. Berman6427 J. T. Hitchcock6427 B. W. M~arshall, Jr. (15)6427 L. S. Nelson6427 M. P. Sherman6427 D. W. Stamps6427 S. R. Tieszen6427 C. C. Wong6440 D. A. Dahlgren6442 W. A. von Riesemann6444 R. K. Byers6444 W. H. Schmidt6445 V. J. Dandini6449 K. D. Bergeron3141 C. MA. Ostrander (5)3151 W. L. Garner
DIST-136

kPIC FORM 35U.S. NUCLEAR REGULATORY COMMISSION IREPORT NUMBERA IAj. p.Od v. r)OC ,Od V. NO.1 df*"p12 B-i
30.22BIBLIOGRAPHIC DATA SHEET NUREG/CR-3 468SEE INSTRUCTIONS ON T..E REVERSE SAND84-03832 TITLE AND SUBTITLE 2* LEAVE BLANK
Hydrogen:Air:Steaxn Flammability Limits andCombustion Characteristics in the FITS Vessel 4 DATE REPORT COMPLETED
MONT. I IEAR
5 AUT..OQIS1 August 19866 DATE REPORT ISSUED
Billy W. Marshall, Jr. MONT. YA
____ ___ ___ ___ ___ ___ ___ ___ ___ ___ ___ ___ December 1986? IERPORMINGORDýANIZATON NAME AND MAILING ADDRESS II..c,.OpZ,,COod. 8 PROJECTITASK'WORK UNIT NUMBER
Sandia National Laboratories _____________
Division 6427 9 FIN OR GRANT NUMBER
P.O. Box 5800 A1246Albuquerque, NM 87185
10 SPONSORING ORGANIZATION NAME AND MAILING ADDRESS flI,O. I,0 o Codot I II TYPE Of REPORT
Division of Reactor System Safety TechnicalAccident Evaluation Branchoffice of Nuclear Regulatory Research PERIOD COVERED 11MCI .M).
U.S. Nuclear Regulatory ResearchWashington, DC 20555
12 SUPPLEMENTARY NOTES
S1 3 ABSTRACT 1200 o 'sO ro.1- 1.
Experimentally observed flammability limits of hydrogen: air: steam mixtures inboth turbulent and quiescent environments were measured and a correlation developedthat describes the three-component flammability limit. The combustion pressure datameasured for the hydrogen: air: steam tests indicate that the addition of steam reducesthe normalized peak combustion pressure (Pmax/Po) as compared to equivalenthydrogen:air burns. Turbulence was found to affect the extent of combustion andother combustion characteristics of the lean hydrogen burns (i.e., •10% hydrogen byvolume) where bouyancy governs flame propagation.
The experimentally measured pressure decays were used to infer the "global" heattransfer characteristics during the postcombustion cooling phase. Convection wasfound to dominate the time-integrated heat transfer of the leaner (<10%) hydrogen:airburns, accounting for 50 to 70% of the postcombustion heat transfer. Radiation wasslightly more prevalent than convection for the hydrogen:air burns nearstoichiometry. When moderate quantities of steam were added to the environment,radiation became the dominant postcombustion cooling mechanism due to the increase inbulk gas emittance. If richer steam concentrations were added to the environment',radiation and convection appear to be equally important heat transfer mechanisms.
14 DOCUMENT AftALWSIS -. BENWONOSDESCA-VTORS IS AVAILABILITYST ATE MEN T
Flammability, Flammability Limits, Deflagration, Combustion,Hydrogen Combustion, Reactor Safety
b IDENTIPIERSOPNENDEDfOTERMS
GPO/NTIS
IS SECURITY CLAS.SIPICATION
jlnc asifijer
,UnclassifiecI I NUMBER OP PAGES
lB PRICE
*U.S. GOVERNMENT PRINTING OFFICE: 1987-773-049/41029