Numerically Modeling Steel Continuous Bridges for Early ...
78
University of Arkansas, Fayetteville University of Arkansas, Fayetteville ScholarWorks@UARK ScholarWorks@UARK Theses and Dissertations 5-2020 Numerically Modeling Steel Continuous Bridges for Early Age Numerically Modeling Steel Continuous Bridges for Early Age Concrete Deck Cracking Concrete Deck Cracking Abdul Aziz Nabil Salah University of Arkansas, Fayetteville Follow this and additional works at: https://scholarworks.uark.edu/etd Part of the Civil Engineering Commons, Construction Engineering and Management Commons, and the Transportation Engineering Commons Citation Citation Salah, A. N. (2020). Numerically Modeling Steel Continuous Bridges for Early Age Concrete Deck Cracking. Theses and Dissertations Retrieved from https://scholarworks.uark.edu/etd/3647 This Thesis is brought to you for free and open access by ScholarWorks@UARK. It has been accepted for inclusion in Theses and Dissertations by an authorized administrator of ScholarWorks@UARK. For more information, please contact [email protected].
Transcript of Numerically Modeling Steel Continuous Bridges for Early ...
University of Arkansas, Fayetteville University of Arkansas, Fayetteville
ScholarWorks@UARK ScholarWorks@UARK
Theses and Dissertations
5-2020
Numerically Modeling Steel Continuous Bridges for Early Age Numerically Modeling Steel Continuous Bridges for Early Age
Concrete Deck Cracking Concrete Deck Cracking
Abdul Aziz Nabil Salah University of Arkansas, Fayetteville
Follow this and additional works at: https://scholarworks.uark.edu/etd
Part of the Civil Engineering Commons, Construction Engineering and Management Commons, and
the Transportation Engineering Commons
Citation Citation Salah, A. N. (2020). Numerically Modeling Steel Continuous Bridges for Early Age Concrete Deck Cracking. Theses and Dissertations Retrieved from https://scholarworks.uark.edu/etd/3647
This Thesis is brought to you for free and open access by ScholarWorks@UARK. It has been accepted for inclusion in Theses and Dissertations by an authorized administrator of ScholarWorks@UARK. For more information, please contact [email protected].

Numerically Modeling Steel Continuous Bridges for Early Age Concrete Deck Cracking
A thesis submitted in partial fulfillment
of the requirements for the degree of
Master of Science in Civil Engineering
by
Abdul Aziz Salah
University of Arkansas
Bachelor of Science in Civil Engineering, 2018
May 2020
University of Arkansas
This thesis is approved for recommendation to the Graduate Council.
______________________________
Ernest Heymsfield, Ph.D., P.E.
Thesis Director
______________________________
Cameron Murray, Ph.D.
Committee Member
______________________________
Gary Prinz, Ph.D., P.E.
Committee Member

Abstract
Early age bridge deck cracking is a common problem throughout the United States. Early age
cracking develops shortly after the deck is poured. It reduces the serviceability and lifespan of
bridges. Early age cracking can be typically attributed to either of two factors, 1) construction
practices, and 2) shrinkage. The Arkansas Department of Transportation (ARDOT) has
experienced early age bridge deck cracking. ARDOT currently specifies a sequence deck pour on
most of their bridges; however, contractors prefer continuous deck pours because of ease and
construction time. During the period of this TRC1903 research project, ARDOT has only
approved a few continuous pours for relatively short bridges, 180 to 190 ft. long. Concrete
cracking occurs when concrete tensile stresses exceed the concrete’s tensile strength. Therefore,
early age bridge deck cracking is evaluated in this thesis be monitoring induced concrete tensile
stresses and comparing these values with the concrete’s concurrent tensile strength. Bridge site
visits at bridges constructed using a continuous deck pour process were conducted to study deck
cracking patterns in newly constructed bridges and identify deck sections that were experiencing
cracking. In addition to a visual approach for identifying sections experiencing cracking, a
numerical method was used. Finite element bridge models were created using ABAQUS to
compare numerical modeling results to field recorded results attained from a bridge instrumented
with strain gauges cast inside the concrete deck. Additional numerical models were made to
verify the modeling techniques used by the author by validating calculated stresses with
numerical models in the literature. The Finite element models were specifically developed to
model the bridge deck construction process. Therefore, time dependent loads and material
properties were considered in the numerical model. Concrete material time dependency was

estimated using the Eurocode specifications (CEN., 1992). In addition, concrete stresses were
calculated in this thesis using the Eurocode modular ratio approach.

Acknowledgments
I would first like to thank the Arkansas Department of Transportation
for giving me the opportunity to work on this project and allowing me to complete my graduate
degree.
I am also very thankful for the guidance and mentorship of Dr. Ernie Heymsfield, who
has set a great work ethic example for me. Dr. Heymsfield also helped me with numerous parts
of this research for me to be able to complete this work. I would also like to thank the Civil
Engineering Department at The University of Arkansas who has helped me grow throughout my
graduate and undergraduate studies. In particular, I would like to thank Dr. Gary Prinz for
serving on my committee and helping me on several occasions with this research. In addition to
Dr. Cameron Murray for being on my committee and directing the experimental work of this
project.
Finally, I would like to acknowledge Fernando Ortiz who completed the experimental
work of this project. As well as all of my peers and family for supporting me tremendously.

Dedication
To my supportive parents

Table of Contents
CHAPTER I INTRODUCTION
1.1 Overview...............................................................................................................................1
CHAPTER II LITERATURE REVIEW
2.1 Background ...........................................................................................................................2
2.2 Concrete decks crack patterns ................................................................................................3
2.3 Concrete Shrinkage ...............................................................................................................4
2.3.1 Thermal Shrinkage ..........................................................................................................5
2.3.2 Plastic Shrinkage ............................................................................................................5
2.3.3 Autogenous Shrinkage ....................................................................................................5
2.3.4 Drying Shrinkage ............................................................................................................5
2.4 Concrete Creep ......................................................................................................................6
2.5 Deck Pouring Sequence .........................................................................................................6
2.6 Current Construction Practices and Research .........................................................................8
2.7 High performance concrete ....................................................................................................9
CHAPTER III SIMPLE SPAN VALIDATION MODEL
3.1 Overview............................................................................................................................. 11
3.2 Simple Span Model Geometry ............................................................................................. 11
3.3 Modeling Techniques .......................................................................................................... 12
3.4 Material Properties .............................................................................................................. 12
3.5 Validation Results ............................................................................................................... 13
CHAPTER IV CONSTRUCTION VERIFICATION MODEL
4.1 Overview............................................................................................................................. 14
4.2 Gara bridge Geometry ......................................................................................................... 16
4.3 Gara modeling Techniques .................................................................................................. 17
4.3.1 Boundary Conditions .................................................................................................... 17
4.3.2 Modeling of The Concrete Paver Loads ........................................................................ 19
4.4 Materials properties ............................................................................................................. 20
4.4.1 Material properties of Concrete ..................................................................................... 20
4.5 Types of Elements and Computational Time ....................................................................... 22
4.6 Loading of Model and Verification Results ......................................................................... 25
4.6.1 Load Calculations ......................................................................................................... 27
4.6.1.1 Concrete Weight ..................................................................................................... 27
4.6.2 Stress Development ...................................................................................................... 28
4.6.2.1 Dead Load Verification Results .............................................................................. 29
4.6.4 Thermal Shrinkage Modeling ........................................................................................ 30
4.6.4.1 Thermal Shrinkage Verification Results ................................................................. 33
CHAPTER V ARDOT BRIDGES FIELD WORK
5.1 Bridge Visits ....................................................................................................................... 35
5.2 Bridge Instrumentation ........................................................................................................ 36
CHAPTER VI BRIDGE #07364 NUMERICAL MODELING
6.1 Overview............................................................................................................................. 38

6.2 Bridge #07364 Geometry .................................................................................................... 38
6.3 Modeling Techniques .......................................................................................................... 39
6.3.1 Boundary Conditions .................................................................................................... 40
6.3.2 Element Size and Model Convergence .......................................................................... 41
6.4 Material Properties .............................................................................................................. 42
6.5 Model Loading .................................................................................................................... 42
6.5.1 Load Calculations ......................................................................................................... 44
6.5.1.1 Concrete Weight ..................................................................................................... 44
6.5.1.2 Concrete Paver Load .............................................................................................. 44
6.6 Thermal Shrinkage Modeling .............................................................................................. 45
CHAPTER VII RESULTS AND DISCUSSION
7.1 Bridge #07364 Dead Load Results....................................................................................... 46
7.2 Bridge #07364 Thermal Shrinkage Results .......................................................................... 47
7.3 Bridge #07364 Total Effects ................................................................................................ 49
7.4 Bridge Curvature Effects ..................................................................................................... 50
7.5 Field Results Comparisons .................................................................................................. 52
CHAPTER VIII CONCLUSIONS AND RECOMMENDATIONS
8.1 Conclusions and Recommendations ..................................................................................... 55
CHAPTER IX REFERENCES
CHAPTER X APPENDIX
List of Figures
Figure 1. Cracking Prior to Applying Live Loads (photo by author) ............................................2
Figure 2. Concrete Deck Cracking Patterns (photo by author) .....................................................3
Figure 3. Moment Influence Lines ...............................................................................................7
Figure 4. Sequence deck pour (photo by author) ..........................................................................8
Figure 5. Simple Span Model Longitudinal Geometry (photo by author) ................................... 11
Figure 6. Cross-Section of Simple Span Model (photo by author).............................................. 11
Figure 7. Validation Model Results ........................................................................................... 13
Figure 8. Gara Model Assembly (photo by author) .................................................................... 14
Figure 9. Structural Steel of Gara Model (photo by author) ....................................................... 15
Figure 10. Longitudinal Geometry of Gara Bridge (photo by author) ......................................... 16
Figure 11. Cross-Sectional Geometry of Gara Bridge (photo by author). ................................... 16
Figure 12. Tie Constraint (photo by author) ............................................................................... 17
Figure 13. Bridge Support Boundary Conditions (photo by author) ........................................... 18
Figure 14. Concrete Forms Boundary Conditions (photo by author) .......................................... 18
Figure 15. SIP Form Bracing Boundary Conditions (photo by author) ....................................... 19
Figure 16. Concrete Paver Load Distribution. ............................................................................ 19
Figure 17. Modeling Forms (photo by author) ........................................................................... 20
Figure 18. Mesh of Bridge Cross-Section (photo by author) ...................................................... 25
Figure 19. Demonstration of Slab Weight Modeling (photo by author) ...................................... 26
Figure 20. Different Model Time-Steps (photo by author) ......................................................... 27
Figure 21. Pressure Load Applied on Girders (photo by author) ................................................ 28
Figure 22. Gara DL Verification Results (Gara, et al., 2013) ..................................................... 29
Figure 23. Demonstration of Thermal Shrinkage Modeling (photo by author) ........................... 30
Figure 24. Thermal Shrinkage Stresses (photo by author) .......................................................... 31
Figure 25. Thermal Shrinkage Simplified model (photo by author) ........................................... 32
Figure 26. Thermal Shrinkage Results (Gara, et al., 2013) ......................................................... 34
Figure 27. Bridge 07273 Deck Cracking (photo by author) ........................................................ 35
Figure 28. Strain Gauges Layout (used with permission) (Ortiz, 2019) ...................................... 36
Figure 29. Strain Rosette Configuration (photo by author) ......................................................... 37
Figure 30. Cross-Sectional Dimensions of Bridge #07364 (photo by author) ............................. 38
Figure 31. Steel Framing Plan of Bridge #07364 (photo by author) ........................................... 39
Figure 32. Longitudinal Geometry of G1 (photo by author) ....................................................... 40
Figure 33. Bridge #07364 ABAQUS Model (photo by author) .................................................. 41
Figure 34. Mesh Size Testing Results ........................................................................................ 42
Figure 35. Dequeen Model Load Application (photo by author) ................................................ 43
Figure 36. Site Concrete Application (photo by author) ............................................................. 44
Figure 37. On-Site Concrete Paver (Bidwell 4800) (photo by author) ....................................... 45
Figure 38. Concrete Paver Railing (used with permission) ......................................................... 45
Figure 39. Bridge #07364 Construction Stresses........................................................................ 46
Figure 41. Thermal Shrinkage Effects at 3 Days ........................................................................ 47
Figure 42. Thermal Shrinkage Effects at 27 Days ...................................................................... 48
Figure 43. Thermal Shrinkage at 3 and 27 Days ........................................................................ 49
Figure 44. Total Stresses at 3 Days and 27 Days........................................................................ 50
Figure 45. Curvature effects on Bridge #07364 ......................................................................... 52
Figure 46. Field Data Validation Results ................................................................................... 53

List of Tables
Table 1. Contribution of Factors on Early-age Deck Cracking (Nassif, et al., 2017) .....................4
Table 2. Simple Span Model Materials Properties ..................................................................... 12

1
CHAPTER I
INTRODUCTION
1.1 Overview
Early age bridge deck cracking of continuous steel bridges is an important issue since it
compromises the service life of our bridge infrastructure. Research has shown that the two
factors that most contribute towards early age concrete cracking are concrete shrinkage and the
deck pouring sequence. These two factors and their effect on concrete cracking will be studied in
this thesis.
Current practices to mitigate early age concrete cracking taken by some state department of
transportation agencies (DOTs) include: specifying a sequence deck pour to reduce stresses in
negative moment regions, keeping the concrete temperature within a specified range, and
specifying curing methods to avoid large concrete temperature gradients. In this TRC1903 study,
multi-span continuous bridges were instrumented with strain gauges to measure concrete deck
strains and temperatures during the construction process. In addition, finite element models were
generated to numerically study the bridge deck behavior during the construction phase using
ABAQUS software. Results from the numerical models were compared to field data collected
from an ARDOT bridge instrumented for strains.

2
CHAPTER II
LITERATURE REVIEW
2.1 Background
Bridge decks are constructed using reinforced concrete. Bridge deck cracking provides a
pathway for moisture intrusion. Ingressing moisture and chloride ions from deicing chemicals
react with reinforcement bars to cause early corrosion, which reduces the structural capacity of
the rebar. (Nassif, et al., 2017). Bridge deck cracking also makes the deck more prone to freez-
thaw expansion, which causes accelerated deterioration in the concrete structure. Consequently,
bridge deck cracking increases the maintenance cost of preserving the bridge infrastructure
(Weiss, et al., 2000).
Bridge deck cracking initiated prior to live load application, Figure 1, will expand when
live loads are applied and freeze-thaw cycling begins, (M Ala Saadeghvaziri, 2002). Early age
cracking on continuous bridge decks can be dense (Yaohua Deng, 2016).
Figure 1. Cracking Prior to Applying Live Loads (photo by author)
Concrete material strain behavior and construction loads contribute to early age bridge
deck cracking. Concrete material strain behavior is characterized by the heat of hydration,
Deck
Cracking

3
concrete shrinkage, and concrete creep. Early-age concrete deck cracking due to shrinkage
results from restraining the concrete volume change and loss of moisture during the setting
process. Construction loads include the loads that are applied to the concrete bridge deck due to
moving formwork, construction personnel, and vibrating equipment (Gara, et al., 2013). These
conditions cause the internal tensile stresses to exceed the concrete tensile strength (Yaohua
Deng, 2016).
2.2 Concrete decks crack patterns
Concrete deck cracking can be categorized into 4 typical patterns. These include:1)
transverse, perpendicular to the girder longitudinal axis, 2) longitudinal, along the girder axis, 3)
map cracking, and 4) diagonal, Figure 2. Transverse cracking is the most common cracking
pattern and map cracking typically occurs in the negative moment regions.
Figure 2. Concrete Deck Cracking Patterns (photo by author)
Many studies have been done to determine the cause of early age bridge deck cracking.
Multiple factors can contribute to cause early age cracking. A parametric study was conducted to

4
evaluate the significance of these causation factors by developing a damage index. The study
found the following contribution percentages shown in Table 1. (Nassif, et al., 2017). In this
thesis, stresses due to construction loads, thermal shrinkage and creep are considered and their
contribution to early age bridge deck cracking is evaluated.
Table 1. Contribution of Factors on Early-age Deck Cracking (Nassif, et al., 2017)
2.3 Concrete Shrinkage
Internal tensile stresses develop in the concrete deck as a result of the concrete hardening
process. During concrete shrinkage, the volume of the hardening concrete will decrease.
However, the concrete bridge deck volume is restrained by the steel girders, reinforcement bars,
shear studs, and the stay-in-place formwork (SIP). Restricting the volume change will result in
inducing tensile stresses in the concrete deck (Saadeghvaziri, et al., 2005). Concrete shrinkage
can be categorized into four general types described in more detail in the following text.
Effect
Contribution
Percentage (%)
Temperature gradient 68%
Dead load 11%
Live load 10%
Bearing alignment 4%
Settlement 4%
Tilt 3%

5
2.3.1 Thermal Shrinkage
The concrete hardening process includes an exothermic reaction which is known as
cement hydration. This reaction happens during concrete setting and causes the concrete internal
temperature to increase above the ambient temperature. After the concrete deck sets, concrete
temperature decreases. Consequently, the concrete volume decreases. Since the concrete is
restricted, tensile stresses develop. These tensile stresses may be high enough to exceed the
concrete tensile strength and develop early age cracking (Gara, et al., 2013). In addition, a
continuous deck pour can result in erratic temperature distribution leading to non-uniform
cracking. Different methods can be used to reduce thermal shrinkage by using retarders to
decrease or control the temperature gradient.
2.3.2 Plastic Shrinkage
As concrete sets, it is in a plastic state, and moisture is lost through evaporation at the top
surface of the concrete. Moisture loss may cause tensile stresses greater than the concrete’s early
age tensile strength (Gara, et al., 2013).
2.3.3 Autogenous Shrinkage
Autogenous shrinkage happens early after placing the concrete in concrete mixtures with
low water /cement ratios. It occurs during the hydration reaction of the cement since there is not
enough water or moisture to hydrate the cement particles. Autogenous shrinkage is significant in
high-performance concrete, however minimal in normal strength concrete (Gara, et al., 2013).
2.3.4 Drying Shrinkage
Drying shrinkage develops in the hardened cement paste after curing and continues for
the life of the structure. As concrete hardens, concrete pore water evaporates to attain a moisture
content in equilibrium with the ambient moisture, hygrometric equilibrium. This moisture loss

6
decreases the concrete volume. In the case of the concrete volume being restrained by structural
components, internal tensile stresses develop. Drying shrinkage can cause significant concrete
deck cracking, however, it can be reduced through applying proper curing methods.
In this study, dead load (construction loads) and thermal shrinkage are considered as the
primary causes of early age concrete cracking. Studies using finite element models (FEM)
modeled concrete shrinkage as a change in temperature in the concrete bridge deck material.
(Saadeghvaziri, et al., 2005; Gara, et al., 2013). Bridge deck concrete stresses that develop
during concrete thermal shrinkage can be calculated using the modular ratio method (CEN.,
1992). The modular ratio method estimates the modular ratio by taking into account concrete’s
viscoelastic property as it hardens (Gara, et al., 2013).
2.4 Concrete Creep
Concrete creep develops due to the concrete material sustaining loads for long time
durations. Creep acts as a relaxing agent to reduce shrinkage effects. Consequently, creep is an
important factor in quantifying thermal shrinkage (Khan, et al., 2017). Creep plays an important
role in the stress flow between the concrete deck and the bridge girders. The modular ratio
approach used is adopted from the Eurocode (CEN., 1992) and suggested by (Gara, et al., 2013).
The Eurocode (CEN 1992) includes creep coefficients that are time-dependent and used to
estimate the elastic modulus of concrete based on its age. Creep decreases the concrete elastic
modulus based on time.
2.5 Deck Pouring Sequence
During bridge deck casting, the concrete hardening process begins for the different
concrete deck sections at different times. Concrete deck sections poured first will harden before

7
subsequent sections. The concrete pouring process induces stresses on earlier poured deck
sections that have already begun the hardening process. Therefore, the concrete pouring
sequence significantly influences the concrete bridge deck stress.
Moment influence lines can be used to demonstrate critical deck pouring patterns for
developing deck bending moments. Influence lines for moments can be found by placing a
moving unit load across the length of the bridge while studying the moment induced at the point
of interest. The moment influence line at midspan of the middle span of a three span bridge is
shown in Figure 3. Figure 3 shows that the negative moment regions, hogging regions over the
piers, do not cause a significant negative moment within the positive moment region, sagging
region in the middle of the span.
Figure 3. Moment Influence Lines
-15
-10
-5
0
5
10
15
20
25
30
0 50 100 150 200 250 300 350 400
Mo
men
t at
b d
ue
to a
un
it lo
ad
Unit load @
0.5 Span 2
Support B
SPAN 1 = 120 FT SPAN 2 = 130 FT SPAN 3 = 120 FT
8
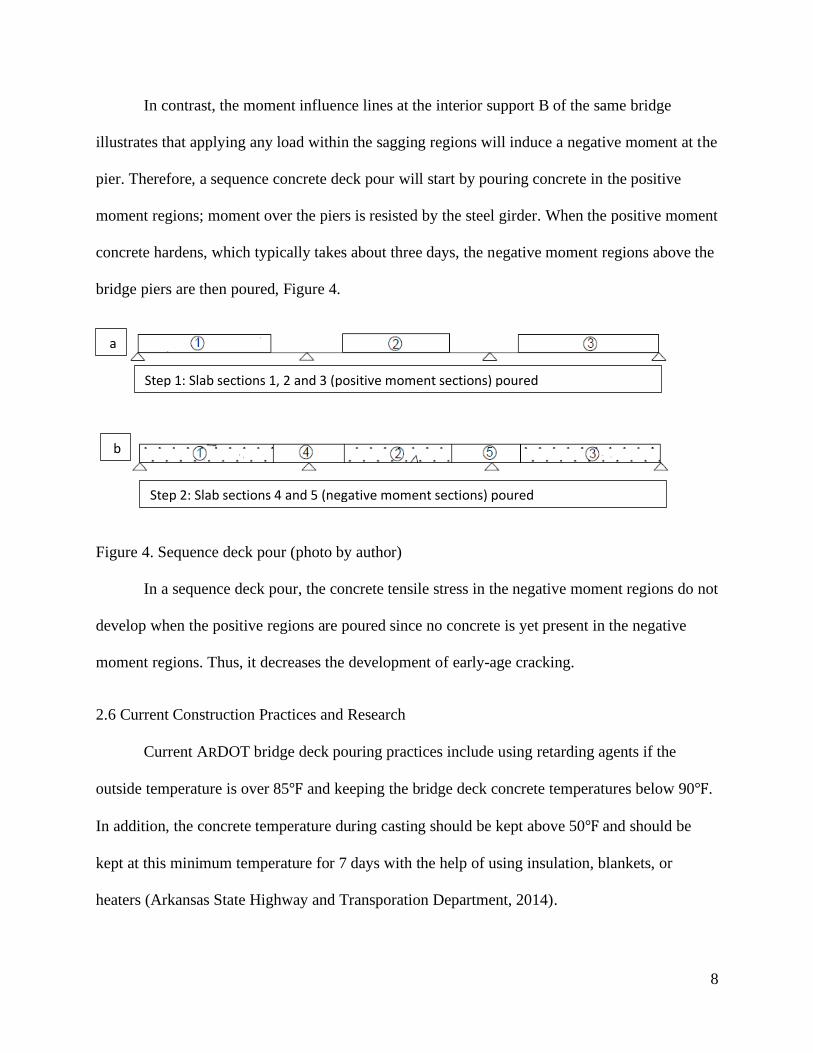
In contrast, the moment influence lines at the interior support B of the same bridge
illustrates that applying any load within the sagging regions will induce a negative moment at the
pier. Therefore, a sequence concrete deck pour will start by pouring concrete in the positive
moment regions; moment over the piers is resisted by the steel girder. When the positive moment
concrete hardens, which typically takes about three days, the negative moment regions above the
bridge piers are then poured, Figure 4.
Figure 4. Sequence deck pour (photo by author)
In a sequence deck pour, the concrete tensile stress in the negative moment regions do not
develop when the positive regions are poured since no concrete is yet present in the negative
moment regions. Thus, it decreases the development of early-age cracking.
2.6 Current Construction Practices and Research
Current ARDOT bridge deck pouring practices include using retarding agents if the
outside temperature is over 85℉ and keeping the bridge deck concrete temperatures below 90℉.
In addition, the concrete temperature during casting should be kept above 50℉ and should be
kept at this minimum temperature for 7 days with the help of using insulation, blankets, or
heaters (Arkansas State Highway and Transporation Department, 2014).
a
b
Step 1: Slab sections 1, 2 and 3 (positive moment sections) poured
Step 2: Slab sections 4 and 5 (negative moment sections) poured

9
ARDOT curing specifications allow using membrane curing compounds. Like other
DOTs, ARDOT permits using polyethylene sheeting or burlap as curing agents. ARDOT requires
that all bridge deck concrete be kept continuously wet for 7 days unless one of the membrane
curing compounds are used (Arkansas State Highway and Transporation Department, 2014).
Surveys were conducted by Ortiz (2019) to evaluate state DOTs response to early-age
bridge deck cracking. Each state surveyed had a different approach to remedying the early-age
bridge deck cracking problem. Survey results showed that the states of Kansas, Indiana, Georgia
and Virginia all require one or all of the following curing techniques on their newly constructed
bridges: 7-day cure with burlap, curing compound, or polyethylene sheeting. Cementitious
material in the concrete greatly contributes to shrinkage. Limiting the amount of cementitious
material in the concrete mix minimizes shrinkage (Ortiz, 2019). In response, some states limit
the amount of cement in their concrete mix. VDOT (Virginia DOT) specifies using low
shrinkage concrete or <600 lb./yd3 cementitious material in their concrete mix design (Virginia
Department of Transportation, 2016)
Existing literature on early-age bridge deck cracking mainly focuses on optimizing the
sequence construction staging. However, because of the economic and time benefits of the
continuous deck pour process, it needs to be evaluated and optimized.
2.7 High-performance concrete
High-performance concrete (HPC) has been used and studied on continuous bridge decks
to reduce early-age cracking. In one study, a continuous two span highway bridge using HPC
experienced significant amounts of early-age cracking (Nassif, et al., 2017). Transverse cracking
was observed in positive moment regions, while map cracking developed in the negative moment
regions of the bridge. The study concluded that multiple factors contribute to early age bridge

10
deck cracking: concrete deck temperature gradient, dead load, live load, settlement, tilt and
bearing alignment. The study included a finite element analysis (FEA) to study the effects of
each factor on early-age cracking. The numerical analysis was validated by placing monitors and
sensors on the bridge to measure deflections and stresses in the concrete deck. The models were
calibrated by driving a truck with known loads and simulating those loads on the FE model.
Study results found that 68% of early age cracking was due to shrinkage caused by the
temperature gradient and 11% of the cracking was caused by dead load during the construction
process (Nassif, et al., 2017). HPC tends to be more brittle than conventional concrete as it gains
strength over time. Consequently, HPC is more prone to tensile cracking and its usage may not
result in a more durable concrete (Weiss, et al., 2000).

11
CHAPTER III
SIMPLE SPAN VALIDATION MODEL
3.1 Overview
The numerical modeling techniques used in this thesis were validated using the stresses
calculated in the concrete deck of a simple span bridge. The ABAQUS software was used for
numerical modeling in this thesis. The composite girder simple span model includes one girder
with a concrete bridge deck. The numerically generated stress results considering the simple span
model were compared to hand calculations of the composite section.
3.2 Simple Span Model Geometry
A span length of two hundred feet is chosen for the model with pin-roller boundary
conditions, Figure 5.
Figure 5. Simple Span Model Longitudinal Geometry (photo by author)
A 20-ft slab width with a 7 34⁄ " slab thickness is used for the validation model. A W
36x135 member is used for the steel girder, Figure 6.
Figure 6. Cross-Section of Simple Span Model (photo by author)

12
3.3 Modeling Techniques
The validation model is used to test the modeling techniques that will be later used in
conducting models for ARDOT bridges. The steel girders are modeled as beam elements (B31).
While, solid 8-node linear brick elements (C3D8) are used for the concrete deck since higher
accuracy will be needed to study the stress development when construction loads are applied on
the structural steel.
A tie constraint is used to connect the nodes between the steel girder and the concrete
deck. To tie the two parts together for composite action, the deck had to be partitioned at
different locations to be able to correctly connect to the steel girder. In this type of tie constraint,
the slave nodes follow the master nodes. In this example, the beam elements serve as the master,
as it is the part being loaded while the deck is the slave part of this constraint. This also requires
a finer mesh for the master than the slave to attain more accurate results. However, this kind of
constraint may alter the behavior of the elements being tied, since the degrees of freedom of
beam elements are different than those of the solid elements. A mesh size of 1 inch is used in the
deck and a slightly smaller mesh size was used for the beam.
3.4 Material Properties
Elastic materials properties were assumed for both the steel and the concrete in the
model. The material properties used are shown below in Table 2.
Table 2. Simple Span Model Materials Properties
Material Elastic Modulus (ksi) Poisson’s Ratio
Steel 29000 0.3
Concrete 3645 0.2

13
3.5 Validation Results
The Figure 7 graph represents the concrete deck surface stresses in the longitudinal
direction. The graph shows that the maximum compressive stress appears midspan at 100 feet
with a value of 3.52 ksi.
Figure 7 Validation Model Results
Hand calculations were done by first calculating the cross-sectional properties of the
composite member by converting the concrete section into an equivalent steel section using the
modular ratio. The concrete slab weight was applied as a line load on the beam. A 3.6 ksi
concrete compressive stress was calculated by hand, which compares very well, 2.2%, with the
3.52 ksi numerically generated results.
-4
-3.5
-3
-2.5
-2
-1.5
-1
-0.5
0
0.5
0 20 40 60 80 100 120 140 160 180 200
σ (
ksi)
Distance Along Bridge (ft.)
Simple Span Validation

14
CHAPTER IV
CONSTRUCTION VERIFICATION MODEL
4.1 Overview
A numerical model developed by Gara et al. (2013) was used to validate the numerical approach
in this thesis for the construction process, including construction dead loads and thermal
shrinkage loads. Gara et al. (2013) conducted a similar analysis to the work described in this
thesis by creating a time dependent numerical model of the bridge construction process. The
Gara model included a three-span composite steel box girder with a concrete bridge deck. For
this thesis, ABAQUS subroutines were written to calculate the concrete time-dependent elastic
modulus along with the effects of concrete creep, Appendix A. The analysis considered concrete
dead load, paver loads, and thermal shrinkage as contributors to early age bridge deck cracking.
The bridge model is shown in Figures 8 and 9. These figures show the overall model
configuration with all the included computational parts. The bridge model is subdivided into 10-
meter sections to simulate the deck section poured during the deck pouring process. Each section
is loaded sequentially to represent the continuous deck pour process.

15
Figure 8. Gara Model Assembly (photo by author)
Figure 9. Structural Steel of Gara Model (photo by author)
Steel
Girder
Support
Plate
Steel
Girder
Concrete
Deck

16
4.2 Gara Bridge Geometry
Gara et al. (2013) analyzed a 130 m long bridge with a 50 m. middle span and two 40 m.
outer spans for early age bridge deck cracking, Figure 10. All piers and abutments of the bridge
have pin supports, meaning that the bridge movement is restricted in all directions (x,y,z), however
free to rotate in all directions. The box girder cross-sectional properties are not provided in the
(Gara, et al., 2013) reference and therefore, were approximated, Figure 11.
Figure 10. Longitudinal Geometry of Gara Bridge (photo by author)
Figure 11. Cross-Sectional Geometry of Gara Bridge (photo by author).

17
4.3 Gara modeling Techniques
The numerical model used for the validation includes three parts: deck, girder, and
concrete forms. A tie constraint is used to accurately model the interaction between the steel
girder and the concrete deck. For the tie restraint, the master surface is the top surface of the steel
girder flange and the slave surface is the bottom surface of the deck. The tie constraint between
the two surfaces is shown in Figure 12, where the constraint interface is shown in red.
Figure 12. Tie Constraint (photo by author)
4.3.1 Boundary Conditions
Figure 13 shows the boundary conditions used for this analysis. Pin supports are used at
the bridge piers and abutments. For the 3-D analysis, a pin support is equivalent to a ball and
socket joint. The pin supports restrict movement in all three directions, however, allow for
rotation in all directions. The girder boundary conditions were applied to support plates attached
to the bottom of the girder, Figure 9, at 0 m, 40m, 90m and 130m points along the girder.
Box Girder
Box Girder and Deck Constraint
Concrete
Deck
Top Flange of Girder

18
Figure 13. Bridge Support Boundary Conditions (photo by author)
The second set of boundary conditions was applied to attach the concrete stay in place
(SIP) forms to the steel girder top flange, Figure 14. The movement between the two parts is
restricted in the x-direction, which goes along the bridge, and in the z-direction, the transverse
direction perpendicular to x. The movement along the y-direction, vertical, is free to move to
better accommodate vertical bridge deflections (Whisenhunt, 2004). To simulate this boundary
condition, the edge of the concrete SIP forms is connected to the inner side of both adjacent top
girder flanges.
Figure 14. Concrete Forms Boundary Conditions (photo by author)
The SIP forms were modeled as truss elements. The buckling of the truss elements was
prevented during compression loading by reducing the truss element’s effective length. To
reduce effective length, pin boundary conditions were applied mid-length of the element, Figure
15. Consequently, the pin boundary condition braced the truss element and reduced the element’s
effective length.
Concrete
Deck
Steel Girder
Support
Conditions
Stay in
Place
Forms
Girder to SIP
Forms
Boundary
Condition. Top Flanges

19
Figure 15. SIP Form Bracing Boundary Conditions (photo by author)
4.3.2 Modeling of The Concrete Paver Loads
The Gara et al (2013) reference problem includes concrete paver loads. A concrete paver
is used to roll finish the concrete deck surface. The concrete paver loads are time-dependent and
only exist within the slab section being poured. The concrete paver load is applied as a uniformly
distributed load above the box girder web sections within the 10 m section being poured, Figure
16.
Figure 16. Concrete Paver Load Distribution.
To model the SIP forms, the effective cross-sectional area of a typical SIP form is
assigned as the cross-sectional area of the truss element. The SIP forms are modeled using truss
elements and configured as shown in Figure 17. This configuration prevents lateral girder
displacement during the concrete pouring process, but does not affect the overall cross-sectional
properties of the model. Since the SIP forms are modeled as truss elements they are considered
axial force members that only support compression and tension forces, but not bending.
SIP Forms
Bracing
Concrete Paver Load

20
Figure 17. Modeling Forms (photo by author)
The truss element bracing was only considered in the longitudinal 10 m section during
the time that concrete was being poured. After the section was poured, the slab was considered to
act compositely with the steel girders and the truss element bracing was removed within the
section.
4.4 Materials properties
Isotropic elastic mechanical properties were assumed for all parts of the bridge model.
The structural steel was assumed to have a Young’s Modulus of 210,000 MPa. and a Poisson’s
Ratio of 0.3. As suggested by Whisenhunt (2004), the same elastic properties used for steel were
assigned to the SIP forms.
4.4.1 Material properties of Concrete
The concrete elastic modulus will vary as a function of time. The variation in the concrete
elastic modulus can be modeled using the user subroutine, UMAT, in ABAQUS. The UMAT
subroutine dictates the material’s constitutive relationship to the main program’s calculated
strains. The UMAT subroutine calculates the elastic modulus for each slab section as a function
of the slab section’s age. For example, at time step 4 (8 days), the first slab segment poured at
time step 1 (2 days) has gained more strength. Consequently, the first slab section will have a
greater elastic modulus than the later poured slab sections. The user subroutine UMAT was
chosen for this model since the subroutine is able to define the material’s elastic modulus
through user-set values. The UMAT subroutine was written using Fortran 77. The UMAT

21
subroutine was organized in the format described in the ABAQUS manual. The UMAT
subroutine was broken into four main sections. The first UMAT subroutine section identified
each slab segment’s age for the considered analysis time. The initial set time for each segment is
identified by the slab segment’s name given in the input file. Each segment is named by the order
it is to be poured. Therefore, the slab age is equal to the difference between the analysis time and
the segment's initial set time. The next subroutine section defined the concrete’s elastic modulus.
The elastic modulus varies with time, Equation (1) (CEN., 1992).
Ecm (t) = (fcm(t) / fcm)0.3 Ecm (1)
where:
Ecm (t) is the Elastic modulus at an age of t days
fcm (t) is the mean concrete compressive strength at an age of t days
Ecm is the Elastic modulus at an age of 28 days
fcm is the mean concrete compressive strength at of 28 days
𝐟𝐜𝐦(𝐭) = βcc(t) fcm (2)
with
𝛃𝐜𝐜(𝐭) = exp {s [1 − (28
t)
1/2
]} (3)
βcc (t) is a coefficient which depends on the age of the concrete at time t
t is the age of the concrete in days
s is a coefficient which depends on the type of cement:
= 0.20 for cement of strength Classes CEM 42.5 MPa and 52.5 MPa;
= 0.25 for cement of strength Classes CEM 32.5 MPa and 42.5 MPa;
= 0.38 for cement of strength Classes CEM 32.5 MPa;

22
The concrete elastic modulus is calculated using Equations (1), (2), and (3). This value is
then modified based on creep.
The next part of the UMAT user subroutine modifies the calculated elastic modulus at
time t to consider long term loading through creep. The modification for creep is included using
the Eurocode 2 creep factors (CEN., 1992). Eurocode 2 creep factors are a function of the
concrete age, concrete properties, and ambient conditions.
Creep factors are calculated using the following equations (CEN., 1992):
𝛗(𝐭, 𝐭𝟎) = φ0. βc(t, t0) (5)
where:
𝛗(𝐭, 𝐭𝟎) is the creep coefficient
𝛗𝟎 is the notional creep coefficient which can be calculated from the following equation (6)
𝛗𝟎 = φRH. β(fcm). β(t0) (6)
𝛗𝐑𝐇 is a factor to allow for the effect of relative humidity on the notional creep coefficient:
𝛗𝐑𝐇 = 1 +1 − RH/100
0.1√h03
for fcm ≤ 35 MPa (𝟕𝐚)
𝛗𝐑𝐇 = [1 +1 − RH/100
0.1√h03
α1] α2 for fcm ≥ 35 MPa (𝟕𝐛)
RH is the relative humidity of the ambient environment in %
𝛃(𝐟𝐜𝐦) is a factor to allow for the effect of concrete strength on the notional creep
coefficient:
𝛃(𝐟𝐜𝐦) = 16.8
√fcm
(𝟖)
𝐟𝐜𝐦 is the mean compressive strength of concrete at 28 days in MPa

23
𝛃(𝐭𝟎) is a factor to allow for the effect of concrete age at loading on the notional creep
coefficient:
𝛃(𝐭𝟎) = 1
(0.1 + t00.2)
(𝟗)
h0 is the notional size of the member in mm:
𝐡𝟎 = 2Ac
u (𝟏𝟎)
Ac is the cross-sectional area
u is the perimeter of the member in contact with the atmosphere
𝛃𝐜(𝐭, 𝐭𝟎) is a coefficient to describe the development of creep with time after loading:
𝛃𝐜(𝐭, 𝐭𝟎) = [t − t0
βH + t − t0] 0.3 (𝟏𝟏)
Where:
t is the age of concrete at time step considered (days)
t0 is the age of concrete at loadings (days)
t-t0 is the non-adjusted duration of loading (days)
𝛃𝐇 is a coefficient depending on the relative humidity and the notional size
𝛃𝐇 = 1.5[1.5 + (0.012RH)18] h0 + 250 ≤ 1500 for fcm ≤ 35 (𝟏𝟐𝐚)
𝛃𝐇 = 1.5[1.5 + (0.012RH)18] h0 + 250α3 ≤ 1500α3 for fcm ≤ 35 (𝟏𝟐𝐛)
α1/2/3 are coefficients to consider the influence of the concrete strength:
𝛂𝟏 = [35
fcm]
0.7
(𝟏𝟑𝐚)
𝛂𝟐 = [35
fcm]
0.2
(𝟏𝟑𝐛)
𝛂𝟑 = [35
fcm]
0.5
(𝟏𝟑𝐜)

24
The modified elastic modulus due to creep effects, Ecm(t)Creep, can be estimated as:
𝐄𝐜𝐦(𝐭)𝐂𝐫𝐞𝐞𝐩 =Ecm(t)
1 + [1.1 φ(t, t0)] (𝟏𝟒)
Where the 1.1 represents the creep multiplier when considering permanent loads: slab weight and
thermal shrinkage (CEN., 1992).
The final UMAT subroutine section uses constitutive relationships to determine element stresses.
For this thesis, the concrete is being modeled as an isotropic elastic material:
𝛔 = [K] ε (4)
where:
𝛔 is the stress
[𝐊] is the stiffness matrix
𝛆 is the strain
The subroutine UMAT is called to calculate the element stresses at the beginning of each time
step. The Gara et al. (2013) reference modeled the deck as C40/50 concrete. From the Eurocode
Table 3.1 (CEN., 1992), Ecm, 28 day elastic modulus, is 35 GPa with a compressive strength, fcm,
of 40 MPa. For this concrete material, the cement coefficient, s, in Eq (3) is 0.25.
4.5 Types of Elements and Computational Time
The numerical model consisted of 3 main structural elements, the deck, girder and stay-
in-place forms (SIP forms). The deck and the girder were modeled as solid sections and were
assigned 8-node linear brick (C3D8) elements. The deck was meshed using a 0.05 m global seed
size, mesh size. While the box girder was meshed using a seed size of 0.035 m, the smaller mesh
size had to be used in the girder due to the sharp edges in the geometry of the girder and because
the girder is considered as the master in the tie constraint used. The SIP forms were modeled as

25
beam sections and assigned 2-node linear 3-D truss (T3D2) elements, a global seed size of 1.5 m
was used for the SIP forms since it only kept the girder from lateral displacement while the dead
load is being applied, before the deck and the girder becomes a composite section. Figure 18
shows the bridge cross-section mesh. The total CPU time for this problem was 4.4 hours.
Figure 18. Mesh of Bridge Cross-Section (photo by author)
4.6 Loading of Model and Verification Results
The deck was partitioned into 13 segments, 10 m each. The analysis begins with only the
steel sections. The first time-step includes applying the slab weight and concrete paver loads on
the segment 1 steel girder. The next step includes the already poured concrete deck loads on the
first segment as a composite member and loads being applied to the next segment. During this
step, the concrete paver load is removed from segment 1 and applied to segment 2. Figure 19
illustrates the process for the first three time-steps. While Figure 20 shows the process at
different time steps for the numerical model. The analysis continues sequentially. Time step 14 is
the last loading step in the analysis. During step 14 the concrete paver load is removed from
segment 13. Each slab segment was assumed to be poured over a 2 day time period. Therefore,

26
each analysis time step was equal to 48 hours. Consequently, time-step 14 ended at 672 hours
(28 days). An extra construction step was added for the removal of the concrete paver load.
Results are evaluated at 30 days.
Figure 19. Demonstration of Slab Weight Modeling (photo by author)

27
Time Step 1 Time Step 2
Time Step 3 Time Step 12
Figure 20. Different Model Time-Steps(photo by author)
4.6.1 Load Calculations
4.6.1.1 Concrete Weight
To calculate the slab weight applied on the steel girders the following equations were used.
Volume/ Unit Length = Thickness of Slab x Slab Width (15)
Concrete Weight/ Unit Length = Volume x γConc. (16)
𝐏𝐫𝐞𝐬𝐬𝐮𝐫𝐞 𝐋𝐨𝐚𝐝 =Concrete Weight
Area of Loading (𝟏𝟕)
where:
Volume/ Unit Length is the concrete volume considering a 10 m slab section m3
m
𝛄𝐂𝐨𝐧𝐜. is the unit weight of reinforced concrete taken as 25 kN
m3 per Eurocode 2
Structural
Steel
1st Slab
Segment
Added
2nd Slab
Segment
Added
11th Slab Segment Added
in Time Step 12

28
Pressure Load is the load applied within a small flange width and l0 m girder length in N
m2
The pressure load applied, 2.3 MPa, to the girder flanges is shown in Figure 21. Loads are
assumed to be applied equally on both girder flanges.
Figure 21. Pressure Load Applied on Girders (photo by author)
4.6.2 Stress Development
Concrete within a bridge section is assumed to have started hardening at the time the
subsequent bridge section pouring begins. Consequently, concrete stress within a section is due
to the loading of subsequent bridge sections. For example, the slab segment poured in time- step
3 does not develop any stresses in section 3 concrete until construction loads are being applied
on the fourth slab segment, time-step 4.
Concrete + Concrete
Paver load applied on
first segment in Time
Step 1

29
4.6.2.1 Dead Load Verification Results
Results from the concrete dead load and concrete paver weight are shown in Figure 22.
The figure shows a comparison between the numerical model developed for this thesis and the
results included in Gara et al (2013).
Figure 22. Gara DL Verification Results (Gara, et al., 2013)
The major (x-axis) represents the longitudinal distance along the bridge deck while the y-
axis shows the longitudinal stresses developed in the bridge deck at the end of construction. The
blue graph represents the Gara research tensile stresses at the end of construction (30 days) in the
concrete slab. While the graph marked as ABAQUS 30 Days Const. Stresses shows the
longitudinal stresses taken at a path at the center of the concrete deck at the end of construction
(30 days). Stresses labeled as ABAQUS Stress Envelope are a combination of the maximum
stresses recorded in the concrete slab at each time step as the construction model is run. The
-1.5
-1
-0.5
0
0.5
1
1.5
2
2.5
3
3.5
0 20 40 60 80 100 120 140
σ(M
Pa)
Distance Along Deck (m)
GARA
ABAQUS Stress Envelope
ABAQUS 30 Days Const. Stresses

30
stress envelope shows that higher tensile stresses appear during the construction processes. As
can be seen the maximum tensile stresses appear to be in the negative moment regions which are
also over the bridge piers; the maximum tensile stress, from ABAQUS, above the second pier
appears to be slightly lower than the Gara results. This is mainly due to the fact that the elastic
modulus calculated in the subroutine, explained in section 4.5.1, is going to be lower than the
elastic modulus of concrete sections poured earlier. Other reasons for the stress difference in
Figure 22 are various assumptions made to model this problem due to limited information from
the Gara research paper.
4.6.4 Thermal Shrinkage Modeling
A separate numerical model is created to model the thermal shrinkage effects. The effects
of creep are included by modifying the elastic modulus of concrete for an average slab age at the
final analysis time. The modeling method suggested by Gara et al (2013) is demonstrated in
Figure 23. The method includes applying a tension force and a positive moment on each newly
applied slab section.
Figure 23. Demonstration of Thermal Shrinkage Modeling (photo by author)

31
A simplified method to approximate this process is shown in Figure 24. The simplified
approach replaces these intermediate load applications with a single calculation at the end of
construction. In this method, an average concrete age is used for the thermal shrinkage effects.
Thermal shrinkage causes the slab to shorten. However, the deck reinforcing steel and shear
studs prevent the concrete from shrinking. This resistance to shrinkage induces tensile stresses in
the concrete. The concrete stress is assumed to act uniformly as a pressure on the slab cross-
section. Since the concrete stress is not concentric with the composite cross-section, it will create
a moment. The user subroutine DLOAD was used to estimate the applied thermal shrinkage
pressure on the slab.
Figure 24. Thermal Shrinkage Stresses (photo by author)
The total force effects of thermal shrinkage are represented by (F):
F = αconcreteDT Econcrete.Aslab (15)
Where:
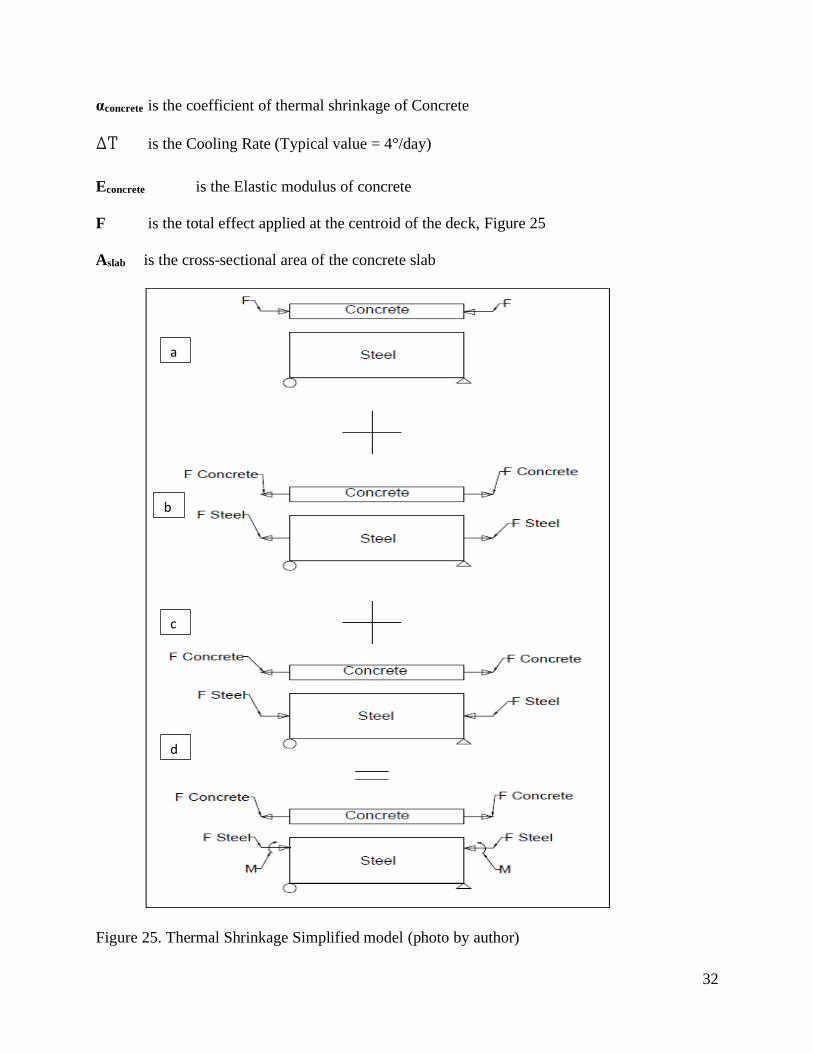
32
αconcrete is the coefficient of thermal shrinkage of Concrete
DT is the Cooling Rate (Typical value = 4°/day)
Econcrete is the Elastic modulus of concrete
F is the total effect applied at the centroid of the deck, Figure 25
Aslab is the cross-sectional area of the concrete slab
Figure 25. Thermal Shrinkage Simplified model (photo by author)
a
b
\
c
\
d
\

33
The thermal shrinkage stress calculation was conducted in multiple steps. First, an
external force F is applied at the slab. Consequently, the eccentric force F develops an axial force
and moment about the composite section centroid. The force F is applied as a compression force
to attain the moment effect that the thermal shrinkage causes Figure 25(a). However, the stresses
calculated will also include additional erroneous compression axial stresses and need to be
corrected for the actual tension stresses. The slab stresses are corrected by applying a tension
force, FCONCRETE, to negate the stresses induced in the slab by F, Figure 25(b). Next, a tension
force FCONCRETE is applied to the slab to represent the actual tension force caused by the steel
preventing the slab from shrinking, Figure 25(c). Additional tensile stresses are developed due to
the rebar in the slab acting to resist shrinkage. These stresses are considered as a tensile force
acting only in the slab at the slab centroidal level.
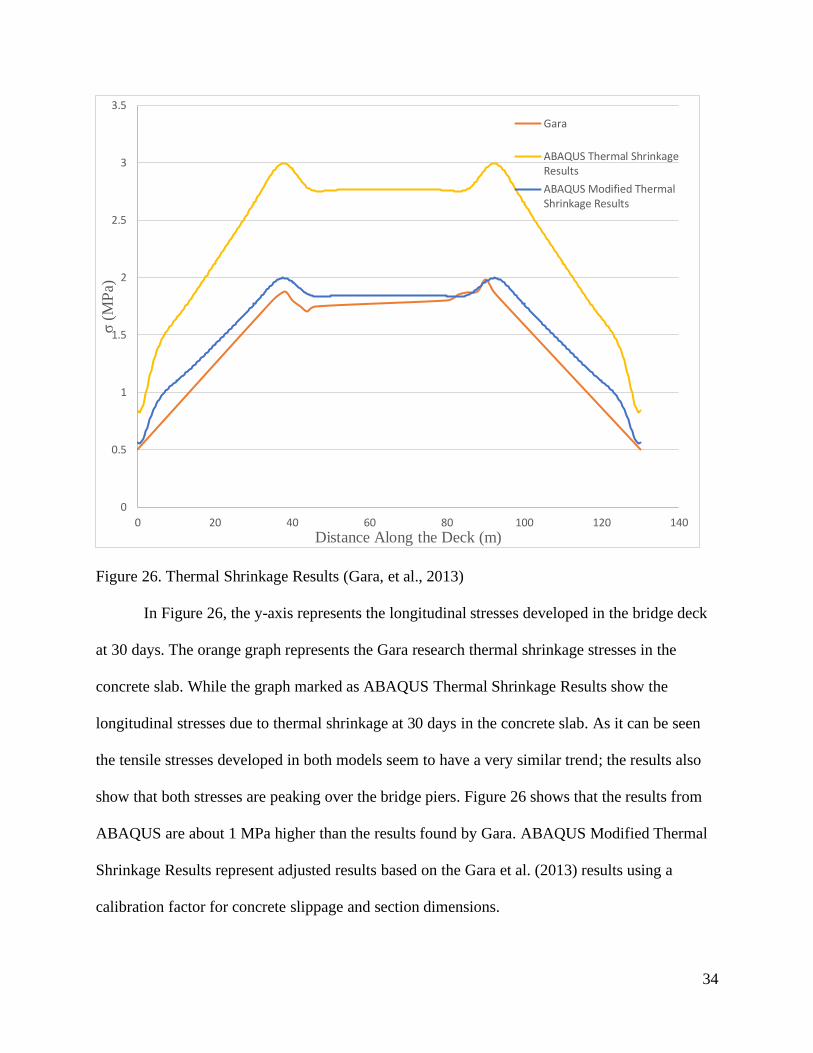
4.6.4.1 Thermal Shrinkage Verification Results
Results from thermal shrinkage effects are shown in Figure 26. The figure shows a
comparison between the numerical model developed for this thesis using the simplified method
and the results found in Gara et al (2013).
34
Figure 26. Thermal Shrinkage Results (Gara, et al., 2013)
In Figure 26, the y-axis represents the longitudinal stresses developed in the bridge deck
at 30 days. The orange graph represents the Gara research thermal shrinkage stresses in the
concrete slab. While the graph marked as ABAQUS Thermal Shrinkage Results show the
longitudinal stresses due to thermal shrinkage at 30 days in the concrete slab. As it can be seen
the tensile stresses developed in both models seem to have a very similar trend; the results also
show that both stresses are peaking over the bridge piers. Figure 26 shows that the results from
ABAQUS are about 1 MPa higher than the results found by Gara. ABAQUS Modified Thermal
Shrinkage Results represent adjusted results based on the Gara et al. (2013) results using a
calibration factor for concrete slippage and section dimensions.
0
0.5
1
1.5
2
2.5
3
3.5
0 20 40 60 80 100 120 140
σ(M
Pa)
Distance Along the Deck (m)
Gara
ABAQUS Thermal ShrinkageResults
ABAQUS Modified ThermalShrinkage Results

35
CHAPTER V
ARDOT BRIDGES FIELD WORK
5.1 Bridge Visits
Several ARDOT bridges experiencing early age cracking were visited to understand
cracking patterns and their typical locations on bridge decks. ARDOT Bridge #07315 located in
Lowell, AR, is a three span 230 ft. long bridge that experienced severe transverse cracking
throughout the whole bridge deck. Bridge #07273 was also studied, Figure 27. Bridge #07273 is
located on the newly constructed Bella Vista bypass. The bridge is a two-span continuous steel
girder bridge with a combination of longitudinal and transverse cracking. The cracking was
severely dense near the bridge piers in the negative moment regions.
Figure 27. Bridge 07273 Deck Cracking (photo by author)
Deck
Cracking

36
5.2 Bridge Instrumentation
Arkansas Bridge # 07364, located in Sevier County east of DeQueen, AR on highway
US-71was instrumented to record bridge deck behavior. The bridge is a curved girder bridge.
The bridge is composite with the concrete deck supported by wide flange steel girders. The
bridge replaced an existing bridge and was constructed in two stages. The concrete deck was
constructed using a continuous deck pour. The bridge was instrumented using Vibrating Wire
Strain Gauges (VWSG). These strain gauges were used to measure the temperature and
developed strains in the newly poured concrete deck.
A total of 32 strain gauges were used to instrument the second construction stage part of
the bridge. Sensors were attached to the deck reinforcement steel. The gauges were instrumented
to measure the strains in the longitudinal direction, along the length of the deck, while four strain
rosettes were placed in critical locations on the bridge deck, as shown in Figure 28. Each rosette
contains three VWSG 4200 sensors placed at three different angles, Figure 29. The strain rosettes
were used to calculate principal stresses at critical locations
Figure 28. Strain Gauges Layout (used with permission) (Ortiz, 2019)

37
Figure 29. Strain Rosette Configuration (photo by author)
Details for instrumenting Arkansas Bridge # 07364 are available in Ortiz (2019).
1
2
3

38
CHAPTER VI
BRIDGE #07364 NUMERICAL MODELING
6.1 Overview
The curved girder bridge, Arkansas Bridge #07364, was numerically modeled for this
thesis using the ABAQUS FEM software. The model was generated to numerically represent
early age bridge deck cracking.
6.2 Bridge #07364 Geometry
The selected bridge is a curved bridge with 15° abutments and piers. The radius of
curvature from the centerline of bridge and construction is 1909’-105
16".The outside fascia
Girder 1 consists of two 59’-119
16" outer spans and a 71’-3
13
16" inner span. While inside fascia
Girder 10 is 57’-87
16" for the two outer spans and is 68’-8
1
8" for the inner span. The total width of
the bridge is 78’ consisting of ten W 36x135 steel members composite with a concrete deck
thickness equal to 73
4" inches. All steel diaphragms between the girders are MC 18x42.7
sections.
Figure 30. Cross-Sectional Dimensions of Bridge #07364 (photo by author)

39
Figure 31 shows the steel plan bridge view with the previously mentioned dimensions.
Only Construction Stage 2 was instrumented and numerically modeled. Stage 2 Construction
includes girders 1 through 7. The girders are marked G1-G7 in Figure 31. The girders use W
36x135 steel girders. MC18x42.7 members are used for the diaphragms. Bridge bents are marked
B1-B4, showing bent 4, B4, of the left side and bent 1, B1, on the right side of the framing plan.
Figure 31. Steel Framing Plan of Bridge #07364 (photo by author)
6.3 Modeling Techniques
The same modeling techniques discussed in section 3.3 are used. Both the steel girders
and diaphragms are modeled as beam elements (B31) and assumed to be attached together as one
part, however, assigned different cross-sectional profiles. A tie constraint is used to attach the
nodes assigned to the steel girders to the solid 8-node linear brick (C3D8) elements assigned to
the concrete deck. The solid deck is also portioned using the framing plan in Figure 31 to create
more points of attachments and achieve better results from the model. In addition, the deck was
G1
G2
G3
G4
G5
G6 G7
G8
G9 G10
B4 B3 B2 B1

40
divided into twelve slab segments, to model the time dependent construction process of the
bridge. Each segment is approximately 16 ft. in length.
6.3.1 Boundary Conditions
Boundary conditions for this model are simple supports applied to serve as bridge design
bearings at the bottom of each steel girder at each bent. Outer bents (bents 1 and 4) of this bridge
have bearings that act as roller supports that restrict translation in the vertical and transverse
directions (y and z-directions). However, allow movements in the longitudinal direction (x-
direction) along the bridge length. The bearing on the inner bents (bents 2 and 3) of the bridge
are pin supports that restrict translations in all directions (x,y,z). All rotational degrees of
freedom are allowed on all bents. A simplified bridge geometry is shown in Figure 32. Figure
33(a) shows the steel of the bridge while Figure 33(b) includes the added partitioned concrete
deck.
Figure 32. Longitudinal Geometry of G1 (photo by author)
Roller Pin

41
Figure 33. Bridge #07364 ABAQUS Model (photo by author)
6.3.2 Element Size and Model Convergence
The element size of the model will significantly affect the computational time of the
model analysis. A finer mesh of 1 inch elements for the concrete deck was used to test a
relatively fine mesh. On the other hand, a coarser mesh of 3 inches in the concrete deck was used
to study the difference in CPU time and results.
The stresses from both meshes are very similar, especially in the negative moment
regions which are the major area of interest for concrete tensile stress, Figure 34. The stress
differences are minimal and limited to the positive moment regions. However, the difference in
CPU time between the models is significant. The total CPU time for the fine mesh was 369.4
hours while the total CPU time for the coarse mesh was 0.08 hours. The stress results show that
the coarse mesh is adequate for this stress analysis; therefore, the coarse mesh was used for the
analysis.
a b

42
Figure 34. Mesh Size Testing Results
6.4 Material Properties
The numerical model used in this thesis considers two materials: steel and concrete.
Structural steel is assigned a Young’s Modulus of 29,000 ksi and a Poisson’s ratio of 0.3. The
elastic properties of concrete were approximated using two methods. In Method 1, the subroutine
described in section 4.4.1 was used to study the stresses developed during the bridge
construction.
6.5 Model Loading
The numerical model is loaded using the following method. The concrete deck is divided
into 12 sections. The length of each section is approximately 16-ft. The first slab section starts
at the bridge abutment, identified as B1 in Figure 31. The first time-step includes applying the
concrete distributed load to the seven bridge steel girders (G1–G7) plus applying the concrete
paver load to only the fascia girders (G1 and G7). The second time- step includes removing the
-0.2
-0.1
0
0.1
0.2
0.3
0 50 100 150 200
σ(k
si)
Distance Along the Bridge (Ft.)
Fine Mesh
Coarse Mesh

43
concrete paver load from section 1, and applying the concrete and concrete paver load to section
2. During the second time-step, composite slab-girder action is considered within section 1. The
concrete elastic modulus within each slab section is time dependent and is calculated using the
UMAT subroutine. Dimensional unit conversions are applied to the Eurocode equations to
accommodate the U.S. customary units in this model. The concrete load within each section is
applied permanently to the steel girders while the concrete paver load is applied only to the
fascia girders during the time that the slab is being poured within the section, Figure 35.
Figure 35. Dequeen Model Load Application (photo by author)

44
6.5.1 Load Calculations
6.5.1.1 Concrete Weight
The numerical model used for Bridge #07364 uses beam elements to model the bridge
girders. Consequently, the concrete dead load is applied as a line load in contrast to the pressure
load used in the previously discussed Gara et al. (2013) model. Line loads are distributed loads
applied to the element in force per linear length with dimensional unit kip/ft. The concrete load
withn each 16 ft. slab segment is equally distributed to all the girders.
Figure 36. Site Concrete Application (photo by author)
6.5.1.2 Concrete Paver Load
The concrete paver levels and smooths the concrete bridge deck surface, Figure 37. The
concrete paver rides along rails located about the fascia girders (Figure 38). The concrete paver
is motorized and moves along the bridge length leveling the recently poured concrete. The
Concrete
applied on
girders

45
concrete paver used at this bridge was a Bidwell 4800 model. The concrete paver load is only
considered within the deck section that the concrete is being poured..
Figure 37. On-Site Concrete Paver (Bidwell 4800) (photo by author)
Figure 38. Concrete Paver Railing (used with permission)
6.6 Thermal Shrinkage Modeling
Thermal shrinkage effects were evaluated at 3 and 27 days based on the method
discussed in section 4.6.4.
Concrete
paver
Concrete
Paver Railing

46
CHAPTER VII
RESULTS AND DISCUSSION
7.1 Bridge #07364 Dead Load Results
The dead load includes concrete weight plus the concrete paver loads applied to the fascia
girders within the concrete pouring section. The concrete elastic modulus is estimated by the
UMAT subroutine.
Figure 39 shows the stresses developed along the bridge centerline. The early age
concrete tensile strength is superimposed on the graph, fctm. The Eurocode time dependent
equations are used to calculate, fctm (CEN., 1992). The numerical model shows that dead load
stresses developed by construction loads are lower than the 1-day concrete tensile strength.
Therefore, construction loads alone do not cause early age concrete cracking.
Figure 39. Bridge #07364 Construction Stresses
-0.1
0
0.1
0.2
0.3
0.4
0.5
0.6
0 20 40 60 80 100 120 140 160 180 200
σ(k
si)
Distance Along the Bridge (Ft.)
DEAD LOAD STRESS
fctm (1 day)
fctm (1 day)

47
In addition to dead load effects, thermal shrinkage needs to be considered. In the
following, thermal shrinkage effects are evaluated at 3 and 27 days to evaluate the total stress
state of the bridge deck and compare with the concrete tensile strength.
7.2 Bridge #07364 Thermal Shrinkage Results
Thermal shrinkage effects induce additional stresses on early age concrete. Thermal
shrinkage effects were studied at 3 and 27 days. Thermal shrinkage occurs 2-3 days after the
concrete is poured due to concrete cooling. Concrete tensile stresses develop in the concrete due
to the shear studs and concrete reinforcing steel resisting the concrete from contracting.
Concrete slab stresses due to thermal shrinkage at 3 days are shown in Figure 40. The
figure shows that at 3 days the stresses due to thermal shrinkage within the middle span surpass
the 3 day concrete tensile strength.
Figure 40. Thermal Shrinkage Effects at 3 Days
-0.2
-0.1
0
0.1
0.2
0.3
0.4
0.5
0.6
0 20 40 60 80 100 120 140 160 180 200
σ(k
si)
Distance Along Bridge (ft.)
Thermal Shrinkage at 3 Days
fctm (3 Days)
fctm (3 days)

48
Figure 41 indicates that as the concrete ages, concrete creep becomes a factor and
concrete stresses due to thermal shrinkage decrease, while the concrete tensile strength has
increased. Consequently, the concrete stresses due to thermal shrinkage at 27 days are
significantly less than the early age concrete stresses at 3 days.
Figure 41. Thermal Shrinkage Effects at 27 Days
The thermal shrinkage results in Figure 42 show a 38% decrease in the maximum stress
experienced by the concrete slab between the ages of 3 and 27 days.
-0.2
-0.1
0
0.1
0.2
0.3
0.4
0.5
0.6
0 20 40 60 80 100 120 140 160 180 200
σ(k
si)
Distance Along Bridge (ft.)
Thermal Shrinkage at 27Days
fctm 27 Daysfctm (27 days)

49
Figure 42. Thermal Shrinkage at 3 and 27 Days
To understand the stresses developed in the concrete deck, the overall stress state needs
to be evaluated. The combined total effects of construction and dead loads in addition to the
stresses developed by thermal shrinkage must be studied to better understand the total stress state
and compare this value with the time dependent concrete tensile strength.
7.3 Bridge #07364 Total Effects
The combined effects of concrete shrinkage and dead load are next evaluated at 3 and 27
days, Figure 43. Concrete total stresses are compared to the corresponding tensile strength to
determine a critical concrete age that slab cracking occurs at. The potential for concrete cracking
is when the total concrete stress exceeds the relative concrete tensile strength.
-0.2
-0.1
0
0.1
0.2
0.3
0.4
0.5
0.6
0 20 40 60 80 100 120 140 160 180 200
σ(k
si)
Distance Along Bridge (ft.)
ThermalShrinkage at 3Days
ThermalShrinkage at 27Days
fctm (3 days)
fctm (27 days)

50
Figure 43. Total Stresses at 3 and 27 Days
The results of the total effects (thermal shrinkage and construction loads) on the slab
indicate that the early age cracking is critical at 3 days when the max tensile stress exceeds the 3
day concrete tensile strength. Conversely, at 27 days the total stresses do not exceed the 27 day
concrete tensile strength. Total stresses at 27 days were determined considering an uncracked
concrete deck slab for section properties. However, in actuality early age slab cracking will
affect section properties and total stresses at subsequent times.
7.4 Bridge Curvature Effects
ARDOT Bridge #07364 is a curved girder bridge with a 1909’-105
16" radius of curvature
from the bridge centerline. The bridge curvature e ffects are examined by developing a model
-0.2
-0.1
0
0.1
0.2
0.3
0.4
0.5
0.6
0 20 40 60 80 100 120 140 160 180 200
σ(k
si)
Distance Along Bridge (ft.)
TOTAL STRESS 3 DAYS
fctm (3days)
TOTAL STRESS 27 DAYS
fctm (27 days)
fctm (27 days)
fctm (3 days)

51
assuming all bridge girders are straight while still using the same centerline span length as the
actual ARDOT Bridge #07364.
Total stresses for the straight and curved girder bridges at 3 days are shown in Figure 44.
Figure 44 compares the stresses along the bridge centerline for both the straight and curved
bridge models in addition to stresses taken along the slab width edges near fascia girders G1 and
G7. The stresses along the bridge centerline for the two bridge types, shown in blue and purple,
are very similar. Therefore, bridge curvature does not significantly affect total stresses along the
bridge centerline. However, stresses along the slab width edges are significantly different than
the bridge centerline stresses due to the curvature of the bridge. At the bridge piers, there is a 15-
20% stress increase along the slab edges near girders G1 and G7. In contrast, within the straight
bridge cross-section stresses are constant. Consequently, this stress increase in total 3 day stress

52
will increase the potential for early age bridge deck cracking along the outermost girders.
Figure 44. Curvature effects on Bridge #07364
7.5 Field Results Comparisons
Field results are next compared to the numerical model results. Field results from Ortiz
(2019) are compared with results generated using numerical modeling. The field results were
recorded using VWSG 4200 sensors. Sensor locations within the bridge deck are shown in
Figure 28. Sensors 3, 12, 18, 28 and 31 approximately lie along the bridge centerline. Field
stresses recorded at 1 day are shown in Figure 45 graphed at the approximated sensor locations.
The blue continuous line represents numerical results from the ABAQUS model using the same
results shown in Figure 39. Only stresses due to the dead load are shown on the graph. Thermal
shrinkage stresses are omitted since these stresses develop at a later concrete age. It can be
0
0.1
0.2
0.3
0.4
0.5
0.6
0.7
0 20 40 60 80 100 120 140 160 180 200
σ(k
si)
Distance Along The Bridge (Ft.)
Straight Bridge
Curved G1
Curved G7
Curved Middle
fctm ( 3 Days)

53
concluded that the numerical results approximate the field results at these limited locations,
which do not include the area directly above the piers. Figure 46 shows a comparison of the
predicted stresses from the numerical analysis and the measured stress values at the field sensor
locations. A comparison between the numerical and recorded results shows similar behavior at
sensor locations within the positive moment regions. However, in the negative moment regions
results between the numerical analysis and measured contrast.
Figure 45. Field Data Validation Results
-0.08
-0.06
-0.04
-0.02
0
0.02
0.04
0.06
0.08
0.1
0.12
0 20 40 60 80 100 120 140 160 180 200
σ (
ksi)
Distance Along Bridge (ft.)
ABAQUS Dead Load Results Field Data
Sensor Sensor 12
Sensor 18Sensor 28
Sensor 31

54
Figure 46. Field Data Comparison with Predicted Values
Field, -0.048
Field, -0.035
Field, -0.02
Field, -0.01
Field, -0.043
ABAQUS, -0.01805
ABAQUS, 0.055
ABAQUS, -0.015
ABAQUS, 0.024
ABAQUS, -0.04
-0.06
-0.04
-0.02
0
0.02
0.04
0.06
0.08
Sensor 3 Sensor 12 Sensor 18 Sensor 28 Sensor 31
σ (
ksi)
Field
ABAQUS

55
CHAPTER VIII
CONCLUSIONS AND RECOMMENDATIONS
8.1 Conclusions and Recommendations
The numerical modeling techniques and subroutine equations used in this thesis were
validated for examining early age bridge deck cracking. ARDOT Bridge #07364 was modeled to
investigate concrete deck stresses developed when using a continuous deck pour construction
process. Contractors use a continuous deck pour process to reduce construction time compared to
the conventional sequence deck pour. Slab loads and construction equipment loads were
estimated. Concrete stresses were determined considering field generated concrete material
properties and calculated material properties. Total stresses including dead load and thermal
stresses were compared with the concrete tensile strength as a function of time.
Concrete tensile stresses develop during the continuous bridge deck pouring process. In
addition to dead load stresses, thermal shrinkage occurs during concrete’s early age. Concrete
thermal shrinkage is restricted by shear studs and concrete reinforcement steel. Restricting
concrete contraction during thermal shrinkage causes large tensile stresses to develop. Thermal
stresses develop at an early concrete age at a time when the concrete tensile strength is minimal.
Consequently, early age bridge deck cracking should consider retarding concrete thermal
shrinkage or accelerating the rate that concrete tensile strength develops. Time delaying thermal
shrinkage will allow the concrete to gain more tensile strength before thermal shrinkage stresses
are induced. Delaying thermal stresses from developing to 3 days or more would prevent total
stresses from exceeding the concrete tensile strength. Beyond 3 days, thermal stresses decrease
due to concrete creep. In other words, limit the stresses developed due to thermal shrinkage.

56
An alternative mitigation approach is to accelerate the early age concrete tensile strength.
However, increasing the concrete elastic modulus has the consequence of increasing thermal
stress.
Bridge curvature induces additional stresses near the bridge fascia girders. The additional
stresses are estimated to be 15-20% higher than that experienced along the bridge centerline.
57
CHAPTER IX
REFERENCES
Arkansas State Highway and Transporation Department Standard Specifications for
Highway Construction [Report]. - Little Rock, AR: AHTD, 2014.
Bazant Z. P. and Oh B. H. Deformation of progressively cracking [Journal] // ACI Journal. -
1984. - pp. 268-278.
CEN. European Committee for Standardization Eurocode 2: Design of concrete structures—
Part 1-1: General rules for buildings. [Book Section]. - Brussels : [s.n.], 1992.
Dan Su, Hani Nassif and Xia. and Ye Optimization of Deck Construction Staging for
[Journal] // J. Perform. Constr. Facil.. - 2018. - pp. 04017124-1-04017124-11.
Dezi Luigino Construction sequence modelling of continuous steel-concrete composite bridge
decks [Journal] // Steel and Composite Structures. - 2006. - pp. 123-138.
Dezi Luigino Shrinkage Effects in Composite Beams with Flexible Connection [Journal] //
Journal of Construction Steel Research. - 1994. - pp. 295-320.
Gara Fabrizio, Leoni Graziano and Dezi Luigino Slab Cracking Control in Continuous Steel-
Concrete [Journal] // JOURNAL OF BRIDGE ENGINEERING. - 2013.
Khan Inamullah, Castel Arnaud and Gilbert Raymond Ian Tensile creep and early-age
concrete cracking due to restrained Shrinkage [Journal] // Construction and Building Materials. -
2017. - pp. 705–715.
M Ala Saadeghvaziri Rambod Hadidi Cause and Control of Transverse Cracking in Concrete
Bridge Decks [Report] / New Jersey Department of Transportation. - 2002.
Nassif Hani [et al.] Bridge Deck Cracking and Composite Action Analyses [Report] / New
Jersey Department of Transportation Bureau of Research and U. S. Department of Transporation
Federal Highway Administration. - Wayne : [s.n.], 2010.
Nassif Hani, Xia Ye and Su Dan Early-Age Cracking in High Performance Concrete Decks of a
Curved Steel Girder Bridge [Journal] // Journal of Aerospace Engineering. - 2017. - pp.
B4016003-1 - B4016003-8.
Ortiz Fernando R. Benitez Study of Internal Strains Developed in Concrete Decks [Report]. -
Fayetteville: University of Arkansas, 2019.
Saadeghvaziri M. Ala and Hadidi Rambod Transverse Cracking of Concrete Bridge Decks:
[Journal] // JOURNAL OF BRIDGE ENGINEERING. - 2005.
58
Virginia Department of Transportation Road and Bridge Specifications [Report]. - Richmond,
VA: Virginia Department of Transportation, 2016.
Weiss W. J., Yang W. and Shah S.P. Factors Influencing Durability and Early-Age Cracking in
High-Strength Concrete Structures [Journal] // American Concrete Institute. - 2000. - pp. 387-
410.
Whisenhunt Todd Walter Measurement and Finite Element Model of The Noncomposite
[Report]. - Raleigh: North Carolina State University, 2004.
Yaohua Deng Brent Phares, Dale Harrington Causes of Early Cracking in Concrete
[Journal] // CP Road Map. - 2016.

59
CHAPTER X
APPENDIX
Appendix A. UMAT and DLOAD Subroutine

60

61

62

63

64

65

66