Numerical Study of Group Efiects for Large Pile Groups in …
34
INTERNATIONAL JOURNAL FOR NUMERICAL AND ANALYTICAL METHODS IN GEOMECHANICS Int. J. Numer. Anal. Meth. Geomech. 2001; 01:1–6 Prepared using nagauth.cls [Version: 2000/03/22 v1.0] Numerical Study of Group Effects for Large Pile Groups in Sands Zhaohui Yang and Boris Jeremi´ c * Department of Civil and Environmental Engineering, University of California, Davis, CA 95616 * Correspondence to: Boris Jeremi´ c, Department of Civil and Environmental Engineering, University of California, One Shields Ave., Davis, CA 95616, [email protected] Contract/grant sponsor: NSF; contract/grant number: EEC-9701568 Copyright c 2001 John Wiley & Sons, Ltd.
Transcript of Numerical Study of Group Efiects for Large Pile Groups in …

INTERNATIONAL JOURNAL FOR NUMERICAL AND ANALYTICAL METHODS IN GEOMECHANICS
Int. J. Numer. Anal. Meth. Geomech. 2001; 01:1–6 Prepared using nagauth.cls [Version: 2000/03/22 v1.0]
Numerical Study of Group Effects for Large Pile Groups in Sands
Zhaohui Yang and Boris Jeremic∗
Department of Civil and Environmental Engineering, University of California,
Davis, CA 95616
∗Correspondence to: Boris Jeremic, Department of Civil and Environmental Engineering, University of
California, One Shields Ave., Davis, CA 95616, [email protected]
Contract/grant sponsor: NSF; contract/grant number: EEC-9701568
Copyright c© 2001 John Wiley & Sons, Ltd.

2 ZHAOHUI YANG AND BORIS JEREMIC
SUMMARY
Our recent development of the template elastic–plastic driver and solid elements within the OpenSees
finite element framework were used to simulate the response of 3× 3 and 4× 3 pile groups founded in
loose and medium dense sands. Several numerical static pushover tests were conducted to investigate
the interaction effects for large pile groups. The results were then compared with those from centrifuge
study. It is shown that our simulations can predict the behavior of large pile groups with good accuracy.
Special attention was given to the three dimensional distribution of bending moment. It was found
that bending moment develops in both the loading plane and the plane perpendicular to the loading
direction. In addition, bending moment data from simulations was used to derive numerical p − y
curves for individual piles, with the purpose of illustrating different behavior of individual piles in the
same group.
Copyright c© 2001 John Wiley & Sons, Ltd.
key words: Pile Group, Three Dimensional FEM, Load Distribution
1. INTRODUCTION
The static behavior of single pile foundations have been successfully modeled by the p − y
approach (Reese et al. [13] ). Simulation of pile groups, on the other hand, has not been
so successful. The behavior of piles within a group varies depending on the position due to
the interaction between the neighboring piles. A number of numerical simulations have been
conducted to study the behaviors of pile groups. Only a couple of field tests, however, has
been carried out because of the large costs incurred. Brown et al. [1] conducted cyclic loading
tests on instrumented 3× 3 steel pile group. The p-multiplier concept was presented based on
Copyright c© 2001 John Wiley & Sons, Ltd. Int. J. Numer. Anal. Meth. Geomech. 2001; 01:1–6
Prepared using nagauth.cls

NUMERICAL STUDY OF THE GROUP EFFECTS OF LARGE PILE GROUPS IN SANDS 3
the measured soil resistance data and specific p-multipliers were suggested for the three rows.
Ruesta and Townsend [15] reported an in-situ test on piles at Roosevelt Bridge and Rollins et
al. [14] tested another full-scale pile group founded in clay and suggested a set of p-multipliers
for corresponding pile groups. A number of centrifuge tests were conducted to predict the
behaviors of pile groups. Recently, McVay et al. [8] [9] conducted a serious of lateral load tests
on large pile groups (3× 3 to 7× 3) founded in sands to study the interaction effects within a
group.
Together with the physical modeling, a few numerical simulations has also been performed.
We mention a few representative finite element studies of pile groups. Maqtadir and Desai [10]
studied the behavior of a pile-group using a three dimensional program with nonlinear elastic
soil model. An axisymmetric model with elastic-perfectly plastic soil was used by Pressley and
Poulos [12] to study group effects. Brown and Shie [3] [2] [4] and Trochanis [16] conducted
a series of 3D Finite Element Method (FEM) studies on the behavior of single pile and pile
group with elastic-plastic soil model. In particular, interface element was used to account for
pile-soil separation and slippage. Moreover, several model and field tests of free- or fixed-head
pile groups have been analyzed by Kimura et al. [6] and Wakai et al. [17] using 3D elasto-plastic
FEM.
It is noted that there is little literature reporting on FEM studies of large pile groups under
lateral loading. This paper describes 3D elastic-plastic finite element modeling of two large
pile groups founded in sand. The emphasis is on the interaction effects within large pile group
and comparison of FEM results with centrifuge test data. Special attention was given to out-
of-loading-plane bending moment and comparison of p − y behavior for individual piles. The
OpenSees [11] finite element framework was employed to complete all the computations. Soil
Copyright c© 2001 John Wiley & Sons, Ltd. Int. J. Numer. Anal. Meth. Geomech. 2001; 01:1–6
Prepared using nagauth.cls

4 ZHAOHUI YANG AND BORIS JEREMIC
modeling was performed using Template Elastic–Plastic approach (Jeremic and Yang [5]).
The paper is organized as follows. Section 2 describes finite element models including soil
elastic–plastic model used for 3 × 3 and 4 × 3 pile group simulations. Section 3 presents a
number of results and discussion describing simulated behavior of analyzed pile groups. In
particular, presented are developed plastic zones (Section 3.1), pile bending moments (Section
3.2), pile load distributions (Section 3.3), comparison of numerically generated p − y curves
for individual piles (Section 3.4), and comparison with centrifuge tests (Section 3.5). Section
4 gives concluding remarks.
2. PILE MODELS
Two centrifuge tests on pile groups (McVay et al. [9]) were simulated by 3D FEM to investigate
pile group effects. All piles are made of aluminum and the pile caps are rigidly connected with
the piles. The typical layout of 4×3 pile group is shown in Fig. 1. All the piles are spaced by 3D
(3 Diameters) and the whole model has a dimension (prototype scale) of 11.4m (width), 20.6m
(length) and 13.7m (depth). Only half of each model is meshed using symmetry considerations.
Figures 2 and 3 show the finite element mesh for the 3× 3 and 4× 3 pile groups, respectively.
Soil, pile and interface are all modeled with twenty node brick elements. Each pile consists
of four elements (per cross section) made of elastic material with properties corresponding to
aluminum. There are 1268 and 1414 brick elements in the two models respectively. The sides
and bottom of the model are fixed with the exception of the symmetric boundary, which is
only supported in direction perpendicular to the symmetry plane. The interface layer between
aluminum pile and surrounding soil is represented by one thin layer of elements. The purpose
of this layer is to mimic the installation effects on piles (drilled or driven). It also serves
Copyright c© 2001 John Wiley & Sons, Ltd. Int. J. Numer. Anal. Meth. Geomech. 2001; 01:1–6
Prepared using nagauth.cls

NUMERICAL STUDY OF THE GROUP EFFECTS OF LARGE PILE GROUPS IN SANDS 5
a purpose of a simplified interface which allows for tension cut-off (gaping) and controlled,
coupled horizontal and vertical stiffness.
a)
3D
3D
D=0.429 m
Side Piles
Middle Piles
Side Piles
b)2.
3 m
10.9
m
Tra
il R
ow
3rd
Row
2nd
Row
Lea
d R
ow
Sand
LateralLoad
Figure 1. Layout of 4 × 3 pile group: a) top view, b) side view.
The model for the soil was simple elastic perfectly plastic, non–associated model resembling
Drucker–Prager. The reason for using such simple models is that the centrifuge study we used
to compare our simulations against did specify only a friction angle of sand.
In particular we use friction angle of φ = 37.1o, shear modulus at a depth of 13.7 m of
8.96 MN/m2, Poisson’s ratio of 0.35 and unit weight of 14.50 kN/m3 for sand. In addition,
the plastic volumetric deformations were very small, so the the plastic potential function was
almost flat in the p′ − q space. These parameters are given by Zhang et al. [7].
Copyright c© 2001 John Wiley & Sons, Ltd. Int. J. Numer. Anal. Meth. Geomech. 2001; 01:1–6
Prepared using nagauth.cls

6 ZHAOHUI YANG AND BORIS JEREMIC
Figure 2. Finite element mesh for half of 3 × 3 pile group.
Figure 3. Finite element mesh for half of 4 × 3 pile group.
Copyright c© 2001 John Wiley & Sons, Ltd. Int. J. Numer. Anal. Meth. Geomech. 2001; 01:1–6
Prepared using nagauth.cls

NUMERICAL STUDY OF THE GROUP EFFECTS OF LARGE PILE GROUPS IN SANDS 7
3. SIMULATION RESULTS
In this section we present results related to the behavior of 3×3 and 4×4 pile groups in medium
dense sand. Results are also compared with those from the centrifuge studies by McVay et al.
[9] and Zhang et al. [7].
3.1. Plastic Zone
The static pushover test were conducted using load control at pile head with the loading
applied in X direction. The final plastic zones (represented by plastified Gauss points) for two
pile groups are depicted in Figures 4 and 5. In particular, Figure 4 shows different views of
the 3D plastic zone developed in the 3× 3 pile group at the lateral load of 2,200 kN. Figure 5
shows the different views of the 3D plastic zone developed in the 4×3 pile group at the lateral
load of 2,970 kN. Both figures clearly show a wedge shaped plastic zone at the shallow depth.
More specifically one can see the active wedge on the left hand side and the passive wedge on
the right hand side from the side views, and the outlines of the active and passive wedges are
approximately perpendicular to each other.
Also apparent is the propagation of the plastic zone (shear yielding) along pile–soil interface,
resulting from the rocking behavior of the group.
Copyright c© 2001 John Wiley & Sons, Ltd. Int. J. Numer. Anal. Meth. Geomech. 2001; 01:1–6
Prepared using nagauth.cls

8 ZHAOHUI YANG AND BORIS JEREMIC
a) b)
Figure 4. Plastic Gauss–Points for the 3 × 3 pile group: (a) 3D view and (b) side view.
a) b)
Figure 5. Plastic Gauss–Points for the 4 × 3 pile group: (a) 3D view and (b) side view.
Copyright c© 2001 John Wiley & Sons, Ltd. Int. J. Numer. Anal. Meth. Geomech. 2001; 01:1–6
Prepared using nagauth.cls
NUMERICAL STUDY OF THE GROUP EFFECTS OF LARGE PILE GROUPS IN SANDS 9
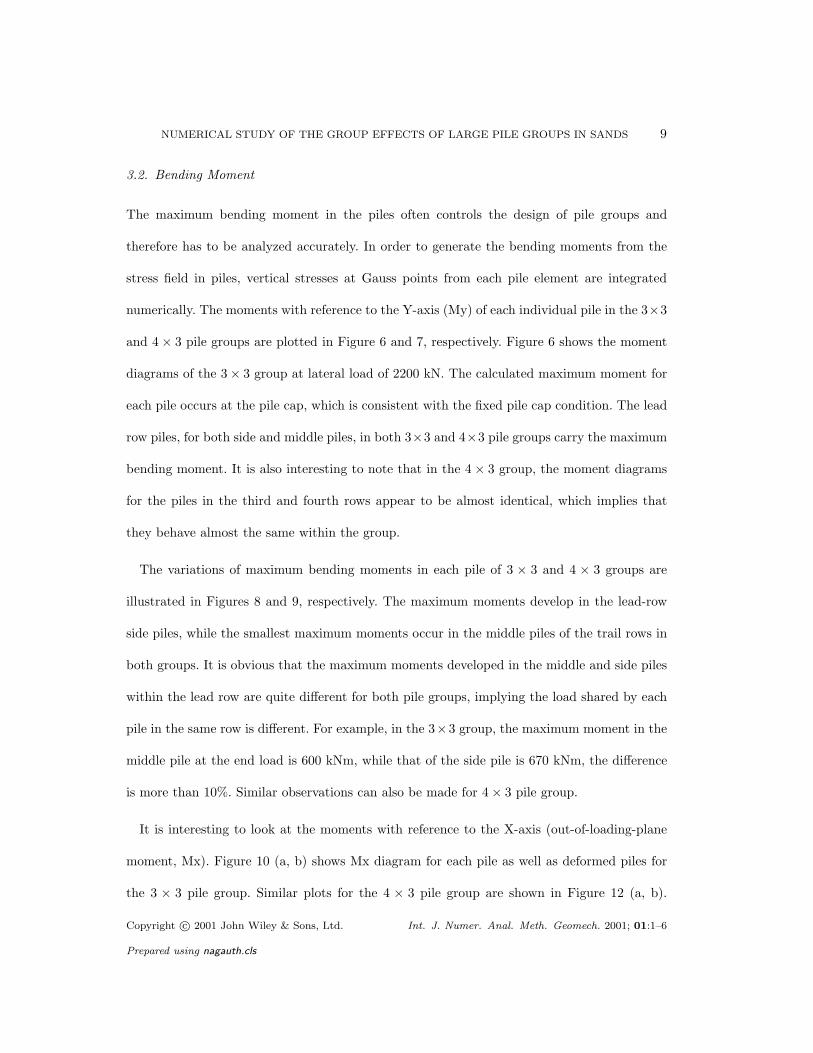
3.2. Bending Moment
The maximum bending moment in the piles often controls the design of pile groups and
therefore has to be analyzed accurately. In order to generate the bending moments from the
stress field in piles, vertical stresses at Gauss points from each pile element are integrated
numerically. The moments with reference to the Y-axis (My) of each individual pile in the 3×3
and 4 × 3 pile groups are plotted in Figure 6 and 7, respectively. Figure 6 shows the moment
diagrams of the 3 × 3 group at lateral load of 2200 kN. The calculated maximum moment for
each pile occurs at the pile cap, which is consistent with the fixed pile cap condition. The lead
row piles, for both side and middle piles, in both 3×3 and 4×3 pile groups carry the maximum
bending moment. It is also interesting to note that in the 4 × 3 group, the moment diagrams
for the piles in the third and fourth rows appear to be almost identical, which implies that
they behave almost the same within the group.
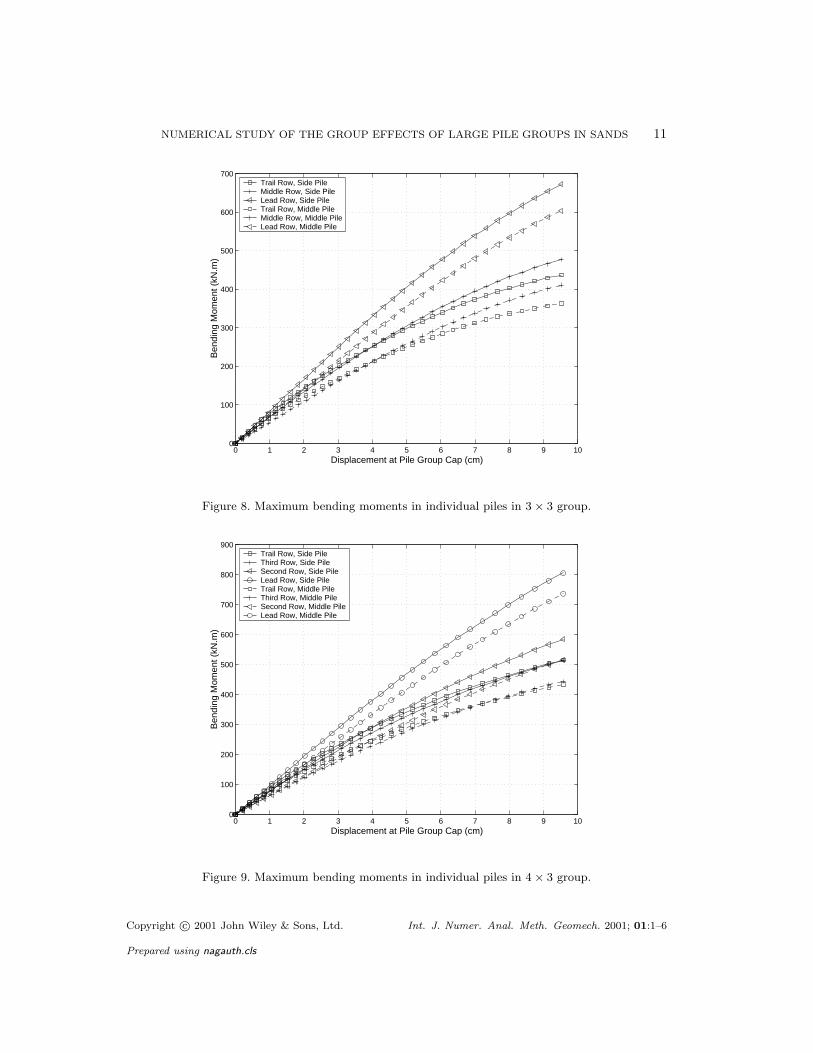
The variations of maximum bending moments in each pile of 3 × 3 and 4 × 3 groups are
illustrated in Figures 8 and 9, respectively. The maximum moments develop in the lead-row
side piles, while the smallest maximum moments occur in the middle piles of the trail rows in
both groups. It is obvious that the maximum moments developed in the middle and side piles
within the lead row are quite different for both pile groups, implying the load shared by each
pile in the same row is different. For example, in the 3×3 group, the maximum moment in the
middle pile at the end load is 600 kNm, while that of the side pile is 670 kNm, the difference
is more than 10%. Similar observations can also be made for 4 × 3 pile group.
It is interesting to look at the moments with reference to the X-axis (out-of-loading-plane
moment, Mx). Figure 10 (a, b) shows Mx diagram for each pile as well as deformed piles for
the 3 × 3 pile group. Similar plots for the 4 × 3 pile group are shown in Figure 12 (a, b).
Copyright c© 2001 John Wiley & Sons, Ltd. Int. J. Numer. Anal. Meth. Geomech. 2001; 01:1–6
Prepared using nagauth.cls

10 ZHAOHUI YANG AND BORIS JEREMIC
−1000 −500 0 500−10
−8
−6
−4
−2
0
2
Ground Level
Q = 2200 kN
My (kN.m)
Dep
th (
m)
Side Pile − Trail RowSide Pile − Middle RowSide Pile − Lead Row
−1000 −500 0 500−10
−8
−6
−4
−2
0
2
Ground Level
Q = 2200 kN
My (kN.m)
Middle Pile − Trail RowMiddle Pile − Middle RowMiddle Pile − Lead Row
Figure 6. Comparison of bending moment diagram at lateral load of 2200 kN for piles in 3× 3 group.
−1000 −500 0 500−10
−8
−6
−4
−2
0
2
Ground Level
Q = 2970 kN
My (kN.m)
Dep
th (
m)
Side Pile − Trail RowSide Pile − Second RowSide Pile − Third RowSide Pile − Lead Row
−1000 −500 0 500−10
−8
−6
−4
−2
0
2
Ground Level
Q = 2970 kN
My (kN.m)
Middle Pile − Trail RowMiddle Pile − Second RowMiddle Pile − Third RowMiddle Pile − Lead Row
Figure 7. Comparison of bending moment diagram at lateral load of 2970 kN for piles in 4× 3 group.
Copyright c© 2001 John Wiley & Sons, Ltd. Int. J. Numer. Anal. Meth. Geomech. 2001; 01:1–6
Prepared using nagauth.cls
NUMERICAL STUDY OF THE GROUP EFFECTS OF LARGE PILE GROUPS IN SANDS 11
0 1 2 3 4 5 6 7 8 9 100
100
200
300
400
500
600
700
Ben
ding
Mom
ent (
kN.m
)
Displacement at Pile Group Cap (cm)
Trail Row, Side PileMiddle Row, Side PileLead Row, Side PileTrail Row, Middle PileMiddle Row, Middle PileLead Row, Middle Pile
Figure 8. Maximum bending moments in individual piles in 3 × 3 group.
0 1 2 3 4 5 6 7 8 9 100
100
200
300
400
500
600
700
800
900
Ben
ding
Mom
ent (
kN.m
)
Displacement at Pile Group Cap (cm)
Trail Row, Side PileThird Row, Side PileSecond Row, Side PileLead Row, Side PileTrail Row, Middle PileThird Row, Middle PileSecond Row, Middle PileLead Row, Middle Pile
Figure 9. Maximum bending moments in individual piles in 4 × 3 group.
Copyright c© 2001 John Wiley & Sons, Ltd. Int. J. Numer. Anal. Meth. Geomech. 2001; 01:1–6
Prepared using nagauth.cls

12 ZHAOHUI YANG AND BORIS JEREMIC
The maximum moment Mx in the 3 × 3 pile group reaches 50 kN.m, which is about 10% of
the maximum moment My. It is also interesting to note that the signs of the moments in the
lead and trail rows are different, indicating the bending directions are opposite to each other.
This is further verified by looking at the deformed shape of the pile group shown in Figure
10(b) with only the displacement in Y direction shown. This kind of bending is caused by the
the complex displacement field of the soil surrounding the pile group, as illustrated by the
horizontal displacement vector and contour plots of displacement in X direction in Figures 11
and 13 for 3 × 3 and 4 × 3 pile groups, respectively. The soil in front of the lead row tends to
“squeeze into” the group, while the soil outside of the trail row tends to “come back” toward
pile group when the pile group is moving forward, which consequently results in the fact that
the lead row bends outward and the trail row bends inward.
Copyright c© 2001 John Wiley & Sons, Ltd. Int. J. Numer. Anal. Meth. Geomech. 2001; 01:1–6
Prepared using nagauth.cls

NUMERICAL STUDY OF THE GROUP EFFECTS OF LARGE PILE GROUPS IN SANDS 13
a)−50 0 50
−10
−8
−6
−4
−2
0
2
Ground LevelQ = 2200 kN
Mx (kN.m)
Dep
th (
m)
Side Pile − Trail RowSide Pile − Middle RowSide Pile − Lead Row
b)
Figure 10. (a) Out-of-loading-plane bending moment diagram and (a) Out-of-loading-plane
deformation for the 3 × 3 pile group.
Copyright c© 2001 John Wiley & Sons, Ltd. Int. J. Numer. Anal. Meth. Geomech. 2001; 01:1–6
Prepared using nagauth.cls

14 ZHAOHUI YANG AND BORIS JEREMIC
−5 −4 −3 −2 −1 0 1 2 3 4 5−1
−0.5
0
0.5
1
1.5
2
2.5
3
3.5
4
o −− Pile Centers Z = 0.0m Displacement (cm)
0.358 0.715
1.07
1.43
2.5 1.792.5
3.935.01
5.36
5.36
2.86
X (m)
Y (
m)
Figure 11. Horizontal displacement vector and contour of displacement in X direction at ground surface
for the 3 × 3 pile group.
Copyright c© 2001 John Wiley & Sons, Ltd. Int. J. Numer. Anal. Meth. Geomech. 2001; 01:1–6
Prepared using nagauth.cls

NUMERICAL STUDY OF THE GROUP EFFECTS OF LARGE PILE GROUPS IN SANDS 15
a)−50 0 50
−10
−8
−6
−4
−2
0
2
Ground Level
Q = 2970 kN
My (kN.m)
Dep
th (
m)
Side Pile − Trail RowSide Pile − Second RowSide Pile − Third RowSide Pile − Lead Row
b)
Figure 12. (a) Out-of-loading-plane bending moment diagram and (b) Out-of-loading-plane
deformation for the 4 × 3 pile group.
−5 −4 −3 −2 −1 0 1 2 3 4 5−1
−0.5
0
0.5
1
1.5
2
2.5
3
3.5
4
o −− Pile Centers Z = 0.0m Displacement (cm)
0.4710.942
1.41
2.35 4.246.12
7.06
7.064.71
2.35
6.59
X (m)
Y (
m)
Figure 13. Horizontal displacement vector and contour of displacement (cm) in X direction at ground
surface for 4 × 3 pile group.
Copyright c© 2001 John Wiley & Sons, Ltd. Int. J. Numer. Anal. Meth. Geomech. 2001; 01:1–6
Prepared using nagauth.cls

16 ZHAOHUI YANG AND BORIS JEREMIC
3.3. Load Distribution
In order to compute the load taken by each pile, the values of bending moment at element
centers along with the boundary condition at the bottom of pile (zero moment) were fitted with
a 5th order polynomial by least square technique. According to the Bernoulli beam theory, the
moment curve was differentiated once to compute the shear force. Then, the shear forces at
three sampling points between ground surface and pile cap were averaged to compute the load
carried by each individual pile. The accuracy of the load measuring scheme has been verified
by comparing the total load actually applied on the pile cap and the sum of all loads carried
by each individual pile. Figures 14 and 15 show the load and percentage of total load carried
by each row of the 3 × 3 group.
0 1 2 3 4 5 6 7 8 9 100
200
400
600
800
1000
1200
Late
ral L
oad
Dis
trib
utio
n in
Eac
h R
ow (
kN)
Displacement at Pile Group Cap (cm)
Trail RowMiddle RowLead Row
Figure 14. Variations of load taken by each row in the 3 × 3 group.
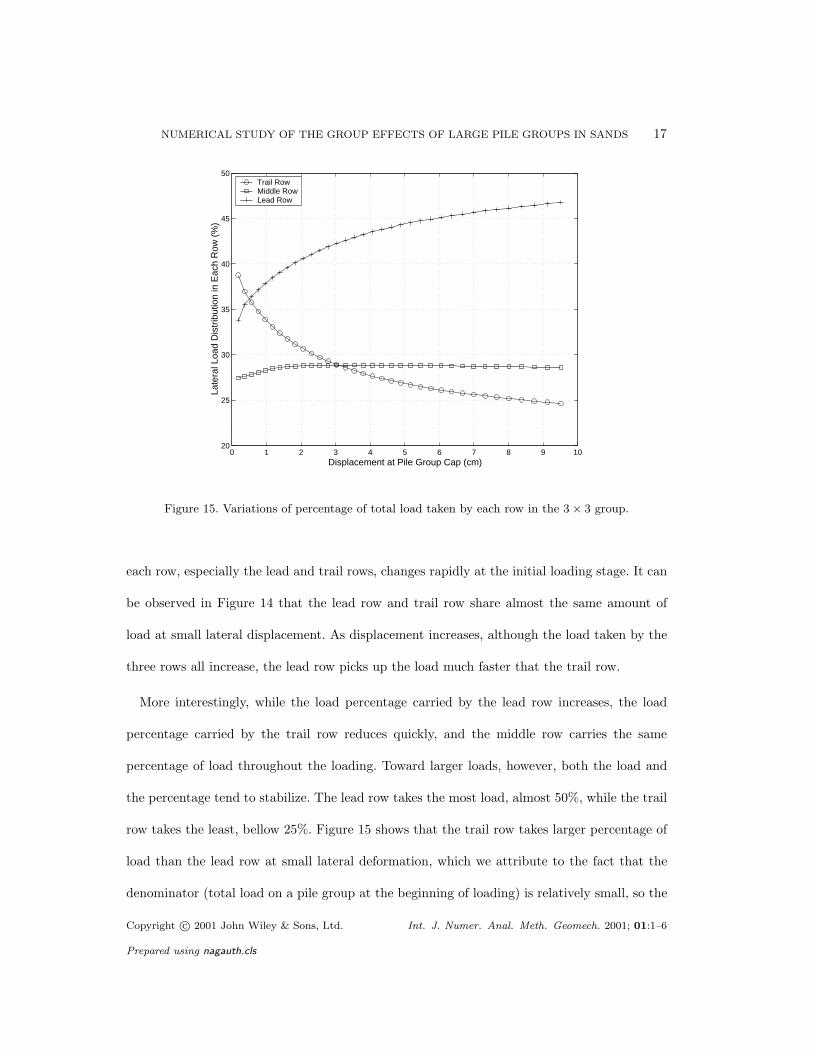
Figures 14 and 15 show that not only the load but the percentage of total load taken by
Copyright c© 2001 John Wiley & Sons, Ltd. Int. J. Numer. Anal. Meth. Geomech. 2001; 01:1–6
Prepared using nagauth.cls
NUMERICAL STUDY OF THE GROUP EFFECTS OF LARGE PILE GROUPS IN SANDS 17
0 1 2 3 4 5 6 7 8 9 1020
25
30
35
40
45
50
Late
ral L
oad
Dis
trib
utio
n in
Eac
h R
ow (
%)
Displacement at Pile Group Cap (cm)
Trail RowMiddle RowLead Row
Figure 15. Variations of percentage of total load taken by each row in the 3 × 3 group.
each row, especially the lead and trail rows, changes rapidly at the initial loading stage. It can
be observed in Figure 14 that the lead row and trail row share almost the same amount of
load at small lateral displacement. As displacement increases, although the load taken by the
three rows all increase, the lead row picks up the load much faster that the trail row.
More interestingly, while the load percentage carried by the lead row increases, the load
percentage carried by the trail row reduces quickly, and the middle row carries the same
percentage of load throughout the loading. Toward larger loads, however, both the load and
the percentage tend to stabilize. The lead row takes the most load, almost 50%, while the trail
row takes the least, bellow 25%. Figure 15 shows that the trail row takes larger percentage of
load than the lead row at small lateral deformation, which we attribute to the fact that the
denominator (total load on a pile group at the beginning of loading) is relatively small, so the
Copyright c© 2001 John Wiley & Sons, Ltd. Int. J. Numer. Anal. Meth. Geomech. 2001; 01:1–6
Prepared using nagauth.cls

18 ZHAOHUI YANG AND BORIS JEREMIC
relative measure is not very accurate at the very beginning of loading.
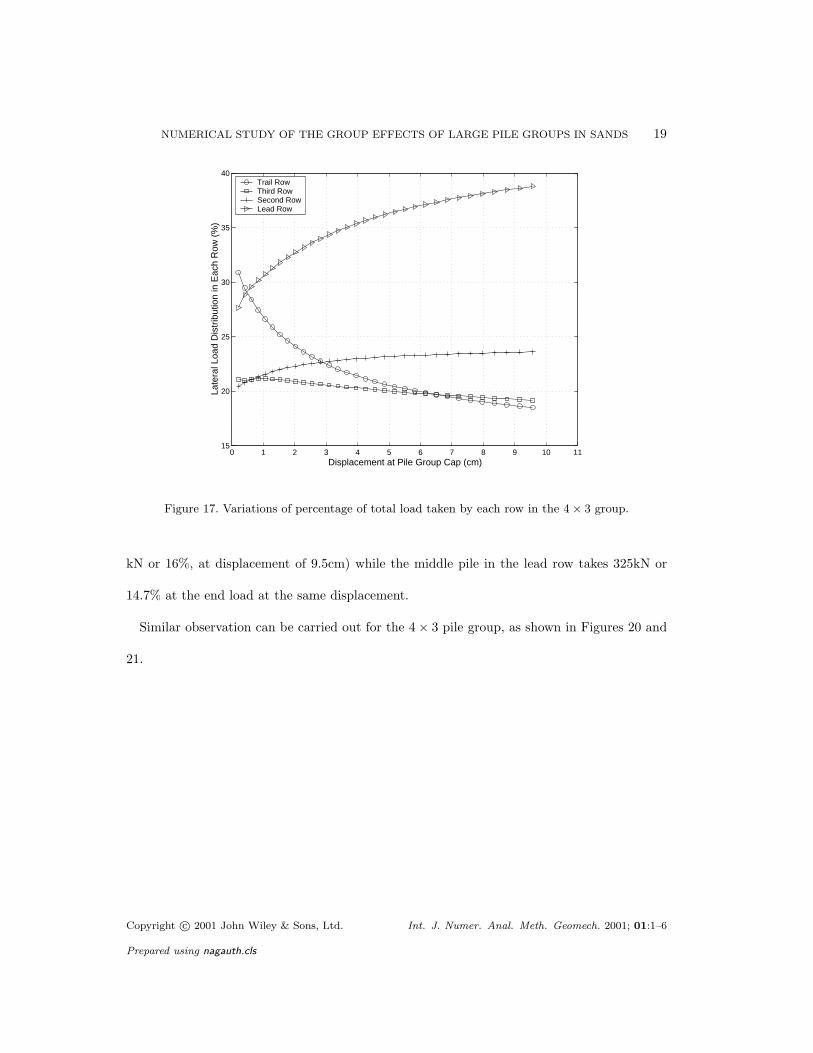
Similar plots for the 4 × 3 group are shown in Figures 16 and 17. While the lead row still
carries much more load that the trail row, the third row and the trail row share almost the
same load at large lateral displacement, which is in agreement with the fact that the same P
multipliers are recommended for the third and fourth row by McVay et al. [9]. It should also
be observed from Figures 16 and 17 that the lead row carries more than twice the load of the
trail row.
0 1 2 3 4 5 6 7 8 9 100
200
400
600
800
1000
1200
Late
ral L
oad
Dis
trib
utio
n in
Eac
h R
ow (
kN)
Displacement at Pile Group Cap (cm)
Trail RowThird RowSecond RowLead Row
Figure 16. Variations of load taken by each row in the 4 × 3 group.
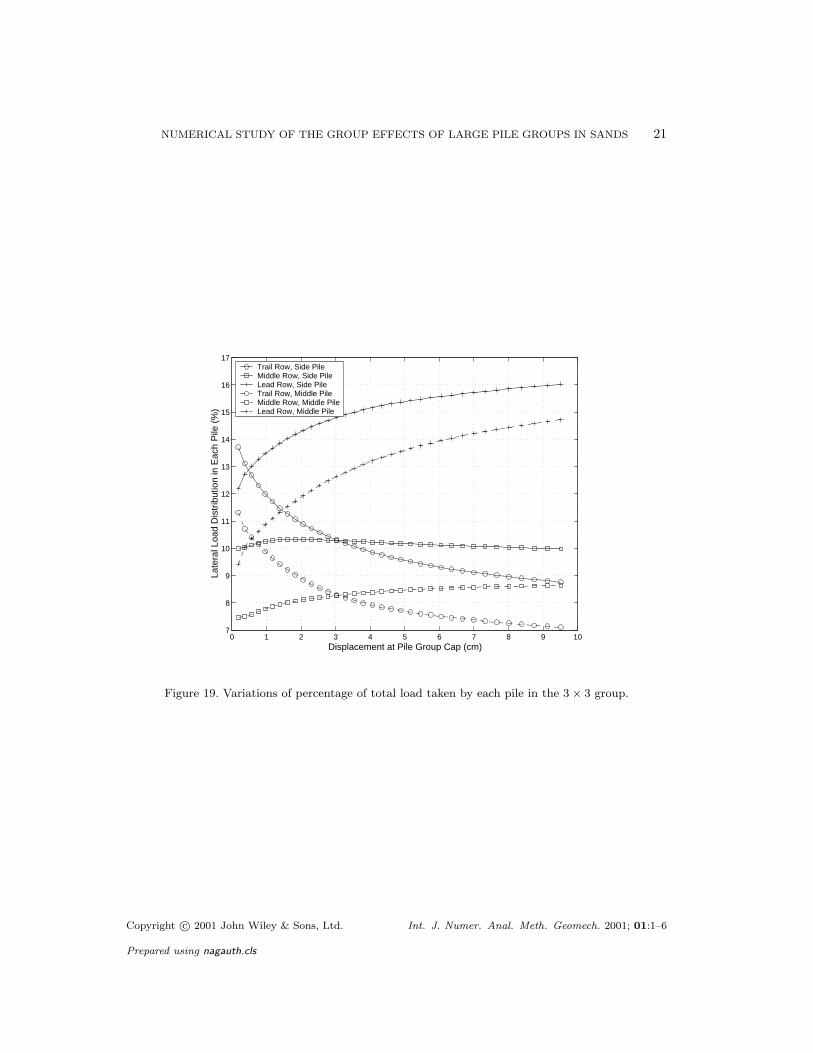
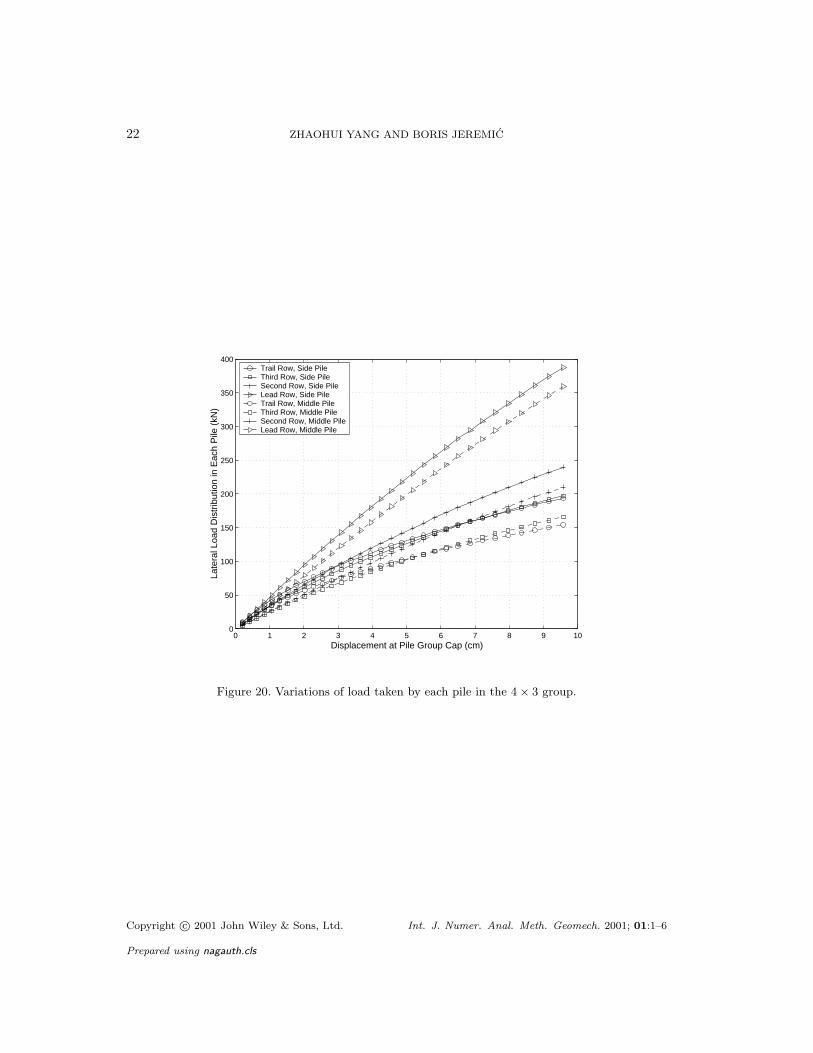
It is worthwhile noting that the distribution of load in the same row can be quite different.
Figures 18 and 19 show the variations of load and the percentage of total load taken by each
pile of the 3 × 3 group, respectively. It is obvious that the piles at the sides take more load
than the piles in the middle at the same row. For example, the side pile in lead row takes 350
Copyright c© 2001 John Wiley & Sons, Ltd. Int. J. Numer. Anal. Meth. Geomech. 2001; 01:1–6
Prepared using nagauth.cls
NUMERICAL STUDY OF THE GROUP EFFECTS OF LARGE PILE GROUPS IN SANDS 19
0 1 2 3 4 5 6 7 8 9 10 1115
20
25
30
35
40
Late
ral L
oad
Dis
trib
utio
n in
Eac
h R
ow (
%)
Displacement at Pile Group Cap (cm)
Trail RowThird RowSecond RowLead Row
Figure 17. Variations of percentage of total load taken by each row in the 4 × 3 group.
kN or 16%, at displacement of 9.5cm) while the middle pile in the lead row takes 325kN or
14.7% at the end load at the same displacement.
Similar observation can be carried out for the 4 × 3 pile group, as shown in Figures 20 and
21.
Copyright c© 2001 John Wiley & Sons, Ltd. Int. J. Numer. Anal. Meth. Geomech. 2001; 01:1–6
Prepared using nagauth.cls

20 ZHAOHUI YANG AND BORIS JEREMIC
0 1 2 3 4 5 6 7 8 9 100
50
100
150
200
250
300
350
400
Late
ral L
oad
Dis
trib
utio
n in
Eac
h P
ile (
kN)
Displacement at Pile Group Cap (cm)
Trail Row, Side PileMiddle Row, Side PileLead Row, Side PileTrail Row, Middle PileMiddle Row, Middle PileLead Row, Middle Pile
Figure 18. Variations of load taken by each pile in the 3 × 3 group.
Copyright c© 2001 John Wiley & Sons, Ltd. Int. J. Numer. Anal. Meth. Geomech. 2001; 01:1–6
Prepared using nagauth.cls
NUMERICAL STUDY OF THE GROUP EFFECTS OF LARGE PILE GROUPS IN SANDS 21
0 1 2 3 4 5 6 7 8 9 107
8
9
10
11
12
13
14
15
16
17
Late
ral L
oad
Dis
trib
utio
n in
Eac
h P
ile (
%)
Displacement at Pile Group Cap (cm)
Trail Row, Side PileMiddle Row, Side PileLead Row, Side PileTrail Row, Middle PileMiddle Row, Middle PileLead Row, Middle Pile
Figure 19. Variations of percentage of total load taken by each pile in the 3 × 3 group.
Copyright c© 2001 John Wiley & Sons, Ltd. Int. J. Numer. Anal. Meth. Geomech. 2001; 01:1–6
Prepared using nagauth.cls
22 ZHAOHUI YANG AND BORIS JEREMIC
0 1 2 3 4 5 6 7 8 9 100
50
100
150
200
250
300
350
400
Late
ral L
oad
Dis
trib
utio
n in
Eac
h P
ile (
kN)
Displacement at Pile Group Cap (cm)
Trail Row, Side PileThird Row, Side PileSecond Row, Side PileLead Row, Side PileTrail Row, Middle PileThird Row, Middle PileSecond Row, Middle PileLead Row, Middle Pile
Figure 20. Variations of load taken by each pile in the 4 × 3 group.
Copyright c© 2001 John Wiley & Sons, Ltd. Int. J. Numer. Anal. Meth. Geomech. 2001; 01:1–6
Prepared using nagauth.cls

NUMERICAL STUDY OF THE GROUP EFFECTS OF LARGE PILE GROUPS IN SANDS 23
0 1 2 3 4 5 6 7 8 9 10 115
6
7
8
9
10
11
12
13
14
15
Late
ral L
oad
Dis
trib
utio
n in
Eac
h P
ile (
%)
Displacement at Pile Group Cap (cm)
Trail Row, Side PileThird Row, Side PileSecond Row, Side PileLead Row, Side PileTrail Row, Middle PileThird Row, Middle PileSecond Row, Middle PileLead Row, Middle Pile
Figure 21. Variations of percentage of total load taken by each pile in the 4 × 3 group.
Copyright c© 2001 John Wiley & Sons, Ltd. Int. J. Numer. Anal. Meth. Geomech. 2001; 01:1–6
Prepared using nagauth.cls

24 ZHAOHUI YANG AND BORIS JEREMIC
3.4. p − y Curve
To further investigate the behavior of each pile, it would be worthwhile to examine the
numerically generated p − y curves of individual piles in the same group. The fitted moment
curve and the displacement from the FEM analysis were used to generate the p − y curves.
Pressure p was obtained by twice differentiation of the fitted moment curve and lateral
displacement y was obtained directly from finite element analysis. It should be noted that
while we use term pressure for p it really represents an integral of all resisting stresses around
the pile at given depth. Figures 22, 23, 24 and 25 show the numerically generated p− y curves
at various depths for all individual piles in the two groups. It is evident from plots for the
3× 3 group (Figures 18 and 19), that the piles in the lead row exhibit much larger resistances
than the piles in the middle and trail rows at large lateral displacement, which is due to the
well-known “shadowing effect” as analyzed in previous section. Cross comparison of the p− y
curves at different depths for same piles shows that the pressure increases as depth increases.
For example, at deflection of 4 cm, the pressure of the lead-row side pile is 120 kN/m at a
depth of -1.5 m, while it is only 90 kN/m at a depth of -0.6 m. This is due to the increase in
vertical stress and Young’s modulus as depth increases.
It can also be seen that the p−y curves for the piles within the trail row soften dramatically
after the initial loading stage, exhibiting quite different characteristics than other piles. It is
believed that this behavior is due to the plastification of soil in front of these piles. This point
can be verified by the fact that the softening behavior of the trail-row piles starts at larger
lateral displacement as the depth increases, since the plastic zone first develops at the ground
surface and then extends downward (see Figure 4 and 5). These observations also imply that
the p-multiplier approach (Brown et al. [1]) might not be appropriate since it obtains the p−y
Copyright c© 2001 John Wiley & Sons, Ltd. Int. J. Numer. Anal. Meth. Geomech. 2001; 01:1–6
Prepared using nagauth.cls
NUMERICAL STUDY OF THE GROUP EFFECTS OF LARGE PILE GROUPS IN SANDS 25
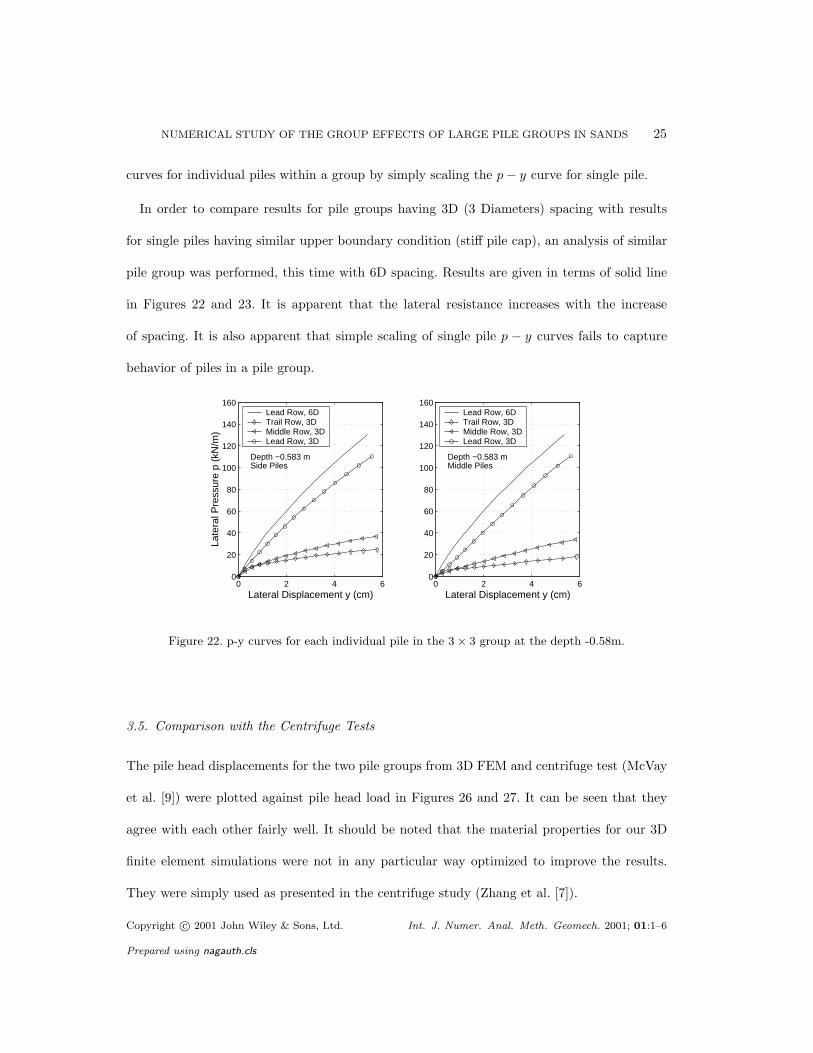
curves for individual piles within a group by simply scaling the p − y curve for single pile.
In order to compare results for pile groups having 3D (3 Diameters) spacing with results
for single piles having similar upper boundary condition (stiff pile cap), an analysis of similar
pile group was performed, this time with 6D spacing. Results are given in terms of solid line
in Figures 22 and 23. It is apparent that the lateral resistance increases with the increase
of spacing. It is also apparent that simple scaling of single pile p − y curves fails to capture
behavior of piles in a pile group.
0 2 4 60
20
40
60
80
100
120
140
160
Depth −0.583 mSide Piles
Lateral Displacement y (cm)
Late
ral P
ress
ure
p (k
N/m
)
Lead Row, 6D Trail Row, 3DMiddle Row, 3DLead Row, 3D
0 2 4 60
20
40
60
80
100
120
140
160
Depth −0.583 mMiddle Piles
Lateral Displacement y (cm)
Lead Row, 6DTrail Row, 3DMiddle Row, 3DLead Row, 3D
Figure 22. p-y curves for each individual pile in the 3 × 3 group at the depth -0.58m.
3.5. Comparison with the Centrifuge Tests
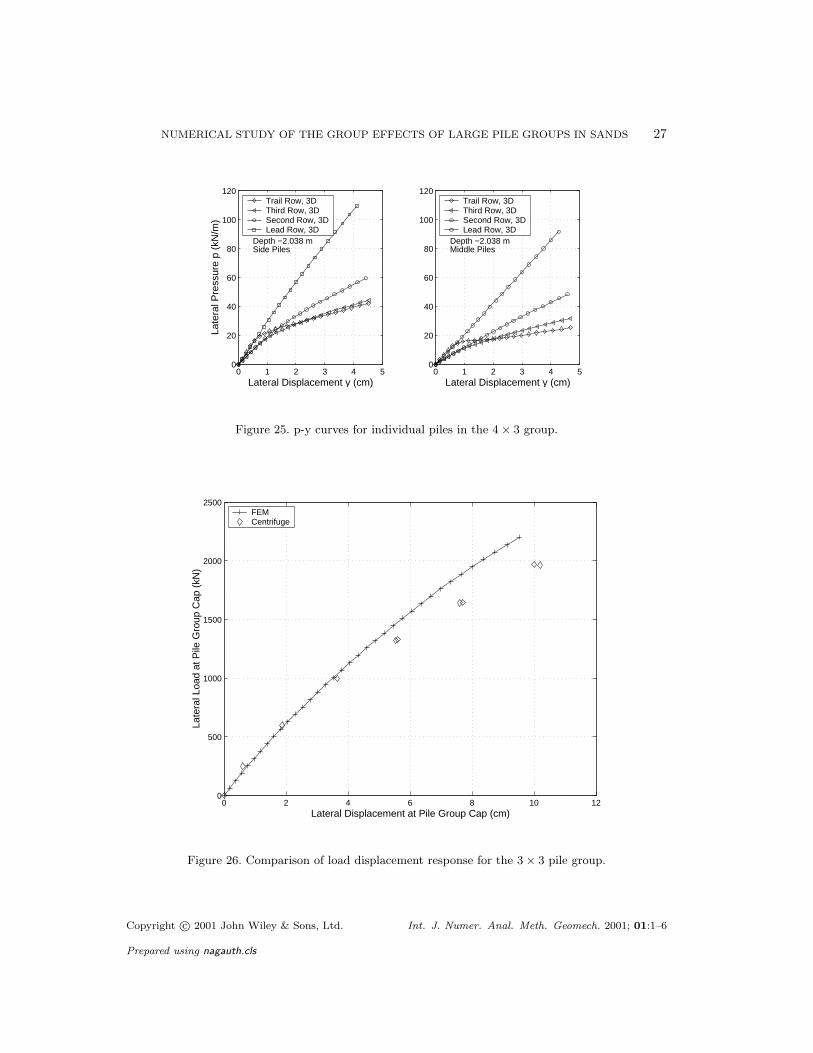
The pile head displacements for the two pile groups from 3D FEM and centrifuge test (McVay
et al. [9]) were plotted against pile head load in Figures 26 and 27. It can be seen that they
agree with each other fairly well. It should be noted that the material properties for our 3D
finite element simulations were not in any particular way optimized to improve the results.
They were simply used as presented in the centrifuge study (Zhang et al. [7]).
Copyright c© 2001 John Wiley & Sons, Ltd. Int. J. Numer. Anal. Meth. Geomech. 2001; 01:1–6
Prepared using nagauth.cls

26 ZHAOHUI YANG AND BORIS JEREMIC
0 1 2 3 4 50
20
40
60
80
100
120
140
160
180
200
Depth −1.538 mSide Piles
Lateral Displacement y (cm)
Late
ral P
ress
ure
p (k
N/m
)
Lead Row, 6D Trail Row, 3DMiddle Row, 3DLead Row, 3D
0 1 2 3 4 50
20
40
60
80
100
120
140
160
180
200
Depth −1.538 mMiddle Piles
Lateral Displacement y (cm)
Lead Row, 6DTrail Row, 3DMiddle Row, 3DLead Row, 3D
Figure 23. p-y curves for individual piles in the 3 × 3 group at the depth of -1.54m.
0 2 4 60
20
40
60
80
100
120
140
Depth −0.734 mSide Piles
Lateral Displacement y (cm)
Late
ral P
ress
ure
p (k
N/m
)
Trail Row, 3DThird Row, 3DSecond Row, 3DLead Row, 3D
0 2 4 60
20
40
60
80
100
120
140
Depth −0.734 mMiddle Piles
Lateral Displacement y (cm)
Trail Row, 3DThird Row, 3DSecond Row, 3DLead Row, 3D
Figure 24. p-y curves for individual piles in the 4 × 3 group.
The accuracy of finite element modeling can also be examined in terms of maximum bending
moments. The maximum moment developed in 4 × 3 group is compared with that from the
centrifuge study ( Zhang et al. [7] ) in Figure 28. The results from the centrifuge study are
slightly larger than that from FEM, which is partially due to the relatively simple elastic-plastic
soil model used.
Copyright c© 2001 John Wiley & Sons, Ltd. Int. J. Numer. Anal. Meth. Geomech. 2001; 01:1–6
Prepared using nagauth.cls
NUMERICAL STUDY OF THE GROUP EFFECTS OF LARGE PILE GROUPS IN SANDS 27
0 1 2 3 4 50
20
40
60
80
100
120
Depth −2.038 mSide Piles
Lateral Displacement y (cm)
Late
ral P
ress
ure
p (k
N/m
)Trail Row, 3DThird Row, 3DSecond Row, 3DLead Row, 3D
0 1 2 3 4 50
20
40
60
80
100
120
Depth −2.038 mMiddle Piles
Lateral Displacement y (cm)
Trail Row, 3DThird Row, 3DSecond Row, 3DLead Row, 3D
Figure 25. p-y curves for individual piles in the 4 × 3 group.
0 2 4 6 8 10 120
500
1000
1500
2000
2500
Late
ral L
oad
at P
ile G
roup
Cap
(kN
)
Lateral Displacement at Pile Group Cap (cm)
FEMCentrifuge
Figure 26. Comparison of load displacement response for the 3 × 3 pile group.
Copyright c© 2001 John Wiley & Sons, Ltd. Int. J. Numer. Anal. Meth. Geomech. 2001; 01:1–6
Prepared using nagauth.cls

28 ZHAOHUI YANG AND BORIS JEREMIC
0 1 2 3 4 5 6 7 8 9 100
500
1000
1500
2000
2500
3000
Late
ral L
oad
at P
ile G
roup
Cap
(kN
)
Lateral Displacement at Pile Group Cap (cm)
FEMCentrifuge
Figure 27. Comparison of load displacement response for the 4 × 3 pile group.
The percentage of total lateral load taken by each row at final loading stage for the 3 × 3
and 4 × 3 pile groups from 3D FEM and centrifuge test (McVay et al. [9]) were compared in
Figures 29 and 30. Results for both loose and medium dense sand cases are included. Figures
29 and 30 show that the density of sand does not have much effects on the load distribution.
It is evident that the load distributions to all rows as obtained from FEM and centrifuge tests
in all the cases for both pile groups agree very well (the differences are within 3%).
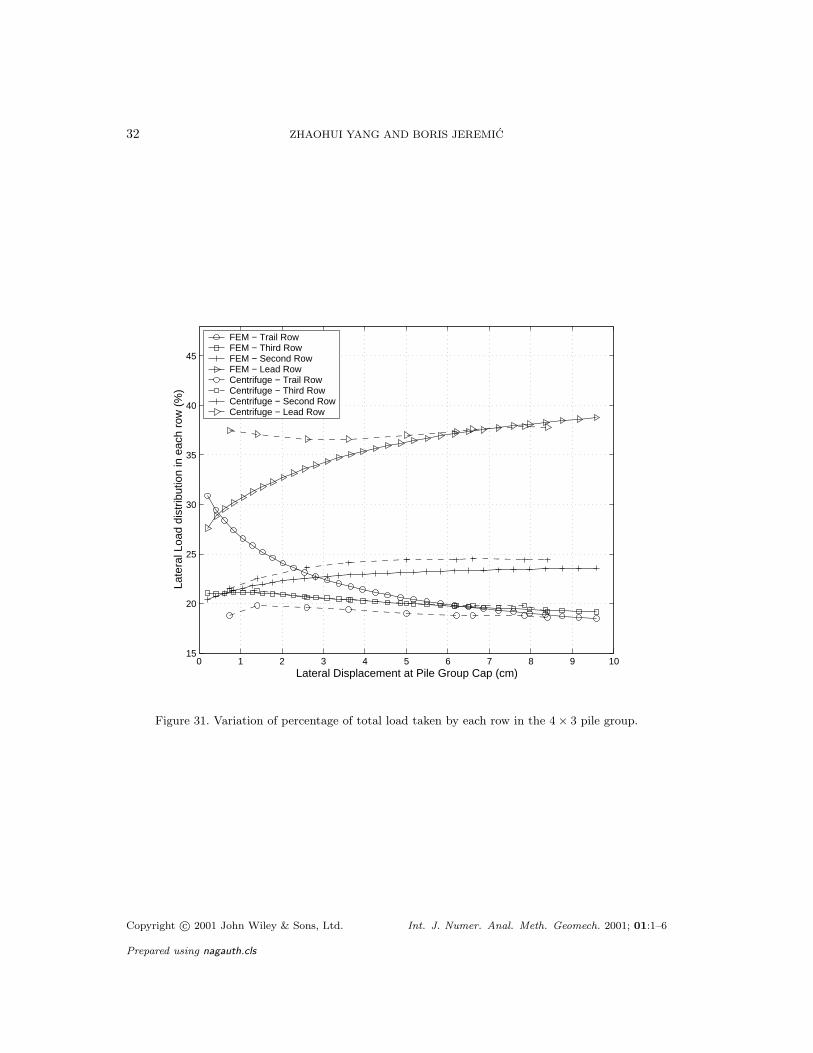
Finally, the variation of distribution of total load to each row as obtained from FEM and
centrifuge tests for the 4× 3 pile group is compared in Figure 31. At the initial loading stage,
the computed loads acting on the lead row and trail row were smaller than measured in the
centrifuge tests. At large deformation, however, the computed and measured loads in each row
Copyright c© 2001 John Wiley & Sons, Ltd. Int. J. Numer. Anal. Meth. Geomech. 2001; 01:1–6
Prepared using nagauth.cls

NUMERICAL STUDY OF THE GROUP EFFECTS OF LARGE PILE GROUPS IN SANDS 29
0 1 2 3 4 5 6 7 8 9 100
100
200
300
400
500
600
700
800
900
Ben
ding
Mom
ent (
kN.m
)
Displacement at Pile Group Cap (cm)
FEMCentrifuge Test
Figure 28. Comparison of maximum bending moment response for the 4 × 3 group.
compare very well.
Copyright c© 2001 John Wiley & Sons, Ltd. Int. J. Numer. Anal. Meth. Geomech. 2001; 01:1–6
Prepared using nagauth.cls

30 ZHAOHUI YANG AND BORIS JEREMIC
1 2 30
5
10
15
20
25
30
35
40
45
50
Pile Row (1 − Lead Row)
Per
cent
of L
ater
al L
oad
(%)
Centrifuge − Dense SandCentrifuge − Loose SandFEM − DenseFEM − Loose
Figure 29. Comparison of percentage of total lateral load taken by each row in the 3 × 3 group
Copyright c© 2001 John Wiley & Sons, Ltd. Int. J. Numer. Anal. Meth. Geomech. 2001; 01:1–6
Prepared using nagauth.cls

NUMERICAL STUDY OF THE GROUP EFFECTS OF LARGE PILE GROUPS IN SANDS 31
1 2 3 40
5
10
15
20
25
30
35
40
Pile Row (1 − Lead Row)
Per
cent
of L
ater
al L
oad
(%)
Centrifuge − Dense SandCentrifuge − Loose SandFEM − DenseFEM − Loose
Figure 30. Comparison of percentage of total lateral load taken by each row in the 4 × 3 group
Copyright c© 2001 John Wiley & Sons, Ltd. Int. J. Numer. Anal. Meth. Geomech. 2001; 01:1–6
Prepared using nagauth.cls
32 ZHAOHUI YANG AND BORIS JEREMIC
0 1 2 3 4 5 6 7 8 9 1015
20
25
30
35
40
45
Late
ral L
oad
dist
ribut
ion
in e
ach
row
(%
)
Lateral Displacement at Pile Group Cap (cm)
FEM − Trail RowFEM − Third RowFEM − Second RowFEM − Lead RowCentrifuge − Trail RowCentrifuge − Third RowCentrifuge − Second RowCentrifuge − Lead Row
Figure 31. Variation of percentage of total load taken by each row in the 4 × 3 pile group.
Copyright c© 2001 John Wiley & Sons, Ltd. Int. J. Numer. Anal. Meth. Geomech. 2001; 01:1–6
Prepared using nagauth.cls

NUMERICAL STUDY OF THE GROUP EFFECTS OF LARGE PILE GROUPS IN SANDS 33
4. CONCLUSIONS
In this paper we presented results from the finite element study on the interaction effects of
large pile groups founded in sands. Specifically the 3 × 3 and 4 × 3 pile groups were analyzed
in terms of plastic zone, bending moment and load distribution among individual piles. It was
found that not only the load taken by each row in the group is different, but that the load
shared by individual piles and maximum bending moment developed in individual piles within
the same row can vary quite a bit. It was also shown that the bending moment is developing
in the plane perpendicular to the loading direction. Comparison of results from FEM and
centrifuge study shows that elastic-plastic finite element analysis can predict the behavior of
large pile group with very good accuracy. The numerically generated p − y curves were used
to compare behavior of individual piles in pile group.
Acknowledgment
This work was supported primarily by the Earthquake Engineering Research Centers
Program of the National Science Foundation under Award Number EEC-9701568.
REFERENCES
1. Brown, D. A., Morrison, C., and Reese, L. C. Lateral loaded behavior of pile group in sand. Journal
of Geotechnical Engineering 114, 11 (November 1988), 1261–1277.
2. Brown, D. A., and Shie, C.-F. Numerical experiments into group effects on the response of piles to
lateral loading. Computers and Geotechnics 10 (1990), 211–230.
3. Brown, D. A., and Shie, C.-F. Three dimensional finite element model of laterally loaded piles.
Computers and Geotechnics 10 (1990), 59–79.
4. Brown, D. A., and Shie, C.-F. Some numerical experiments with a three dimensional finite element
model of a laterally loaded pile. Computers and Geotechnics 12 (1991), 149–162.
Copyright c© 2001 John Wiley & Sons, Ltd. Int. J. Numer. Anal. Meth. Geomech. 2001; 01:1–6
Prepared using nagauth.cls

34 ZHAOHUI YANG AND BORIS JEREMIC
5. Jeremic, B., and Yang, Z. Template elastic–plastic computations in geomechanics. International Journal
for Numerical and Analytical Methods in Geomechanics (November 2001). Accepted for publications,
available as CGM report at: http://sokocalo.engr.ucdavis.edu/~jeremic/publications/CGM0102.pdf.
6. Kimura, M., Adachi, T., Kamei, H., and Zhang, F. 3-D finite element analyses of the ultimate behavior
of laterally loaded cast-in-place concrete piles. In Proceedings of the Fifth International Symposium on
Numerical Models in Geomechanics, NUMOG V (September 1995), G. N. Pande and S. Pietruszczak,
Eds., A. A. Balkema, pp. 589–594.
7. Limin Zhang, M. M., and Lai, P. Numerical analysis of laterally loaded 3x3 to 7x3 pile groups in sands.
Journal of Geotechnical and Geoenvironmental Engineering 125, 11 (Nov. 1999), 936–946.
8. McVay, M., Casper, R., , and Shang, T.-I. Lateral response of three-row groups in loose to dense sands
at 3d and 5d pile spacing. Journal of Geotechnical Engineering 121, 5 (May 1995), 436–441.
9. McVay, M., Zhang, L., Molnit, T., and Lai, P. Centrifuge testing of large laterally loaded pile groups
in sands. Journal of Geotechnical and Geoenvironmental Engineering 124, 10 (October 1998), 1016–1026.
10. Muqtadir, A., and Desai, C. S. Three dimensional analysis of a pile-group foundation. International
journal for numerical and analysis methods in geomechanics 10 (1986), 41–58.
11. OpenSees Development Team (Open Source Project). OpenSees: open system for earthquake
engineering simulations. http://www.opensees.org; (to login use: user: guest, password OSg3OS).
12. Pressley, J. S., and Poulos, H. G. Finite element analysis of mechanisms of pile group behavior.
International Journal for Numerical and Analytical Methods in Geomechanics 10 (1986), 213–221.
13. Reese, L. C., Wang, S. T., Isenhower, W. M., and Arrellaga, J. A. LPILE plus 4.0 Technical
Manual, version 4.0 ed. ENSOFT, INC., Oct. 2000.
14. Rollins, K. M., Peterson, K. T., and Weaver, T. J. Lateral load behavior of full scale pile group in
clay. Journal of geotechnical and geoenvironmental engineering 124, 6 (June 1997), 468–478.
15. Ruesta, P. F., and Townsend, F. C. Evaluation of laterally loaded pile group at roosevelt bridge.
Journal of Geotechnical and Geoenvironmental Engineering 123, 12 (December 1997), 1153–1161.
16. Trochanis, A. M., Bielak, J., and Christiano, P. Three-dimensional nonlinear study of piles. Journal
of Geotechnical Engineering 117, 3 (March 1991), 429–447.
17. Wakai, A., Gose, S., and Ugai, K. 3-d elasto-plastic finite element analysis of pile foundations subjected
to lateral loading. Soil and Foundations 39, 1 (Feb. 1999), 97–111.
Copyright c© 2001 John Wiley & Sons, Ltd. Int. J. Numer. Anal. Meth. Geomech. 2001; 01:1–6
Prepared using nagauth.cls