Numerical Simulation of the Gas-Solid Flo€¦ · Sensors & Transducers, Vol. 164, Issue 2,...
9
Sensors & Transducers, Vol. 164, Issue 2, February 2014, pp. 218-226 218 S S S e e e n n n s s s o o o r r r s s s & & & T T T r r r a a a n n n s s s d d d u u u c c c e e e r r r s s s © 2014 by IFSA Publishing, S. L. http://www.sensorsportal.com Numerical Simulation of the Gas-Solid Flow by DEM-CFD Approach with Application to a Spouted Bed 1, 2 Jinhe FAN, 3 Guoxian XIAO 1 Institute of Powder Engineering, College of Materials and Mineral Resources, Xi′an University of Arch. & Tech., Xi′an 710055, China 2 State Key Laboratory of Architecture Science and Technology in West (XAUAT), Xi′an 710055, China 3 Sinoma International Environmental Engineering Co., Ltd, Nanjing 211100, China 1 Tel.: +86-29-82205280, fax: +86-29-85535724 1 E-mail: [email protected] Received: 17 December 2013 /Accepted: 28 January 2014 /Published: 28 February 2014 Abstract: The paper presents a computational study of the gas-solid flow in a three-dimensional spouted bed by a combined approach of discrete element method and computational fluid dynamics (DEM-CFD).The coupling between the discrete particle and continuum gas was achieved by applying the principle of Newton’s third law of motion. As a result, it is found that the motion of particles was forming a distinct circulation between center zone and boundary zone of the 3D spouted bed in macro, and there was a stagnant zone near the bottom of the bed in which the particle velocity is almost zero near the wall, they do not move anywhere. Pressure drop will be affected by wind speed and particle density. With enhancing of wind velocity, pressure drop appears an increasing trend until it is up to a certain value, and then the curve will have a certain degree of back and keep in an extension; Adding particle density, pressure drop and its swing is increased markedly. The results of this study provide important information in the spouted bed and may be helpful for better application and modification of this type of spouted bed to the industrial process. Copyright © 2014 IFSA Publishing, S. L. Keywords: Spouted bed, Gas-solid flow, Numerical simulation, Discrete element method, Pressure drop. 1. Introduction Spouted beds enable good mixing of particles and gas-particle contacting for relatively large particles. In recent years spouted beds have been widely used in various industrial and physical operations such as drying of biomaterials, foods and pharmaceutical powders; coating application on hard and soft capsules; granulation; combustion of coals, saw dust and waste biomass; coal gasification; thermal catalytic process; pyrolysis of plastics and flash pyrolysis of biomass [1-5]. Different from conventional fluidized beds, the granular phase in spouted beds is agitated by the gases through a single nozzle, which causes the flow pattern of particles in spouted beds to be more regular than that in fluidized beds. Specifically, the particle flow in spouted beds consists of three distinct regions: a dilute phase core of upward gas–solid flow called the “spout”, a cluster particles flow blown up Article number P_1855
Transcript of Numerical Simulation of the Gas-Solid Flo€¦ · Sensors & Transducers, Vol. 164, Issue 2,...

Sensors & Transducers, Vol. 164, Issue 2, February 2014, pp. 218-226
218
SSSeeennnsssooorrrsss &&& TTTrrraaannnsssddduuuccceeerrrsss
© 2014 by IFSA Publishing, S. L. http://www.sensorsportal.com
Numerical Simulation of the Gas-Solid Flow by DEM-CFD Approach with Application
to a Spouted Bed
1, 2 Jinhe FAN, 3 Guoxian XIAO 1 Institute of Powder Engineering, College of Materials and Mineral Resources,
Xi′an University of Arch. & Tech., Xi′an 710055, China 2 State Key Laboratory of Architecture Science and Technology in West (XAUAT),
Xi′an 710055, China 3 Sinoma International Environmental Engineering Co., Ltd,
Nanjing 211100, China 1 Tel.: +86-29-82205280, fax: +86-29-85535724
1 E-mail: [email protected]
Received: 17 December 2013 /Accepted: 28 January 2014 /Published: 28 February 2014 Abstract: The paper presents a computational study of the gas-solid flow in a three-dimensional spouted bed by a combined approach of discrete element method and computational fluid dynamics (DEM-CFD).The coupling between the discrete particle and continuum gas was achieved by applying the principle of Newton’s third law of motion. As a result, it is found that the motion of particles was forming a distinct circulation between center zone and boundary zone of the 3D spouted bed in macro, and there was a stagnant zone near the bottom of the bed in which the particle velocity is almost zero near the wall, they do not move anywhere. Pressure drop will be affected by wind speed and particle density. With enhancing of wind velocity, pressure drop appears an increasing trend until it is up to a certain value, and then the curve will have a certain degree of back and keep in an extension; Adding particle density, pressure drop and its swing is increased markedly. The results of this study provide important information in the spouted bed and may be helpful for better application and modification of this type of spouted bed to the industrial process. Copyright © 2014 IFSA Publishing, S. L. Keywords: Spouted bed, Gas-solid flow, Numerical simulation, Discrete element method, Pressure drop. 1. Introduction
Spouted beds enable good mixing of particles and gas-particle contacting for relatively large particles. In recent years spouted beds have been widely used in various industrial and physical operations such as drying of biomaterials, foods and pharmaceutical powders; coating application on hard and soft capsules; granulation; combustion of coals, saw dust and waste biomass; coal gasification; thermal
catalytic process; pyrolysis of plastics and flash pyrolysis of biomass [1-5].
Different from conventional fluidized beds, the granular phase in spouted beds is agitated by the gases through a single nozzle, which causes the flow pattern of particles in spouted beds to be more regular than that in fluidized beds. Specifically, the particle flow in spouted beds consists of three distinct regions: a dilute phase core of upward gas–solid flow called the “spout”, a cluster particles flow blown up
Article number P_1855

Sensors & Transducers, Vol. 164, Issue 2, February 2014, pp. 218-226
219
by the gas to the freeboard and then fallen back to the top of annulus under the effect of gravity called the fountain, and a surrounding region of downward quasi-static granular flow called the “annulus”. From the point of view of technological need, fundamental studies of flow pattern of granular solids are of great importance in designing spouted beds for optimal mixing. In addition, better understanding of the dynamics of spouted beds agitated by a single nozzle is crucial as a first step toward understanding the more complex, inhomogeneous convection of particles in multi-nozzle bubbling beds [6].
To investigate the particle and gas flow characteristics in spouted beds, one can choose the experimental approach or numerical method. In recent years, numerical simulation with computational fluid dynamics becomes very popular to obtain detailed information of the flow characteristics in spouted beds due to the rapid development of numerical computational techniques and computer performances over past decades.
Computer capability has been recently developed to a great extent and thus Computational Fluid Dynamics (CFD) has become a powerful tool to study the flow behavior in spouted beds. Two main approaches have been used to simulate flow behavior in spouted beds: Eulerian–Lagragian and Eulerian–Eulerian approaches. As a comparison of the two methods, the Eulerian–Eulerian (two-flow model, TFM) approach is more feasible for practical application to complex multiphase flows, however, it does not recognize the discrete character of the solid phase, and there has not yet been a quantitative analysis to assess multi-particle microstructures. The Eulerian–Lagragian (DEM) approach offers a more natural way to simulate the systems of spouted bed with complex behavior. Several attempts have been made to model spouted beds using this approach [7-9].
The mechanisms of solids movement in spouted beds are still not completely understood. Hence, knowledge about gas and particle dynamics in spouted beds is important in the evaluation of particle circulation rates and gas–solid contacting efficiency.
In this paper, based on the theory of the computational fluid dynamics (CFD) and Newton’s Law, we adopt the Eulerian–Lagragian model to simulate the complex gas solid two phase flow in a flat-bottomed 3D spouted bed. Considered the rules of Newton’s law and particle collision theory, we give an analysis in detail on the force of particle-particle and between particle and walls, and track numerating every particle motion processing considering slides of particle-particle. The coupling relation between gas phase and solid phase realizes through Newton’s third law of motion. The calculating procedure do well in couple-coupling because of considering the force of gas for solid and solid for gas at one time [10, 11]. The results show that the overall flow behavior and the total bed pressure drop within the spouted bed can be predicted well by the aforementioned model. Then, the detailed
characteristics of the gas solid flow in the multiples pouted bed are examined. The effects of the hydrodynamic parameters on the flow patterns in the bed under different operational conditions are analyzed, and some interesting and useful results are obtained. 2. Mathematical Model 2.1. Discrete Approach of Particle Motions
A particle in a spouted bed can have two types of motion: translational and rotational, which are completely determined by Newton's second law of motion. During its movement, the particle may collide with its neighbor particles or wall at the contact points and interact with the surrounding fluid, through which the momentum and energy are exchanged. Strictly speaking, this movement is affected not only by the forces and torques originated from its immediate neighbor particles and vicinal fluid but also the particles and fluids far away through the propagation of disturbance waves. Then at all times the resultant forces on any particle can be determined exclusively from its interaction with the contacting particles and vicinal fluid. Meanwhile, gravitational force, drag-force, collision force and pressure gradient force are more than other forces in two phases, so those other forces have been ignored in calculation conditions.
Based on the above assumption, Newton's second law of motion is used to describe the motion of individual particles. Thus, at any time , the equation governing, the translational motion of particle i is [12]:
, , ,1
d
d
iki
i f i c ij d ij ij
m m
vf f f g
, (1)
where im and iv are, respectively, the mass and
velocity of particle i , and ik is the number of
particles in contact with this particle. The forces involved are: the fluid drag force, ,f if , gravitational
force, im g , and inter-particle forces between
particles i and j which include the contact force,
,c ijf , and viscous contact damping force, ,d ijf .
The fluid drag force is expressed:
, 1i
f i i i i pi
p V
f u v,
(2)
where iu and i are the gas local velocity and
volume fraction of particle i respectively, pV is the
particle volume ( 3= / 6ppV d ), and i is the fluid-
particle inter-coefficient.

Sensors & Transducers, Vol. 164, Issue 2, February 2014, pp. 218-226
220
The interface momentum transfer, as mentioned above, is represented by the drag force. Since its essential effect on the hydrodynamic behavior of gas-solid flow, a lot of work has been done on this subject and various drag models have been proposed. As described above, different models including Ergun model [13], Wen & Yu model [14] and Gidaspow model [15] have been put forward. In these models, the Gidaspow model has proved to be effective for modeling the interface momentum exchange, and has been widely used for simulating the solid-fluid systems. Researchers have done some modification based on the Gidaspow theory in recent years, one example is the Gidaspow model with a switch function [16, 17]. We adopt the Gidaspow model in present work and it has the following expression [23].
2
2
2.65
1150 1.75 1 when( 0.8)
13when( 0.8)
4
g g
p p
d gp
d d
Cd
u v
u v
, (3)
where pd is the particle diameter, g is the gas
density, and the drag coefficient, dC , for an isolated
particle depends on the particle Reynolds number as:
2/3
24R e 1
Re
241 Re / 6 1 Re 1000
Re
0.44 Re 1000
pp
d p pp
p
C
,
,
,
(4)
Re g pp
g
d
u v , (5)
where g is the viscosity of gas phase. The constant
viscosity of gas phase is used in the present simulations.
The role of rolling friction is specially considered in this work, as indicated in Eq.(6). The relative rotation between contacting particles or between a particle and a wall in contact will produce a rolling resistance. Since the particles underwent an internal circulating flow in spouted beds, they may have had a great rolling velocity and, therefore, a great rolling resistance. The resistant torque expression was used in here.
The gravitational and fluid drag forces act on the mass centre of particle i , whilst the inter-particle forces act at the contact point between particles i and j , The inter-particle forces will generate a
torque,ijT , causing particle i to rotate. For a
spherical particle of radius R i ,ijT is given by
,=Rij i c ijT f , where R i is a vector running from the
mass centre of the particle to the contact point (its
magnitude equals to R i ). Thus, the equation
governing the rotational motion of particle i is:
1
iki
i ijj
dI T
dt
, (6)
where i is the angular velocity, and iI is the
moment of inertia of particle i , given as 22 / 5i i iI m R .
To solve eqs. (1) and (6), the forces involved need to be determined a priori. To demonstrate the principles of evaluating these forces, a collision between two particles i and j will be discussed.
Here we define that two particles are in contact if the distance between their mass centres is less than the sum of their radii. The inter-particle forces involved in eq.(1) are determined from their normal and tangential components, represented, respectively, by
,cn ijf and ,dn ijf , and
,ct ijf and ,dt ijf for particle i .
There are a number of models have been proposed for the evaluation of the inter-particle forces, which can probably be grouped into three categories: the linear model, the non-linear model, and the non-linear hysteretic model. However, the linear contact force model is still widely used mainly due to its simplicity as well as reasonable accuracy [18, 19]. Accordingly, the linear normal and tangential contact force models are used in the present study, so that
, , ,cn ij n i n ij ik f n (7)
, , ,ct ij t i t ij ik f t , (8)
where ,n ik , ,n ij and ,t ik , ,t ij are the spring
constant and displacement between particles i and j respectively in normal and tangential
directions, in and it are, respectively, the unit
vectors along the normal and tangential directions for particle i . If
, ,ct ij ij cn ijf f , then sliding occurs, and
the magnitude of the tangential force is given by the Coulomb friction law, preserving the sign obtained from eq. (9).
, ,ct ij ij cn ij f f , (9)
where ij represents the coefficient of friction
between particles i and j . The normal and
tangential displacements in eqs. (7) and (8) are determined from the motion history of particles i and j .
A system will eventually tend to be stationary as a result of the inelastic collisions between particles if no external energy is added to it. This mechanism can

Sensors & Transducers, Vol. 164, Issue 2, February 2014, pp. 218-226
221
be simulated by introducing a viscous contact damping force to consume the system energy during the particle collisions. The viscous contact damping forces for particle i along the normal and tangential directions are, respectively, given by:
, ,dn ij n i r i i f v n n (10)
, ,dt ij t i r i i i i j jR R f v t t , (11)
where ,n i , and ,t i , are, respectively, the normal
and tangential viscous contact damping coefficients
of particle i , and rv , is the velocity vector of
particle i relative to j , defined as r i j v v v . If
sliding occurs, then only friction damping is considered and viscous contact damping is vanished. 2.2. Fluid Motion
The continuity and momentum equations for the fluid motion are based on local mean variables, given as:
0
g g j
j
u
t x
( , 1, 2,3i j ) (12)
g i g i j
i ij i
u u u pu v
t x x
2 2
23
3jg i
gi j j
u ug
x x x
, (13)
where is the porosity, g is the density of gas,
and u is the gas velocity, p is the gas pressure, g
is the acceleration of gravity, and i iu v is the
interaction term due to fluid drag force [10, 20]. 3. Simulation Conditions 3.1. Computational Parameters
A FORTRAN computer code is developed for this three-dimension simulation, and the rectangular vessel geometry is adopted in this calculation. The Phase Coupled SIMPLE algorithm, which is an extension of the SIMPLE algorithm for multiphase flow, has been used for the pressure–velocity coupling and correction. The momentum and volume fraction have been discretized by a first-order upwind scheme. The vessel has a width of 110 mm, a depth of 12 mm and a height of 900 mm. The cross section of the jet nozzle is 10 mm×12 mm. In addition, the bed depth (12 mm) is 2.4 times of particle diameter
(5 mm), which less than the critical value of 5 in literature [21]. So the wall effects are not negligible. The bed is composed of particles with a diameter of 0.5 cm and a density of 2700 kg/m3. The static height is 152 mm and the gas is assumed to be air at 20°C and 1 atm. We adopt the value which equals to 1 in this study because It is found that the result with
/ =1t n has the best agreement with the
experimental data [22]. The geometry and physical parameters for the numerical simulation of spouted beds are summarized in Table 1.
Table 1. Parameters and simulation used in present work.
Solid phase Gas phase
Particle shape Spherical Bed depth 0.012m
Number of particles 2000 Bed height 0.90 m
Particles diameter, pd 0.005 m Bed width 0.11 m
Time step, 10-5s Orifice width
0.01 m
Friction coefficient, 0.3
Number of grids 11 2 45
Particle density,p 2700 kg.m-3 Grid size
0.01 0.006 0.02 m
Spring coefficient,
n or t 50,000Nm-1
Viscosity ,
g 1.82 10-5 kgm-1s-
1
Viscous contact damping
coefficient, n or t 0.3
Density ,
g 1.205 kgm-3
3.2. Initial and Boundary Conditions
Initially, the whole bed is assumed to hold still at atmospheric pressure, both of the gas velocity and solid velocity are set to zero. The particles are filled in the bed below the given static bed height and the volume fraction of particles is limited to the loose packing volume fraction. The detailed description of the setting up particles initial positions can be found in the author’s another paper. For the boundary conditions, the gas is injected into the bed from the spout nozzle, and the gas velocity is specified at the spout inlet. The solid velocity is set to zero at the inlet; Zero normal gradient condition and the atmospheric pressure are used for the outlet at the top of the bed; the no-slip boundary condition is used for gas phase at the left, right, front and back walls, and the boundary condition [23] is used for the solid phase. 4. Results and Discussion 4.1. Velocity Distribution of Particles
In this work, the uniform distribution is assumed for velocity components at the inlet, Gas is injected only in the vertical direction, and solids velocity is
Sensors & Transducers, Vol. 164, Issue 2, February 2014, pp. 218-226
222
zero. The inlet gas velocity is 22 m/s, and superficial air velocity is 2 m/s. The simulation data realized visible in virtue of upper disposal software TECPLOT 9.0 and figures are front views of model in the research. 4.1.1. Velocity Vector on X-Z Plane
Particles macroscopic motions attribute to the fluid drag force, that is, the fluid drag force is a motive power causing solid phase motion. Particle motions in the annulus, spout and fountain are shown in the section plane with velocity vectors. It is seen from Fig. 1.
0
2
4
6
0
2
4
6
0
2
4
6
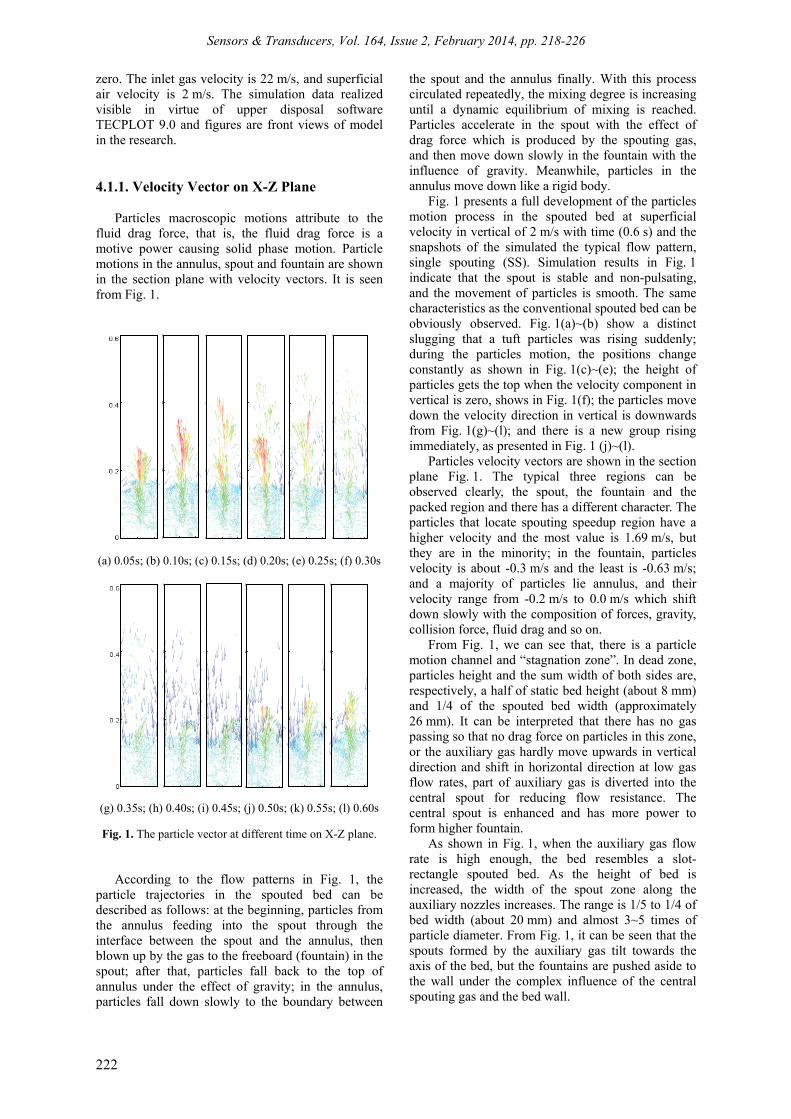
(a) 0.05s; (b) 0.10s; (c) 0.15s; (d) 0.20s; (e) 0.25s; (f) 0.30s
0
2
4
6
0
2
4
6
0
2
4
6
0
2
4
6
(g) 0.35s; (h) 0.40s; (i) 0.45s; (j) 0.50s; (k) 0.55s; (l) 0.60s
Fig. 1. The particle vector at different time on X-Z plane.
According to the flow patterns in Fig. 1, the particle trajectories in the spouted bed can be described as follows: at the beginning, particles from the annulus feeding into the spout through the interface between the spout and the annulus, then blown up by the gas to the freeboard (fountain) in the spout; after that, particles fall back to the top of annulus under the effect of gravity; in the annulus, particles fall down slowly to the boundary between
the spout and the annulus finally. With this process circulated repeatedly, the mixing degree is increasing until a dynamic equilibrium of mixing is reached. Particles accelerate in the spout with the effect of drag force which is produced by the spouting gas, and then move down slowly in the fountain with the influence of gravity. Meanwhile, particles in the annulus move down like a rigid body.
Fig. 1 presents a full development of the particles motion process in the spouted bed at superficial velocity in vertical of 2 m/s with time (0.6 s) and the snapshots of the simulated the typical flow pattern, single spouting (SS). Simulation results in Fig. 1 indicate that the spout is stable and non-pulsating, and the movement of particles is smooth. The same characteristics as the conventional spouted bed can be obviously observed. Fig. 1(a)~(b) show a distinct slugging that a tuft particles was rising suddenly; during the particles motion, the positions change constantly as shown in Fig. 1(c)~(e); the height of particles gets the top when the velocity component in vertical is zero, shows in Fig. 1(f); the particles move down the velocity direction in vertical is downwards from Fig. 1(g)~(l); and there is a new group rising immediately, as presented in Fig. 1 (j)~(l).
Particles velocity vectors are shown in the section plane Fig. 1. The typical three regions can be observed clearly, the spout, the fountain and the packed region and there has a different character. The particles that locate spouting speedup region have a higher velocity and the most value is 1.69 m/s, but they are in the minority; in the fountain, particles velocity is about -0.3 m/s and the least is -0.63 m/s; and a majority of particles lie annulus, and their velocity range from -0.2 m/s to 0.0 m/s which shift down slowly with the composition of forces, gravity, collision force, fluid drag and so on.
From Fig. 1, we can see that, there is a particle motion channel and “stagnation zone”. In dead zone, particles height and the sum width of both sides are, respectively, a half of static bed height (about 8 mm) and 1/4 of the spouted bed width (approximately 26 mm). It can be interpreted that there has no gas passing so that no drag force on particles in this zone, or the auxiliary gas hardly move upwards in vertical direction and shift in horizontal direction at low gas flow rates, part of auxiliary gas is diverted into the central spout for reducing flow resistance. The central spout is enhanced and has more power to form higher fountain.
As shown in Fig. 1, when the auxiliary gas flow rate is high enough, the bed resembles a slot-rectangle spouted bed. As the height of bed is increased, the width of the spout zone along the auxiliary nozzles increases. The range is 1/5 to 1/4 of bed width (about 20 mm) and almost 3~5 times of particle diameter. From Fig. 1, it can be seen that the spouts formed by the auxiliary gas tilt towards the axis of the bed, but the fountains are pushed aside to the wall under the complex influence of the central spouting gas and the bed wall.

Sensors & Transducers, Vol. 164, Issue 2, February 2014, pp. 218-226
223
The picture in Fig. 1 shows that the particles vector distribution is not symmetrical obviously. Generally speaking, the central particles velocity is larger than other areas. In vertical direction, velocity ranges from 10-2 to 10-1, but 10-3 to 10-2 in horizontal direction. As the axis direction is sufficiently large to reach the bed wall, the particles velocity gradually decreases. Relative velocity of particles in the spout with the effect of drag force and gravity is produced continuously. The particles velocity increases with increasing bed height firstly, and then decreases. 4.1.2. Velocity Vector on Y-Z Plane
Profiles of left view particle velocity vector are presented in Fig. 2 in this work. It can be found clearly that there occurs collision tempestuously between particles and walls of the front and back. That is, the velocity component of this direction changes faster and greater than others. So in the practice application, the depth of vessel should have a bigger size for reducing collision energy loss as much as possible.
0
0.2
0.4
0.6
0
2
4
6
(a) 0.10s; (b) 0.20s; (c) 0.30s; (d) 0.40s; (e) 0.50s; (f)0.60s
Fig. 2. The particle vector configuration on Y-Z plan. 4.2. Single Particle Motion in Spouted Bed
In order to investigate the mixing rate relationship between the different regions and the whole bed, the spouted bed is divided into three regions. Random selection a certain particle in this research that number is 2000, we can note the locus a full spouting development of the particle process (0.65 s).
As shown in Fig. 3, the whole bed at 2 m/s in vertical, the evolution of the particle location with time presents in main view, left view, top view and 3D view. It can be observed from Fig. 3(a)~(b) that the particle lies in the spout region at the beginning and moves up constantly when it was driven by the fluid drag until the fountain top. The most height of this particle is 0.3 m in the fountain. And then this
particle drops down the bed surface, comes in the annulus and shift down slowly. In the 0.12 m height of vertical, the particle has a distinct move to the central zone and enters the spouting region again in 0.07 m height taking part in the full particles motion. The particle experiences the three areas in the full spouting process. Fig. 3(c)~(d) can help explaining and understanding the spouting effect. Generally speaking, the particle can get a spouting flow and mixing well although its track can not spread all over the simulation spouted bed.
(a) main view (b) left view (c)3D view
(d) top view (zoom map)
Fig. 3. Single particle locations when u=22 m/s. 4.3. Analysis on Bed Pressure Drop
Bed pressure drop is spouted bed design and operation of the one of the important parameters. In steady spouting state, the pressure drop is directly related to the size of the energy consumption and plays a very important role in practice. For the same operating system, there will appear flow pattern change and bed pressure drop changes with spray air flow increasing in the bed. Researching on the bed pressure drop-velocity curve, we can find the relationships and judgment bed flow state. 4.3.1. Bed Pressure Drop at Various
Gas Velocity
It is the flowing gas in the bed that drives the particle to move, so particle performance is different under different operational gas conditions. The distribution of pressure drop in the bed under various operational conditions is analyzed as follows.
Fig. 4 compares the simulated total bed pressure drops versus the central gas different spouting

Sensors & Transducers, Vol. 164, Issue 2, February 2014, pp. 218-226
224
velocity at the constant auxiliary gas flow rate. A great number of the simulation values appear to have the same tendency. The total bed pressure drop increases at first, and then decreases gradually after it reaches a steady value relatively.
0.0 0.5 1.0 1.5 2.0
-6.0x10³
-4.0x10³
-2.0x10³
0.0
2.0x10³
4.0x10³
6.0x10³
8.0x10³
1.0x10⁴
Pre
ssur
e dr
op (
Pa)
Time (s)
1ms-1
5ms-1
10ms-1
15ms-1
20ms-1
25ms-1
30ms-1
35ms-1
40ms-1
Fig. 4. The pressure drop curves at different gas velocity.
It can be seen from the Fig. 4: when the air velocity is low, 1 m/s, 5 m/s, 10 m/s, bed body pressure drop is smooth, its reason may be: for larger particles in this work, its diameter directly determine the random accumulation void that is bigger than fine particles. Air just through the particles interspaces, then spread, and almost not produce a disturbance to spouted bed; the inlet airflow speed for 1 m/s to 10 m/s, particles in bed are almost no clear motion, and the bed is named a fixed bed stage. The bed pressure drop is mainly produced by viscosity loss among inter-particles, so bed pressure drop increases linearly along with the gas velocity adding. When the gas velocity is increasing to 15 m/s that the bed appears a spout state, and it shows a fluctuant value in pressure drop. From 15 m/s to 30 m/s, the rules are similar but the values level is different. And then enhancing the gas velocity to 40 m/s, pressure drop values have no distinct variety and lies 4000 Pa neighborhood. In particular, from 25 m/s to 40 m/s, the bed is a typical spouting situation, and pressure drop is mainly caused by power loss from transmitting particles and overcoming collision. There has a most pressure drop value in 30 m/s.
From the above comparisons and discussions, it can be seen that the simulated results have reasonable agreements with the experimental results literatures. This indicates that the present models are suitable to simulate the gas-solid two phase flow in spouted bed.
In this research, bed pressure drop with time appears a curve roof at inlet gas velocity 30 m/s (i.e. superficial gas velocity is 2.73 m/s). Air velocity at 35 m/s and 40 m/s, the bed pressure drop presents a fall slightly and then keeps a steady value. It can be explain: when the air velocity increases, and the particle are raising by fluid force. At the same time, the bed voidage is changing constantly so that the energy loss for eliminating viscosity loss is smaller. Meanwhile, improving gas velocity, internal friction
energy consumption is reduced between particles. These are the reasons that pressure drop has a drop obviously with air velocity increasing from 30 m/s to 40 m/s.
From Fig. 5, the bed pressure drop can be divided into two parts, one is that bed pressure drop is linear increasing with gas enhancing, and the other is that bed pressure drop can not enhance and varies at a certain extension with adding again air velocity. The dividing point of two parts is the critical gas velocity, and it is 30 m/s in this study (that is, critical superficial air velocity is 2.73 m/s).
0 10 20 30 400
1x10 3
2x10 3
3x10 3
4x10 3
5x10 3
V elocity (m /s)
Pre
ssur
e dr
op (
Pa)
Fig. 5. Average pressure drop curves at different velocity.
Pressure drop is about 4100 Pa in critical gas velocity, and then it has a little reducing and keeps 3700 Pa or so. This result can good explain that the optimal spouting can be realized at the spouting process, but there needs more energy to counteract the all kinds of resistance, particles inertia force, adhesion force and collision force especially.
4.3.2. Bed Pressure Drop at Different Density
In the inlet wind speed 22 m/s (superficial wind speed 2 m/s), particles diameter 5 mm, from Fig. 6, it can be seen that the bed pressure drop present a trend of increase with particle density increasing: the simulated profiles of pressure drop is 2900, 3100, and 3400 Pa with the particle density of 2200, 2400, and 2700 kg/m3, respectively;
0 3 6 9 12 152.6x10³
2.8x10³
3.0x10³
3.2x10³
3.4x10³
3.6x10³
3.8x10³
4.0x10³
pre
ssur
e dr
op (
Pa)
Time (s)
2200kgm-3
2400kgm-3
2700kgm-3
Fig. 6. Bed pressure drop at different particle density.

Sensors & Transducers, Vol. 164, Issue 2, February 2014, pp. 218-226
225
Moreover, pressure drop fluctuation also extends with the increasing particle density; Thirdly, the pressure drop appears a better periodicity as a function of time.
5. Conclusions
The CFD-DPM simulation has been performed to study particle flow patterns of 3D spouted bed at a condition of bed height, width, and thickness, 900 mm, 110 mm and 12 mm, respectively. The work is accounting for SIMPLE in the momentum equation. The simulation results led to the following conclusions:
1) There has an obviously slugging phenomenon before the bed is forming a spouting pattern at the simulation condition.
2) Particle velocity vector appears a clear distribution of particles speed and direction at three regions, and how to circulate in the bed. It can be judged expressly that where has stagnation zone and what is the area of the region; the central particles spouting velocity in vertical is increasing constantly and then decreasing gradually, and there has a particles running channel; the vector shows a distinct dissymmetry distribution.
3) The simulation results of single particle shows that particle can only move in some certain areas in a relatively short time, and that there has a rule during particles motion and the flow patters has a popular repeatability in spouted bed.
4) Pressure drop results show that the value is increasing continuously with enhanced inlet gas velocity, and it reaches a maximum as the gas velocity 30 m/s; and then pressure drop presents a reducing with the inlet wind velocity improved, but it always rests within a certain extent. Moreover, pressure drop puts up a mount trend as adding grain density, and the periodical fluctuation swing also becomes wider.
Acknowledgements
This work was financially supported by the China Major Science and Technology Program for Water Pollution Control and Treatment Foundation (No. 2010ZX07319-002), the State Key Laboratory of Architecture Science and Technology in West of China Foundation (No. 10KF06), the Education Department of Shaanxi Province Scientific Research Project Foundation (No. 12JK0463) and Youth Foundation of Xi’an University of Architecture and Technology (No. QN1318).
References [1]. S. Devahastin, A. S. Mujumdar, G. S. V. Raghavan,
Diffusion-controlled batch drying of particles in a
novel rotating jet annular spouted bed, Drying Technology, Vol. 16, Issue 3-5, 1998, pp. 525-543.
[2]. M. Artetxe, G. Lopez, M. Amutio, et al., Operating conditions for the pyrolysis of poly-(ethyleneterephthalate) in a conical spouted-bed reactor, Industrial & Engineering Chemistry Research, Vol. 49, Issue 5, 2010, pp. 2064-2069.
[3]. G. Elordi, M. Olazar, G. Lopez, M. Artetxe, J. Bilbao, Product yields and compositions in the continuous pyrolysis of high-density polyethyleneina conical spouted bed reactor, Industrial & Engineering Chemistry Research, Vol. 50, Issue 11, 2011, pp. 6650-6659.
[4]. M. Amutio, G. Lopez, R. Aguado, et al., Effect of vacuum on lignocellulosic biomass flash pyrolysis in a conical spouted bed reactor, Energy Fuels, Vol. 25, Issue 9, 2011, pp. 3950-3960.
[5]. M. Amutio, G. Lopez, M. Artetxe, G. Elordi, M. Olazar, J. Bilbao, Influence of temperature on biomass pyrolysis in a conical spouted bed reactor, Resources, Conservation & Recycling, Vol. 59, Issue 2, 2012, pp. 23-31.
[6]. N. Menon, D. J. Durian, Particle motions in a gas-fluidized bed of sand, Physical Review Letters, Vol. 79, Issue 18, 1997, pp. 3407-3410.
[7]. S. Takeuchi, S. Wang, M. J. Rhodes, Discrete element study of particle circulation in a 3-D spouted bed, Chemical Engineering Science, Vol. 60, Issue 5, 2005, pp. 1267-1276.
[8]. X. L. Zhao, S. Q. Li, G. Q. Liu et al., Flow patterns of solids in a two-dimensional spouted bed with draft plates: PIV measurement and DEM simulations, Powder Technology, Vol. 183, Issue 1, 2007, pp. 79-87.
[9]. X. L. Zhao, S. Q. Li, G. Q. Liu et al., DEM simulation of the particle dynamics in two-dimensional spouted beds, Powder Technology, Vol. 184, Issue 2, 2008, pp. 205-213.
[10]. Y. Tsuji, T. Kawaguchi, T. Tanaka, Discrete particle simulation of 2-dimensional fluidized-bed, Powder Technology, Vol. 77, Issue 1, 1993, pp. 79-87.
[11]. T. Tanaka, Y. Tsuji, Numerical simulation of gas-solid two-phase flow in a vertical pipe: On the effect of inter-particle collision, in Proceedings of the 4th International Symposium on Gas Solid Flows ASME FED, Vol. 121, 1991, pp. 123-128.
[12]. B. H. Xu, A. B. Yu, Numerical simulation of the gas-solid flow in a fluidized bed by combing discrete particle method with computational fluid dynamics, Chemical Engineering Science, Vol. 52, Issue 16, 1997, pp. 2785-2809.
[13]. S. Ergun, Fluid flow through packed columns, Chemical Engineering and Processing, Vol. 48, 1952, pp. 89-94.
[14]. C. Y. Wen, Y. H. Yu, Mechanics of fluidization, Chemical Engineering Programming Symposium Series, Vol. 62, 1966, pp. 100-111.
[15]. D. Gidaspow, Multiphase flow and fluidization: continuum and kinetic theory descriptions, Academic Press, Chile, 1994.
[16]. W. Sobieski, Switch function and sphericity coefficient in the Gidaspow drag model for modeling solid-fluid systems, Drying Technology, Vol. 27, Issue 2, 2009, pp. 267-280.
[17]. Wu Zhonghua, A. S. Mujumdar, Simulation of the hydro dynamics and drying in a spouted bed dryer, Drying Technology, Vol. 25, Issue 1, 2007, pp. 59-74.

Sensors & Transducers, Vol. 164, Issue 2, February 2014, pp. 218-226
226
[18]. P. A. Cundall, O. D. L. Strack, A discrete numerical model for granular assemblies, Geotechnique, Vol. 29, Issue 1, 1979, pp. 47-65.
[19]. P. K. Haft, R. S. Anderson, Grain scale simulations of loose sedimentary beds: the example of grain-bed impacts in aeolian saltation, Sedimentology, Vol. 40, Issue 2, 1993, pp. 175-198.
[20]. C. Crowe, M. Sommerfeld, Y. Tsuji, Multiphase flows with droplets and particles, CRC Press, USA, 1997.
[21]. A. Orpe, D. V. Kharkar, Scaling relations for granular flow in quasi-two dimensional rotating cylinders,
Physical Review E: Statistical Physics, Plasmas, Fluids, and Related Interdisciplinary Topics, Vol. 64, Issue 3, 2001, pp. 1302-1314.
[22]. G. Q. Liu, S. Q. Li, X. L. Zhao, Q. Yao, Experimental studies of particle flow dynamics in a two-dimensional spouted bed, Chemical Engineering Science, Vol. 63, Issue 4, 2008, pp. 1131-1141.
[23]. P. C. Johnson, R. Jackson, Frictional-collisional constitutive relations for granular materials, with application to plane shearing, Journal of Fluid Mechnics, Vol. 176, Issue 1, 1987, pp.67-93.
___________________
2014 Copyright ©, International Frequency Sensor Association (IFSA) Publishing, S. L. All rights reserved. (http://www.sensorsportal.com)