Numerical simulation for steel brace members incorporating ... · Table 1 Parameters and results...
18
Numerical simulation for steel brace members incorporating a fatigue model Suhaib Salawdeh, Jamie Goggins ⇑ College of Engineering & Informatics, National University of Ireland, Galway, Ireland article info Article history: Received 28 September 2011 Revised 20 July 2012 Accepted 30 July 2012 Available online 13 September 2012 Keywords: Bracing Cold-formed structural steel Concentrically braced frames Earthquake engineering Fatigue Numerical modelling abstract The aim of this paper is to develop a robust numerical model for cold-formed steel square and rectangular structural hollow sections for use as axial loaded members in earthquake engineering applications. Pseudo-static cyclic physical tests of cold-formed steel brace specimens using axially loading are used to develop and calibrate a robust numerical model that mimics the results from the tests. A nonlinear fibre based beam-column element model which considers the spread of plasticity along the element is used. This numerical model includes a low cyclic fatigue model, which wraps the nonlinear fibre based beam-column element material in order to capture fracture in the braces. New parameters to be used for the fatigue model are introduced in this paper. Comparisons of the maximum tensile force (F max ), ini- tial buckling load (F c ), number of cycles to fracture, the total energy dissipated (W tot ) and the energy dis- sipated at the first cycle of ductility of 4 (W l=4 ) between the numerical models and the physical tests are carried out. In general, the models captured the salient response parameters observed in the physical tests. It is found that the numerical model gives a good prediction of the maximum measured tensile force (F max ) and initial buckling load (F c ) with the mean values being 0.93 and 0.95 of those measured in the physical tests, respectively. The corresponding coefficients of variation (C V ) are 0.11 and 0.08, respectively. Moreover, the mean values of the total energy dissipated (W tot ) and the energy dissipated at the first cycle of ductility of 4 (W l =4) for the numerical model are found to be 1.12 and 0.98, of those measured in the physical tests, respectively. The corresponding coefficients of variation (C V ) are 0.13 and 0.20, respectively. Furthermore, the numerical model was validated using another set of independent physical tests. This validated brace element model can be used in future numerical models of concentri- cally brace frames buildings to predict the performance of the complete structures under earthquake loading. Ó 2012 Elsevier Ltd. All rights reserved. 1. Introduction The brace element is the main element in concentrically braced frame (CBF) systems that undergoes inelastic deformations to dis- sipate energy during seismic actions. It is destined to carry reversal axial forces in which it may experience yield in tension, buckle in compression or may fracture due to the demand cycles it is ex- pected to endure during seismic actions. Structural hollow sections (square, rectangular, circular and oval shaped) are commonly used as braced elements. Furthermore, increased interest has been shown in studying the performance of hollow structural steel sections [1–19] in order to model their inelastic behaviour. In this paper, the hysteretic behaviours of cold-formed square and rectangular hollow steel sections (SHS and RHS) subjected to inelastic cyclic loading carried out by Goggins [20] are studied. A robust numerical model for cold-formed carbon steel square and rectangular structural hollow sections is developed. The model is then validated by comparing its predictions to findings by Nip et al. [19] for cold-formed carbon steel hollow sections. Its applicabil- ity to cold-formed stainless steel and hot rolled carbon steel square and rectangular structural hollow sections is also investigated. The numerical model could then be employed in non-linear time his- tory analysis (NLTHA) modelling to assess the behaviour of CBF systems. 2. Cyclic tests of steel brace specimens Goggins [20] carried out many cyclic tests on cold-formed square and rectangular hollow steel sections in order to obtain experimental data to validate numerical models. In particular, the performance of fifteen specimens fabricated from 20202.0SHS, 40402.5SHS and 50252.5RHS sections with normalised slen- derness ratios, k, defined in Eurocode 3 [21], of between 0.4 and 3.2 subjected to cyclic tests were investigated. Two different lengths of specimens (1100 and 3300mm) were used to obtain the broad range of slenderness ratios. The tests carried out by Goggins [20] on intermediate and long length brace specimens were subjected 0141-0296/$ - see front matter Ó 2012 Elsevier Ltd. All rights reserved. http://dx.doi.org/10.1016/j.engstruct.2012.07.036 ⇑ Corresponding author. Tel.: +353 91492609; fax: +353 91494507. E-mail addresses: [email protected] (S. Salawdeh), Jamie.Goggins@ nuigalway.ie (J. Goggins). Engineering Structures 46 (2013) 332–349 Contents lists available at SciVerse ScienceDirect Engineering Structures journal homepage: www.elsevier.com/locate/engstruct
Transcript of Numerical simulation for steel brace members incorporating ... · Table 1 Parameters and results...
Engineering Structures 46 (2013) 332–349
Contents lists available at SciVerse ScienceDirect
Engineering Structures
journal homepage: www.elsevier .com/locate /engstruct
Numerical simulation for steel brace members incorporating a fatigue model
Suhaib Salawdeh, Jamie Goggins ⇑College of Engineering & Informatics, National University of Ireland, Galway, Ireland
a r t i c l e i n f o a b s t r a c t
Article history:Received 28 September 2011Revised 20 July 2012Accepted 30 July 2012Available online 13 September 2012
Keywords:BracingCold-formed structural steelConcentrically braced framesEarthquake engineeringFatigueNumerical modelling
0141-0296/$ - see front matter � 2012 Elsevier Ltd. Ahttp://dx.doi.org/10.1016/j.engstruct.2012.07.036
⇑ Corresponding author. Tel.: +353 91492609; fax:E-mail addresses: [email protected] (
nuigalway.ie (J. Goggins).
The aim of this paper is to develop a robust numerical model for cold-formed steel square and rectangularstructural hollow sections for use as axial loaded members in earthquake engineering applications.Pseudo-static cyclic physical tests of cold-formed steel brace specimens using axially loading are usedto develop and calibrate a robust numerical model that mimics the results from the tests. A nonlinearfibre based beam-column element model which considers the spread of plasticity along the element isused. This numerical model includes a low cyclic fatigue model, which wraps the nonlinear fibre basedbeam-column element material in order to capture fracture in the braces. New parameters to be usedfor the fatigue model are introduced in this paper. Comparisons of the maximum tensile force (Fmax), ini-tial buckling load (Fc), number of cycles to fracture, the total energy dissipated (Wtot) and the energy dis-sipated at the first cycle of ductility of 4 (Wl=4) between the numerical models and the physical tests arecarried out. In general, the models captured the salient response parameters observed in the physicaltests. It is found that the numerical model gives a good prediction of the maximum measured tensileforce (Fmax) and initial buckling load (Fc) with the mean values being 0.93 and 0.95 of those measuredin the physical tests, respectively. The corresponding coefficients of variation (CV) are 0.11 and 0.08,respectively. Moreover, the mean values of the total energy dissipated (Wtot) and the energy dissipatedat the first cycle of ductility of 4 (Wl=4) for the numerical model are found to be 1.12 and 0.98, of thosemeasured in the physical tests, respectively. The corresponding coefficients of variation (CV) are 0.13 and0.20, respectively. Furthermore, the numerical model was validated using another set of independentphysical tests. This validated brace element model can be used in future numerical models of concentri-cally brace frames buildings to predict the performance of the complete structures under earthquakeloading.
� 2012 Elsevier Ltd. All rights reserved.
1. Introduction
The brace element is the main element in concentrically bracedframe (CBF) systems that undergoes inelastic deformations to dis-sipate energy during seismic actions. It is destined to carry reversalaxial forces in which it may experience yield in tension, buckle incompression or may fracture due to the demand cycles it is ex-pected to endure during seismic actions. Structural hollow sections(square, rectangular, circular and oval shaped) are commonly usedas braced elements. Furthermore, increased interest has beenshown in studying the performance of hollow structural steelsections [1–19] in order to model their inelastic behaviour.
In this paper, the hysteretic behaviours of cold-formed squareand rectangular hollow steel sections (SHS and RHS) subjected toinelastic cyclic loading carried out by Goggins [20] are studied. Arobust numerical model for cold-formed carbon steel square andrectangular structural hollow sections is developed. The model is
ll rights reserved.
+353 91494507.S. Salawdeh), Jamie.Goggins@
then validated by comparing its predictions to findings by Nip etal. [19] for cold-formed carbon steel hollow sections. Its applicabil-ity to cold-formed stainless steel and hot rolled carbon steel squareand rectangular structural hollow sections is also investigated. Thenumerical model could then be employed in non-linear time his-tory analysis (NLTHA) modelling to assess the behaviour of CBFsystems.
2. Cyclic tests of steel brace specimens
Goggins [20] carried out many cyclic tests on cold-formedsquare and rectangular hollow steel sections in order to obtainexperimental data to validate numerical models. In particular, theperformance of fifteen specimens fabricated from 20�20�2.0SHS,40�40�2.5SHS and 50�25�2.5RHS sections with normalised slen-derness ratios, k, defined in Eurocode 3 [21], of between 0.4 and 3.2subjected to cyclic tests were investigated. Two different lengths ofspecimens (1100 and 3300mm) were used to obtain the broadrange of slenderness ratios. The tests carried out by Goggins [20]on intermediate and long length brace specimens were subjected

Notations
Ag the gross cross sectional areaBRB buckling restrained braceCBFs concentrically braced framesCF cold-formedCS carbon steelDI damage from cyclic loadingDIi damage for each amplitude of cyclingey axial yield displacementE Young’s modulusfy yield strengthfya the increased average yield strength due to cold work-
ingfyb the basic yield value of sheet taken from coupon testsfu the basic ultimate tensile strength of sheet taken from
coupon testFc initial buckling loadFmax the maximum tensile forceHR hot-rolledHSS hollow structural sectionk numerical coefficient that depends on the type of form-
ingm Fatigue ductility exponentn the number of 90� bends in the cross-section
n current number of cyclesn number of integration points per elementni Number of cycles at an amplitudeNf fatigue lifeNfi Number of constant amplitude cycles of that amplitude
necessary to cause failureNLTHA non-linear time history analysisr radiusRHS Rectangular hollow sectionsSa stress amplitudeSHS square hollow sectionsSS stainless steelt the design core thickness of the steel material before
cold formingWtot total energy dissipatedWl=4 energy dissipated at the first cycle of ductility of 4Dep Plastic strain amplitudeeo Fatigue ductility coefficientk Normalised slenderness ratiolf ductility at fracture
Fig. 1. Cyclic displacement waveform for ECCS procedure.
S. Salawdeh, J. Goggins / Engineering Structures 46 (2013) 332–349 333
to increasing amplitude cyclic displacements. For these cyclic tests,the loading was applied according to the provisions of the ECCS[22]. The recommended complete testing procedure was followed,for which the axial deformation history is shown in Fig. 1. This im-plies using one cycle at each level of 0.25, 0.5, 0.75 and 1.0ey, fol-lowed by three cycles at each level of 2, 4, 6ey, etc., where ey
represents the estimated axial yield displacement. Yield displace-ments evaluated from the monotonic tensile tests on short speci-mens were used to determine the amplitudes of the cycles [16].
Nip et al. [19] carried out 16 cyclic tests on square and rectan-gular hollow steel section in order to study the cyclic response oftubular bracing members of three structural materials: hot-rolledcarbon steel, cold-formed carbon steel and cold-formed stainlesssteel. These specimens were fabricated from 40�40�3.0SHS,40�40�4.0SHS, 50�50�3.0SHS, 60�60�3.0SHS and 60�40�3.0RHS sections with normalised slenderness ratios between 0.34and 1.4. They were subjected to increasing amplitude cyclic dis-placements, similar to the loading regime used by Goggins [20].Three different lengths of specimens (1250mm, 2050mm and2850mm) were used. In this paper, the physical tests carried outby Goggins [20] are used to calibrate a numerical model thatcan capture fracture of the specimens. The numerical model willthen be validated by comparing its performance to the results fromthe physical tests by Nip et al. [19].
Throughout this paper test ID’s are identified by member size(depth X width X thickness X length), material (either carbon steel,CS, or stainless steel, SS), forming process (either hot-rolled, HR, orcold-formed, CF); tests carried out by Goggins [20] are followed bythe letter G with the specimen number and tests carried out by Nipet al. [19] are followed by the letter N with the specimen number.Test ID’s are given in Tables 1 and 2, together with normalisedslenderness ratios of the brace about the minor axis (ky-y) andthe measured yield stress of the sections (fy).
In order to study the behaviour of concentrically braced mem-bers, a brief discussion of the hysteretic response (axial load-axialdisplacement response) of the brace 40�40�2.5�1100-CS-CF-G1tested by Goggins [20] is presented here. Fig. 2 showsthe 40�40�2.5�1100-CS-CF-G1 bracing test specimen with theresults from the test showing the hysteretic behaviour of the
specimen, which is described by the hysteretic response of axialforce plotted against resulting axial displacements [20]. Compres-sion loads are negative and tension loads are positive. The areaunder the hysteretic curves represents the hysteretic energy dissi-pated by the brace.
As shown in the hysteretic response in Fig. 2b, the loading wasapplied according to the provisions of the ECCS [22] discussed ear-lier. After the occurrence of the first buckling in compression atPoint 1, for stockier members the compressive strength decreasedas a plastic hinge formed at the mid-height of the brace and next tothe connection with the stiffener. For slender members, the mem-ber experienced mainly elastic buckling. For all members, theircompressive resistance degraded significantly in subsequent cyclesof the same axial deformation demand primarily due to residualdeformations from previous cycles, and to a lesser extent due tothe Baushinger effect (an increase in tensile yield strength causesdecrease of the compressive yield strength), similar conclusionswere found by Goggins [20] and Tremblay [9]. At every cycle, thebrace accumulated permanent elongation. The amount of inelasticrotation imposed to the hinge at every cycle increased as the braceelongated and the imposed deformation increased [9,20]. As the

Table 1Parameters and results for the specimens used to calibrate the numerical model.
Specimen ID ky-y fy (MPa) Initial camber (%) No. of cycles to fracture Numerical model/ physical tests
Physical tests Numerical model Fmax Fc Wtot Wl=4
40�40�2.5�1100-CS-CF-G1a 0.40 285 0.10 16 14 1.06 0.99 1.15 1.1340�40�2.5�1100-CS-CF-G2a 0.40 285 0.10 15 14 1.07 1.02 1.19 1.1220�20�2.0�1100-CS-CF-G3a 0.90 304 0.50 26 16 0.99 0.87 0.72 1.1620�20�2.0�1100-CS-CF-G4a 0.90 304 0.50 17 16 0.98 1.03 1.31 1.1450�25�2.5�1100-CS-CF-G5a 0.60 304 0.30 16 14 1.05 0.90 1.06 1.2250�25�2.5�1100-CS-CF-G6a 0.60 304 0.30 16 14 1.04 1.00 1.27 1.1840�40�2.5�3300-CS-CF-G7b 1.30 344 0.50 – – 0.91 1.03 1.07 0.8840�40�2.5�3300-CS-CF-G8b 1.30 350 0.50 – – 0.93 1.02 1.09 0.8940�40�2.5�3300-CS-CF-G9b 1.30 332 0.50 – – 0.89 0.99 1.06 0.7820�20�2.0�3300-CS-CF-G10a 3.20 443 1.00 7 4 0.81 0.82 – –20�20�2.0�3300-CS-CF-G11a 3.00 399 1.00 7 4 0.79 0.79 – –20�20�2.0�3300-CS-CF-G12a 3.00 399 1.00 7 4 0.76 0.92 – –50�25�2.5�3300-CS-CF-G13b 1.90 312 1.00 – – 1.00 1.00 1.22 0.8550�25�2.5�3300-CS-CF-G14b 2.20 428 1.00 – – 0.85 1.00 1.16 0.7450�25�2.5�3300-CS-CF-G15b 2.20 428 1.00 - - 0.84 0.92 1.14 0.70Mean 0.93 0.95 1.12 0.98CV 0.11 0.08 0.13 0.20
a Tested to failure.b Tested to maximum displacement ductility demand of between 5.6 and 9.5 without specimen failure.
Table 2Parameters and results for the specimens used to validate the numerical model.
Specimen ID ky-y fy (MPa) Initial camber (%) No. of cycles to fracture Numerical model/ physical tests
Physical tests Numerical model Fmax Fc Wtot Wl=4
60�60�3.0�2050-CS-HR-N16a 0.57 458 0.20 10 11 1.14 1.14 1.67 1.2540�40�3.0�2050-CS-HR-N17a 0.89 478 0.50 19 14 1.01 1.19 0.80 1.2540�40�3.0�1250-CS-HR-N18a 0.50 478 0.20 14 9 1.01 1.05 0.89 1.4060�60�3.0�2050-CS-CF-N19a 0.53 361 0.20 10 11 0.88 0.92 1.92 1.4940�40�4.0�2050-CS-CF-N20a,c 0.89 410 0.50 13 15 0.95 1.00 1.89 1.2740�40�3.0�2050-CS-CF-N21a,c 0.90 451 0.50 10 13 0.98 0.98 2.30 1.2840�40�3.0�1250-CS-CF-N22a 0.50 451 0.20 10 9 0.97 1.01 1.05 1.2460�60�3.0�2850-SS-CF-N23a 0.89 483 0.50 9 13 1.17 0.92 2.63 1.1850�50�3.0�2850-SS-CF-N24a 1.16 552 0.50 13 14 1.03 1.00 1.45 1.1360�40�3.0�2850-SS-CF-N25a,c 1.40 538 0.50 10 16 1.17 0.85 2.74 1.1460�60�3.0�2050-SS-CF-N26a 0.62 483 0.30 10 10 1.15 1.00 1.38 1.2050�50�3.0�2050-SS-CF-N27a 0.80 552 0.50 10 10 1.18 0.93 1.44 1.2160�40�3.0�2050-SS-CF-N28a 0.97 538 0.50 10 12 1.18 0.95 1.96 1.19Mean 1.08 1.00 1.62 1.25Cv 0.09 0.09 0.36 0.07
a Tested to failure.c Failed at end condition during physical test.
Fig. 2. (a) Specimen diagram and (b) experimental load–displacement response of the specimen 40�40�.2.5�1100-CS-CF-G1 [20].
334 S. Salawdeh, J. Goggins / Engineering Structures 46 (2013) 332–349

Fig. 3. Failure of specimen 40�40�2.5�1100-CS-CF-G1. (a) Lateral and local buckling. (b) Fracture across local buckled area near top stiffener. (c) Fracture across localbuckled are at mid-height of the specimen [20].
S. Salawdeh, J. Goggins / Engineering Structures 46 (2013) 332–349 335
brace is stocky with slenderness ratio, k, of 0.4, local buckling of thecross section developed at the hinge location at mid-height andclose to the end stiffeners, which induced high localised strainsin the steel material and contributed to reduce the brace compres-sive strength further. Maximum tension force obtained is shown atPoint 2. Fracture took place at the hinges at Point 3 when the bracewas stretched in tension after local buckling has occurred, and theultimate failure occurred at Point 4. The described failure of thespecimen above is shown in Fig. 3. It should be noted that theabove sequence of behaviour was observed for the stockier mem-bers only (e.g. those specimens with normalised slenderness lessthan 1.3). For more slender specimens (e.g. those specimens withnormalised slenderness greater than 1.3), little or no local bucklingwas observed during the tests. However, premature fracture oc-curred for specimens with high slenderness ratios (i.e. specimenswith slenderness ratio of 3.2). Eurocode 8 [23] specifies limits tothe normalised slenderness ratio between 1.3 and 2.0 for concen-trically braced frames with X diagonal bracing and suggests touse low width to thickness ratio and Class 1 cross-section definedin Eurocode 3 [21]. Further details on specimens and physical testset-up as well as specimen performance in low cyclic fatigue load-ing are given in [16].
3. Numerical modelling of steel brace elements
The computational framework Open System for EarthquakeEngineering Simulation (OpenSees) [24] is used in this study to de-velop numerical models of structural steel hollow section braceelements that capture the salient features of the response of theseelements to low-cycle tension-compression loading. OpenSeesuses the physical-theory models to represent the braces. Two waysto represent the physical theory models are found in Opensees. Thefirst is distributed plasticity, which considers the spread of plastic-ity along the element and is used for this paper. The second is con-centrated plasticity (also known as lumped plasticity), where theinterior of the element behaves elastically with plasticity consid-ered to be concentrated over specified hinge lengths at the elementends.
The main limitation in the physical theory model used in Open-Sees is that plane sections are assumed to remain plane and it doesnot account for the section distortion and the local buckling, so theaccuracy of the model is degraded after the occurrence of the localbuckling. This limitation can be ignored by calibrating the param-eters of the numerical model to represent test models.
A numerical model to be used in OpenSees for brace memberswas proposed by Uriz [25], which is able to model the effect of glo-bal buckling. Uriz [25] also calibrated a material model that can beincorporated in the numerical model to account for the effects oflow cyclic fatigue, which will be discussed and implemented inSection 4.
Many parameters affect the behaviour of the numerical bracemodel, such as initial camber, number of integration points andnumber of elements. These will be studied in the following para-graphs in order to obtain a robust numerical model that can be val-idated using the data from physical member tests. A graph of thenumerical model setup is shown in Fig. 4. This model matchesthe general characteristic of the physical test specimens, includingthe specimen length, end conditions and material properties foreach individual cyclic test specimen used. End stiffeners were alsomodelled. Fixed end conditions were provided except for the axialdisplacement at the loaded end (Point 5 at Fig. 4). The numericalmodel will first be developed using fifteen cyclic tests carried outby Goggins [20] and then be validated using sixteen cyclic testscarried out by Nip et al. [19].
The uniaxial Giuffre–Menegotto–Pinto steel material modelwith isotropic strain hardening and the monotonic envelop shownin Fig. 5 is used in this study. However, a low value of strain hard-ening (<0.008) was used in this study. A nonlinear fibre beam–column element model based on the force formulation proposedby Spacone et al. [26] is employed. This model considers the spreadof plasticity along the element through integration of material re-sponse over the cross section and subsequent integration of sectionresponse along the element. The inelastic beam-column element isderived by small deformation theory, which is used for computa-tion of local stresses and strains along the element. In accordanceto the corotational theory described by Filippou and Fenves [27],nonlinear geometry under large displacements is accounted forduring transformation of the element forces and deformations tothe global reference system. By using the corotational theory themoderate to large deformation effects of inelastic buckling of theconcentric brace can be presented (small strains and large dis-placements). Using this approach, the brace needs to be subdividedinto at least two inelastic beam-column elements. However, it ismay be necessary to divide the brace into more elements to repre-sent accurately local deformations and steel strains at the criticalsections.
In order to get accurate buckling loads and hysteretic behaviour,Opensees represents elements by fibres. Uriz [25] noted that whenthere are fewer fibres representing the cross section, sensitivity tothe interaction between moment and axial loads increased and a

Fig. 4. Setup and loading direction of the numerical model used in OpenSees.
Fig. 5. Monotonic envelop for uniaxial Giuffre-Menegotto-Pinto steel material [24].
336 S. Salawdeh, J. Goggins / Engineering Structures 46 (2013) 332–349
loss of stiffness is found when Opensees numerically integrates todetermine the area moment of inertia. When there are fewer fibresrepresenting the same area, lower centroid for the fibres will beachieved and the equivalent moment of inertia will be smaller thanthe cross section with more fibres. This calculation is more sensi-tive to the number of fibres across the thickness than the numberof fibres around the perimeter. For the numerical model used inthis paper, it was found that employing three fibres across thethickness and a minimum of 2(b + h)/3 fibres around the perimeterof the cross section was optimum in terms of computational effortand accuracy, where b and h are the width and the height of thecross section in mm. Thus, in total a minimum of 180 fibres areused in the cross section.
In OpenSees, in order to consider buckling in an axially loadedbrace, it is essential to include an imperfection either to the geom-etry of the brace in the form of initial camber or to the properties ofthe member in the form of a residual stress distribution over thecross section. In this model, initial camber is used to consider buck-ling. Uriz [25] proposed to use an initial camber displacement atmid-length of the brace with a magnitude varied between 0.05%and 0.1% of the brace length, whereas Wijesundara [28] recom-mends to use the initial camber displacement at mid-length of0.5% of the brace length.
By using small initial cambers between 0.05% and 0.1% thebuckling is delayed to reach and the buckling force is overesti-mated as shown in Fig. 6. On the other hand, incorporating initialcambers of 0.5% was not representing the observed response ofmany braces. For this study, initial camber between 0.1% and1.0% is found to give satisfactory results, where the lower boundis used for stockier specimens and larger initial camber valuesare used for more slender specimens, as will be shown in Section5. It is also noted that for a brace member with specified materialand section properties, the initial camber is the main parameterthat plays the major role for determining the first buckling loadin the numerical model, but does not affect the general behaviourof the hysteretic response.
Fig. 7 shows the effect of changing the number of non-linearbeam column elements for the unstiffened length of the brace inthe numerical model for the force displacement response usingthree integration points per element and constant initial camberof 0.5% of the length of the brace. By changing the number ofnon-linear beam column elements, the first buckling strength isnearly identical and relatively insensitive to the number of sub-elements but depends upon initial camber value used. However,the brace modelled with two elements resists less force than abrace modelled with four elements in the post buckling range witha maximum difference of 18.7% (Fig. 7). Similarly, a brace modelledwith eight elements resists slightly less force in the post bucklingrange than the brace modelled with four elements with a maxi-mum difference of 5.8% (Fig. 7). The brace modelled with sixteenelements has nearly identical behaviour in the post buckling rangeand the internal curvature with the brace modelled with eight ele-ments. However, there was a maximum difference of 1% in the postbuckling range at the second loop, but it was nearly identical forother loops. As expected, the internal curvature and the post buck-ling range are more accurately represented when more elementsare used with three integration points per element. From theabove, it is noted that a minimum number of elements of eightshould be used while using three integration points. On the otherhand, it is expected that less elements can be used in the bracewhen more integration points are assigned, in order to minimisethe time needed for modelling and computational efforts.
The integration along the element is based on Gauss–Lobattoquadrature (integration) rule (two integration points at the ele-ment ends) [24]. This numerical quadrature rule interpolates poly-nomial displacements of order 2n � 3 exactly, where n is thenumber of integration points. However, due to nonlinear materialproperties, these polynomial interpolants may not be physically

Fig. 6. Experimental force–displacement response of specimen 50�25�2.5�1100-CS-CF-G5 compared to the hysteretic model found from OpenSees with (a) 0.05% initialcamber and (b) 0.1% initial camber.
Fig. 7. Effect of changing the number of non-linear beam column elements to represent the unstiffened length for the brace in the numerical model to the force displacementresponse using three integration points per element.
S. Salawdeh, J. Goggins / Engineering Structures 46 (2013) 332–349 337
accurate, which may result in distributions of deformations thatare not adequately described by polynomials [25]. Uriz [25] ob-served that the specimen with only two integration points exhibitsa slightly more dramatic loss of compressive strength in the post-bucking range. This can also be seen in Fig. 8. This is due to an un-der integration of the element. Under-integration of element re-sponse is not recommended and the minimum number ofintegration points recommended for every inelastic beam–columnelement is 3 [25]. In Fig. 8, the brace was divided into eightelements and different integration points were used for every ele-ment. While using two integration points, slightly lower compres-sion resistance in the post buckling range is observed as comparedto models containing three, five and seven integration points witha maximum difference of 18%. However, nearly identical results inhysteretic response were found in models containing three, five,and seven integration points, as observed in Fig. 8
To check the interaction between the number of elements of thebrace and the number of integration points per element, a compar-ison of the response of the numerical models was conducted by
changing the number of elements and the number of integrationpoints per element as follows: eight elements with three integra-tion points per element, six elements with four integration pointsper element, four elements with six integration points per elementand two elements with ten integration points per element, whichis the maximum integration points that can be used for an elementin OpenSees. Fig. 9 shows that when a finer subdivision is used bydividing the brace into a number of elements or dividing the sub-element into number of integration points the results are nearlyidentical. Thus, two elements with 10 integration points per ele-ment for the buckling brace could be a suitable choice.
A sensitivity analysis on the predicted behaviour of the modelcontaining two elements and various numbers of integrationpoints (3, 4, 5, 6, 8 and 10) was conducted (see Fig. 10). It is con-cluded that two elements and three integration points cannotaccurately represent the real hysteretic response of brace mem-bers. There is a slight difference in the behaviour when using fourand five integration points. However, nearly identical results werefound when using six, eight and ten integration points. In this

Fig. 8. Effect of changing the number of integration points for the brace in the numerical model to the force displacement response using eight non-linear beam–columnelements per brace over the unstiffened length.
Fig. 9. Effect of changing the number of elements and integration points for the unstiffened brace in the numerical model to the force displacement response using differentnon-linear beam–column element per brace and different integration points per element.
338 S. Salawdeh, J. Goggins / Engineering Structures 46 (2013) 332–349
study, a minimum number of ten integration points is recom-mended while using two elements per brace.
To assure the validity of the numerical model, a comparison be-tween the performance of the model to cyclic and monotonic load-ing is carried out in OpenSees for the same brace element as shownin Fig. 11. Acceptable results are found, specifically for the first andpost buckling loads. However, maximum tensile forces in the bracemember during the first cycle at each new displacement demandwere higher than those predicted in monotonic tests in post yieldrange. An explanation for this difference may be the numericalrounding, especially with the massive number of numerical opera-tions required. On the other hand, the maximum tensile forceexperienced in second and third cycles at a given displacementamplitude were reduced due to Baushinger effect.
4. Low cyclic fatigue modelling
Brace steel members subjected to cyclic loading suffer stages ofbuckling and yielding. After the occurrence of buckling, rotationalplastic hinges will form. They experience large rotational demandsundergoing large strain deformation histories causing fracture dueto low cyclic fatigue. Fatigue process consists of three stages: initialcrack nucleation, progressive crack growth across the part and fi-nally a sudden fracture of the remaining cross section. The fatiguestrength of a material is determined experimentally. This isachieved by subjecting test specimens to repeated loads or strainsof specified amplitude or ranges, and determining the number ofcycles required to produce failure [29]. ASTM [30] defines fatiguelife, Nf, as the number of cycles of stress or strain of a specified

Fig. 10. Effect of changing the number of integration points for the brace in the numerical model to the force displacement response using two non-linear beam–columnelements per brace over the unstiffened length.
Fig. 11. Comparison of response of numerical model to monotonic and cyclic loading.
S. Salawdeh, J. Goggins / Engineering Structures 46 (2013) 332–349 339
character that a given specimen sustains before failure of a speci-fied nature occurs.
Occurrence of local buckling within the plastic hinge, increasesstrain demands causing faster fracture initiation. When local buck-ling occurs, and the braces deform in compression, cracks will formafter the braces are loaded in tension [9,31–33]. From the cyclictests carried out by Goggins [20] and discussed earlier, it is foundthat slender braces can exhibit better fracture life performancethan braces with low member slenderness ratio. A possible reasonof that is the occurrence of local buckling within the plastic hingefor stockier members, which increases strain demands and reducefatigue life.
To quantify the damage in braces, a discrete form of damageaccumulation rule called Palmgren–Miner’s rule can be used. Thisrule describes the damage in the low cycle fatigue with constant
plastic strain amplitude and associated with the relative reductionof deformability to quantify the damage for cyclic loading, DI, as [34]
DI ¼ 4nDep
4Nf Depð1Þ
where Dep is the plastic strain amplitude, n is the current number ofcycles and Nf is the number of life cycles. In Eq. (1), the numerator4nDep denotes the current plastic strain and the denominator4NDep denotes the total plastic deformability, which varies depend-ing on the given plastic strain amplitude. However, during earth-quakes the amplitude of the cycles is not constant. As such, theamplitude of each cyclic excursion in deformation history and thenumber of cycles at each amplitude identified can be computedusing a rainflow cycle counting method [25,35,36]. Damage for eachamplitude of cycling is estimated by

340 S. Salawdeh, J. Goggins / Engineering Structures 46 (2013) 332–349
DIi ¼ni
Nfið2Þ
where ni is the number of cycles at an amplitude and Nfi is the num-ber of constant amplitude cycles of that amplitude necessary tocause failure. Manson [37] and Coffin [38] working independentlyin fatigue problems, proposed a characterization of fatigue lifebased on the plastic strain amplitude. They noted that when thelogarithm of the plastic strain amplitude experienced in each cycle,ei, was plotted against the logarithm of the number of cycles to fail-ure, Nf, a linear relationship resulted for metallic materials as shownin the following equation [39]:
ei ¼ e0ðNf Þm ð3Þ
where eo is the fatigue ductility coefficient which is the materialparameter that roughly indicates the strain amplitude at whichone complete cycle on a virgin material will cause failure, and mis the fatigue ductility exponent which is the material parameterwhich describes the sensitivity of the log of the total strain ampli-tude to the log of the number of cycles to failure.
Overall damage due to low cycle fatigue is estimated by linearlysumming the damage for all of the amplitudes of deformation cy-cles considered (ei) [25]. During cycling, to get Nfi for currentamplitude, constant coefficients eo and m for Eq. (3) should beknown and Eq. (2) can be written as
DIi ¼ni
10
logeie0ð Þ
m
� � ð4Þ
Uriz [25] developed and calibrated a low cycle fatigue model tobe used with the Opensees fibre-based nonlinear beam-columnmodel for simulating the large displacement and the inelasticbuckling behaviour of steel struts. As described in OpenSees com-mand language manual [24], in order to account for the effects oflow cycle fatigue, a modified rainflow cycle counter has beenimplemented to track strain amplitudes. Rainflow cycle countingnecessitate examination of the entire time strain history for eachfibre at each time step, since the strain history changes as eachincrement of strain occurs where rainflow cycle counting analysesstrain histories after the termination of loading to determine thenumber and the amplitude of the imposed cycles. Because of thecomputational effort involved in this procedure, a modified meth-od is proposed by Uriz [25] that utilizes the traditional rainflow cy-cle counting method to accumulate damage, but does so byanalyzing only a relatively short moving window of recent strainhistory. This cycle counter is used in Miner’s Rule shown in Eq.(4) as the linear strain accumulation model based on Coffin-Man-son log-log relationships describing low cycle fatigue failure. Thismaterial wraps around the parent material and does not influencethe force–deformation relationship of the original material. Oncethe fatigue material model reaches a damage level of one, the resis-tance of the parent material becomes zero (1.0 � 10�8 is used todrop the stress of the material). If failure is triggered in compres-sion, the material stress is dropped at the next zero-force crossingwhere compression force never drops to zero. The fatigue materialassumes that each point is the last point of the history, and tracksdamage with this assumption. If failure is not triggered, this pseu-do-peak is discarded. The material also has the ability to triggerfailure based on a maximum or minimum strain.
In summary, damage during each cycle is found based uponPalmgren–Miner’s using coffin-Manson relationship where con-stant coefficient eo and m should be calibrated. Accumulated dam-age is found by using Palmgren–Miner’s rule assuming the damage
accumulated linearly using a modified rainflow cycle countingtechnique as in the following equation:
DIiþ1 ¼ DIi þni
10
logeie0ð Þ
m
� � ð5Þ
If in any point the damage Index (DI) become one or more, thenthe corresponding fibre in the cross section is removed from thecross section by reducing its stress and stiffness to zero.
Uriz [25] calibrated OpenSees low cyclic fatigue model for fourdifferent sections and found the constant coefficient for each ofthem as follows: wide flange sections (eo = 0.191, m = �0.458), hol-low structural section (HSS) members (eo = 0.095, m = �0.5), buck-ling restrained brace (BRB) members (eo = 0.12, m = �0.458) andreinforcing bars (eo = 0.081, m = �0.43). From the last values it isevident that most of the material models have a very similar valuefor the parameter, m, but the value of eo varies significantly be-tween section types. For the HSS, the fatigue parameters where cal-ibrated for 6’’X6’’X3/8’’ HSS only. In this paper, new parametersrepresenting different brace sections are proposed. It is importantto know that the model doesn’t account for the local buckling ef-fect and the computed strains do not represent the actual strainsin the member, but parameters used in the model can be calibratedto compensate for this fact.
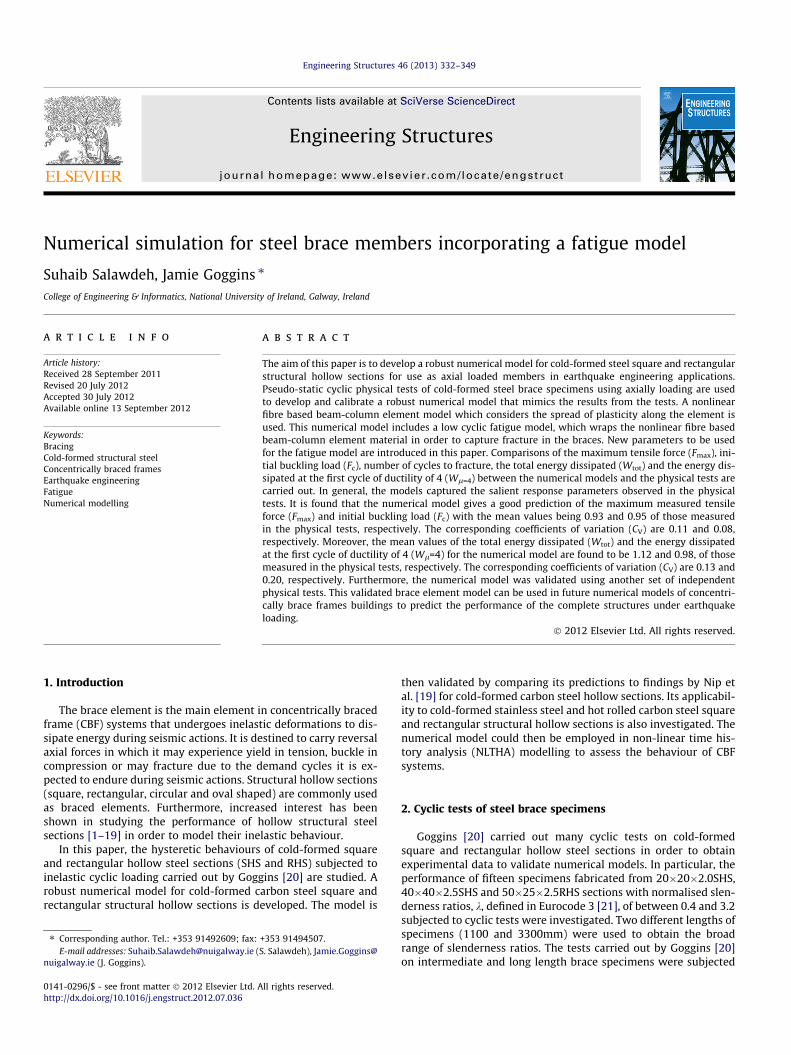
To check a consistent model for the minimum number of ele-ments that can be used for the brace using the fatigue model andthe number of integration points per element, numerical modelsare tested using different number of elements and constant num-ber of integration points. It is found that using six integrationpoints per element with four elements or more gives consistent re-sults as shown in Fig. 12. On the other hand, using 10 integrationpoints per element with two elements for the numerical model issatisfactory and gives the same results as dividing the brace intomore elements, as shown in Fig. 13.
The numerical models incorporating the fatigue model with theparameters suggested by Uriz [25] for hollow structural section(HSS) members (eo = 0.095, m = �0.5) did not represent the realbehaviour of the physical specimens tested by Goggins [20] duringthe cyclic loading, where the numerical model force decreases fas-ter than the real behaviour of the specimen. Neither did numericalmodels incorporating the fatigue parameters obtained by Nip et al.[40] from physical low cyclic fatigue tests on coupons taken fromHSS members, which were on average found to be eo = 0.4027and m = �0.6392 for cold formed carbon steel. On the other hand,Santagati et al. [41] calibrated the parameters m and eo for rectan-gular hollow section brace members by comparing the results ofnumerical simulations against the experimental behaviour of 32HSS specimens found in literature. Based on this calibration theyrecommended a constant value of the slope m equal to �0.458and a limit strain value eo equal to 0.07. Again, utilising theseparameters in numerical models did not represent the real behav-iour of the physical specimens tested by Goggins [20] during thecyclic loading. Thus, the model was calibrated using new parame-ters that can represent the behaviour of the specimens. After manytrials, it is found that by calibrating the fatigue parameters in thenumerical model to eo = 0.19 and m = �0.5, better results areachieved, at least for the sections tested by Goggins [20], as willbe shown in the next section. Further, independent tests by Nipet al. [19] are used to validate this numerical model. It is found thatusing the fatigue parameters obtained by calibrating the modelusing the tests of Goggins [20] gave better predictions of the frac-ture life for most of the specimens, as will be shown in next sectionand Tables 1 and 2. Furthermore, this model was subsequently
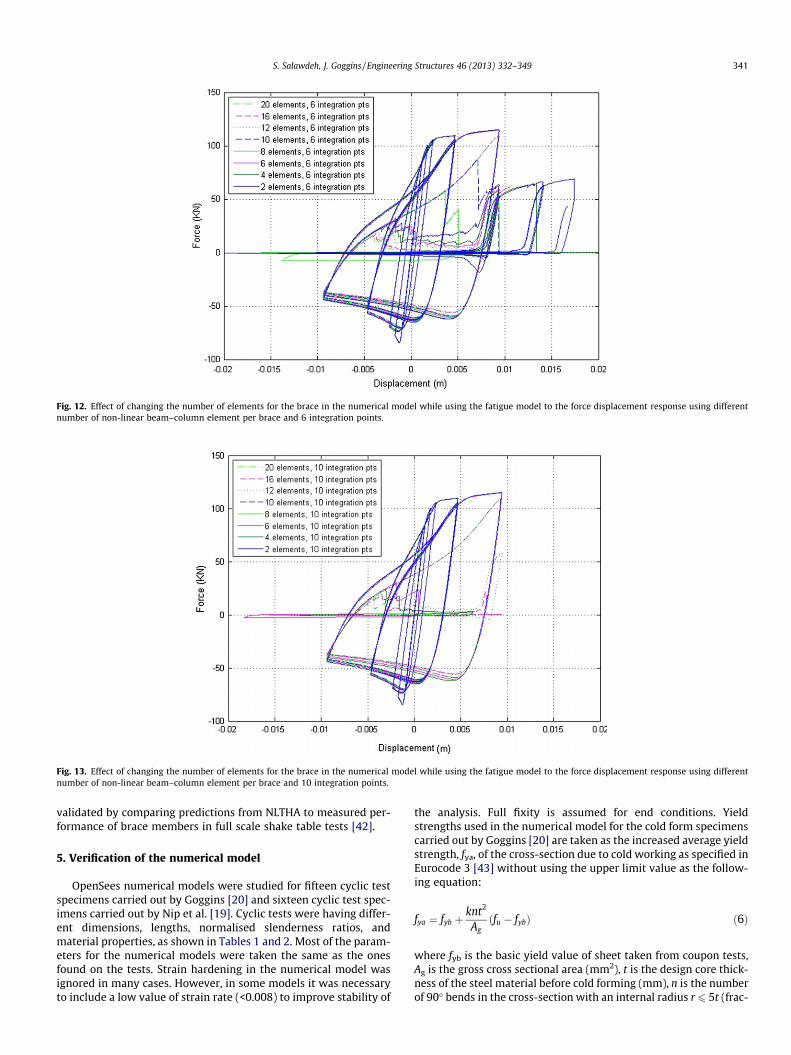
Fig. 13. Effect of changing the number of elements for the brace in the numerical model while using the fatigue model to the force displacement response using differentnumber of non-linear beam–column element per brace and 10 integration points.
Fig. 12. Effect of changing the number of elements for the brace in the numerical model while using the fatigue model to the force displacement response using differentnumber of non-linear beam–column element per brace and 6 integration points.
S. Salawdeh, J. Goggins / Engineering Structures 46 (2013) 332–349 341
validated by comparing predictions from NLTHA to measured per-formance of brace members in full scale shake table tests [42].
5. Verification of the numerical model
OpenSees numerical models were studied for fifteen cyclic testspecimens carried out by Goggins [20] and sixteen cyclic test spec-imens carried out by Nip et al. [19]. Cyclic tests were having differ-ent dimensions, lengths, normalised slenderness ratios, andmaterial properties, as shown in Tables 1 and 2. Most of the param-eters for the numerical models were taken the same as the onesfound on the tests. Strain hardening in the numerical model wasignored in many cases. However, in some models it was necessaryto include a low value of strain rate (<0.008) to improve stability of
the analysis. Full fixity is assumed for end conditions. Yieldstrengths used in the numerical model for the cold form specimenscarried out by Goggins [20] are taken as the increased average yieldstrength, fya, of the cross-section due to cold working as specified inEurocode 3 [43] without using the upper limit value as the follow-ing equation:
fya ¼ fyb þknt2
Agðfu � fybÞ ð6Þ
where fyb is the basic yield value of sheet taken from coupon tests,Ag is the gross cross sectional area (mm2), t is the design core thick-ness of the steel material before cold forming (mm), n is the numberof 90� bends in the cross-section with an internal radius r 6 5t (frac-

342 S. Salawdeh, J. Goggins / Engineering Structures 46 (2013) 332–349
tions of 90� bends are counted as fractions of n), k is a numericalcoefficient that depends on the type of forming (k = 7 for cold rollingand k = 5 for other methods of forming) and fu is the basic ultimatetensile strength of sheet taken from coupon test. Goggins [20] foundthat Eq. (6) gives more accurate results when an upper limit is notapply. For the tests of Nip et al. [19] the yield strengths are taken asthe offset yield strengths with a value set at 0.2% of the strain. Thisoffset yield point is used normally for high strength steel whichdoesn’t exhibit a yield point. It is known that the material proper-ties of cold-formed sections vary around the cross-section due tothe different levels of cold-work during forming. For example,Wilkinson and Hancock [44] found that the yield stress of the shortopposite face of the welded face was on average 10% higher thanthat of the adjacent longer faces in the rectangular hollow sections(RHS). Moreover, they found that the yield stress obtained from thecorner coupons was on average 10% higher than that of the oppositeface. The corner yield strength is higher than the flat faces of theRHS, although the thickness is less than flat sections. In this study,average yield strength taking account of enhanced yield strengthfrom cold forming has been used for the section and same thicknesswas assumed for the perimeter.
A comparison between the hysteretic axial force–axial displace-ment response for the tests and the numerical model is carried outand shown from Figs. 14–35. Tables 1 and 2 give section propertiesof the specimens, normalised slenderness about the Y–Y axis as de-fined in Eurocode 3 [21], ky-y, where the effective length is assumedto be 0.5L, yield strength, fy, initial camber used in the numericalmodel, number of cycles needed to fracture for both physical testsand numerical model. Furthermore, ratios of the maximum tensileforce (Fmax), initial buckling load (Fc), the total energy dissipated bythe specimens (Wtot) and the energy dissipated by the specimens atthe first cycle of ductility of 4 (Wl=4) found from the numericalmodels and those measured from the physical tests are given in Ta-bles 1 and 2.
5.1. Buckling and tensile loads
From Tables 1 and 2, it is found that there is a relatively goodagreement between the numerical model and physical tests results
Fig. 14. (a) Physical test and (b) numerical model load displaceme
Fig. 15. (a) Physical test and (b) numerical model load displaceme
of the maximum tensile forces (Fmax) and initial buckling loads (Fc)for most of the specimens investigated. Moreover, the calibratedmodels had average ratios of numerical model to physical testmodel values for Fmax and Fc of 0.93 and 0.95, respectively, withcorresponding coefficients of variation (CV) of 0.11 and 0.08,respectively (Table 1). The models were validated for cold-formedcarbon steel, hot-rolled carbon steel, and cold-formed stainlesssteel by comparing predictions from the numerical model to find-ings from experimental physical tests carried out by Nip et al. [19],where average ratios of numerical model to physical test modelvalues for Fmax and Fc was 1.08 and 1.00, respectively, with corre-sponding CV values of 0.09 and 0.09, respectively (Table 2). Thus,the equivalent mean values for Fmax and Fc for the total 31 speci-mens studied were 1.01 and 0.98, respectively, with correspondingCV values of 0.12 and 0.09, respectively.
Initial buckling loads obtained from the numerical model werefound to be affected by initial camber provided at the middle of thespecimens, which increases for slender braces with low initialbuckling force. It is noticed that some post buckling cycles ob-tained from the numerical models are fatter and having more postbuckling force than the cycles obtained from the physical tests.One possible explanation would be the limitation of the model thatplane sections are assumed to remain plane, which will not capturethe local buckling at the plastic hinge locations on the specimen.Local buckling phenomenon can be mitigated in practise by usinglow width to thickness ratio and Class 1 cross-section suggestedin Eurocode 3 [21], which can form a plastic hinge with the rota-tion capacity required from plastic analysis without reduction inresistance that may be caused by local buckling.
While comparing the force–displacement response of theexperimental and numerical model for 50�25�2.5�3300-CS-CF-G14 and 50�25�2.5�3300-CS-CF-G15, it is found that the yieldcapacity of the braces in the numerical model is lower than theyield capacity on the experiments (see Fig. 19). A possible explana-tion of that is the specific feature of the cold formed elements ofincreasing locally their yield strength due cold forming. Eventhough the average yield strength defined in Eurocode 3 [43] thattakes into account the effect of cold forming is used, the yield dis-placement for experimental results is found to have higher values
nt hysteretic loops for Specimen 40�40�2.5�1100-CS-CF-G2.
nt hysteretic loops for Specimen 20�20�2.0�1100-CS-CF-G4.
Fig. 16. (a) Physical test and (b) numerical model load displacement hysteretic loops for Specimen 50�25�2.5�1100-CS-CF-G6.
Fig. 17. (a) Physical test and (b) numerical model load displacement hysteretic loops for Specimen 40�40�2.5�3300-CS-CF-G8.
Fig. 18. (a) Physical test and (b) numerical model load displacement hysteretic loops for Specimen 20�20�2.0�3300-CS-CF-G10.
Fig. 19. (a) Physical test and (b) numerical model load displacement hysteretic loops for Specimen 50�25�2.5�3300-CS-CF-G14.
S. Salawdeh, J. Goggins / Engineering Structures 46 (2013) 332–349 343
than the numerical model for these two tests, but was satisfactoryfor all other tests.
5.2. Fracture
For many tests, plastic hinges formed in the brace specimensafter they experienced very large rotational demands and largestrains, which caused fracture due to low cyclic fatigue. The
numerical model incorporating a fatigue model could predict frac-ture after a number of cycles close to the ones obtained in thephysical tests for the specimens tested until fracture occurred(see Tables 1 and 2). However, some of the physical test specimenssuffered from early fracture at end connection, where the weld it-self or the heat affected zone adjacent to the stiffener fracturedduring the physical tests, which is not accounted for in the numer-ical model. For this reason it is found that numerical model for

Fig. 21. (a) Physical test and (b) numerical model load displacement hysteretic loops for Specimen 40�40�3�2050-CS-HR-N17.
Fig. 22. (a) Physical test and (b) numerical model load displacement hysteretic loops for Specimen 40�40�3�1250-CS-HR-N18.
Fig. 23. (a) Physical test and (b) numerical model load displacement hysteretic loops for Specimen 60�60�3�2050-CS-CF-N19.
Fig. 20. (a) Physical test and (b) numerical model load displacement hysteretic loops for Specimen 60�60�3�2050-CS-HR-N16.
344 S. Salawdeh, J. Goggins / Engineering Structures 46 (2013) 332–349
40�40�4.0�2050-CS-CF-N20, 40�40�3.0�2050-CS-CF-N21 and60�40�3.0�2850-SS-CF-N25 had more cycles before capturingfracture as it is developed to have the fracture at the middle ofthe brace element not at the end connections. Specimens40�40X2.5�3300-CS-CF-G7, 40�40�2.5�3300-CS-CF-G8, 40�40X2.5�3300-CS-CF-G9, 50�25�2.5�3300-CS-CF-G13, 50�25�2.5�3300-CS-CF-G14 and 50�25�2.5�3300-CS-CF-G15 were nottested to failure, and all of them survived displacement ductilitydemands between 5.6 and 9.5.
Tremblay [9] proposed a simple approach to find the total duc-tility reached at fracture, lf. This approach is related only to thenormalised slenderness parameter, �k, as follows:
lf ¼ 2:4þ 8:3�k ð7Þ
where lf is the sum of the peak ductility reached in tension and thepeak ductility attained in compression in any cycle before the half-cycle in tension in which failure of the brace is observed.

Fig. 26. (a) Physical test and (b) numerical model load displacement hysteretic loops for Specimen 40�40�3�1250-CS-CF-N22.
Fig. 27. (a) Physical test and (b) numerical model load displacement hysteretic loops for Specimen 60�60�3�2850-SS-CF-N23.
Fig. 28. (a) Physical test and (b) numerical model load displacement hysteretic loops for Specimen 50�50�3�2850-SS-CF-N24.
Fig. 24. (a) Physical test and (b) numerical model load displacement hysteretic loops for Specimen 40�40�4�2050-CS-CF-N20.
Fig. 25. (a) Physical test and (b) numerical model load displacement hysteretic loops for Specimen 40�40�3�2050-CS-CF-N21. Specimen failed at end connection.
S. Salawdeh, J. Goggins / Engineering Structures 46 (2013) 332–349 345

Fig. 31. (a) Physical test and (b) numerical model load displacement hysteretic loops for Specimen 50�50�3�2050-SS-CF-N27.
Fig. 32. (a) Physical test and (b) numerical model load displacement hysteretic loops for Specimen 60�40�3�2050-SS-CF-N28.
Fig. 29. (a) Physical test and (b) numerical model load displacement hysteretic loops for Specimen 60�40�3�2850-SS-CF-N25. Specimen failed at end connection.
Fig. 30. (a) Physical test and (b) numerical model load displacement hysteretic loops for Specimen 60�60�3�2050-SS-CF-N26.
346 S. Salawdeh, J. Goggins / Engineering Structures 46 (2013) 332–349
Moreover, Goggins et al. [17] used their physical test data to de-velop new relationships expressing the displacement ductility, lf,in terms of global slenderness, �k , and width to thickness ratio (b/t) as shown in Eqs. (8) and (9).
lf ¼ �0:68þ 26:2�k ð8Þ
lf ¼ 29:1� 1:07ðb=tÞ ð9Þ
However, Nip et al. [19] proposed new predictive expressions forthe displacement ductility in terms of global slenderness ratio, �k ,and width to thickness ratio (b/t) for hot-rolled carbon steel, cold-formed carbon steel and cold-formed stainless steel as follows:
Hot-rolled carbon steel:
lf ¼ 3:69þ 6:97�k� 0:05ðb=teÞ � 0:19ð�kÞðb=teÞ ð10Þ
Cold-formed carbon steel:
lf ¼ 6:45þ 2:28�k� 0:11ðb=teÞ � 0:06ð�kÞðb=teÞ ð11Þ
Cold-formed stainless steel:
lf ¼ �3:42þ 19:86ð�kÞ þ 0:11ðb=teÞ � 0:64ð�kÞðb=teÞ ð12Þ

Fig. 35. (a) Physical test and (b) numerical model load displacement hysteretic loops for Specimen 60�40�3�1250-SS-CF-N31.
Fig. 33. (a) Physical test and (b) numerical model load displacement hysteretic loops for Specimen 60�60�3�1250-SS-CF-N29.
Fig. 34. (a) Physical test and (b) numerical model load displacement hysteretic loops for Specimen 50�50�3�1250-SS-CF-N30.
S. Salawdeh, J. Goggins / Engineering Structures 46 (2013) 332–349 347
where �k is the normalised slenderness ratio, b is the width ofthe wider face of the section, t is the thickness of the section ande ¼
ffiffiffiffiffiffiffiffiffiffiffiffiffiffiffi235=fy
pwhere fy is the yield strength.
Fig. 36 compares predicted displacement ductility values ob-tained from the numerical model to those obtained from theexpressions established by Nip et al. [19]. It is found that Nip etal. [19] expressions for predicting displacement ductility givesclose results to the values obtained from the numerical model.However, these relationships overestimated the displacement duc-tility for very slender specimens with slenderness ratio more thanthree as shown in Fig. 36.
Fig. 36. Comparison of displacement ductility, l, values obtained from theexpressions established by Nip et al. [19] to the numerical model results.
5.3. Energy dissipated
As shown in Tables 1 and 2, and Fig. 37, the numerical modelgave good predictions of the total energy dissipated, Wtot, and en-ergy dissipated at the first cycle of ductility of 4, Wl=4, when com-pared to the results obtained from the physical tests during cyclicloading. However, some cycles obtained from the numerical mod-els were found to be fatter than the cycles obtained from the tests,specifically for stockier specimens as the numerical model couldnot capture the local buckling. This is the reason why the energy
dissipated results predicted from numerical model was slightlymore than the energy dissipated from physical tests. Total energydissipation for specimens 40�40�4.0�2050-CS-CF-N20, 40�40�3.0�2050-CS-CF-N21 and 60�40�3.0�2850-SS-CF-N25, whichsuffered from early fracture at end connection was less than the

Fig. 37. Energy dissipated by specimens in physical tests [16,19] and the numerical models.
Fig. 38. Energy index versus slenderness for the first cycle at a ductility of four measured in physical tests [16,19] and obtained from numerical models.
348 S. Salawdeh, J. Goggins / Engineering Structures 46 (2013) 332–349
energy dissipated obtained from the numerical model having morehysteretic cycles. However, for the specimens that survived 10 ormore cycles, good correlation of energy dissipated were foundwhen comparing the energy dissipated up to the 10th cycle (seeFig. 37).
Similar to the observations in the measured hysteretic loops ofthe physical test specimens, the stockier specimens dissipatedmore energy due to their larger cross-sectional areas and the sig-nificant yield plateaus they exhibited. Fig. 38 shows the energy in-dex (the area under the load–axial deflection curve in both tensionand compression regions during the first cycle at a ductility level of4 normalised to the elastic energy of the strut) plotted against thenormalised slenderness ratio. This shows how the energy dissi-pated is reduced with brace slenderness. As can be seen fromFig. 38, the numerical model gives good average prediction of theenergy index of the first cycle at ductility of four for specimensover a large range of slenderness.
6. Summary and conclusion
In this paper, a study of the behaviour of braces, which are themain elements to dissipate energy in concentrically braced frames,is carried out. A numerical model is developed and found to becapable to simulate the hysteretic behaviour of braces. Nonlinearbeam column elements with distributed plasticity are used, wherethe cross section of the brace is divided into fibres along the perim-eter and across the thickness. In this model, the brace is suggestedto be divided into a minimum of two elements using ten integra-tion points per element. An initial camber on the middle of thebrace is used to account for the overall buckling and a value be-tween 0.1% and 1% of the length of the brace is found to give thebest results for the first buckling load. A low cyclic fatigue modelwith new parameters is proposed and used to wrap the fibre basednonlinear beam column model in order to capture fracture in thebraces. It has been shown in this study that this model can accu-

S. Salawdeh, J. Goggins / Engineering Structures 46 (2013) 332–349 349
rately predict the maximum displacement ductility demand of thebrace members when fracture occurs.
In general, good agreement was found between the main re-sponse parameters of the numerical and physical tests. For exam-ple, average ratios of the maximum measured values to thoseobtained from the numerical model for tensile forces (Fmax) andinitial buckling loads (Fc) for the physical tests carried out byGoggins [20] and Nip et al. [19], excluding tests which failed atend connection, were 1 and 0.98, respectively. The correspondingcoefficients of variation (CV) were 0.13 and 0.09, respectively.Moreover, the mean values of the ratio of the total energy dissi-pated (Wtot) and the energy dissipated at the first cycle of ductilityof 4 (Wl = 4) for the numerical model and the physical tests carriedout by Goggins [20] and Nip et al. [19], excluding tests which failedat end connection, were found to be 1.30 and 1.12, respectively.The corresponding coefficients of variation (CV) were 0.32 and0.18, respectively. There was a difference in the response betweenthe numerical model and some tests in the post buckling range andthe hysteretic loops were fatter. One possible reason is that themodel does not account for local buckling which should be takeninto account in future research. However, in general the modelscaptured the salient response parameters observed in the physicaltests.
Acknowledgements
The fellowship provided by the College of Engineering and Infor-matics at the National University of Ireland, Galway is gratefullyacknowledged by the first author. Data provided from colleaguesat Imperial College in London is also gratefully acknowledged.
References
[1] Kahn LF, Hanson RD. Inelastic cycles of axially loaded steel members. J StructDiv ASCE 1976;102(5):947–59.
[2] Popov EP, Zayas VA, Mahin SA. Cyclic inelastic buckling of thin tubularcolumns. J Struct Div ASCE 1979;105(ST11):2261–77.
[3] Black GR, Wenger BA, Popov EP. Inelastic buckling of steel struts under cyclicload reversals. UCB/EERC-8O/4O. Berkeley (CA): Earthquake EngineeringResearch Center; 1980.
[4] Jain AK, Goel SC, Hanson RD. Hysteretic cycles of axially loaded steel members.J Struct Div ASCE 1980;106(8):1777–95.
[5] Popov EP, Black RG. Steel struts under severe cyclic loadings. J Struct Div ASCE1981;107(9):1857–81.
[6] Ballio G, Perotti F. Cyclic behavior of axially loaded members – numerical-simulation and experimental-verification. J Construct Steel Res1987;7(1):3–41.
[7] Archambault MH. Etude du comportement séismique des contreventementsductiles en X avec profiles tubulaires en acier. EPM/GCS-1995-09. Montréal(Que): Department of Civil Engineering, école Polytechnique; 1995.
[8] Mamaghani IHP, Usami T, Mizuno E. Inelastic large deflection analysis ofstructural steel members under cyclic loading. Eng Struct 1996;18(9):659–68.
[9] Tremblay R. Inelastic seismic response of steel bracing members. J ConstructSteel Res 2002;58(5–8):665–701.
[10] Zhao XL, Grzebieta RH, Lee C. Void Filled cold-formed RHS braces subjected tolarge deformation cyclic axial loading. J Struct Eng ASCE 2002;128(6):747–53.
[11] Elchalakani M, Zhao X-L, Grzebieta R. Tests of cold-formed circular tubularbraces under cyclic axial loading. J Struct Eng 2003;129(4). 507-514.
[12] Shaback B, Brown T. Behaviour of square hollow structural steel braces withend connections under reversed cyclic axial loading. Canadian J Civ Eng2003;30(4):745–53.
[13] Tremblay R, Archambault MH, Filiatrault A. Seismic response of concentricallybraced steel frames made with rectangular hollow bracing members. J StructEng 2003;129:1626–36.
[14] Broderick BM, Goggins JM, Elghazouli AY. Cyclic performance of steel andcomposite bracing members. J Construct Steel Res 2005;61(4):493–514.
[15] Elghazouli AY, et al., Shake table testing of tubular steel bracing members. ProcInst Civ Eng – Struct Build 2005; 158(4): 229–41.
[16] Goggins JM et al. Experimental cyclic response of cold-formed hollow steelbracing members. Eng Struct 2005;27(7):977–89.
[17] Goggins JM et al. Behaviour of tubular steel members under cyclic axialloading. J Construct Steel Res 2006;62(1–2):121–31.
[18] Broderick BM, Elghazouli AY, Goggins J. Earthquake testing and responseanalysis of concentrically-braced sub-frames. J Construct Steel Res2008;64:997–1007.
[19] Nip KH, Gardner L, Elghazouli AY. Cyclic testing and numerical modelling ofcarbon steel and stainless steel tubular bracing members. Eng Struct2010;32(2):424–41.
[20] Goggins J. Earthquake resistant hollow and filled steel braces. PhD thesis.Dublin: Trinity College, University of Dublin; 2004.
[21] CEN, Eurocode 3: Design of steel structures – Part 1–1: General rules and rulesfor buildings. 2005, EN 1993-1-1:2005/AC:2009.
[22] ECCS –Technical Committee 1. Structural Safety and Loadings – TechnicalWorking Group 1.3. Seismic design recommended testing procedure forassessing the behaviour of structural steel elements under cyclic loads, 1986,1st ed. Brussels; 1986.
[23] CEN, Eurocode 8, design of structures for earthquake resistance – Part 1:General rules, seismic actions and rules for buildings. 2004, EN 1998–1:2004/AC:2009.
[24] McKenna F, Fenves GL, Scott MH, Object oriented program, OpenSees; Opensystem for earthquake engineering simulation; 2000. <http://www.opensees.berkeley.edu>.
[25] Uriz P. Towards earthquake resistant design of concentrically braced steelbuildings. Berkeley: Department of Civil and Environmental Engineering,University of California; 2005.
[26] Spacone E, Filippou FC, Taucer FF. Fiber beam-column model for nonlinearanalysis of R/C frames. I: Formulation. Earthquake Eng Struct Dyn1996;25(7):711–25.
[27] Filippou FC, Fenves GL. Methods of analysis for earthquake-resistantstructures. Earthquake engineering: from engineering seismology toperformance-based engineering. Boca Rotan (FL, United States); CRC Press;2004 [chapter 6].
[28] Wijesundara KK. Design of concentrically braced steel frames with RHS shapebraces. PhD thesis. Pavia: European Centre for Training and Research inEarthquake Engineering (EUCENTRE); 2009.
[29] Duggan TV, Byrne J. Fatigue as a design criterion. The Macmillan press Ltd.;1977.
[30] ASTM, E 1049–85, Standard practices for cycle counting in fatigue analysis.ASTM International; 2005.
[31] Gugerli H. Inelastic cyclic behavior of steel members. Ann Arbor(MI): Department of Civil Engineering, University of Michigan; 1982.
[32] Lee S, Goel S. Seismic behavior of hollow and concrete-filled square tubularbracing members. UMCE 87-11. Ann Arbor (MI): Department of CivilEngineering, University of Michigan; 1987.
[33] Shermann D. Designing with structural tubing. Eng J AISC 1996:(3rdQuarter);101–9.
[34] Xue L. A unified expression for low cycle fatigue and extremely low cyclefatigue and its implication for monotonic loading. Int J Fatigue 2008;30(10–11):1691–8.
[35] ASTM, ASTM E-1049 – Standard practices for cycle counting in fatigue analysis.West Conshohocken (PA); 2003.
[36] Fisher J, Kulak G, Smith I, A fatigue primer for structural engineers. ATLSSReport No. 97-11. National Steel Bridge Alliance, AISC: Chicago (IL); 1997.
[37] Manson SS. Behaviour of materials under conditions of thermal stress. In: HeatTransfer Symposium. University of Michigan Engineering Research Institute;1953, p. 9–75.
[38] Coffin L. A study of the effect of cyclic thermal stresses on a ductile metal.Trans ASME 1954;1954(76). 931–50.
[39] Stephens RI et al. Metal fatigue in engineering. John Wiley & Sons, Inc.; 2001.[40] Nip KH et al. Extremely low cycle fatigue tests on structural carbon steel and
stainless steel. J Const Steel Res 2010;66(1):96–110.[41] Santagati S, Bolognini D, Nascimbene R. Strain life analysis at low-cycle fatigue
on concentrically braced steel structures with RHS shape braces. J EarthquakeEng 2012;16(Suppl. 1):107–37.
[42] Goggins J, Salawdeh S. Validation of non-linear time history analysis modelsfor single storey concentrically braced frames using full scale shake table tests.Earthquake Eng Struct Dyn, in press.
[43] CEN, Eurocode 3 – Design of steel structures – Part 1–3: General rules –Supplementary rules for cold-formed members and sheeting; 2006, EN 1993–1-3:2006/AC:2009.
[44] Wilkinson, Hancock. Tests to examine compact web slenderness of cold-formed RHS. J Struct Eng 1998;124(10):1166–74.


![[How to] Goldcard Calibrate Y-Cable](https://static.fdocuments.net/doc/165x107/55cf98a0550346d03398c118/how-to-goldcard-calibrate-y-cable.jpg)