
Numerical modelling of the underground roadways in coal ...
13
JME Journal of Mining & Environment, Vol. 9, No. 3, 2018, 593-604. DOI: 10.22044/jme.2018.6633.1485 Numerical modelling of the underground roadways in coal mines– uncertainties caused by use of empirical-based downgrading methods and in situ stresses M. Zoorabadi 1 and 2 1. Senior Geotechnical Engineer, SCT Operations, Wollongong, Australia 2. School of Mining Engineering, University of New South Wales, Sydney, Australia Received 15 January 2018; received in revised form 21 February 2018; accepted 21 February 2018 Corresponding author: [email protected]; [email protected] (M. Zoorabadi). Abstract Numerical modelling techniques are not new for mining industry and civil engineering projects anymore. These techniques have been widely used for rock engineering problems such as stability analysis and support design of roadways and tunnels, caving and subsidence prediction, and stability analysis of rock slopes. Despite the significant advancement in the computational mechanics and availability of high speed computing hardware, the input data and constitutive models remain the main source of errors affecting the reliability of numerical simulations. The problem with the input data has been deepened more by introducing empirical-based methods such as GSI classification to downgrade the rock properties from laboratory scale to field scale. The deformability modulus and strength parameters are the main outputs of these downgrading techniques. Numerical modelling users simply apply these downgrading methods and run the model without considering the real mechanics behind the stress induced failure and deformation around the underground excavations. While to the contrary to the commonly used downgrading methods that produce a constant modulus for rock at all depths, the rock modulus is stress dependent and varies with depth. In addition to this, the mechanism of stress induced displacement is not similar to the deformation of a continuum model simulated with equivalent rock properties. Apart from the mechanical characteristics of rocks, the magnitude and orientation of in-situ stresses are two other important parameters that have significant impacts on stress induced rock fracturing. The impacts of these two parameters have also been neglected in many practical cases. This paper discuss this old fashioned topic in more details with presenting the known facts and mechanics which numerical modelling users ignore them due to the unquestioning acceptance of downgrading methods. It also covers the influence of the stress magnitude and orientation on stress induced rock fracturing. Keywords: Numerical Modelling, Rock Failure, Empirical Methods, In Situ Stresses. 1. Introduction Underground excavations including roadways, panels, and stopes are means of access and extracting the underground reserves in mining industry. In addition, excavation of the underground structures is a common practice in civil engineering for infrastructure projects such as road tunnels, underground power plants, and underground storages. For all these cases, the underground excavations are created in rocks which their stability analysis and design impose a number of different challenges to both civil and mining projects. Instabilities could cause a significant damage to the equipment, disruption to the operation/project or worse, fatalities with significant financial or social consequences. Over the years, several methods have been introduced to assess stability of the underground excavations. All these methods can be classified into three main groups of empirical methods, numerical modelling methods and analytical
Transcript of Numerical modelling of the underground roadways in coal ...

JME Journal of Mining & Environment, Vol. 9, No. 3, 2018, 593-604.
DOI: 10.22044/jme.2018.6633.1485
Numerical modelling of the underground roadways in coal mines–
uncertainties caused by use of empirical-based downgrading methods and
in situ stresses
M. Zoorabadi
1 and 2
1. Senior Geotechnical Engineer, SCT Operations, Wollongong, Australia
2. School of Mining Engineering, University of New South Wales, Sydney, Australia
Received 15 January 2018; received in revised form 21 February 2018; accepted 21 February 2018
Corresponding author: [email protected]; [email protected] (M. Zoorabadi).
Abstract
Numerical modelling techniques are not new for mining industry and civil engineering projects anymore.
These techniques have been widely used for rock engineering problems such as stability analysis and support
design of roadways and tunnels, caving and subsidence prediction, and stability analysis of rock slopes.
Despite the significant advancement in the computational mechanics and availability of high speed
computing hardware, the input data and constitutive models remain the main source of errors affecting the
reliability of numerical simulations. The problem with the input data has been deepened more by introducing
empirical-based methods such as GSI classification to downgrade the rock properties from laboratory scale
to field scale. The deformability modulus and strength parameters are the main outputs of these downgrading
techniques. Numerical modelling users simply apply these downgrading methods and run the model without
considering the real mechanics behind the stress induced failure and deformation around the underground
excavations. While to the contrary to the commonly used downgrading methods that produce a constant
modulus for rock at all depths, the rock modulus is stress dependent and varies with depth. In addition to
this, the mechanism of stress induced displacement is not similar to the deformation of a continuum model
simulated with equivalent rock properties. Apart from the mechanical characteristics of rocks, the magnitude
and orientation of in-situ stresses are two other important parameters that have significant impacts on stress
induced rock fracturing. The impacts of these two parameters have also been neglected in many practical
cases. This paper discuss this old fashioned topic in more details with presenting the known facts and
mechanics which numerical modelling users ignore them due to the unquestioning acceptance of
downgrading methods. It also covers the influence of the stress magnitude and orientation on stress induced
rock fracturing.
Keywords: Numerical Modelling, Rock Failure, Empirical Methods, In Situ Stresses.
1. Introduction
Underground excavations including roadways,
panels, and stopes are means of access and
extracting the underground reserves in mining
industry. In addition, excavation of the
underground structures is a common practice in
civil engineering for infrastructure projects such
as road tunnels, underground power plants, and
underground storages. For all these cases, the
underground excavations are created in rocks
which their stability analysis and design impose a
number of different challenges to both civil and
mining projects. Instabilities could cause a
significant damage to the equipment, disruption to
the operation/project or worse, fatalities with
significant financial or social consequences.
Over the years, several methods have been
introduced to assess stability of the underground
excavations. All these methods can be classified
into three main groups of empirical methods,
numerical modelling methods and analytical

Zoorabadi/ Journal of Mining & Environment, Vol. 9, No. 3, 2018
594
methods. Empirical methods forecast the rock
behaviour and propose support system by
comparing the geotechnical characteristics of the
projects with historical dataset and experiences
[1]. Although the reliability of these methods is in
dispute, they are still common in both mining and
civil engineering projects due to their simplicity to
use.
Analytical methods use the fundamentals of the
solid mechanics and provide formulations to
calculate the stress distribution and the
corresponding displacement around the
excavations. Although these methods rely on too
many assumptions and simplifications which limit
their application for practical cases, they are
brilliant for the initial analysis and understanding
of the mechanics.
Numerical modelling methods are not new for
both mining and civil engineering projects
anymore. These methods have been applied for
almost all these projects to assess the stability and
to design the support system. Over the last two
decades, several commercial software packages
have been introduced to the industry. They have
been developed on the basis of various numerical
modelling techniques such as finite element, finite
difference, distinct element, boundary element
and combined methods [2]. The rapid advance in
high speed computing hardware has also
facilitated the use of numerical modelling in
practice. Despite all these developments and
acceptances, numerical modelling methods still
suffer from an old fashioned problem that is the
input data. In fact, the numerical modelling is
absolutely a calculator that uses input data,
conducts a series of mathematical operations, and
gives outputs as the model results.
As a common practice, most numerical modelling
users downgrade the rock mass strength and
deformability data from laboratory results through
empirical based methods. The GSI classification
is the most well-known method for this
downgrading approach [3]. It is very easy to use
and it produces the required data very quickly.
The users apply this method and build an
equivalent continuum model and job done. The
unquestioning acceptance of this approach results
in just some well-presented and coloured graphs
and pictures that in most cases do not match with
the real behaviour of the underground structures.
In addition to the strength and deformability
characteristics, the magnitude and orientation of
in-situ stresses are two other parameters that have
significant impacts on the stress induced
fracturing and displacement of the underground
excavation.
This paper discussed the mechanism of stress
induced fracturing, and put insights into errors
which are raised by blindly using of the rock
strength and deformability downgrading
techniques. It also shows how important is the
stress magnitude and orientation for a reliable
stability assessment of the underground
excavation. The data from some real underground
roadways in Australian coal mines were used to
discuss the topic of the paper.
2. Instability modes for underground
excavations
Instabilities in underground excavations can be
classified in three groups: 1) structurally
controlled instabilities caused by pre-existing
discontinuities; 2) instabilities caused by stress
induced rock fracturing; 3) combination of stress
induced fracturing and pre-existing discontinuities
[4].
Intersection of the pre-existing discontinuities
forms blocks and they might fall or slide into the
underground exaction when they have been cut by
the excavation boundaries (Figure 1). Instability
of the rock blocks is highly depended to their
geometry and the frictional resistance of their
forming surfaces [5]. For the blocks with sliding
mode of movement, shear resistance on the sliding
joints controls the stability. For all structurally
controlled instabilities, stress around the
excavation only has an impact on the frictional
resistance of the joint surface. Since a larger size
underground excavation provides a larger void for
movement of the larger rock blocks, this type of
instability should be assessed in more detail for
larger excavations.
Figure 1. Rock blocks formed by intersection of pre-
existing discontinuities and excavation boundaries
[5].

Zoorabadi/ Journal of Mining & Environment, Vol. 9, No. 3, 2018
595
The stress induced rock fracturing and associated
displacements directly control the second and
third types of instabilities. Underground
excavations disturb equilibrium state of the in-situ
stress and impose a new stress distribution [4].
Depending on the excavation geometry and in-situ
stress tensor, magnitude of stress distribution
(concentration) varies around the excavation.
When magnitude of the new distributed stress
exceeds the strength of the intact rocks (not rock
mass), it causes rock fracturing.
The shear and extension (tensile) failure modes
are two possible failure modes for a rock under
triaxial and uniaxial loading conditions [6]. Both
failure modes have been widely accepted by the
industry and academics, and are included in all
commercial numerical modelling software
packages. The shear failure mode happens when
the applied maximum principal stress exceeds the
confined strength of the rock. On the basis of the
Mohr-Coulomb failure criteria, the shear plane is
oriented at an angle equal to ⁄ ⁄ with the
orientation of . For tension failure, the
minimum principal stress is positive and is higher
than the tensile strength of the rock.
Except for the rockburst event where a volume of
rock fails in a violent way and breaks down to
small pieces, rock fracturing occurs gradually as
forming of a new fracture. Apart from the visible
fracture plane, the rest of the rock volume also
experiences micro-fracturing, which is not visible.
This mechanism was observed in the laboratory
scale like the triaxial tests [7]. At the end of the
test, the macro-fracturing plane is visible as a
shear plane. Micro-fracturing affects the
deformability and strength (called softening in this
paper) of the rock blocks in both sides of the
failure plane (Figure 2).
The bearing capacity in the direction of failure
plane is dropped to the residual strength of the
failure plane. The plastic deformation of the
softening zone due to its weight or because of
acting stress is added to the initial elastic
deformation which can be detected by a
monitoring system.
Intersection of the stress induced rock fractures
with the pre-existing discontinuities can formes a
removable block. The stability of these blocks
again depends on their geometry relative to the
excavation and the frictional resistance of their
limiting surfaces.
Figure 2. Micro-crack development and visible fracturing state observed in laboratory scale [7].
3. Uncertainties caused by use of downgrading
methods
As mentioned earlier, rock strength and rock
stress are the main parameters that control rock
fracturing. Rock fails when the rock stress
exceeds the rock strength. On the basis of the
author’s experience, for a cost effective 2D
numerical modelling of an underground roadway
in a coal mine (with a width of 5 m and a height
of 3 m), the element size is around 10 cm * 20 cm
(rectangular zone size in FLAC2D). For a 3D
model (FLAC3D) of the same roadway which
takes at least 5-7 days to simulate 15 m length of
the roadway, the element size is 10 cm * 20 cm *
25 cm. All the mesh based numerical modelling
methods check the failure state of the individual
zones for an elastic-plastic modelling (Figure 3).
In fact, the software compares the strength of each

Zoorabadi/ Journal of Mining & Environment, Vol. 9, No. 3, 2018
596
zone with the maximum stress acting on that zone.
At the end of modelling, the software determines
the failure zone around the roadway and
corresponding displacements. Therefore, the final
behaviour of the roadway is assessed by
considering the failure mode and deformation of
the individual zones as a whole system.
The following equation has been presented by [3]
to calculate the downgrading ratio for the strength
of the rock using the GSI classification:
1
4 ( 8 )( / 4
2(1 )(2 )
a
b b bcm
ci
m s a m s m s
a a
(1)
where is the strength of rock mass, is the
strength of intact rock, and , , and are
constant parameters depending on the rock type
and GSI value of the rock. The following
equations are used to calculate the values of ,
, and :
100exp( )
28 14
b i
GSIm m
D (2)
100exp( )
9 3
GSIs
D (3)
/15 20/31 1( )
2 6
GSIa e e (4)
Figure 3. Failure modes around a coal mine roadway obtained using 2D and 3D modelling [8].
where, is the disturbance factor which is
estimated by using a provided descriptive
classification; it is 0 for very well-controlled
blasting practice and for mechanized excavation.
is the Hoek-Brown failure criteria constant for
intact rock, which normally varies between 5 and
30 for different rocks.
For most of the coal measure rocks, there are three
main pre-existing discontinuities including
bedding planes, and two joint sets perpendicular
to the bedding planes [9]. Therefore from the GSI
classification methods, GSI value for a blocky
rock mass formed by 3 or 4 joint sets varies from
50 to 70 for the surface quality of poor to good
conditions (Figure 4). From Equation (1), for a
rock mass with GSI values of 50-70 and = 17
(typical value for sandstone) the downgrading
ratio varies from 0.2 to 0.33. As seen in this
figure, GSI-based downgrading method produces
a downgrading ratio of 0.68 for a rock with
GSI = 90. When GSI = 100 which presents an
absolute intact rock, the downgrading value is 1.2,
which is an unacceptable value.
When this downgrading method is applied to a
numerical model, it is assumed that all the
numerical model zones have same GSI values. For
coal measure rocks, this assumption means that all
numerical zones have at least 3 discontinuity sets.
This is a very conservative assumption (Figure 5).
For typical Bulli seam coal measure rocks
(located in Illawarra colliery, NSW Australia), a
downgrading ratio of 0.25 was applied to the UCS
of the strata surrounding a roadways located 500
m below the ground surface. The 3D numerical
modelling of this roadway gives a very unreliable
displacement that interrupted the simulation
process and the model could not run further
(Figure 6). This modelled behaviour is completely
different from the monitored behaviour of the
typical roadways during development. This
example simply shows that the downgrading ratio
unreliably reduces the strength of the coal
measures rocks and thus is not acceptable.

Zoorabadi/ Journal of Mining & Environment, Vol. 9, No. 3, 2018
597
In addition to the strength of the rocks,
downgrading methods for deformability modulus
also imposes a big uncertainty to the numerical
modelling. Over the years, too many empirical
equations have been introduced by researchers
and engineers by correlating the field
measurements with well-known classification
systems such as RMR, Q, GSI, and RMi, Shen et
al., (2012) [10] listed these equations as Table 1
Figure 4. Typical GSI table [3].
.

Zoorabadi/ Journal of Mining & Environment, Vol. 9, No. 3, 2018
598
Figure 5. Downgrading ratio on basis of GSI classification.
Figure 6. UCS variation of typical Bulli seam coal measure rocks and failure modes for downgrading ratio of
0.25.
0
0.1
0.2
0.3
0.4
0.5
0.6
0.7
0.8
0.9
1
00.20.40.60.81
σcm
/σci
GSI

Zoorabadi/ Journal of Mining & Environment, Vol. 9, No. 3, 2018
599
Table 1. Empirical equations using RMR and GSI [10].
Input parameters Empirical equations
Group 1 RMR Bieniawski (1978) mE 2RMR 100,RMR 50
Serafim and Pereira (1983) (RMR 10)/40mE 10
Mehrotra (1992) (RMR 20)/38mE 10
Read et al. (1999) 3mE 0.1(RMR / 10)
Group 2 RMR and Ei Nicholson and Bieniawski (1990) RMR
2 22.83m iE 0.01E (0.0028RMR 0.9e
Mitri et al. (1994) m iE E [0.5(1 (cos( RMR / 100)))]
Sonmez et al. (2006) ((RMR 100)(100 RMR))/(4000exp( RMR/100))m iE E 10
Group 3 GSI and D Hoek et al. (2002) (GSI 10)( )
40m ciE (1 0.5D)10 , 100MPa
Hoek and Diederichs (2006) 5m (75 25D GSI)/11)
1 0.5DE (MPa) 10 ( )
1 e
Group 4 GSI, D and Ei Carvalho (2004) 0.25m i
GSI 100E E (s) ,s exp( )
9 3D
Sonmez et al. (2004) a 0.4 GSI/15 20/3m i
GSI 100 1E E (s ) ,s exp( ),a 0.5 (e e )
9 3D 6
Hoek and Diederichs (2006) m i ((60 15D GSI)/11)
1 0.5DE E (0.02 )
1 e
Group 5 GSI, D and ci Hoek and Brown (1997) GSI 10( )
ci 40mE 10
100
Hoek et al. (2002) GSI 10( )
ci 40m ciE (1 0.5D) 10 , 100MPa
100
Beiki et al. (2010) 2 3m ciE tan 1.56 (ln(GSI))
Deformability of the jointed rocks is controlled by
deformation of the intact rock blocks and
pre-existing discontinuities [3]. Zoorabadi (2010),
[11], performed a parameter study on some of the
existing empirical equations to explore the
contribution of the intact rock and the rock mass
condition to the deformability modulus estimated
from those equations. It was found that in the
Hoek and Brown (1997)’s equation, intact rock
properties (UCS) had small contribution to the
rock mass modulus. This condition was modified
in the Hoek and Diederichs (2006)’s equation
(most common equation in practise) which
considers more contribution for the intact rock
property (Figures 7a, b).
Stress dependency of the deformability modulus
that was not considered in the empirical equation
is the main shortcoming of all these equations.
Deformability of the rock discontinuities and
rotation of the rock block have significant
influences on the deformability of the jointed
rocks located at ground surface, where the stress
level is negligible.
A normal stress applied on a rock fracture causes
the fracture to close and decreases the aperture.
Goodman (1989), [4], performed laboratory tests
and found a significant nonlinear relationship
between the applied stress and the fracture
closure. He also found that the nonlinear trend
approaches an asymptote at high stress values.
Therefore, deformability of the rock mass
containing discontinuities would have different
values at different depth or stress level.
Zoorabadi (2016), [12] applied the analytical
formulation proposed by Li (2002) and developed
an approach to assess the variation in the
deformability modulus at different depths. This
technique was applied to a real case whit the rock
mass including 4 pre-existing discontinuities. The
elastic modulus obtained from laboratory tests for
the intact rock was 16 GPa. The GSI value for the
rock mass estimated from the available geological
information varied between 60 and 70 with an
average of 65. For this average GSI value, the
deformability modulus calculated using the
equations proposed by Hoek and Diederichs
(2006) is approximately 10 GPa.
The variation in the deformability modulus with
depth calculated by the approach proposed by [12]
is shown in Figure 8. This figure shows that the
deformability modulus of this case at the ground
surface (zero acting normal stress was assumed) is

Zoorabadi/ Journal of Mining & Environment, Vol. 9, No. 3, 2018
600
approximately 7.2 GPa. This value is around
0.45% of the elastic modulus of the intact rock
and demonstrates the controlling contribution of
the discontinuity to the deformability of the block.
Deformability modulus of the rock mass block
increases significantly with increase in depth. As
it can be seen, just at the 50 m depth, it would
have a magnitude of 12.5 GPa which is 0.78% of
the elastic modulus of the intact rock. For depths
deeper that 200 m, the deformability modulus of
the rock mass block would be more that 90% of
the elastic modulus of the intact rock. These
results highlight a decreasing trend for the
contribution of the pre-existing discontinuities to
deformability of the jointed rocks when depth
increases.
Figure 7. Parameter study on empirical-based deformability modulus equations [11].
Figure 8. Variation of deformability modulus with depth [12].

Zoorabadi/ Journal of Mining & Environment, Vol. 9, No. 3, 2018
601
4. Uncertainties caused by stress magnitude
and orientation
In situ stress tensor acting on a rock at depth
consists of one vertical component and two
horizontal components (Figure 9). The vertical
stress is generated by the overburden strata weight
and increases proportional to the depth. It is
expected that the overburden load increases
2.2 - 2.5 MPa per 100 m depth [13].
Figure 9. Stress acting on rock at depth [9].
The horizontal stress components are generated
due to two source of reactions one from
overburden stress ( and the other from the
tectonic forces ( ) as follows [14]:
H H G H T (5)
The horizontal stress generated as a reaction to the
overburden stress comes from the lateral
movement and the Poisson impact. Magnitude of
the Poisson reaction to the overburden stress is
calculated as follows:
1
H G V
(6)
where is the Poisson ratio for rock. For a
Poisson ratio of 0.25, the overburden contribution
to the horizontal stress is approximately ⁄ .
The lateral movement of the continental plates
forming the Earth’s crust is another main source
for the horizontal stress components. The
continental drift, which is monitored by the
satellite global positioning system, moves the
continents at a few centimetres per year, causing
collisions and shearing along the continental
boundaries [15]. This movement acts as a force
applied to the Earth’s crust that increases the
horizontal stresses.
As a common practice for the numerical
modelling, a constant ratio between the horizontal
stress and the vertical stress is used to initialise
the in situ stresses for the whole model.
Additionally, since the 2D model is easier and
cost effective, the impact of stress orientation on
the numerical modelling is ignored in practice.
When an underground excavation is constructed
in a geological domain with the same elastic
modulus, the assumption for a constant stress ratio
is reasonable. However for a stratified ground
such as coal measure rocks where the elastic
modulus of the strata varies significantly, this
assumption causes a significant error for
numerical modelling.
The tectonic force generated by continental plate
movement is applied as a force to the Earth’s
crust. When the crust is formed from material
units with different elastic modulus, the horizontal
stress developed in each unit would be different.
This concept was well presented by [14], as in
Figure 10. Based on this concept, the horizontal
stress magnitude is typically proportional to the
stiffness of the material in which the measurement
was taken. The horizontal stress in softer strata is
lower than the stress in the stiffer units. The
minimum horizontal stress is also affected by
material stiffness whose direction is 90 degree to
the maximum horizontal stress.
Figure 10. Concept of variation of horizontal stress
developed in different layers [14].
Zoorabadi/ Journal of Mining & Environment, Vol. 9, No. 3, 2018
602
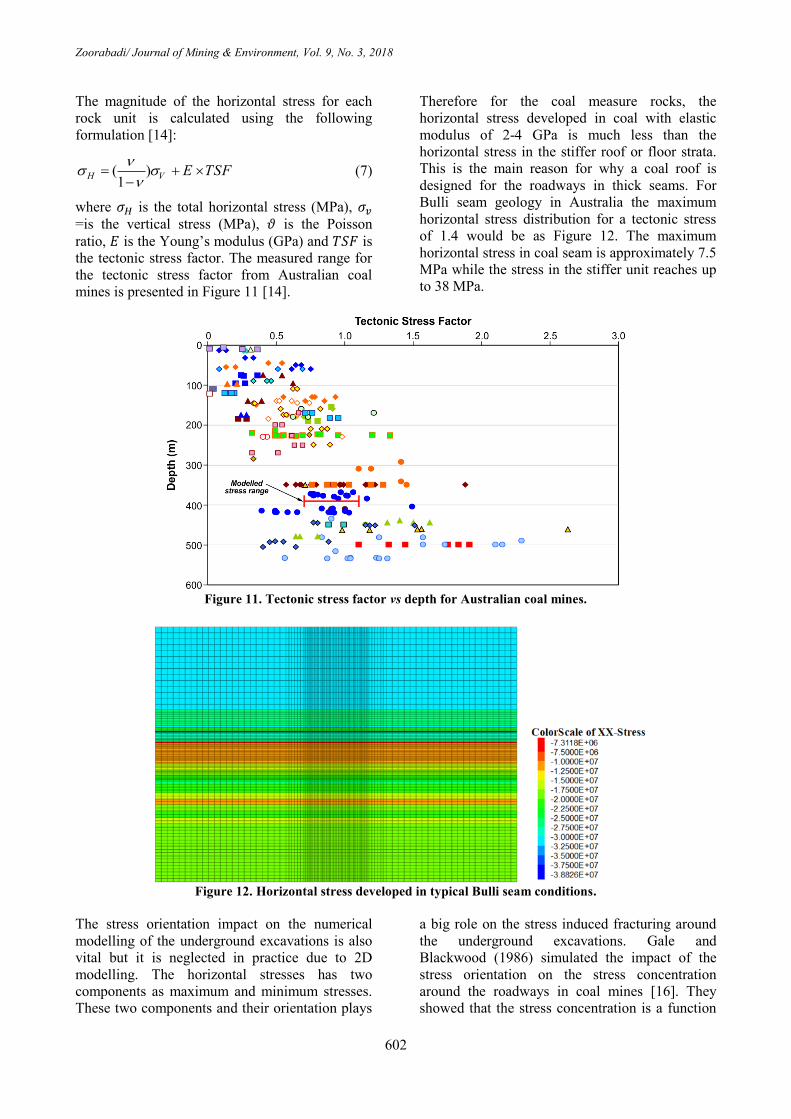
The magnitude of the horizontal stress for each
rock unit is calculated using the following
formulation [14]:
( )1
H V E TSF
(7)
where is the total horizontal stress (MPa),
=is the vertical stress (MPa), is the Poisson
ratio, is the Young’s modulus (GPa) and is
the tectonic stress factor. The measured range for
the tectonic stress factor from Australian coal
mines is presented in Figure 11 [14].
Therefore for the coal measure rocks, the
horizontal stress developed in coal with elastic
modulus of 2-4 GPa is much less than the
horizontal stress in the stiffer roof or floor strata.
This is the main reason for why a coal roof is
designed for the roadways in thick seams. For
Bulli seam geology in Australia the maximum
horizontal stress distribution for a tectonic stress
of 1.4 would be as Figure 12. The maximum
horizontal stress in coal seam is approximately 7.5
MPa while the stress in the stiffer unit reaches up
to 38 MPa.
Figure 11. Tectonic stress factor vs depth for Australian coal mines.
Figure 12. Horizontal stress developed in typical Bulli seam conditions.
The stress orientation impact on the numerical
modelling of the underground excavations is also
vital but it is neglected in practice due to 2D
modelling. The horizontal stresses has two
components as maximum and minimum stresses.
These two components and their orientation plays
a big role on the stress induced fracturing around
the underground excavations. Gale and
Blackwood (1986) simulated the impact of the
stress orientation on the stress concentration
around the roadways in coal mines [16]. They
showed that the stress concentration is a function

Zoorabadi/ Journal of Mining & Environment, Vol. 9, No. 3, 2018
603
of stress orientation. A summary of stress
monitoring results from a range of longwall
panels is presented in Figure 13, which shows the
stress concentration relative to the angle of stress
to the maingate. The stress concentrations tend to
maximise in the 40-70o range.
Zoorabadi and Rajabi (2017) used 3D numerical
modelling to assess the impact of the bedding
plane on the softening zones forming around the
roadways in coal mines [17]. They show that the
stress orientation is one of the main controlling
parameters for type and extension of failure zones
in bedded and laminated strata (Figure 14).
Figure 13. Stress concentration around the roadway for various stress orientation relative to roadway [18].
Figure 14. Impact of stress orientation on type and extension of failure zones in stratified rock around roadways
[17].

Zoorabadi/ Journal of Mining & Environment, Vol. 9, No. 3, 2018
604
5. Conclusions
Numerical modelling is commonly used for
analysing underground excavations in both the
civil and mining engineering projects. This
method applies various computational methods to
the input data provided by the user and produces
results in the forms stress, strain, and failure
modes. As a common practice, downgrading
methods based on rock classification systems have
been used to estimate the strength and
deformability characteristics of rocks. This paper
showed how using these downgrading methods
can cause a considerable uncertainty for stability
assessment of underground roadways in coal
mines. Additionally, the magnitude and
orientation of in situ stress have a significant
impact on the results of numerical methods. It was
shown that applying a constant stress ratio to
stratified rocks such as coal measure rocks is not
representing the real stress field. The 3D
modelling is vital for a reliable assessment of the
stress orientation impact on the roadway
behaviour. The failure modes and extension are
both controlled by stress orientation in coal
measure rocks.
References [1]. Palmström, A. (1995). RMi- A Rock Mass
Characterisation System for Rock Engineering
Purposes. University of Oslo. Norway.
[2]. Jing, L. and Hudson, J.A. (2002). Numerical
methods in rock mechanics. Int. J. Rock Mechanics and
Mining Science. 34: 409-427.
[3]. Hoek, E. and Brown, E.T. (1997). Practical
estimates of rock mass strength. International Journal
of Rock Mechanics and Mining Sciences. 34: 1165-
1186.
[4]. Goodman, R. (1989). Introduction to rock
mechanics. John Wiley and Sons. New York. United
States.
[5]. Goodman, R. and Shi, G.H. (1985). Block theory
and its applications to rock engineering. Prentice-Hall,
INC. New Jersey.
[6]. Jaeger, J.C. and Cook, N.G.W. (1979).
Fundamental of rock mechanics. 3th
Edition. Chapman
and Hall.
[7]. Hallbauer, D.K., Wagner, H. and Cook, N.G.W.
(1973). Some observations concerning the microscopic
and mechanical behaviour of quartzite spacemen in
stiff, triaxial compression test. Int. J. Rock Mech. 10:
713-726.
[8]. Zoorabadi, M. and Gale, W. (2017). Review of
roof support options for next generation of continuous
miner. ACARP project number of C25003.
[9]. SCT Operations Pty Ltd. (2000). Training manual
on coal mine rock mechanics properties.
[10]. Shen, J., Karakus, M. and Xu, C. (2012). A
comparative study for empirical equations in
estimating deformation modulus of rock masses.
Tunnelling and underground space technology. 32:
245-250.
[11]. Zoorabadi, M. (2010). Investigating intact rock
strength and rock mass environment effects on rock
mass deformation modulus using sensitivity analysis of
empirical equations. In Proceeding of Eurock 2010.
Lausanne Switzerland. Taylor and Francis Group. pp.
189-192.
[12]. Zoorabadi, M. (2016). Deformability modulus of
jointed rocks, limitation of empirical methods, and
introducing a new analytical approach. Coal Operations
conference. Wollongong. Australia.
[13]. Brown, E.T. (1978). Trend in relationship
between measured rock in situ stresses and depth.
International Journal of Rock Mechanics and Mining
Science & Geomechanics. 15: 211-215.
[14]. Nemcik, J., Gale, E. and Mills, K. (2005).
Statistical analysis of underground stress measurements
in Australian coal mines. Bowen Basin Symposium.
Yeppoon. Qld. Australia.
[15]. Savage, W.Z., Swolfs, H.S. and Amadei, B.
(1992). On the state of stress in the near-surface of the
Earth’s crust. Pure Appl. Geophys. 138: 207-228.
[16]. Gale, W. and Blackwood, R.L. (1986). Three
dimensional computational modelling of stress and
rock failure distributions about the face of a rectangular
underground opening and its correlation with coal mine
roadway behaviour. Int. J. Rock. Mech. And Mining
Sci.
[17]. Zoorabadi, M. and Rajabi, M. (2017). Impact of
bedding plane and laminations on softening zone
around the roadways- 3D numerical assessment. Coal
Operation Conference. Wollongong. Australia.
[18]. Gale, W. (2013). Update of stress concentration
effects about longwall panels for improved mine
planning, ACARP project number of C20031.

7931وم، سال سدوره نهم، شماره زیست، معدن و محیطپژوهشی -/ نشریه علمیزورآبادی
هایتجربیبرایتخمینروشعدمقطعیتناشیازاستفاده-سنگسازیعددیراهروهایمعادنزغالمدل
هایبرجاپارامترهایورودیوتنش
2و1مهدیزورآبادی
نگ،استرالیاونگوول،SCT Operations Pty Ltdمهندسارشدژئوتکنیک،شرکت-1
بخشمهندسیمعدن،دانشگاهنیوساوتولز،سیدنی،استرالیا-2
71/6/1171، پذیرش 71/7/1171ارسال
[email protected]; [email protected]نویسنده مسئول مکاتبات:
چکیده:
های مهندسیی معیدن و تخمین نشست زمین در پروژه دار های رایج برای تحلیل پایداری راهروها و فضاهای زیرزمینی، سطوح شیب سازی عددی یکی از روش مدل
هیای رفایاری سین و پارامارهیای ورودی افزارهای با سرعت پردازش بالا، میدل های عددی و توسعه سخت روشهای چشمگیر در و عمران است. علیرغم پیشرفت
های تجربی برای تخمین پارامارهیای ورودی میدل سازی عددی هساند. این مسئله با رایج شدن اسافاده از روش ترین عوامل بروز خطا در مدل مدل همچنان اصلی
های تجربیی بیرای تعییین پارامارهیای ورودی های عددی بدون توجه به مکانیسم واقعی شکست و تغییر شکل سن ، از روش ران مدلتر هم شده است. کارب عمیق
کننید کیه ها محاسیبه میی پذیری سن در همه عمق های تجربی، مقدار ثابای را برای مدول تغییر شکل ترین روش کنند. برای مثال رایج های خود اسافاده می مدل
کند. علاوه بر ایین، مکانیسیم واقعیی پذیری سن یک پارامار وابساه به تنش بوده و با تغییر عمق تغییر می مغایر رفاار واقعی سن است. مدول تغییر شکلکاملاً
مقیاومای و تغیییر شیود مافیاوت اسیت. جیدای از پارامارهیای های عددی فرض می شکست و تغییر شکل سن با تغییر شکل یک مدل پیوساه که در اکثر روش
شیوند. در ایین سیازی راییج عیددی در نگیر گرفایه نمیی ها در میدل های برجا هم پارامارهای مهمی هساند که تأثیر آن پذیری سن ، بزرگای و جهت تنش شکل
دی فضاهای زیرزمینی مورد بحی قیرار سازی عد های تجربی تخمین پارامارهای ورودی بر عدم قطعیت ناایج حاصل از مدل رویه از روش پژوهش، تأثیر اسافاده بی
های برجا بر شکست سن ناشی از تنش در اطراف فضاهای زیرزمینی ارزیابی شده است. داده شده است. همچنین تأثیر بزرگای و جهت تنش
های برجا. های تجربی، تنش سازی عددی، شکست سن ، روش مدل کلماتکلیدی:


![DATED THE COAL AUTHORITY AND [TENANT] UNDERGROUND … · together further with all other underground roadways and other underground spaces used or occupied, whether now or at any](https://static.fdocuments.net/doc/165x107/60322b6f138ba912707869f9/dated-the-coal-authority-and-tenant-underground-together-further-with-all-other.jpg)


