Numerical and Experimental Study on Temperature Crossover in Shell and Tube Heat Exchangers

UNLV Retrospective Theses & Dissertations
1-1-2008
Numerical modeling of high temperature shell and tube heat Numerical modeling of high temperature shell and tube heat
exchanger and chemical decomposer for hydrogen production exchanger and chemical decomposer for hydrogen production
Gayatri Kuchi University of Nevada, Las Vegas
Follow this and additional works at: https://digitalscholarship.unlv.edu/rtds
Repository Citation Repository Citation Kuchi, Gayatri, "Numerical modeling of high temperature shell and tube heat exchanger and chemical decomposer for hydrogen production" (2008). UNLV Retrospective Theses & Dissertations. 2298. http://dx.doi.org/10.25669/mosh-tl66
This Thesis is protected by copyright and/or related rights. It has been brought to you by Digital Scholarship@UNLV with permission from the rights-holder(s). You are free to use this Thesis in any way that is permitted by the copyright and related rights legislation that applies to your use. For other uses you need to obtain permission from the rights-holder(s) directly, unless additional rights are indicated by a Creative Commons license in the record and/or on the work itself. This Thesis has been accepted for inclusion in UNLV Retrospective Theses & Dissertations by an authorized administrator of Digital Scholarship@UNLV. For more information, please contact [email protected].

NUMERICAL MODELING OF HIGH TEMPERATURE SHELL AND
TUBE HEAT EXCHANGER AND CHEMICAL DECOMPOSER FOR
HYDROGEN PRODUCTION
by
Gayatri Kuchi
Bachelor o f Technology in Mechanical Engineering Jawaharalal Nehru Technological University, India
May 2003
A thesis submitted in partial fulfillment o f the requirements for the
Master of Science Degree in Mechanical Engineering Department of Mechanical Engineering
Howard R. Hughes College of Engineering
Graduate College University of Nevada, Las Vegas
May 2008

UMI Number: 1456347
INFORMATION TO USERS
The quality of this reproduction is dependent upon the quality of the copy submitted. Broken or indistinct print, colored or poor quality illustrations and photographs, print bleed-through, substandard margins, and improper alignment can adversely affect reproduction.
In the unlikely event that the author did not send a complete manuscript and there are missing pages, these will be noted. Also, If unauthorized
copyright material had to be removed, a note will indicate the deletion.
UMIUMI Microform 1456347
Copyright 2008 by ProQuest LLC.
All rights reserved. This microform edition is protected against
unauthorized copying under Title 17, United States Code.
ProQuest LLC 789 E. Eisenhower Parkway
PC Box 1346 Ann Arbor, Ml 48106-1346
Thesis ApprovalThe Graduate College University of Nevada, Las Vegas
March 25 20 08
The Thesis prepared by
G ayatr i Kuchi
Entitled
Numerical Modeling of High Temperature Shell and Tube Heat Exchanger
and Chemical Decomposer
is approved in partial fulfillment of the requirements for the degree of
Master of Science in Mechanical Engineering
Examination Committee Co-Chair Exam inat/on C om m ittee Chair
Exam ination C om m ittee M em her
Exam ination C om m ittee M em ber
G raduate College E acu ltvM efresen ta tive
Dean o f the G raduate College
11
ABSTRACT
Numerical Modeling of High Temperature Shell and Tube Heat Exchanger and Chemical Decomposer for Hydrogen Production
by
Gayatri Kuchi
Dr. Yitung.Chen, Examination Committee Chair Associate Professor o f Mechanical Engineering,
University o f Nevada, Las Vegas
This thesis deals with the development o f a three-dimensional numerical model o f
high temperature shell and tube heat exchanger and chemical decomposer to examine the
percentage decomposition o f a sulfur trioxide gaseous mixture for the production o f
hydrogen by the sulfur-iodine thermochemical water splitting cycle, a candidate cycle in
the U.S.Department o f Energy Nuclear Hydrogen Initiative. A counter flow type straight
tube shell and heat exchanger concept is chosen for the analysis. The reacting fluid is a
mixture o f sulfur trioxide gas and water vapor inside the tubes o f the heat exchanger and
high temperature helium is the gas which flows through the shell. Proceeding with the
simple, basic two-dimensional tube model, the percentage decomposition o f sulfur
trioxide gaseous mixture was investigated. A steady-state, laminar, two-dimensional
axisymmetric shell and tube model with counter flow and parallel flow arrangements and
simple uniform cubical packing was developed using a porous medium approach to
investigate the fluid flow, heat transfer and chemical reactions in the decomposer. The
effects o f inlet velocity, temperature and the porous medium properties on the pressure
iii

drop across the porous medium were studied. The influence o f geometric parameters
mainly the diameter o f the tube, diameter o f the shell and the length o f the porous zone
on percentage decomposition o f sulfur trioxide in the tube was investigated as well. From
the performed calculations, it was found that the Reynolds number played a significant
role in affecting the sulfur trioxide decomposition. The percentage decomposition
decreases with an increase in Reynolds number.
Flow rate uniformity in the heat exchanger tubes was also investigated. Simulations o f
the three dimensional straight tube configuration, tube configuration with baffle plate
arrangement and with pebble bed region inside the tubes were performed to examine the
flow distribution on tube side. It was found the flow maldistribution along the tube
direction is very serious with the simple tube configuration. An improvement o f the
header configuration has been done by introducing a baffle plate into the header section.
With the introduction o f the baffle plate, there was a noticeable decrease in the flow
maldistribution in the tubes. Uniformity o f flow was also investigated with catalytic bed
inside the tubes. A significant decrease in flow maldistribution was observed with this
arrangement. Simulations were performed on three dimensional numerical model o f the
shell and tube heat exchanger with and without baffles to evaluate the percentage
decomposition o f sulfur trioxide where it was found that the baffles play an important
role in increasing the percentage decomposition o f sulfur trioxide.
IV
TABLE OF CONTENTS
ABSTRACT................................................... iii
LIST OF FIG U R ES........................................................................................................... vii
N O M EN CLA TU RE...........................................................................................................................xi
A CKNOW LEDGEM ENTS.............................................................................................................xii
CHAPTER 1 INTRODUCTION.......................................................................................................11.1 Introduction..............................................................................................................................11.2 Research objective.................................................................................................................41.3 Literature review .................................................................................................................... 51.4 Outline o f Thesis.................................................................................................................. 14
CHAPTER 2 DESCRIPTION OF THE PROBLEM , GOVERNING EQUATIONS AND BOUNDARY C O N D ITIO N S......................................................................................................... 15
2.1 Description o f the p rob lem ................................................................................................182.2 Equations o f fluid flow, heat and species transfer....................................................... 182.3 Chemical reactions and kinetics....................................................................................... 202.4 Numerical method and algorithm ....................................................................................22
2.4.1 The finite volume m ethod....................................................................................... 232.4.2 Solution m ethod................................................................................... 232.4.3 Segregated solution algorithm ............................................................................... 23
2.5 Boundary conditions ............................................................................................252.5.1 Velocity inlet boundary conditions....................................................................... 252.5.2 Pressure outlet boundary conditions.....................................................................252.5.3 Thermal boundary conditions................................................................................ 252.5.4 Wall boundary conditions....................................................................................... 262.5.5 Fluid boundary conditions...................................................................................... 262.5.6 Solid boundary conditions...................................................................................... 262.5.7 Axis boundary conditions....................................................................................... 26
2.6 Physical properties m odel..................................................................................................27
CHAPTER 3 V A LID A TIO N ..........................................................................................................283.1 Chemical reaction m o d e l...................................................................................................28
CHAPTER 4 CED SIMULATION OF FLUID FLOW DISTRIBUTION AND INSIDETHE TUBE OF THE HEAT EXCHANGER AND D EC O M PSER ..................................... 31
4.1 Baseline design investigations..........................................................................................35V
4.1.1 Parametric studies..................................................................................................... 344.2 Two dimensional shell and tube model ........................................................................ 37
4.2.1 Investigation on counter flow arrangem ents.......................................................374.2.2 Investigations on parallel arrangem ents...............................................................38
4.3 Material properties.............................................................................................................. 394.4 Numerical resu lts ................................................................................................................ 40
CHAPTER 5 3D FLOW DISTRIBUTION ON THE TUBE SIDE OF HIGH TEMPERATURE SHELL AND TUBE HEAT EXCHANGER AND CHEMICAL DECOM POSER..................................................................................................................................44
5.1 Investigations on 3D tube configuration........................................................................445.2 Boundary conditions...........................................................................................................485.3 Computational m esh ...........................................................................................................485.4 Numerical resu lts ................................................................................................................ 49
CHAPTER 6 3D NUMERICAL CALCULATIONS OF SHELL AND TUBE HEAT EXCHANGER AND CHEM ICAL D ECO M PO SER................. 54
6.1 Investigations on 3D shell and tube m odel....................................................................546.2 Boundary conditions............................................................................................ 556.3 Numerical resu lts .................................................................................................................596.4 Parametric study................................................................................................................... 606.5 Numerical analysis o f shell and tube heat exchanger with baffles .........................636 . 6 Numerical resu lts .................................................................................................................656.7 Numerical analysis o f shell and tube heat exchanger with 9 baffles...................... 696 . 8 Numerical resu lts .................................................................................................................696.9 Parametric study...................................................................................................................73
CHAPTER 7 RESULTS AND DISCUSSIONS......................................................................... 797.1 Results and discussions for two and three-dimensional m odels ;...................... 79
CHAPTER 8 CONCLUSIONS AND FUTURE W O RK ......................................................... 848 .1 Conclusions based on 2d resu lts ...................................................................................... 84
8.1.2 Conclusions based on 3d results ................................................. 858.2 Future work recom m endations........................................................................................ 87
APPENDIX 1 CHEMICAL REACTION M ODELLING IN PEBBLE BED ZO N E 89
APPENDIX 11 EFFECTIVENESS CALCULATION...............................................................92
REFEREN CES.............................................................................. 96
V ITA ....................................................................................................................................................103
VI
LIST OF FIGURES
Figure 1.1 S-1 thermochemical cycle ......................................................................................... 4Figure 1.2 Effect o f temperature on H2 SO4 decomposition yield ....................................... 7Figure 1.3 Effect o f catalyst on H 2 SO4 decomposition yield................................................8
Figure 1.4 Percentage decomposition o f SO 3 at 20 atm. Vs. feed decom position......... 8
Figure 2.1 Shell and tube heat exchanger and decom poser...............................................16Figure 2.2 Two dimensional tube geom etry ...........................................................................17Figure 2.3 Two dimensional shell and tube geom etry......................................................... 18Figure 2.4 Iterative solution method for the segregate so lv e r........................................... 24Figure 3.1 Experimental se tup ...................................................................................................29Figure 3.2 Sulfur trioxide decomposition for 1 wt % Pt/ Ti0 2 catalyst........................... 30Figure 4.1 Computational m esh .................................................................................................32Figure 4.2 Grid independent study ................................... 33Figure 4.3 Pressure distribution................................................................................................ 33Figure 4.4 Temperature distribution........................................................................................ 34Figure 4.5 Percentage decomposition o f SO 3 vs. Reynolds num ber.................................35Figure 4.6 Percentage decomposition o f SO 3 vs. surface to volume ratio ...................... 35Figure 4.7 Percentage decomposition o f SO 3 vs. diameter o f the tube............................ 36Figure 4.8 Percentage decomposition o f SO 3 vs. length o f the porous zone ..................36Figure 4.9 Tube model o f shell and tube heat exchanger (counter f lo w )....................... 37Figure 4.10 Tube model o f shell and tube heat exchanger (parallel f lo w )....................... 38Figure 4.11 Computational m esh .............................................................. 39Figure 4.12 Pressure distribution (counter flow ).....................................................................40Figure 4.13 Temperature distribution (counter flow ).............................................................40Figure 4.14 Pressure distribution (parallel flow ).....................................................................41Figure 4.15 Temperature distribution (parallel flo w ).............................................................41Figure 4.16 Percentage decomposition o f SO3 vs. mass flow rate o f helium ...................42Figure 4.17 Percentage decomposition o f SO 3 vs. diameter o f the sh e ll...........................42Figure 4.18 Percentage decomposition o f SO 3 vs. activation en erg y .................................43Figure 5.1 Tube configuration (baseline case).......................................................................45Figure 5.2 Baffle p la te .................................................................................................................46Figure 5.3 Dimensions o f baffle plate...................................................................................... 46Figure 5.4 Location o f baffle p la te ................................................. 46Figure 5.5 Tube configuration with pebbles ......................................................................... 47Figure 5.6 Computational m esh ................................................................................................ 48
V I1

Figure 5.7 Grid independent study..............................................................................................49Figure 5.8 Y velocity distributions............................................................................................ 50Figure 5.9 Pressure distributions for base case......................................................................50Figure 5.10 Slice plane for the tube configuration................................................................... 51Figure 5.11 Y velocity distributions with baffle p la te ............................................................. 51Figure 5.12 Pressure distribution with baffle p la te .................................................................52Figure 5.13 Y velocity distributions.......................................................................................... 53Figure 5.14 Pressure distributions with porous m ed ium ...................................................... 53Figure 6.1 Three dimensional shell and tube heat exchanger............................................ 54Figure 6.2 Modified heat exchanger........................................................................................ 56Figure 6.3 Computational m esh ................................................................................................ 57Figure 6.4 Grid independent study............................................................................................58Figure 6.5 Temperature d istribution........................................................................................ 59Figure 6 . 6 Pressure distribution.................. 60Figure 6.7 Mass flow rate o f He vs. decomposition percentage........................................62Figure 6 . 8 Temperature distributions along the tubes for low mass flow rate o f He ... 62Figure 6.9 Temperature distributions along the tubes for high mass flow rate o f He .. 62Figure 6 .10 Mass flow rate o f SO 3 vs. decomposition percentage..................................... 63Figure 6 .11 Shell and tube heat exchanger with baffles............................... 64Figure 6.12 Computational g rid ...................................................................................................65Figure 6.13 Stream lines inside heat exchanger with five baffles.......................................6 6
Figure 6.14 Temperature distribution o f the heat exchanger with five baffles.......67Figure 6.15 Temperature distribution along slices with five baffles........................ 67Figure 6.16 Average mass fraction o f SO3 .............................................................................6 8
Figure 6.17 Average mass fraction o f SO2 .............................................................................6 8
Figure 6.18 Stream lines inside heat exchanger with nine baffles........................................70Figure 6.19 Temperature distribution o f the heat exchanger with nine baffles......71Figure 6.20 Temperature distribution along slices with nine baffles.........................71Figure 6.21 Average mass fraction o f SO3 .............................................................................72Figure 6.22 Average mass fraction o f SO2 ................................. 73Figure 6.23 Operating pressure vs. decomposition percentage........................................... 73Figure 6.24 Temperature distribution along slices with five baffles .........................75Figure 6.25 Temperature distribution along slices with nine baffles.........................75Figure 6.26 Average mass fraction o f SO 3 along slices with five baffles.............76Figure 6.27 Average mass fraction o f SO 3 along slices with nine baffles............76Figure 6.28 Average mass fraction o f SO2 along slices with five baffles.............77Figure 6.29 Average mass fraction o f SO2 along slices with nine baffles............77
Vlll

NOM ENCLATURE
A pre-exponential factor, s ''
Cp specific heat at constant pressure, J kg '-K"'
C2 inertial resistance factor
D diffusion coefficient for species / in the mixture, m^-s''
dh hydraulic diameter, m
Ea activation energy, kJ/mol
K reaction rate, s '
k kinetic energy o f turbulence, m^-s'^
ke Boltzmann constant (1.38 10^^ J-K '')
L length o f tube , mm
m mass, kg
rh mass flow rate, kg-s''
p static pressure. Pa
Re Reynolds number
Rncni net rate o f production o f species i by chemical reaction, kg-m’ -s’'
Sj rate o f reaction o f species i by addition from dispersed phase, kg m'^ s '
t time, s
T temperature K
Tinho! inlet temperature o f helium, K
Tincoid inlet temperature o f reacting flow K
IX
Tcoid outlet temperature o f reacting flow K
U velocity magnitude
Ui mean velocity component (i= l,2,3), m-s''
Uj mean velocity component ( j= l,2 ,3), m-s''
Uk mean velocity component (k = l,2,3), m-s''
u] fluctuating velocity components (i = 1; 2; 3), m-s'
u'. fluctuating velocity components (j= 1; 2; 3), m-s '
u[ fluctuating velocity components (k= 1; 2; 3), m-s'
Xi mass concentration o f species i
Wi length coordinate i (x, y, z), m
Wj length coordinate j (x, y, z), m
Wk length coordinate k (x, y, z), m
e Lennard-Jones energy parameter, J/molecule
€p porosity
e, thermal effectiveness
/I thermal conductivity, W-m '-K ''
ju dynamic viscosity, kg-m ''-s''
fu, turbulent viscosity, kg-m ''-s''
V kinematic viscosity, m^-s''

p density, kg-m'^
(T Lennard-Jones characteristic length, Â
(j), mole fraction o f species i
CO specific dissipation rate, s"'
Ôij Kronecker delta
Ü d diffusion collision integral
XI

ACKNOW LEDGMENTS
I am extremely happy to take this opportunity to acknowledge my debts and gratitude
to those who were associated with the preparation o f this thesis. Words fail to express my
profound regards from the inmost recess o f my heart to my advisor Dr. Yitung Chen for
the invaluable help, constant guidance and wide counseling extended to me right from the
selection o f the research topic to the successful completion o f this thesis.
I am extending my sincere thanks to Dr.Robert F.Boehm, Dr.Anthony E. Hechanova,
and Dr. Rama Venkat, for their direct and indirect contribution throughout this
investigation. I want to thank Dr.Ponyavin, Dr. Nie and Dr. Hsuan-Tsung (Sean) Hsieh
for their help, support, interest and valuable suggestions. Finally I would like to
acknowledge the financial support o f the United States Department o f Energy (USDOE).
Xll
CHAPTER 1
INTRODUCTION
1.1. Introduction
One o f the global concerns is that fossil fuel recourses will be diminished in the near
future. The constantly growing demand for energy, combined with the realization that
fossil fuel resources are finite and diminishing, has made it critical to utilize alternate
sources o f energy, as well as discover methods to prolong the lifetime o f our remaining
fossil fuels. In addition, the green house effect due to the accumulation o f carbon dioxide
in the atmosphere by the large scale burning o f the fossil fuel is causing various
environmental problems. Hydrogen is an important industrial chemical, particularly when
used in systems for converting coal into synthetic gas and oil, and is projected to be used
as a fuel in the future. Hydrogen produced by using nuclear or solar heat is more easily
stored and transported than thermal energy. In addition, it is a clean fuel. I f hydrogen can
be obtained from other than conventional fossil-based processes, our ultimate reserves o f
fossil fuels can be prolonged [1 ].
A hydrogen economy will need significant new sources o f hydrogen. Hydrogen can
be an attractive energy carrier if it can be produced cleanly and in a cost-effective
manner. Hydrogen can be derived from a variety o f domestically available primary
sources, including fossil fuels, renewable sources etc.

One o f the promising approaches to produce large quantities o f hydrogen from
nuclear energy is the thermochemical water splitting cycle. Unlike electrolysis,
thermochemical cycles can convert low level thermal energy directly in to chemical
energy by forming hydrogen and oxygen, and with overall first-law efficiencies
exceeding 50%. These cycles were identified as most suitable ones which have potential
advantages in efficiency, cost or reduced complexity. Although hundreds o f cycles have
been identified, only a few have been developed sufficiently to establish technical
feasibility. The U.S. Department o f Energy (DOE) Nuclear Hydrogen Initiative (NHI) is
investigating thermochemical cycles for hydrogen production using high temperature
heat from advanced nuclear reactors [2]. Thermochemical cycles produce hydrogen
through a series o f chemical reactions resulting in the production o f hydrogen and oxygen
from water at much lower temperatures than direct thermal decomposition.
Since the conception o f the first thermochemical cycle in 1960s, a large number o f
water-splitting cycles have been conceptualized and few o f those extensively
investigated.
The sulfur-iodine cycle (S-I) proposed by the General Atomics (GA) Company is one
such cycle developed for the large-scale hydrogen production. The practicability o f any
thermochemical water splitting cycle (TWSC) depends mainly on two factors: high
overall thermal efficiency and operational feasibility. The overall thermal efficiency o f a
TWSC determines the effectiveness o f the cycle in receiving energy from a heat source
and converting that into chemical energy. For that, a highly endothermie reaction is a
prerequisite. Analysis o f this cycle in the past thirty years has been focused mostly on the
utilization o f nuclear power as the high temperature heat source for performing the
(120°C) ( 1 )
(450°C) (2 )
(850°C) (3)
decomposition o f sulfuric acid. Thermodynamic as well as kinetic considerations indicate
that both the extent and rate o f sulfuric acid decomposition can be improved at very high
temperatures (in excess o f 1000 °C) available only from solar concentrators.
The S-I cycle is one o f the baseline cycle for thermochemical process for the large-
scale hydrogen production. It consists o f the following three chemical reactions which
yield the dissociation o f water;
I2 + SO2 + 2 H2 O 2HI + H2 SO4
2HI — H 2 + I2
H 2 S O 4 — > H 2 O + S O 2 + I / 2 O 2
The whole process takes in water and high-temperature heat and releases hydrogen
and oxygen. All reagents are recycled and also there are no effluents. Reaction 3 is the
most thoroughly investigated part o f the S -I cycle, since it constitutes the heart o f the
cycle, and it is generally accepted that the efficiency o f the whole process depends on the
efficiency o f H2 SO4 decomposition. Sulfuric acid decomposition is carried out at 850°C
in two steps. In the first step, sulfuric acid is assumed to decompose into water and sulfur
trioxide. In the second step, sulfur trioxide decomposes to produce oxygen and sulfur
dioxide according to the following reactions:
H 2 SO4 = H2 O + SO3 (4)
SOsCg) = 802(g) + 0 .5 0 2 (g) (5)
The produced sulfur dioxide is recycled. The hydrogen iodide can be decomposed at
about 450°C, releasing hydrogen and recycling the iodine (eq. 2). The net reaction is the
decomposition o f water in to hydrogen and oxygen. In the S-I cycle most o f the input
heat goes in to the dissociation o f sulfuric acid (eq. 4). The whole process takes in only
water and high temperature heat and releases only hydrogen, oxygen and low temperature
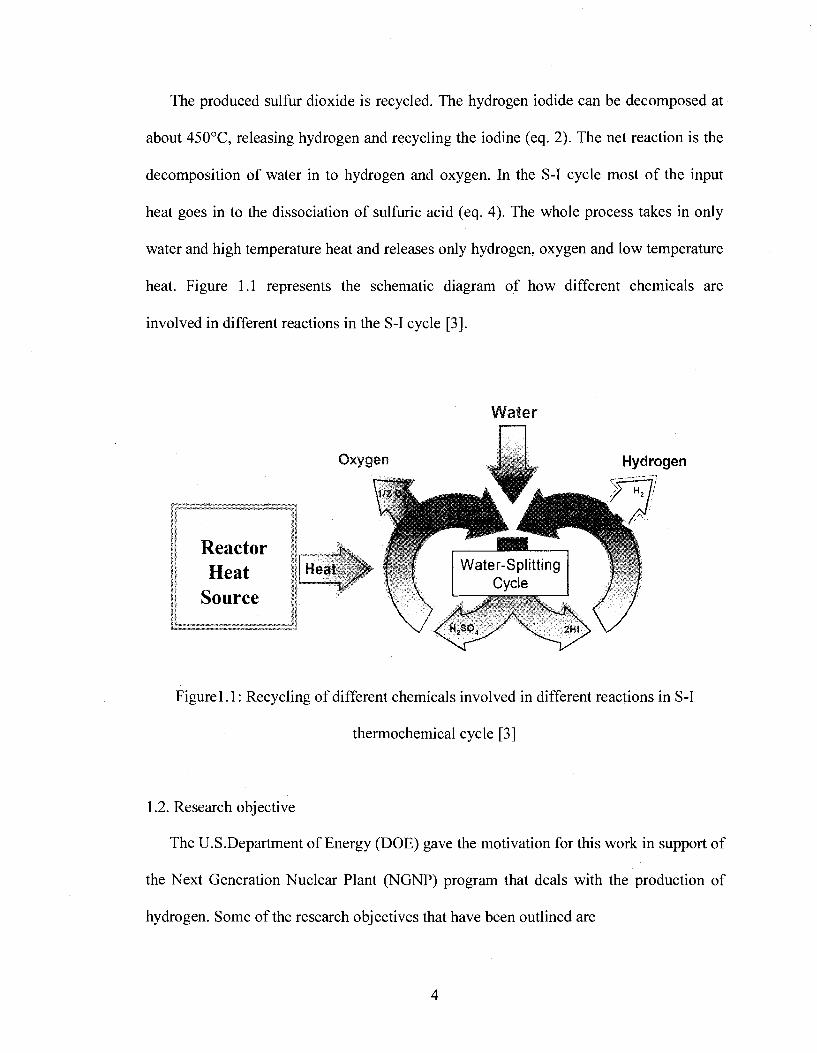
heat. Figure l . I represents the schematic diagram o f how different chemicals are
involved in different reactions in the S-I cycle [3].
W ater
ReactorHeat
Source
Oxygen Hydrogen
Water-Splitting Cycle
Heat >
Figure 1.1: Recycling o f different chemicals involved in different reactions in S-I
thermochemical cycle [3]
1.2. Research objective
The U.S.Department o f Energy (DOE) gave the motivation for this work in support o f
the Next Generation Nuclear Plant (N GN?) program that deals with the production o f
hydrogen. Some o f the research objectives that have been outlined are

• Development o f a three-dimensional numerical model o f high temperature shell
and tube heat exchanger and decomposer with catalytic bed inside the tubes for
decomposition o f sulfur trioxide as a part o f hydrogen production process based
on the sulfur-iodine thermochemical water splitting cycle.
• Investigation o f fluid flow uniformity in the tube configuration o f the heat
exchanger.
• Investigation o f fluid flow, heat transfer, pressure drop and the decomposition
percentage o f sulfur trioxide on the three-dimensional numerical model o f the
heat exchanger and decomposer with segmental baffles.
1.3. Literature review
The sulfur-iodine (S-I) cycle is a baseline candidate among the variety o f the
thermochemical processes. The cycle consists o f several chemical reactions that result in
the dissociation o f water. One o f the most critical components o f the process is the high
temperature heat exchanger for sulfuric trioxide decomposition process. The process
design o f the heat exchanger was developed by General Atomics [3]. Huang et al. [4]
made a detailed analysis o f the sulfur-iodine thermochemical cycle for hydrogen
production.
They used Aspen Technologies HYSYS chemical process simulator (CSP) to develop
flowsheets for sulfuric acid decomposition that include all mass and heat balances. Based
on the HYSYS analyses, two new process flowsheets have been developed. These new
sulfuric acid decomposition processes are simpler and more sable than previous processes
and yield higher conversion efficiencies for sulfuric acid decomposition and sulfur
dioxide and oxygen formation.
Many kinds o f decomposers like micro-channel heat exchangers etc. have been
proposed for sulfuric acid decomposition. A detailed study o f high temperature heat
exchangers has been done by Bengt et al. [5]. A ceramic high temperature heat exchanger
has been proposed to use as a sulfuric acid decomposer for hydrogen production by
Ponyavin et al. [6 ]. A two-dimensional numerical model has been developed by
Muramalla et al. [7] that predicted the wall catalyzed homogenous decomposition o f
sulfur trioxide. Ishikawa et al. [8 ] studied the decomposition o f sulfuric acid and
production o f HBr as a part o f research and development o f thermochemical hydrogen
production from water. A detailed study by Ozturk et al. [9] presents a new design and
thermodynamic and engineering analysis o f the sulfuric acid decomposition reaction o f
sulfur-iodine thermochemical cycle for hydrogen production.
1.3.1. Numerical studies o f the function o f catalyst inside the heat exchanger and decomposer
Catalyst plays a very important role in the decomposition o f sulfuric acid. Sulfuric
acid is decomposed on a catalyst at high temperatures according to the reactions (4) and
(5). Sulfuric acid dissociates nearly completely into water and sulfur trioxide at the vapor
phase according to reactions (4) above 450°C, reaction (5) proceeds by use o f a catalyst
at higher temperatures. Thus, the so-called decomposition o f sulfuric acid is reduced to
the decomposition o f SO3. Two different sets o f experiments were done for two different
catalysts, platinum and iron oxide for the decomposer model according to the description
in the General Atomics report [10]. GA conducted the experiments for the temperature
range from 700°C to 900°C at different pressure conditions and for different mole flow

range from 700°C to 900°C at different pressure conditions and for different mole flow
rates. They concluded that the performance o f iron oxide is good at higher temperatures
but it is very poor at lower temperatures where as there is not much variation in the
platinum catalyst over the same temperature range. Percentage decomposition o f sulfuric
acid in the presence o f platinum catalyst is around 35% even at temperatures closer to
700°C where as for the catalyst iron oxide there is no decomposition observed at that
temperature.
The catalytic activity o f m etal oxides was studied by Tagawa et al. [11] in an attempt
to find some suitable catalysts for the decomposition o f sulfuric acid in thermochemical
water splitting process. Barbarossa et al. [12] studied the catalytic thermal decomposition
o f sulfuric acid in sulfur-iodine cycle for hydrogen production. Figures 1.2 and 1.3 show
the effect o f temperature and catalyst on H2 SO4 decomposition yield [1 2 ].
T 80% .
60%.>5 40%.
O20%.
pPCHj SO^WD.l IJ
b
//
- / .
" ' 7
//
m;___ J
p<
0
i
-— Thermod.yaamic yield * Experime ntal yield 0 Schwartz et al.
^ ------ 1----------4 - :— ----------- u ------- 1------------1---------600 800 1000 1200 1400 1600 1800 2000
T( K)
Figure 1.2; Effect o f temperature on H2SO4 decomposition yield [12]

100
80
60
40
20
* i* +
' * i
1
t 1 • NocyfcilvstI , • I'd
» PcjO jt
073 673 1073T (K )
1273 1473
Figure 1.3: Effect o f catalyst on H 2 SO4 decomposition yield [12]
Seo et al. [13] numerically investigated the characteristics o f a catalytic heat
exchanger which can integrate heat generation and heat exchange. Lin et al. [14] studied
the design aspects o f sulfur trioxide decomposition reactor encompassing the reaction
kinetics, heat transfer and mechanical considerations, which adopt a shell and tube heat
exchanger with catalyst placed on the shell side o f the reaction.
40 so 60 70 80 90WEIGHT PERCENT
OF H jS O ^ SOLUTION
Figure: 1.4: Percentage decomposition o f SO3 at
2 0 atm vs. feed decomposition [14]
The decomposition o f SO3 at 20 atm and various temperatures vs. feed composition is
shown in Figure 1.4. The percentage decomposition o f SO3 was very low at lower
temperatures below lOOOK. However satisfactory conversions were obtained at
temperatures greater than 1073K.
However, no investigations were done for sulfur trioxide decomposition using a shell
and tube heat exchanger with catalytic bed which acts like a porous medium placed inside
the tube.
The transport o f gases in porous materials is a crucial component o f many important
processes in science and technology. Flow and diffusion through porous media represent
a vast field o f study with many scientific and engineering applications, including
catalysis. A detailed understanding o f the complexities o f flow and diffusion in porous
materials is essential for the design, development, and optimization o f catalysis and
adsorption. Evans et al. [15] gave a detailed analysis regarding the gaseous diffusion in
porous media and the effect o f pressure gradients. The effect o f pressure gradients is to
introduce in to the fundamental kinetic theory equations both a pressure diffusion term
and an external force term, which is needed to keep the porous medium from being
pushed along by the pressure gradient. Teruel et al. [16] developed an alternative model
to address the turbulent flows in porous media. A new set o f k-s equations for rigid and
isotropic porous media were developed in this study treating spatial and time fluctuations
as a unique identity. Turbulent flow in porous medium was numerically investigated by
Kuwahara et al. [17] exploiting the periodic boundary conditions. Only one structural unit
was taken as a calculation domain to simulate a porous medium o f regular arrangement in
an infinite space.
In the current research, the mixture o f gases is made to pass through the tubes o f the
shell and tube heat exchanger which contains catalytic bed which behaves like a porous
medium where, it is assumed to contain fixed uniform spherical packing o f pellets.
1.3.2. Numerical and experimental studies o f the shell and tube heat exchanger
Shell and tube heat exchangers are commonly used as oil coolers, power condensers,
preheaters and steam generators in both fossil fuel and nuclear-based energy production
applications. They are also widely used in process applications and in the air conditioning
and refrigeration industry. Although they are not specially compact, their robustness and
shape make them well suited for high pressure operations. Many important concepts
about heat exchanger performance were discussed by Clayton [18]. Stehlik et al. [19]
showed desirable features o f heat exchangers and then concentrated on shell and tube
heat exchangers both as individual units and as the items o f heat exchanger networks.
Kim et al. [20] analyzed the influences on the shell side heat transfer in shell and tube
heat exchangers using 32 different test heat exchangers. Results show that the heat
transfer coefficient in the nozzle region is 40% greater than in the parallel region if the
length o f the apparatuses is 30 times the hydraulic diameter. A new correlation suitable
for predicting the heat transfer coefficient was presented, which consists o f a
superposition o f Nusselt number for the flow in the nozzle region and that for the
longitudinal flow.
Crudely designed heat exchangers often have lower performance and higher operating
costs than more accurate designs. For many years, various types o f baffles have been
10

used in shell-and-tube heat exchangers to improve heat transfer while maintaining a
reasonable pressure drop across the exchanger. The most commonly used baffle, the
segmental baffle, causes the shell side fluid to flow across the tube bundle. This improves
heat transfer by enhancing turbulence or local mixing on the shell side o f the exchanger,
but at the cost o f a high pressure drop. This is caused by flow separation at the edge o f
the baffles with subsequent flow contraction and expansion. Due to its broad application,
many research results have been reported in this field [21-32]. Compared to segmental
baffles, disc and doughnut baffles have not achieved similar popularity mainly because o f
manufacturing difficulties. They have higher effectiveness to heat transfer pressure drop
then segmental baffles [21][33][34][35], which is due to the radial flow between centre
and the periphery, which eliminates bundle bypass and uses much lower cross flow
velocity than segmental baffles [33]. Local heat transfer and pressure drop on the shell
side o f shell and tube heat exchangers with segmental baffles were investigated by Li et
al. [36] for different baffle spacing and showed that the pressure drop and the average
heat transfer are increased by an increased baffle spacing due to a reduced leakage
through the baffle-shell clearance.
1.3.3. Numerical and experimental studies o f flow distribution inside the heat exchanger
and decomposer manifolds
One o f the most important factors influence on the performance is uniformity o f the
flow rate distribution inside the heat exchanger. The uniformity o f flow distribution
depends on inlet manifold geometry, internal channels configuration and flow regimes.
The problem o f flow maldistribution in heat exchangers has been recognized for a
long time. A number o f experimental investigations o f the problem are possible to find in
11

literature [37-41], Flow characteristics o f flow field in the entrance o f plate-fm heat
exchanger have been investigated by means o f particle image velocimetry (PIV) [37].
The experimental results indicate that performance o f fluid maldistribution in
conventional entrance configuration is very serious, while the improved entrance
configuration can effectively improve the performance o f fluid flow distribution in the
entrance. The flow inside a heat exchanger, which is a component developed for cooling
a high-current protons linear accelerator has been investigated experimentally by Faure et
al. [38]. The study focused on velocity distribution between the heat exchanger tubes. It is
found that for the range o f investigated inlet Reynolds numbers, velocity distribution
among the tubes does not depend on the flow rate. Shell side cross-flow velocity
measurements have been made within the horizontal pass partition lane o f an E-type
cylindrical shell and tube heat exchanger using a particle tracking technique [39]. It was
found that the cross-flow velocity variation in a baffle space within a shell and tube heat
exchanger increases with increasing distance between the upstream and downstream
baffles. Jiao et al. [40] obtained a correlation o f the dimensionless flow maldistribution
parameter and the Reynolds number under different distributor configuration parameters.
The experimental studies prove that the performance o f flow distribution in heat
exchangers can be effectively improved by the optimum design o f the distributor’s
configuration parameter. The flow maldistribution due to port to channel flow has a
severe effect on the heat exchanger thermal performance which has been investigated
experimentally by Rao et al. [41]. The authors have conducted an experimental study on
the port to channel flow maldistribution in a small package o f a 37 channel plate heat
12
exchanger by creating the flow maldistribution while inserting a reduced cross-sectional
area o f a wooden mandrel in both inlet and outlet ports o f the heat exchanger.
Computation studies o f fluid flow distributions in inlet manifolds o f heat exchangers
have been performed in [42-45], Zhang et al. [42] proposed a structure o f two-stage-
distribution and the numerical investigation shows the flow distribution in plate-fm heat
exchanger is more uniform if the ratios o f outlet and inlet equivalent diameters for both
headers are equal. In this paper, a simple way is put forward to homogenize the flow
distribution. A baffle with small size holes is installed in the traditional header to
optimize the header configuration. Dynamic behavior o f plate heat exchangers w ith flow
maldistribution from the port to channel was reported by Srihari et al. [43]. Fluid axial
dispersion characterizes back mixing and other notable deviations from plug flow
through the heat exchanger. Variations o f the heat transfer coefficient, due to nonuniform
distribution o f fluid velocity throughout the channels, were also reported. Solutions were
obtained with Laplace transforms and numerical inversion from the frequency domain.
Predicted results show that the dynamic response and thermal performance deteriorates
with flow maldistribution. Lalot et al. [44] studied the gross flow maldistribution in an
electrical heater and found that the perforated grid can improve the fluid flow
distribution. Wen et al. [45] employed CFD technique to simulate and analyze the
performance o f fluid flow distribution and pressure drop in the header o f plate-fm heat
exchanger. A baffle with small-size holes is recommended to install in the header in order
to improve the performance o f flow distribution. Research work has been done to analyze
the performance o f flow distribution in a single tube o f the high temperature shell and
tube heat exchanger considering porous media inside the tube by Kuchi et al. [46].
13

1.4. Outline o f thesis
This thesis research focuses on designing and simulating a three-dimensional shell
and tube heat exchanger and chemical decomposer for decomposition o f sulfur trioxide
into sulfur dioxide, as a part o f hydrogen production using computational fluid dynamics
(CFD) analysis. Chapter 2 explains the description o f the problem, geometry o f the
numerical model, calculation inputs, boundary conditions, associated governing
equations and methodology o f solution. Validation o f the chemical reaction model is
shown in Chapter 3. Chapter 4 discusses the two-dimensional numerical model, results,
calculations, and parametric o f fluid flow distributions and pressure drops inside the tube
o f the high temperature heat exchanger and decomposer. Chapter 5 deals with the work
that examines the uniformity in the flow distribution in cross-section o f the three-
dimensional tubes o f high temperature shell and tube heat exchanger and decomposer.
This chapter also includes the grid independent study that was performed, the numerical
approach, and the numerical results. Chapter 6 describes the fluid and thermal analysis
including chemical reaction modeling, which was performed on the three-dimensional
shell and tube heat exchanger with baffles to investigate the percentage decomposition o f
sulfur trioxide. The grid independent study, numerical approach and numerical results
were also discussed in Chapter 6 . Conclusions based on both 2D and 3D modeling and
some suggestions for future work are discussed in Chapter 7.
14

CHAPTER 2
DESCRIPTION OF THE PROBLEM, GOVERNING EQUATIONS
AND BOUNDARY CONDITIONS
2.1. Description o f the problem
The sulfur trioxide (SO 3 ) decomposition is a very important reaction which has an
effect on hydrogen production. So SO3 decomposer should be designed with care to attain
highest possible decompositions for given operation conditions. There is no specific
design that has been proposed for the sulfur trioxide decomposer. It can be a counter flow
or a parallel flow or cross flow type heat exchanger. However a shell and tube heat
exchanger design is adopted as the decomposer in this study.
Although today a set o f common types o f heat exchangers (double-pipe, spiral, plate-
and-ffame, plate-fm, compact heat exchangers) are used in heat transfer applications, the
shell-and-tube heat exchangers are still the most common type in use. They have larger
heat transfer surface area-to-volume ratios than the most o f common types o f heat
exchangers, and they are manufactured easily for a large variety o f sizes and flow
configurations. They offer great flexibility to meet almost any service requirement. The
reliable design methods and shop facilitates are available for their successful design and
construction. They can be designed for high pressures relative to the environment and
high pressure differences between the fluid streams. They are the cost effective heat
exchangers which can operate at high pressures, and their construction facilitates
15

disassembly for periodic maintenanee and eleaning. A shell and tube heat exehanger with
straight tubes offers few advantages eompared to other types. There is no leakage
problem o f one fluid stream in to the other. Cleaning o f the tube is meehanieally easy and
also the individual tubes are replaeeable. They are eeonomieally eheap and affordable
and offer leakage proof design with small eapital investment and affordability
The geometry o f the shell and tube heat exehanger and decomposer eonsidered is
shown in Figure 2.1.
0100.0 Shell inletBaff les
130 A T u b e s
T u b e o u t le t
500.00P o ro u s z o n e
T u b e Inlet
Shell o u t le t
31 .75
Figure 2.1 ; Shell and tube heat exehanger and deeomposer
(All dimensions are in mm)
The shell-and-tube heat exehanger eonsisting o f 24 tubes enelosed within a
eylindrieal shell is taken for study purpose. Dimensions o f the heat exehanger are shown
in Figure 2.1. One fluid flows through the tubes and a seeond fluid flows within the space
between the tubes and the shell. The design o f a heat exehanger and deeomposer requires
a balaneed approach among the thermal design, pressure drop and chemieal reaetions.
SO3 mixture enters the reaetor tubes at around 973 K. The shell side fluid is helium
which enters the heat exehanger at around 1223 K. The tube side fluid i.e., the reaeting
16
mixture acts as a cold fluid where as shell side fluid acts as a hot fluid which provides the
thermal energy required for SO3 decomposition. According to GA flow sheet [3], the
mass flow rate o f the helium is 71 kg/hr, the mass flow rate o f the mixture is 158.66
kg/hr, and the operation pressure for all o f the flows is 1.5 MPa. Catalytic bed is designed
inside the tubes which acts like a porous zone through which the mixture o f sulfur
trioxide and water vapor (acid vapor mixture) passes and gets decomposed into sulfur
dioxide and oxygen.
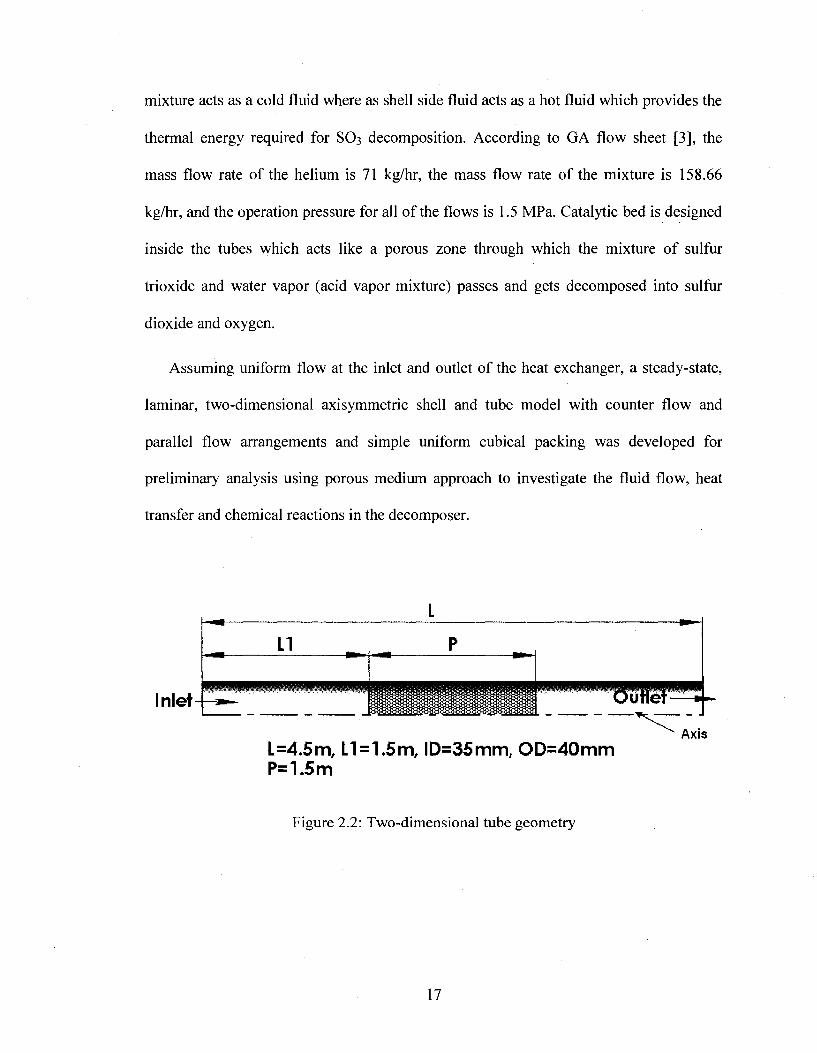
Assuming uniform flow at the inlet and outlet o f the heat exchanger, a steady-state,
laminar, two-dimensional axisymmetric shell and tube model with counter flow and
parallel flow arrangements and simple uniform cubical packing was developed for
preliminary analysis using porous medium approach to investigate the fluid flow, heat
transfer and chemical reactions in the decomposer.
Inlet
LI _ P _
s s
L=4.5m, LI= 1.5m, ID=35mm, O D =40m m P=1.5m
Axis
Figure 2.2: Two-dimensional tube geometry
1 7

4.5 m
.5 m Porous zo n eShell
Figure 2.3: Two-dimensional shell and tube geometry
As shown in Figure 2.2, the tube model is 4.5 m in length and 0.04 m in diameter
with an entrance length o f 1.5 m. The shell dimensions are shown in Figure 2.3. The shell
is 0.08 m in diameter. The length o f the catalytic bed which acts as a porous zone is 1.5
m.
2.2. Equations o f fluid flow, heat and species transfer
The preliminary analysis shows that the Reynolds number for the flow in the tube
side as well as in the shell side o f the heat exchanger and decomposer is less than 1 0 0 0 ;
therefore the laminar flow model was used for the calculations.
The governing equations for continuity, momentum and energy for the two-
dimensional laminar flow can be expressed as follows;
(2 .1)
dw dw,i V dw dw.
( 2 2 )
18
dw dw. I C p dw. (2 3)
The governing equation for different species involved in the reaction modeling can be
written as:
+ R + iS, —0rxm / (2.40
However, when the three-dimensional heat exchanger with 24 tubes was considered, the
Reynolds number at the shell entrance and also inside the tubes was higher than 2300
therefore a turbulence model should be applied for the flow calculations in the regions.
The shear-stress transport (SST) k-co model has been chosen to calculate the flows. The
model is so named because the definition o f the turbulent viscosity is modified to account
for the transport o f the principal turbulent shear stress (M enter et al. [47]). It is the feature
that gives (SST) k-co model an advantage in terms o f performance over both the standard
k-s and k-co models especially for the flows with recirculation regions. M omentum
conservation for the turbulence model is:
dw, dwi V
, ,
dw dw.C2 5)
where
- p u u . = p ,( f
- +2
(2.6)
19
Transport equations for the SST A:-<y model:
^ ( p k u ) ^dw dw,
r„dk
dwC2 7)
J /
6 / \ 6 [p c o u j
dw, dw,r
dco
dw,+ A “ A + A . CIS)
/ y
In these equations, represents the generation o f turbulence kinetic energy due to mean
velocity gradients. G, represents the generation of<y. and represent the effective
diffusivity o f k and<y, respectively. and represent the dissipation o f k and co due to
turbulence. represents the cross-diffusion term
r* = A +
A = A +
M,
M,
C2 9)
C2 1 0 )
Where, and are the turbulent Prandtl numbers for k and<y, respectively.
2.3. Chemical reactions and kinetics
The catalytic surface reaction model is implemented to determine the mole fractions
o f SO], SO], and O], as results o f the sulfur trioxide decomposition: SO ]-^SO 2 +0 .5 O2 .
The chemical reaction is highly temperature and pressure dependent.
Assuming that the reaction is the first order homogeneous reaction (Spewock et al.
[48]), the rate equation for the reaction is written as:
^rxn - ( 2 . 1 1 )
20

The reaction rate constant (K) is obtained by using the Arrhenius equation (Scott[49]):
r i iK = A e ^ " ' (2.12)
Platinum catalyst is used to enhance the decomposition. The activation energy (Eg)
and pre-exponential factor (A) for the chemical reaction are obtained by using the
experimental data o f Ginosar [50]. For the 1 w t % Pt catalyst pre-exponential factor A =
0.16 1/s; Ea=32.67 kJ/mol. For the 0.1 wt % Pt catalyst pre-exponential factor A = 1.14
1/s; Ea=46.24 kJ/mol. Calculations for the catalytic data are shown in APPENDIX I. The
obtained values for the activation energy agree with experimental data o f Tagawa et al.
[ 1 1 ] and Ishikawa et al. [8 ].
To investigate the fluid flow, heat transfer and chemical reactions in the catalytic bed
region, porous medium approach has been used. Since the obtained Reynolds number for
the two-dimensional model is 678, a laminar flow is employed and D arcy’s law is applied
for the porous media model. For two-dimensional as well as for three-dimensional
models in this study, simple uniform spherical packing o f pellet diameter (Dp) 5.0 mm
was applied. The porosity has been found out and the value obtained was 0.476. The
inertial and viscous resistance co-efficient are found out from [51] equations 2.17 and
2.18.
a - (D p 2 /1 5 0 )* (s ^ /( l - s )2 ) (2.13)
where a is the permeability o f the material.
Viscous resistance = l/a = 1.6x10^ m ’ .
The inertial resistance is calculated by:
C 2 = ( 3 . 5 / D p ) * ( ( l - 6 ) / G ^ ) ( 2 . 1 4 )
21

Calculated value, C 2 = 3401m ''
The surface area to volume ratio o f the porous zone is also calculated , which is defined
as the surface area o f the pore wall per unit volume (A/V) and can be assumed as a
measure o f catalyst loading.
Calculated A/V value is 628.
2.4. Numerical method and algorithm
A mixture o f chemical species undergoing chemical reactions while flowing through
the heat exchanger tubes placed with catalytic bed, make the flow complex. In this case
the actual physical device is replaced by a discrete number o f points that represent the
entire geometry o f the cell where, not only the production and destruction o f species are
found but also the pressure, temperature, etc. are also found. These equations will be
solved only at the discrete points representing the geometry o f the cell where the
distributions o f pressure, temperature, etc are found. The approach requires defining the
mathematical equations that govern the physical process. These equations will be solved
only at the discrete points representing the geometry. FLUENT, a commercial computer
program, based on finite-volume method is among the most powerful packages o f
existing commercial software for solving fluid flow, heat transfer and chemical reaction
problems [52]. The purpose o f this research study is to determine the percentage
decomposition o f SO 3 in a shell and tube heat exchanger and chemical decomposer and
the effect o f different parameters on sulfur trioxide decomposition is numerically studied
using FLUENT.
22

2.4.1. The finite volume method
The finite volume methods (FVM), often called control volume methods, are
formulated from the inner product o f the governing partial differential equations with a
unit function. This process results in the spatial integration o f the governing equations.
The integrated terms are approximated by either finite differences or finite elements,
discretely summed over the entire domain. Physically, the conservation o f mass,
momentum and energy are assured in the formulation o f FVM via the finite difference
method (FDM) itself. The finite volume scheme approximation is done for the program
used in this study.
2.4.2. Solution method
The segregated solver was used to solve the governing integral equations for the
conservation o f mass, momentum, energy and species equations. The solution is obtained
by using a control-volume based technique which consists of:
• Division o f the domain on to discrete volumes using a computational grid.
• Integration o f governing equations on the individual control volumes to construct
algebraic equations for the discrete dependent variables (“unknowns”), such as
velocity, pressure, temperature, species mass fractions, reaction rates and
conserved scalars.
• Linearization o f discretized equations and solutions o f the resultant linear
equation system to yield updated values o f the dependent variables.
2.4.3. Segregated solution algorithm
The numerical scheme used in this study is a first order upwind differencing scheme,
and the solver used is a segregated solver (Figure 2.4). SIMPLE (semi-implicit method
23

for pressure-linked equations) algorithm is used to resolve the coupling between pressure
and velocity. The governing equations, which are discrete and nonlinear, are linearized
using an implicit technique with respect to a set o f dependent variables in every
computational cell. The governing equations were linearized by the “implicit” method
with respect to the set o f dependent variables.
The resulting algebraic equations are solved iteratively using an additive correction
multigrid method with a Gauss-Seidel relaxation procedure.
yesnoStop
Update propeities.
Solve niomeiitmn equations.
Solve energy, species, and otlier equations.
Solve pressure-conection (continuity') equation. Update pressure, face mass flow rate.
Figure 2.4; Iterative solution method for the segregate solver
The grid independence studies for 2-D and 3-D are performed for the each
investigated geometry to check the dependence o f the calculated parameters (pressure.
24

temperature, velocities, decomposition percentage) on mesh size. The grids systems are
refined until the calculated parameters became independent from the grid size.
2.5. Boundary conditions
2.5.1. Velocity inlet boundary conditions
Velocity inlet boundary conditions are used to define the flow velocity, along with all
other relevant scalar properties o f the flow, at the flow inlets. This type o f boundary
condition at the inlet is intended to be used in incompressible flow. It requires the
specification o f velocity magnitude and direction, the velocity components, or the
velocity magnitude normal to the boundary. In this case, the velocity normal to boundary
specification method was used.
2.5.2. Pressure outlet boundary conditions
The pressure outlet boundary condition requires the specification o f gauge pressure at
the outlet. Flow quantities are extrapolated from the interior. A set o f the “backflow”
conditions are also specified, and specifying realistic values o f backflow quantities
reduced convergence difficulties. To set the static pressure the appropriate gauge pressure
should be entered. Backflow temperature and turbulence parameters were set normal to
the boundary with a realistic value. At the pressure outlets FLUENT uses the boundary
condition pressure input as the static pressure o f the fluid at the outer plane, and
extrapolates all other conditions from interior o f the domain.
2.5.3. Thermal boundary conditions
When choosing to solve an energy equation, it is required to define the thermal
boundary condition at the walls. Since the wall zone in three dimensional modeling is a
25
fluid/solid interface) a conjugate heat transfer problem is encountered. The code allows
user to choose whether or not the two sides o f the wall are “coupled” . When the
“coupled” option is chosen no other additional thermal boundary conditions are required,
because the solver will calculate heat transfer directly from the solution in the adjacent
cells.
2.5.4. Wall boundary conditions
Wall boundary conditions are used to bound fluid and solid regions. Since the flow is
modeled as viscous flow, the no-slip boundary condition is enforced at wall. The catalytic
surface reaction is enabled at the wall which allows fluid to react when it comes in
contact with the wall.
2.5.5. Fluid boundary conditions
A fluid zone is a group o f cells for which all active equations are solved. The only
required input for a fluid zone is the type o f fluid material. In the present case the fluid is
a mixture o f four different species. The type o f fluid is specified in the material panel and
the fluid properties o f the all individual fluids as well as the mixture properties are first
defined in the material properties panel o f FLUENT.
2.5.6. Solid boundary conditions
A “solid” zone is a group o f cells for which the heat conduction problem is solved; no
equations are solved. The only required input for the solid zone is the material o f solid
which is input in to the material conditions panel o f the FLUENT code.
2.5.7. Axis boundary conditions
The axis boundary condition is specified as axi-symmetric which allows the user not
to have to specify any other boundary condition at the axis. FLUENT uses the adjacent
26

cell values to determine the appropriate physical values for a particular variable at any
point on the axis.
2.6. Physical properties model
An important step in the set up o f the numerical model is the definition o f the
physical properties. For the fluid materials the values o f density, thermal conductivity,
viscosity, specific heat capacity for the individual species and also for the mixture are
independent o f temperature required for the calculation purposes. The physical properties
may be dependent or independent o f temperature depending upon the type o f approach
chosen.
When there is large temperature difference between the fluid and the surface the
assumption o f constant fluid transport properties may cause some errors, because the
transport properties o f most fluids vary with temperature. In the present case the
properties o f the mixture depend not only on the temperature at that location but also on
the individual species concentration at that location.
The properties for all individual species (H 2 O, SO3 , SO 2 . and O2 ) are dependent on
temperature and are calculated by FLUENT material panel using the kinetic theory.
Material properties such as thermal conductivity, viscosity and specific heat are
dependent on both temperature and the individual species concentrations and so they are
calculated using mass weighted mixing law. Density o f the mixture is calculated using
incompressible-ideal gas relationship.
27
CHAPTER 3
VALIDATION
3.1. Chemical reaction model
To validate the used chemical reaction model, the comparison o f the calculations with
experiments completed by Ginosar [50] has been performed. For the experiments, a high-
temperature continuous flow catalyst test system, established in Idaho National
Laboratory (INL), was used to examine the catalytic reaction in flowing, concentrated
sulfuric acid at atmospheric pressure (Figure 3.1). Concentrated sulfuric is pumped into a
heated zone where the acid vaporizes and decomposes to SO3 and steam. Generated
vapors flow over a bed o f catalyst for the reduction o f SO3 to produce SO 2 and oxygen.
The inlet section, where preheat, vaporization, and SO 3 generation takes place, has an
inside diameter o f 4 mm, an outside diameter o f 6 mm, and had approximately 30 cm o f
tube in the heated furnace. The SO 3 decomposition section, with approximately 30 cm in
the heated zone, had an inside diameter o f 10 mm and an outside diameter o f 12 mm. The
initial 1 0 to 1 2 cm o f the decomposition section was packed with den stones which aided
temperature stabilization. The catalyst sample was packed inside the decomposition
section starting at about 15 cm downstream o f the inlet section and was held in place with
plugs o f quartz wool. Gas temperatures exiting the catalyst bed were measured using a
type K thermocouple that was sheathed inside a quartz tube that was sealed from the
reaction
2 8
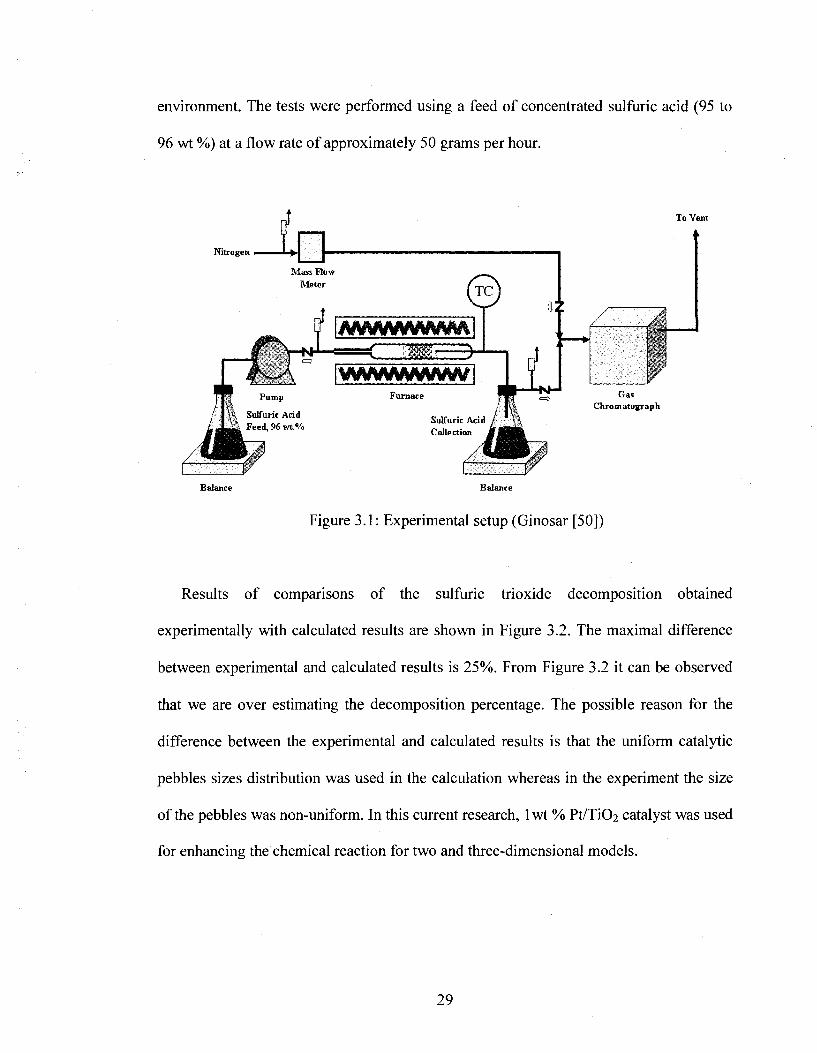
environment. The tests were performed using a feed o f concentrated sulfuric acid (95 to
96 wt %) at a flow rate o f approximately 50 grams per hour.
To Vent
Nitrogen <
M ass ÏÎOW M eter
SuUuric Acid% 95 wt 0/»
F urnace GasC hrom atograph
Sulfuric AcidCollection
Balance Balance
Figure 3.1: Experimental setup (Ginosar [50])
Results o f comparisons o f the sulfuric trioxide decomposition obtained
experimentally with calculated results are shown in Figure 3.2. The maximal difference
between experimental and calculated results is 25%. From Figure 3.2 it can be observed
that we are over estimating the decomposition percentage. The possible reason for the
difference between the experimental and calculated results is that the uniform catalytic
pebbles sizes distribution was used in the calculation whereas in the experiment the size
o f the pebbles was non-uniform. In this current research, I wt % Pt/TiO: catalyst was used
for enhancing the chemical reaction for two and three-dimensional models.
29

80
75
70
65
60
55
50
45
40
35I
30
25
2 % 0
:
:
; A%
;Æ.
;
; ' A ', ........ ■
r ' -
: A
: ............... '
r
:« Exper t n A N um eri
len ta l:al
:
750 800 850Temperature (degree C)
900
Figure 3.2; Sulfur trioxide decomposition for 1 wt % Pt/Ti0 2 catalyst
30
CHAPTER 4
CFD SIMULATION OF FLUID FLOW DISTRIBUTION INSIDE THE
TUBE OF THE HEAT EXCHANGER AND DECOMPOSER
4.1. Baseline design investigations
The purpose o f the calculation is to check the percentage decomposition o f SO3 inside
the tubes o f the heat exchanger and decomposer. A single tube o f the heat exchanger has
been modeled (Figure 2.2) for calculation o f percentage decomposition o f SO 3 . The used
models includes fluid flow model with heat transfer and chemical reaction calculations.
Because o f symmetry, only half o f the geometry has been modeled. Sulfur trioxide and
water vapor mixture enters the tube at a temperature o f 973K shown in Figure 2.2. The
boundary conditions used are:
Tube side inlet temperature = 973 K
Tube wall temperature = 1173 K
Tube side mass flow rate = 0.0018 kg/s
Operating pressure =1 . 5 atm
Center line= axisymmetric boundary condition.
Preliminary analysis shows that the Reynolds number o f the flow in the tube o f the
heat exchanger and decomposer is less than 1 0 0 0 ; therefore the laminar flow model was
used for the calculations. The entered mixture passes through the catalytic bed where, the
31

decomposition o f sulfur trioxide into sulfur dioxide and oxygen takes place. Gambit
2.2.30 is used for creating the computational mesh. Optimum computational mesh
(Figure 4.1 ) was created for the tube model with 9,909 nodes and 8,800 elements.
Figure.4.1: Computational mesh
M esh independent study was performed on the tube geometry. The main objectives o f
the mesh independence investigation are:
• Examination o f the solution sensitivity and computational time from the mesh
changes (refinement and coarsening)
• Selection o f the optimal mesh for analyzing the problem using CFD techniques.
Investigation o f decomposition o f sulfur trioxide in the tube using numerical models
requires an appropriate mesh density. To find out the type o f mesh, which provides stable
and accurate results, analysis was carried out with different mesh densities varying from
course to fine and the results are compared w ith the base mesh. Nine different types o f
meshes with variation in mesh densities at the center as well as at the walls are
considered for the investigation. Since in the present problem the decomposition o f sulfur
trioxide reaction is a wall surface reaction, all the nine different grids were created with
32

fine mesh close to walls as well as in the catalytic bed zone. Figure 4.2 shows the
variation o f pressure drop in the tube for different kinds o f meshes. Since the difference
in pressure drops for the base case and further cases with finer mesh is less than 5%, the
mesh with 9,909 nodes was chose for study purpose
620
«(LCe*615w
£a.610
605 g , JL
Base case
_L_1 i 1 - A - I I, j10000 30000 30000 40000 50000
Nimber of nodes
Figure 4.2: Grid independent study
Pressure in Pa
Pressurepm 623
498.4373.8249.2124.60
Figure 4.3: Pressure distribution
33
Temperature in K
Temperatu re
118011341088 ■
— 1042996950
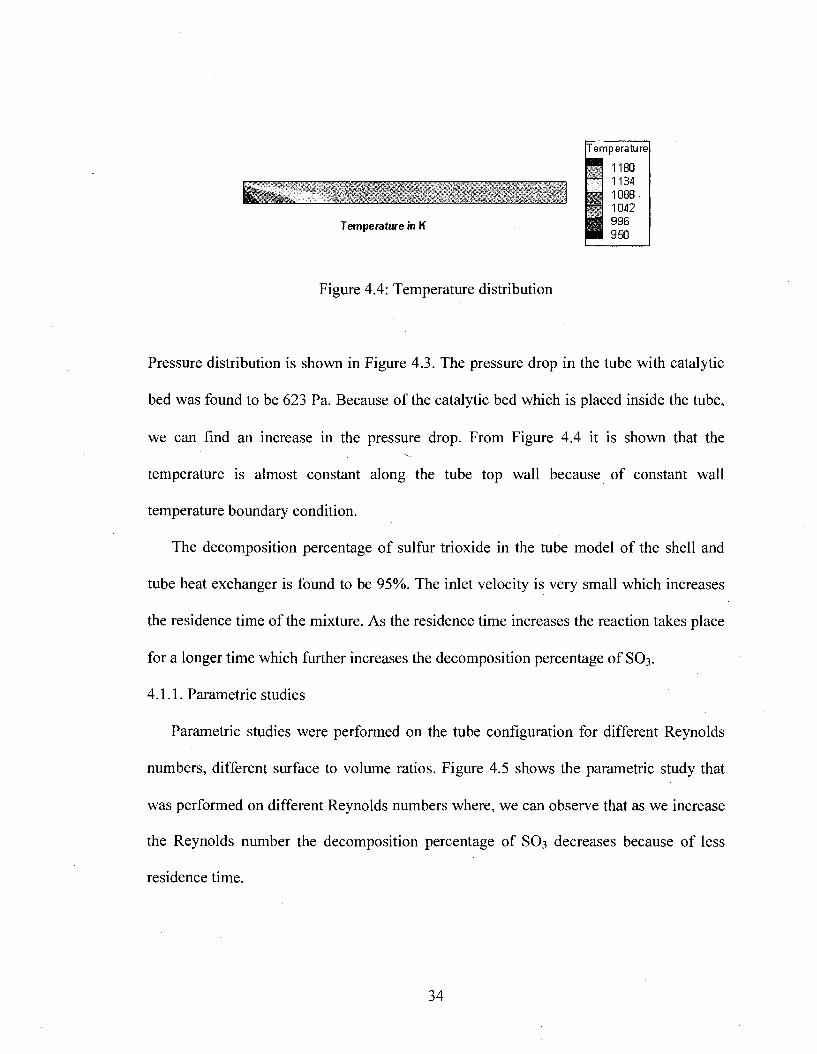
Figure 4.4; Temperature distribution
Pressure distribution is shown in Figure 4.3. The pressure drop in the tube with catalytic
bed was found to be 623 Pa. Because o f the catalytic bed which is placed inside the tube,
we can find an increase in the pressure drop. From Figure 4.4 it is shown that the
temperature is almost constant along the tube top wall because o f constant wall
temperature boundary condition.
The decomposition percentage o f sulfur trioxide in the tube model o f the shell and
tube heat exchanger is found to be 95%. The inlet velocity is very small which increases
the residence time o f the mixture. As the residence time increases the reaction takes place
for a longer time which further increases the decomposition percentage o f SO3 .
4.1.1. Parametric studies
Parametric studies were performed on the tube configuration for different Reynolds
numbers, different surface to volume ratios. Figure 4.5 shows the parametric study that
was performed on different Reynolds numbers where, we can observe that as we increase
the Reynolds number the decomposition percentage o f SO 3 decreases because o f less
residence time.
34
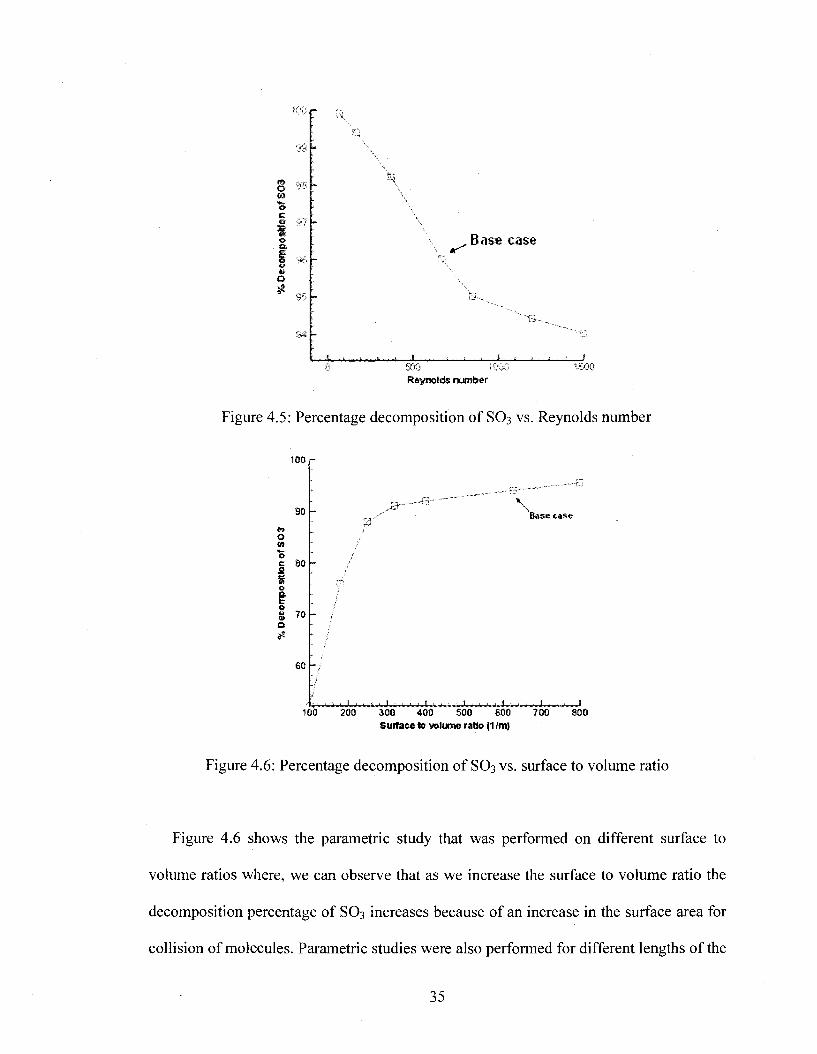
!00
otk
■B
Base case
900 ICiOReynolds nwnber
1900
Figure 4.5: Percentage decomposition o f SO3 vs. Reynolds number
100
30
0C 801 II TO o
60
Base case
100 200 300 400 500 600 700 800Surface to volume ratio (1 /mj
Figure 4.6: Percentage decomposition o f SO3 vs. surface to volume ratio
Figure 4.6 shows the parametric study that was performed on different surface to
volume ratios where, we can observe that as we increase the surface to volume ratio the
decomposition percentage o f SO3 increases because o f an increase in the surface area for
collision o f molecules. Parametric studies were also performed for different lengths o f the
35
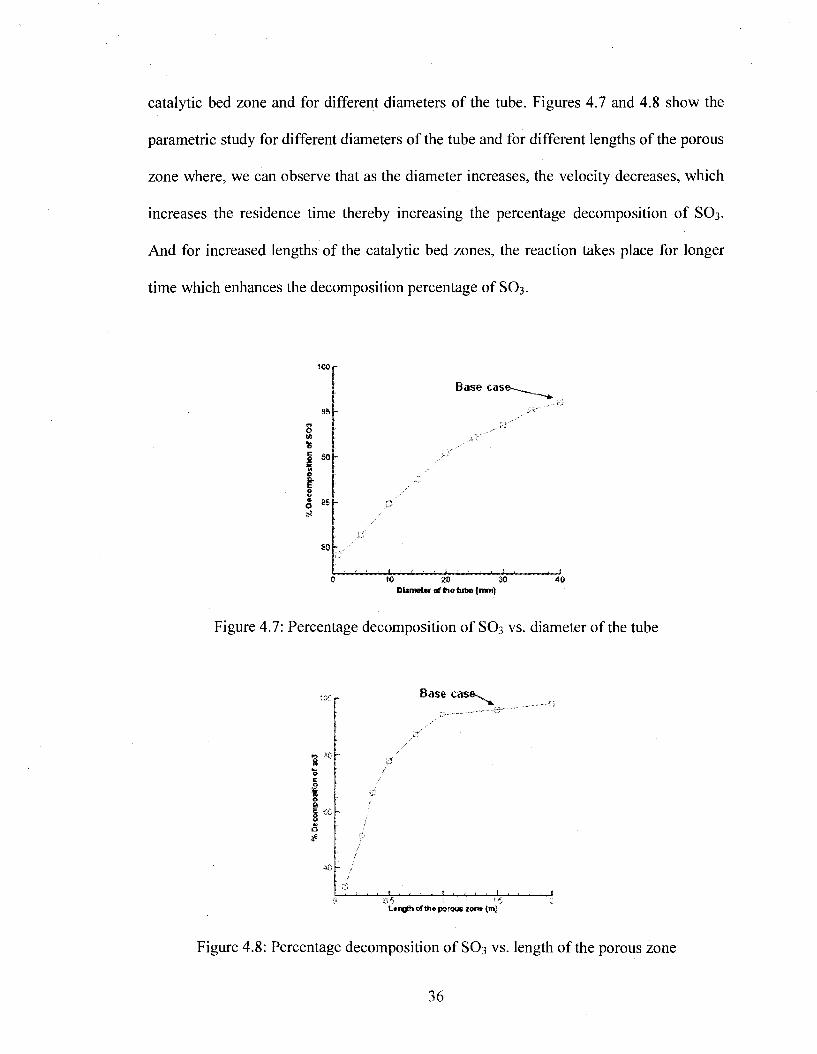
catalytic bed zone and for different diameters o f the tube. Figures 4.7 and 4.8 show the
parametric study for different diameters o f the tube and for different lengths o f the porous
zone where, we can observe that as the diameter increases, the velocity decreases, which
increases the residence time thereby increasing the percentage decomposition o f SO 3 .
And for increased lengths o f the catalytic bed zones, the reaction takes place for longer
time which enhances the decomposition percentage o f SO 3 .
*0
85
80
Base case
0 W 20 30Diameter o t the tube (mm}
40
Figure 4.7: Percentage decomposition o f SO3 vs. diameter o f the tube
Base cas
- 1_
LengA of ttie portxa zone (rr0
Figure 4.8: Percentage decomposition o f SO 3 vs. length o f the porous zone
36
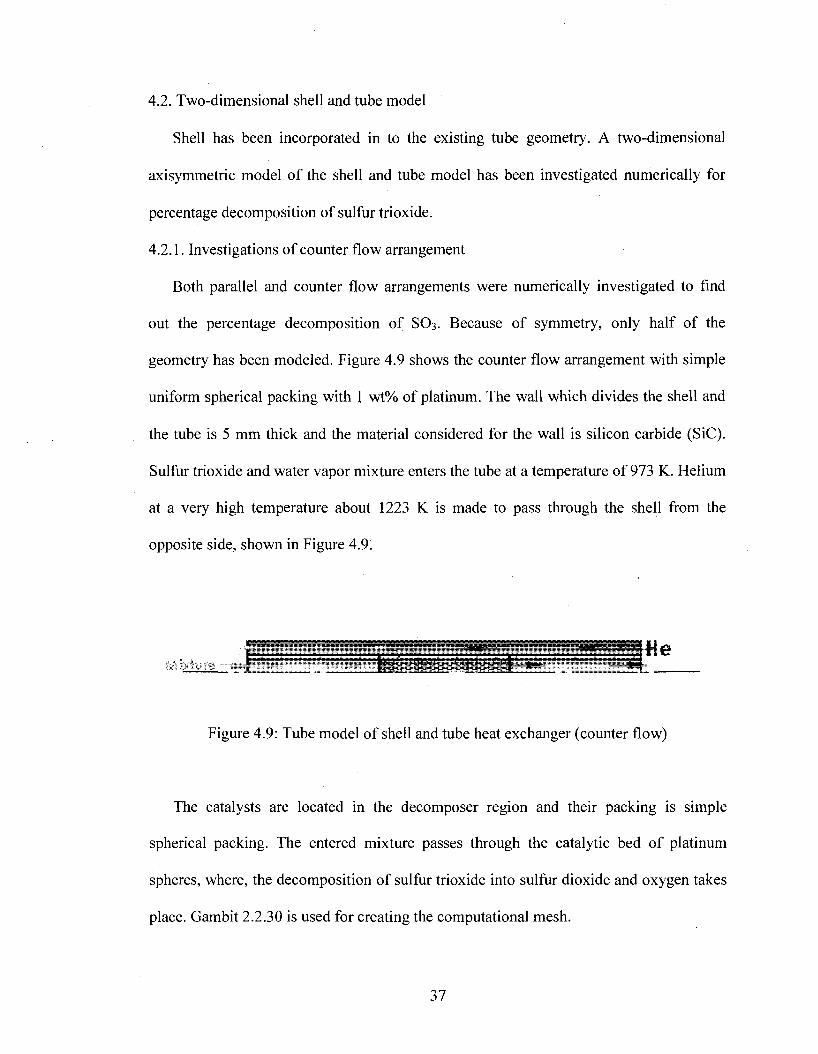
4.2. Two-dimensional shell and tube model
Shell has been incorporated in to the existing tube geometry. A two-dimensional
axisymmetric model o f the shell and tube model has been investigated numerically for
percentage decomposition o f sulfur trioxide.
4.2.1. Investigations o f counter flow arrangement
Both parallel and counter flow arrangements were numerically investigated to find
out the percentage decomposition o f SO3 . Because o f symmetry, only half o f the
geometry has been modeled. Figure 4.9 shows the counter flow arrangement with simple
uniform spherical packing with 1 wt% o f platinum. The wall which divides the shell and
the tube is 5 mm thick and the material considered for the wall is silicon carbide (SiC).
Sulfur trioxide and water vapor mixture enters the tube at a temperature o f 973 K. Helium
at a very high temperature about 1223 K is made to pass through the shell from the
opposite side, shown in Figure 4.9.
Figure 4.9: Tube model o f shell and tube heat exchanger (counter flow)
The catalysts are located in the decomposer region and their packing is simple
spherical packing. The entered mixture passes through the catalytic bed o f platinum
spheres, where, the decomposition o f sulfur trioxide into sulfur dioxide and oxygen takes
place. Gambit 2.2.30 is used for creating the computational mesh.
37
The inlet temperature o f the mixture and the inlet temperature o f helium, inlet
velocity o f the mixture and helium, exit pressure were used as the boundary conditions.
Tube side inlet temperature = 973 K
Tube side mass flow rate = 0.0018 kg/s
Operating pressure = 1.5 atm
Shell side inlet temperature=1223 K
Shell side mass flow rate= 0.0197 kg/s
Shell wall: adiabatic
Center line= axisymmetric boundary condition
The inlet velocity is calculated using the mass flow rate, the inlet area and the density o f
sulfur trioxide mixture. Pressure outlet is selected for outflow boundary conditions.
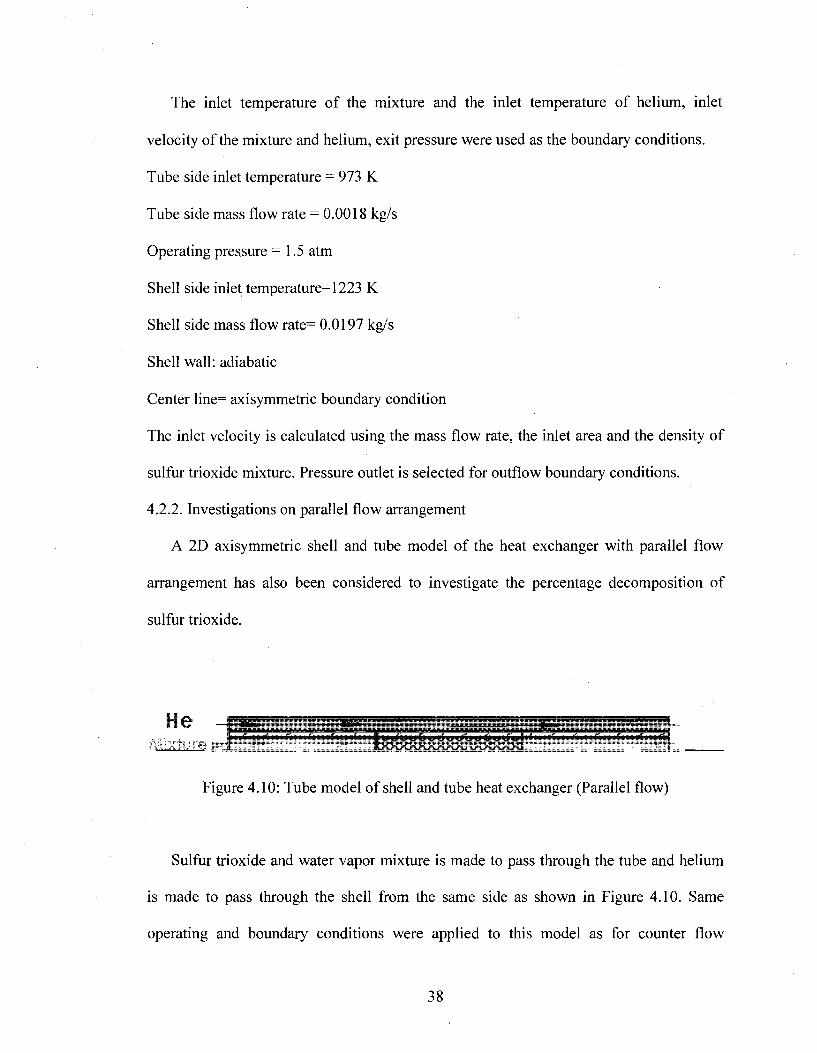
4.2.2. Investigations on parallel flow arrangement
A 2D axisymmetric shell and tube model o f the heat exchanger with parallel flow
arrangement has also been considered to investigate the percentage decomposition o f
sulfur trioxide.
He
Figure 4.10: Tube model o f shell and tube heat exchanger (Parallel flow)
Sulfur trioxide and water vapor mixture is made to pass through the tube and helium
is made to pass through the shell from the same side as shown in Figure 4.10. Same
operating and boundary conditions were applied to this model as for counter flow
38

arrangement to investigate the percentage decomposition o f sulfur trioxide. The entering
mixture passes through the catalytic bed zone where the decomposition takes place,
producing sulfur dioxide. The tube wall is 5.0 mm thick and is made o f SiC.
4.3. Material properties
It was assumed that the gas properties (density and dynamic viscosity) for the flow
areas do not depend on temperature significantly, therefore the properties were taken
constants for the areas with pressure 1.5 atm for the average temperatures and
concentrations. The mix gas properties for the reacting flow were calculated for the
component mass concentrations: psos^ 0.8164; p n io ^ 0.1836. The calculated properties
o f gases for the areas are below:
Density o f helium flow: 0.653 kg /m^
Density o f the reacting flow: 7.243 kg /m^
Viscosity o f helium flow: 1.99 10" kg /(m s)
Viscosity o f the reacting flow: 1.5 10'^ kg /(m s)
Figure 4.11 shows the optimum computational mesh for the geometry with 19,266 nodes
and 16,625 elements.
Figure 4.11: Computational mesh
39
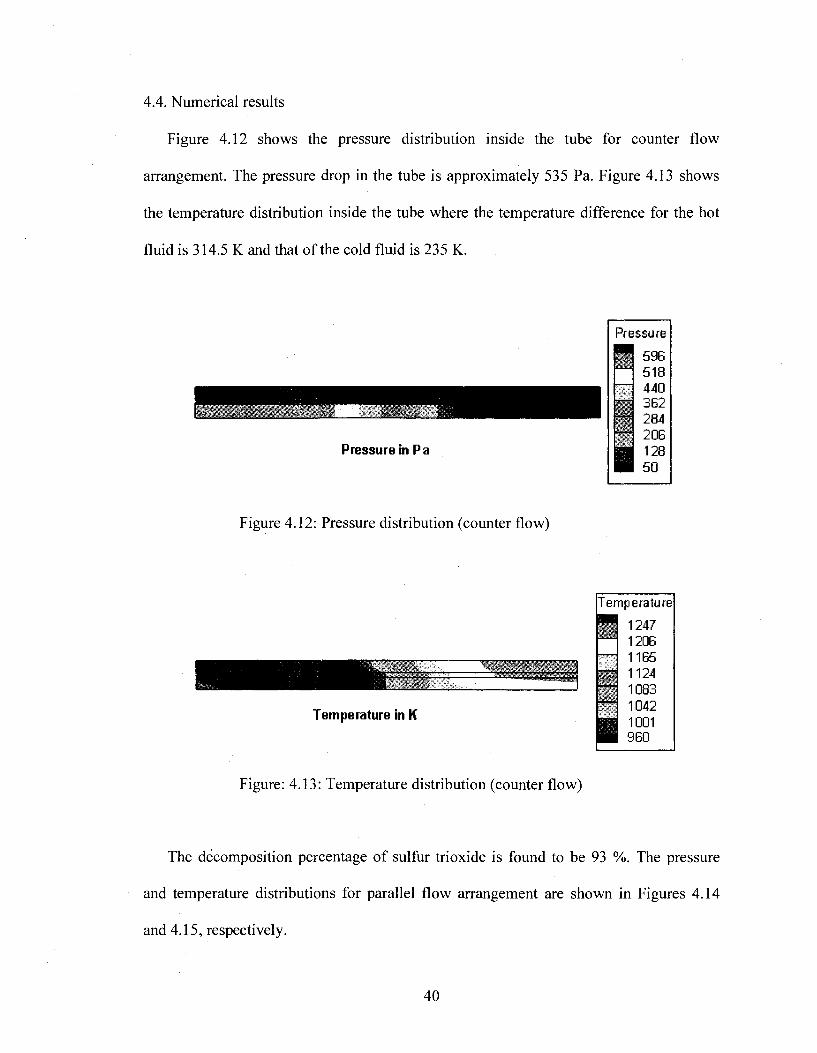
4.4. Numerical results
Figure 4.12 shows the pressure distribution inside the tube for counter flow
arrangement. The pressure drop in the tube is approximately 535 Pa. Figure 4.13 shows
the temperature distribution inside the tube where the temperature difference for the hot
fluid is 314.5 K and that o f the cold fluid is 235 K.
Pressure in Pa
Figure 4.12: Pressure distribution (counter flow)
Temperature In K
Pressure
Temperature
1247 1206 1165 1124 1083 1042 1001 960
Figure: 4.13: Temperature distribution (counter flow)
The decomposition percentage o f sulfur trioxide is found to be 93 %. The pressure
and temperature distributions for parallel flow arrangement are shown in Figures 4.14
and 4.15, respectively.
40
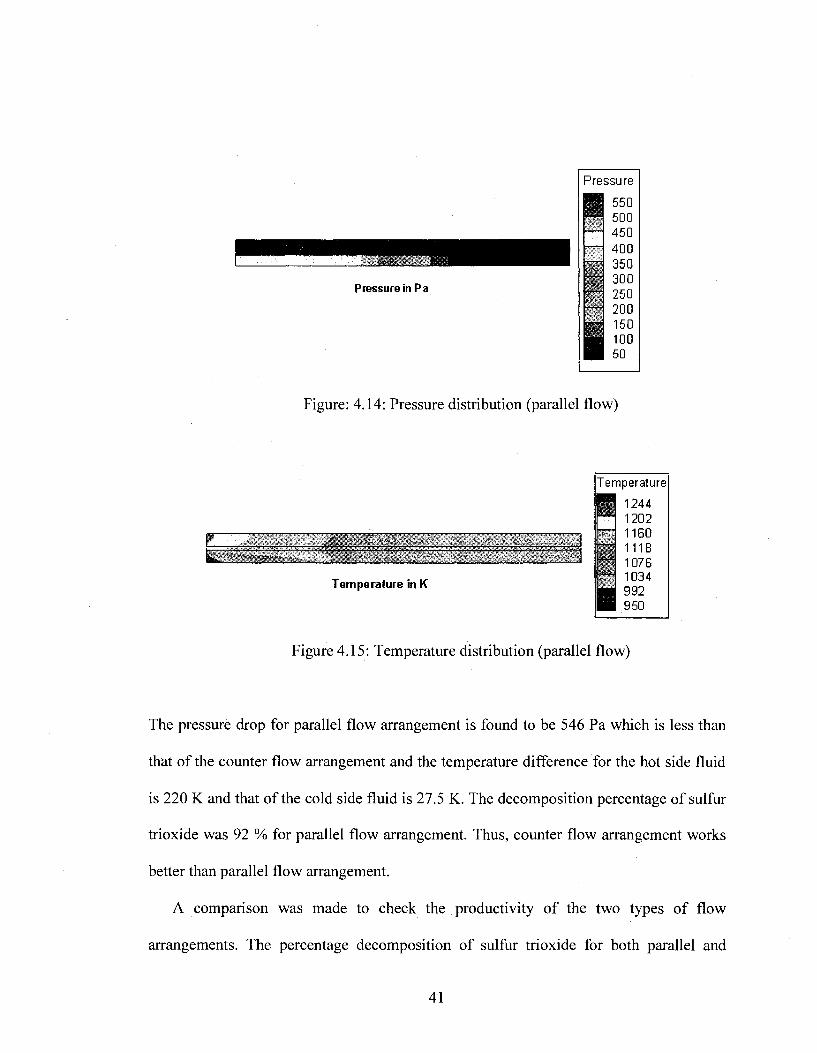
Pressure in Pa
Pressure
mm
Figure: 4.14: Pressure distribution (parallel flow)
1 . 1L ........ .................
Tem perature
Tem perature in K
Figure 4.15: Temperature distribution (parallel flow)
The pressure drop for parallel flow arrangement is found to be 546 Pa whieh is less than
that o f the counter flow arrangement and the temperature difference for the hot side fluid
is 220 K and that o f the cold side fluid is 27.5 K. The decomposition percentage o f sulfur
trioxide was 92 % for parallel flow arrangement. Thus, counter flow arrangement works
better than parallel flow arrangement.
A comparison was made to cheek the productivity o f the two types o f flow
arrangements. The percentage decomposition o f sulfur trioxide for both parallel and
4 1
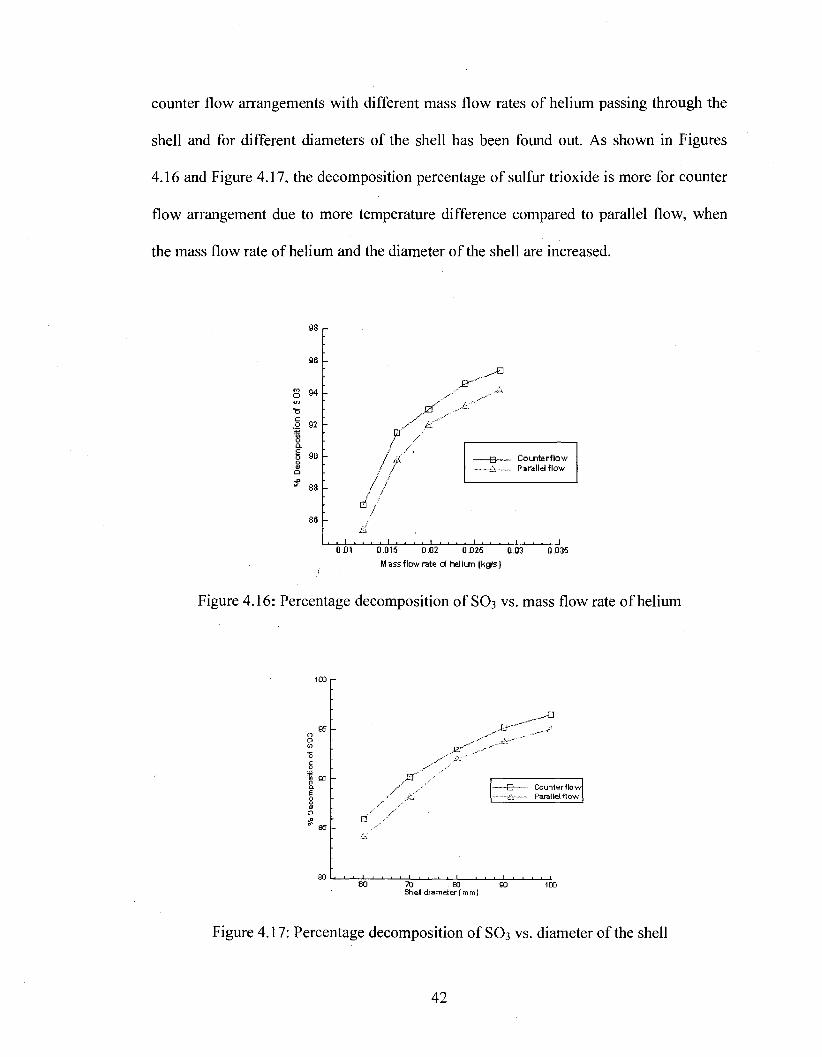
counter flow arrangements with different mass flow rates o f helium passing through the
shell and for different diameters o f the shell has been found out. As shown in Figures
4.16 and Figure 4.17, the decomposition percentage o f sulfur trioxide is more for counter
flow arrangement due to more temperature difference compared to parallel flow, when
the mass flow rate o f helium and the diameter o f the shell are increased.
96
94
ts.9 9Î
90
/ /
- g C o un te rflo w Parallel flow
0 01 0015 002 0025 003 0035M ass flow rate cf helium (kgts)
Figure 4.16: Percentage decomposition o f SO 3 vs. mass flow rate o f helium
,-a
“ B C ounter f low- A — Parallel flo w
70 80 %Shell d iam e te rfm m )
Figure 4.17; Percentage decomposition o f SO 3 vs. diameter o f the shell
42

Because sulfur trioxide decomposition reaction is catalytic surface reaction, the
choice o f the catalyst is very important to get high decomposition percentage. In the used
numerical model different types o f the catalyst are modeled by selection o f appropriate
activation energy value for the Arrhenius equation. Besides, the concentration o f the
catalyst in the catalyst carrier influence to the activation energy significantly. For
example, for the 1 wt % Pt the activation energy is 3.267 10^ J/kg-mol; for the 0.1 wt %
Pt the activation energy is 4.624 TO^ J/kg-mol. The parametric studies for different
activation energies have been completed in the research. From Figure 4.18 it can be
observed that, the sulfuric trioxide decomposition percentage increases with the decrease
o f the activation energy for the both parallel and counter flow cases
100 I -
80
c 60 .2
C oun te r flow Parallel flow
5E+07 1E+08 1.5E+08Activation ene rgy (J/kg mol)
Figure 4.18; Percentage decomposition o f SO 3 vs. activation energy
43

CHAPTER 5
3-D FLOW DISTRIBUTION ON THE TUBE SIDE OF HIGH TEMPERATURE
SHELL AND TUBE HEAT EXCHANGER
AND CHEMICAL DECOMPOSER
5.1. Investigations on 3-D tube configuration
The uniformity o f the flow distribution in the heat exchanger is very critical because
the flow maldistribution among the tube or shell sides can result in decreasing o f
chemical decomposition and increasing o f pumping power. In the current study the flow
rate uniformity in the heat exchanger tubes has been investigated. Simulations o f the
straight tube configuration, tube configuration with baffle plate arrangement and with
pebble bed region inside the tubes were performed to examine flow distribution on the
tube side. The investigated 3-D tube configuration o f the shell and tube heat exchanger is
shown in Figure 5.1. Based on the literature search the dimensions for the computational
domain chosen were 24 tubes o f 1.5 m length and 16 mm in diameter. In the current work
flow calculations were performed for the mixture o f sulfur trioxide and water vapor (acid
vapor mixture) passing through the tubes for the following three cases.
Case I (Baseline design): This case is a simple one without any catalyst placed inside
the tubes. The dimensions o f the tube configuration are shown in Figure 5.1.
44
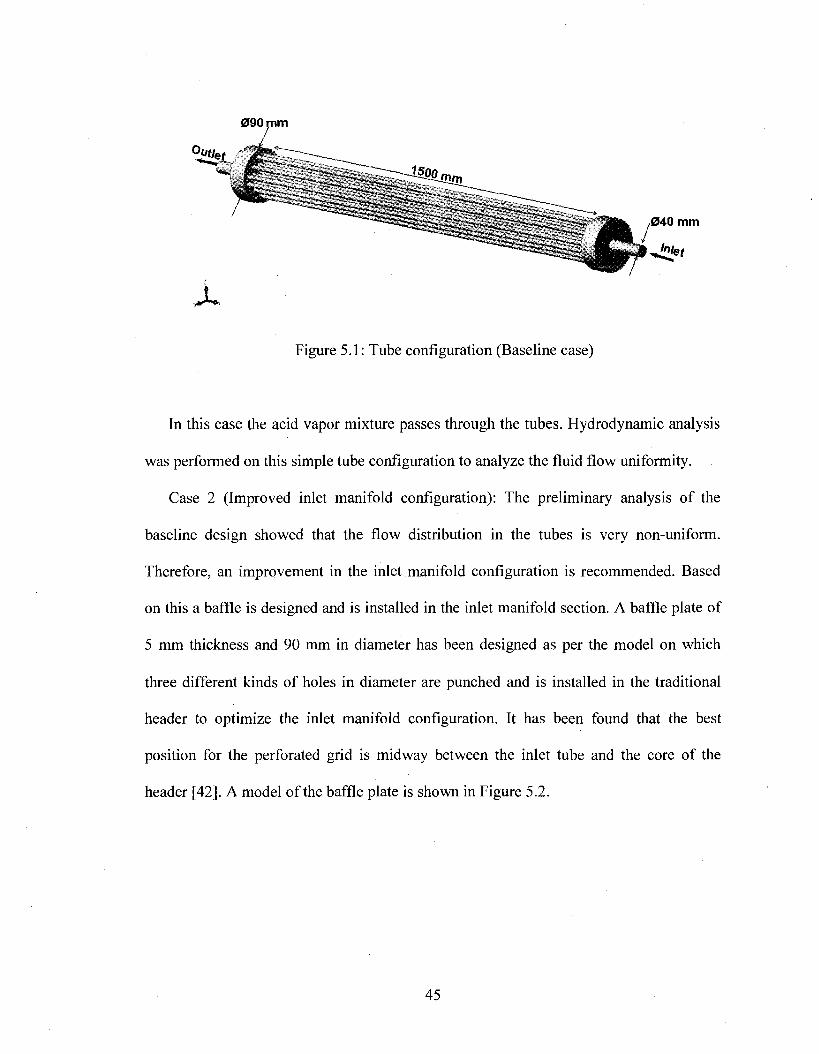
090 mm
040 mm
XFigure 5.1 : Tube configuration (Baseline case)
In this case the acid vapor mixture passes through the tubes. Hydrodynamic analysis
was performed on this simple tube configuration to analyze the fluid flow uniformity.
Case 2 (Improved inlet manifold configuration): The preliminary analysis o f the
baseline design showed that the flow distribution in the tubes is very non-uniform.
Therefore, an improvement in the inlet manifold configuration is recommended. Based
on this a baffle is designed and is installed in the inlet manifold section. A baffle plate o f
5 mm thickness and 90 mm in diameter has been designed as per the model on which
three different kinds o f holes in diameter are punched and is installed in the traditional
header to optimize the inlet manifold configuration. It has been found that the best
position for the perforated grid is midway between the inlet tube and the core o f the
header [42]. A model o f the baffle plate is shown in Figure 5.2.
45
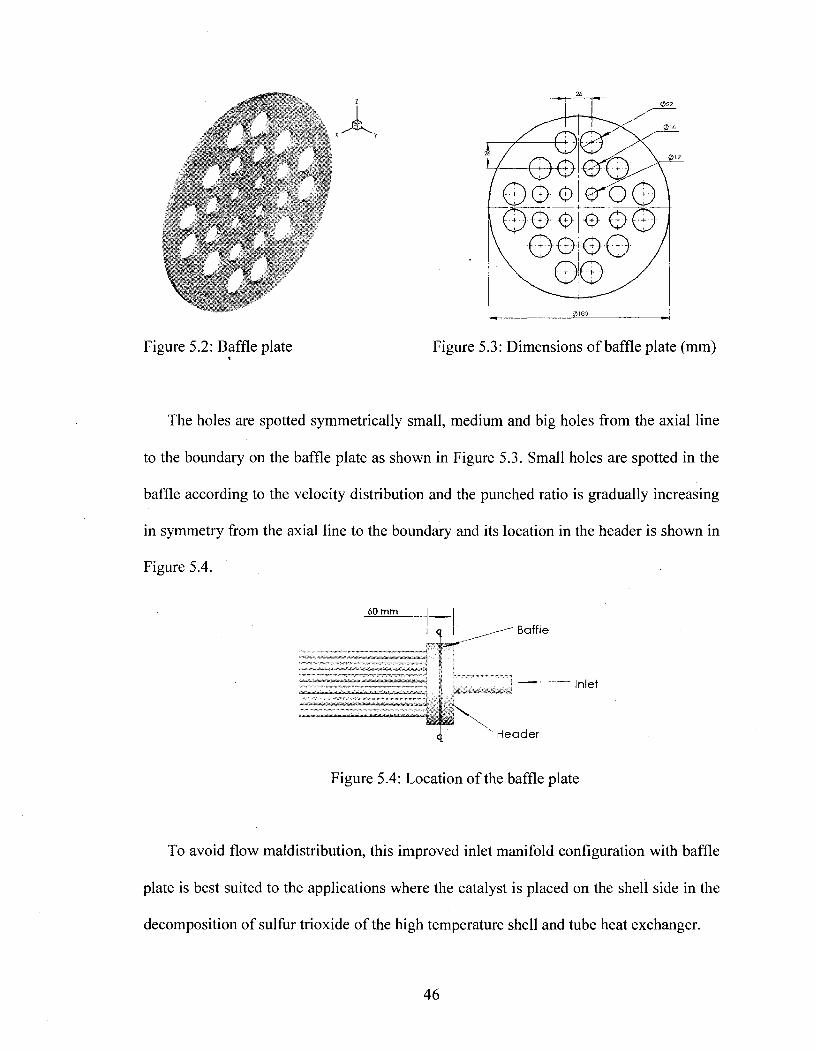
0 22
012
Figure 5.2: Baffle plate Figure 5.3: Dimensions o f baffle plate (mm)
The holes are spotted symmetrically small, medium and big holes from the axial line
to the boundary on the baffle plate as shown in Figure 5.3. Small holes are spotted in the
baffle according to the velocity distribution and the punched ratio is gradually increasing
in symmetry from the axial line to the boundary and its location in the header is shown in
Figure 5.4.
60 m m
Baffle
* L
' Header
Inlef
Figure 5.4: Location o f the baffle plate
To avoid flow maldistribution, this improved inlet manifold configuration with baffle
plate is best suited to the applications where the catalyst is placed on the shell side in the
decomposition o f sulfur trioxide o f the high temperature shell and tube heat exchanger.
46

Case 3 (Tube configuration with pebble bed zone): Fluid flow calculations were
performed for the tube configuration with porous media zone in the tubes to check the
flow uniformity. A catalytic bed zone is created inside the tubes along the whole length
and porous medium approach has been applied to this catalytic bed. Tube configuration
with pebble bed is shown in Figure 5.5, where a pebble bed zone is created inside the
tubes along the whole length and the catalytic zone one-third from the tubes inlet section
so that, when the acid vapor mixture passes through the tube, a temperature rise is found
along the tube, whieh further leads to an increase in the decomposition percentage o f
sulfur trioxide. The baffle plate has been removed in this arrangement. Spherical pellets
o f diameter 5.0 mm filled the space inside the tubes. A porous medium approach has
been applied to this type o f catalytic bed arrangement inside the tubes and flow
uniformity was investigated.
Pebble bed
Figure 5.5: Tube configuration with pebbles inside the tube
47

5.2. Boundary conditions
A mass flow inlet rate boundary condition was applied to the inlet o f the computation
domain and the pressure outlet boundary condition \yas used to the outlet. The non slip
boundary conditions are used for all o f the walls. The mass flow inlet for the baseline
conditions is 0.044 kg/see based on GA flowsheet [3].
Since the flow at the entrance region (Re=60,841) is turbulent, a turbulent model has
been used to compute the flow distributions. The SST (Shear-Stress Transport) k-co
turbulence model was used with enhanced wall functions for the near wall treatment.
5.3. Computational mesh
A computational mesh has been generated using the pre-processor Hypermesh 7.0.
The implemented mesh involved 783,373 cells and 505,368 nodes (Figure 5.6)
Figure 5.6: Computational mesh
48
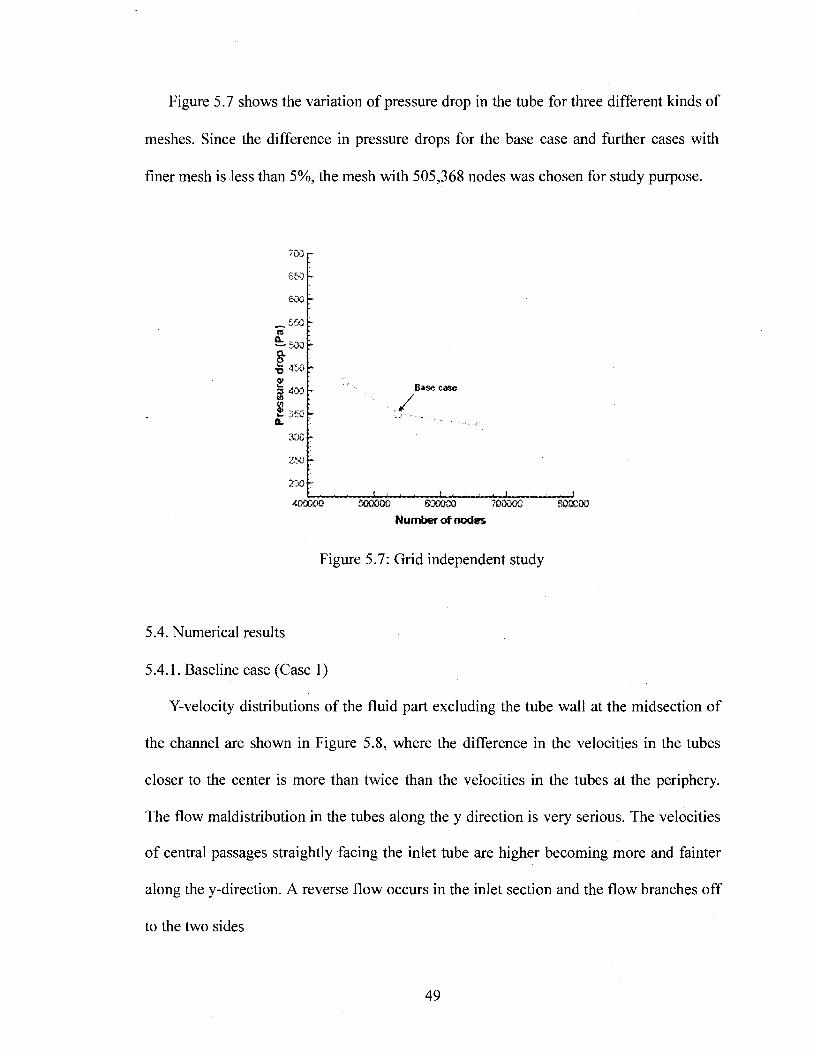
Figure 5.7 shows the variation o f pressure drop in the tube for three different kinds o f
meshes. Sinee the difference in pressure drops for the base ease and further eases with
finer mesh is less than 5%, the mesh with 505,368 nodes was chosen for study purpose.
700 -
650
600
_ 5 5 0
t-5 0 0 —
8-
1 400
@ 350CL
300
250
200 “
400000
, /Base case
JL500000 600000 700000 800000
Nunterol nodes
Figure 5.7: Grid independent study
5.4. Numerical results
5.4.1. Baseline ease (Case 1)
Y-veloeity distributions o f the fluid part excluding the tube wall at the midseetion o f
the channel are shown in Figure 5.8, where the difference in the velocities in the tubes
closer to the center is more than twice than the velocities in the tubes at the periphery.
The flow maldistribution in the tubes along the y direction is very serious. The velocities
o f central passages straightly facing the inlet tube are higher becoming more and fainter
along the y-direetion. A reverse flow occurs in the inlet section and the flow branches o ff
to the two sides
49
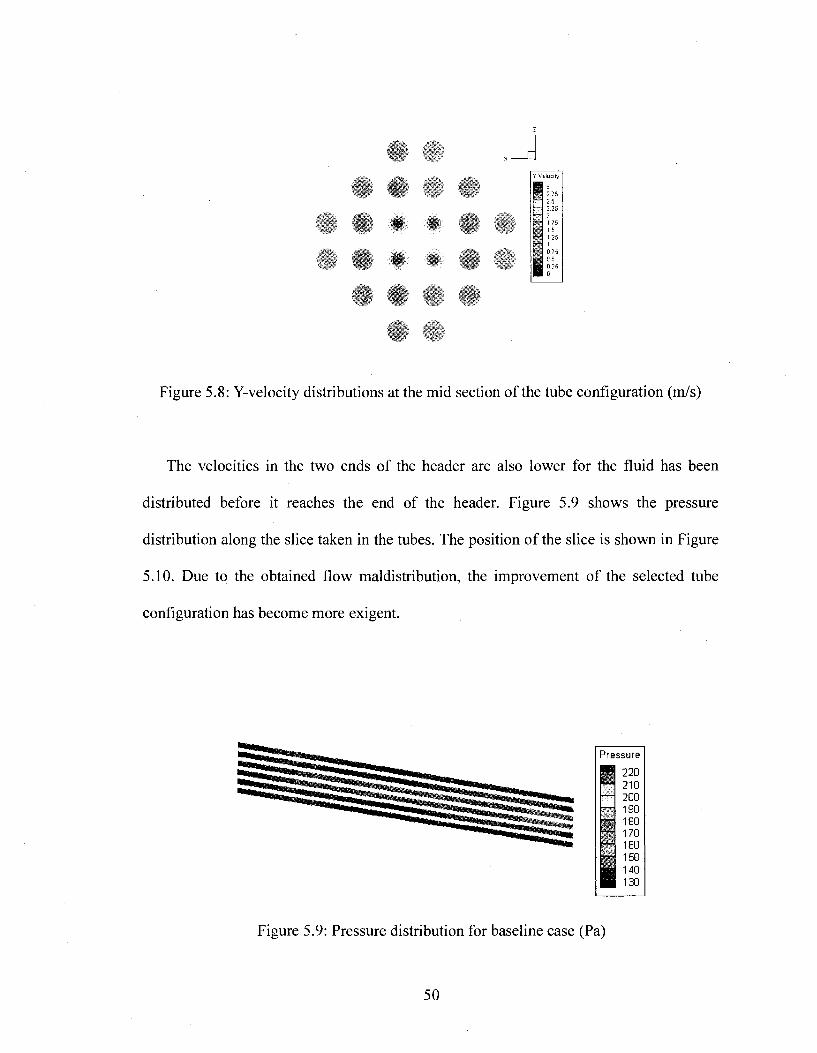
Y V elocity
;2.52,25
1 751 5
am1 25
i f0 25B 0
Figure 5.8: Y-velocity distributions at the mid section o f the tube configuration (m/s)
The velocities in the two ends o f the header are also lower for the fluid has been
distributed before it reaches the end of the header. Figure 5.9 shows the pressure
distribution along the slice taken in the tubes. The position o f the slice is shown in Figure
5.10. Due to the obtained flow maldistribution, the improvement o f the selected tube
configuration has become more exigent.
Pressure
Figure 5.9: Pressure distribution for baseline case (Pa)
50

s lice p la n e
Figure 5.10; Slice plane o f the tube configuration
5.4.2. Tube configuration with baffle plate (Case 2)
Y-velocity and pressure distributions at the midsection o f the channel are shown in
Figures 5.11 and 5.12, respectively. Figure 5.12 shows the pressure drop in the tube
configuration for Case 2 taken along the slice shown in Figure 5.10 which is less when
compared to the baseline case. So baffle serves better in reducing the pressure drop.
# eY Velocity
M L2.5
— 2.25— 2
S1.75
0,5
0.05
Figure 5.11 : Y velocity distributions at the mid section with baffle plate (m/s)
51

Figure 5.12: Pressure distribution with baffle plate (Fa)
Although a reverse flow occurs at the inlet section, there is a considerable
improvement in the flow distribution. The difference in the velocities in the tubes closer
to the center and that at the periphery is very small compared to the Case 1. The
improved header installed with baffle can effectively enhance the flow uniformity. It is
noticeable that the baffle configuration has the relationship with header configuration and
fluid flow condition, which must be in consideration in the optimization o f baffle
configuration. It can be foreseen that the fluid flow can be distributed uniformly when the
baffle is suitable in dimensions, the holes punched on it are distributed in an in-line
arrangement and the punched ratio increases gradually from the axial line to the
boundary. As discussed by Lin et al. [14] for a high temperature shell and tube heat
exchanger, if the catalyst is placed on the shell side, this arrangement helps to reduce the
flow maldistribution.
52

5.4.3. Tube eonfiguration with porous medium (Case 3)
In this type o f arrangement, the baffle plate has been removed. Instead o f baffle plate,
the whole tube has been filled with pebbles whieh aet as a porous medium for the flow
through it. From Figure 5.13, it is clear that the problem o f flow maldistribution has been
solved with a noticeable uniformity in the flow distribution. The difference in the
velocities in the tubes closer to the center and in the tubes at the periphery is negligible.
The pebble bed zone offers a very high resistance to the inlet flow, due to whieh the flow
has been re-distributed in the header section resulting in a uniform flow in the tubes. An
increase in the pressure drop can be seen from Figure 5.14 taken along the slice shown in
Figure 5.10
J
Figure 5.13: Y velocity distributions at midsection o f the tube eonfiguration (m/s)
Pressure
2900026000
— 23000— 20000
170001400011000800050002000
Figure 5.14: Pressure distribution with porous medium (Pa)
53
CHAPTER 6
THREE-DIMENSIONAL NUM ERICAL CALCULATIONS OF SHELL AND TUBE
HEAT EXCHANGER AND CHEMICAL DECOMPOSER
6.1. Investigations on 3-D shell and tube model
A sulfur trioxide decomposer needs a design that enhances chemical decomposition.
A counter flow type heat exchanger with hot fluid flowing through the shell and cold
fluid flowing through the tubes is considered using the three-dimensional numerical
analysis. A three-dimensional numerical model o f the conceptual design o f sulfur trioxide
is shown in Figure 6.1.
Dividng plate ■Helium in let ( 0 100
130Tube outlet040.0
Tube inlet
-Helum ou tle t
Figure 6.1: Three-dimensional shell and tube heat exchanger (mm)
54
Twenty four tubes o f 16 mm diameter were modeled for numerical analysis. The tube
is 4 mm thick with a tube pitch o f 31.75 mm. The shell diameter considered is 210 mm.
A dividing plate o f 4 mm thickness has been used in the inlet manifold section which
prevents mixing o f both the fluids. The material o f heat exchanger at this point is
considered as silicon carbide (SiC). The decomposer essentially is a counter flow type
heat exchanger with hot fluid (helium) entering the decomposer from one end (shell) and
allowing the cold fluid (reacting mixture) to enter the tubes at the other end. The required
thermal energy for the reaction is obtained from high temperature helium. Due to the
presence o f the pebble bed region inside the tubes, the flow is assumed to be uniform
based on previous investigations. Preliminarily, fluid flow analysis was performed on the
shell and tube heat exchanger model.
6.2. Boundary conditions
Mass flow inlet rate boundary condition was applied to the inlet o f the computation
domain and the pressure outlet boundary condition was used to the outlet. The non-slip
boundary conditions are used for all o f the walls. The reacting mixture mass flow rate is
158.66 kg/hr and the helium mass flow rate is 71 kg/hr based on the GA flowsheet [3].
The operating pressure is 1.5 atm and the shell wall is assumed to be adiabatic.
Since the flow at the tube entrance region (Re=60,841) and also at the helium
entrance region (Re= 12,469), is turbulent, a turbulent model has been used to compute
the flow distributions. The SST (Shear-Stress Transport) k-co turbulence model was used
with enhanced wall functions for the near wall treatment.
55
Preliminary analysis shows that reverse flow occurred in most o f the sections, due to
insufficient entrance length particularly at the tube entrance, tube exit and also at the shell
inlet and at the shell outlet. So the length o f the shell inlet as well as at the outlet was
increased by three times. The diameter o f the tube at the inlet as well as at the exit
sections was also increased from 40 mm to 60 mm. Figure 6.2 shows the modified design
o f the heat exchanger.
060 mm
300 mm
^
Figure 6.2: Modified heat exchanger
Computational mesh was generated using Hypermesh 7.0. After grid independent study
the mesh with 1,046,816 elements and 1,269,192 nodes was selected for study purpose.
Figure 6.3 shows the computational mesh.
56

(a)
(b)
Figure 6.3: Computational mesh
Figure 6.4 shows the grid independent study that was performed on the heat exchanger.
The variations in the pressure drop on the tube side as well as on the shell side were the
57
parameters which were observed during the grid independent study. The variations were
less than 6 %, therefore, the geometry is independent o f mesh.
!L
ig esi
I"e
/
_L.
NùRAef of modem
(a)
70
e»
F ^
So *5 40
III'Bg
30
8.15e-case
500000 !E*OG t 5 E « « 2E«06
Of nodw
(b)
Figure 6.4: Grid independent study
58

Numerical analysis including thermal and fluid flow analysis was carried out on the
modified model o f the shell and tube heat exchanger for sulfur trioxide decomposition.
Analysis also includes the chemical reaction modeling inside the tubes.
6.3. Numerical results
Numerical analysis shows that the decomposition percentage o f sulfur trioxide in the
tubes o f the heat exchanger was 17 %. Figure 6.5 shows the temperature distribution o f
the heat exchanger. The outlet temperature o f the shell fluid is 1050 K.
Temperature
R 1199.6m 1163
S 1126.41089 8
' 1053.2
01016.6980
(a)
Temperature
1199.81168.4
1105,61074,21042.8101 4
(b)
Figure 6.5: Temperature distribution o f the heat exchanger with baffles (K)
59
3S0«OxnwaTWWQZDSMOISOMflsoaw
Figure 6 .6 : Pressure distribution on the shell side (Pa)
Figure 6 . 6 shows the pressure distribution on the shell side o f the heat exchanger.
Heat exchanger effectiveness was calculated based on the temperatures o f the hot and
cold fluids. A detailed description o f the calculations is given in APPENDIX II. The
effectiveness o f the heat exchanger was 0.67 and the throughput o f sulfur dioxide was
0.0032 kg/s.
6.4. Parametric study
Parametric study was performed on the heat exchanger in order to find the effect o f
variation o f parameters like mass flow rate o f the reacting mixture and the mass flow rate
o f helium on percentage decomposition o f sulfur trioxide. Figure 6.7 shows the effect o f
variation o f mass flow rate o f helium. It was found that as the mass flow rate o f helium
was increased, there was an increase in the decomposition percentage o f sulfur trioxide.
This is because as more amount o f helium enters the shell, more heat is getting
60
transferred to the tubes as a result o f which there is an increase in the decomposition
percentage.
20
m 18
e
16
14
B a se c a s e
J L J LM 250 #0Mass flaw rate of helkan (kg!hr)
Figure 6.7: Mass flow rate o f He vs. decomposition percentage
Figure 6 . 8 shows the cross-section o f tube temperature distribution along the slice shown
in Figure 5.10 and when the mass flow rate of helium is lowest (decreased by 0.5 times).
Figure 6.9 shows the temperature distribution in the tubes for the same slice (Figure5.10)
when the helium mass flow rate is highest (increased by 4 times). From Figures 6 . 8 and
6.9 we can observe that the temperature in the tubes is more when the mass flow rate o f
helium is increased.
61

Temperature
1174114511161 10871058
g 10291000
Figure 6 .8 : Temperature(K) distribution along the tubes cross section for low m He
Temperature
1174114511161087105810291000
Figure 6.9: Temperature(K) distribution along the tubes cross section for high m He
Figure 6.10 shows the effect o f variation o f mass flow rate o f the reacting mixture
entering the tubes. An increase in the percentage decomposition o f sulfur trioxide was
observed as the mass flow rate o f the reacting mixture entering the tubes decreased. This
is because, as the mass flow rate o f the mixture is decreased, the residence time o f the
mixture during chemical reaction is increased. This further enhances the chemical
reaction and decomposition percentage as well.
62

60
50
30
20
10
Base case
» I K 2M 2K %0 a oMass <tow rale ot S03 mcctura (kg,'hr)
Figure 6.10: Mass flow rate o f SO3 mixture vs. decomposition percentage
6.5. Numerical analysis o f shell and tube heat exchanger with baffles
In order to increase the decomposition percentage o f sulfur trioxide in the heat
exchanger along with enhancement o f the heat transfer, baffles were added to the heat
exchanger. Five conventional segmental baffles were added to the existing design o f shell
and tube heat exchanger. The baffles are 5 mm thick with a cut o f 20%. Baffle to baffle
spacing is 245 mm. The baffle arrangement on the tubes is shown in Figure 6.11.
63
(a)
(b)
Figure 6.11 : Shell and tube heat exchanger with five baffles
Numerical analysis was performed on the heat exchanger with baffles for finding the
percentage decomposition o f sulfur trioxide. The computational grid was generated with
1,744,162 nodes and 1,466,494 elements. Figure 6.12 shows the computational mesh.
64

Figure 6.12: Computational grid
6 .6 . Numerical results
The decomposition percentage o f sulfur trioxide in the tubes o f the heat exchanger
was found to be 20 % when five baffles were considered at 1.5 atm and with the mass
flow rate o f helium as 71 kg/hr and that o f the mixture as 158.66 kg/hr. Figure 6.13
shows the streamlines inside the heat exchanger. We can observe few circulations in the
helium inlet and outlet sections.
65

Temperature
Figure 6.13: Streamlines inside the heat exchanger with five baffles (K)
Figure 6.14 shows the temperature distribution o f the heat exchanger. No significant
increase in the decomposition percentage was observed in the heat exchanger because,
the heat from helium was not effectively used in decomposing sulfur trioxide. The reason
for this is that, there are few tubes in the periphery o f the tube configuration where the
temperature was very less through out the length o f the tubes which reduced the rate o f
chemical reaction.
Temperature
1160114011201100
3 3 1080— 1060
104010201000980
(a)
66
Temperature
1199.511711142.511141 085.51057
g 1 028.51000
(b)
Figure 6.14: Temperature distribution o f the heat exchanger with five baffles (K)
Figure 6.15 shows the temperature distribution along the slices which were taken on the
tube configuration.
Y*i45 m* #
* # * * # * #
# *Y=0.96 m
# #« • • •
# # * #
Y«042 m ^
Temperature
1120 11001080108010401020
■ 1000
Figure 6.15: Temperature distribution along slices with five baffles (K)
Figure 6.16 shows the distribution o f SO 3 in the tubes, at one slice in the x direction
taken along the slice shown in Figure5.10. From the figure it is observed that as we move
from the tube inlet towards the tube outlet, the mass fraction o f SO 3 decreases due to the
67

chemical reaction that is taking place in the tubes. Figure 6.17 shows the distribution of
SO 2 in the tubes taken along the slice shown in FigureS.lO. We can find that the average
mass fraction o f SO2 increases as we move towards the tube outlet. Because o f the
chemical reaction that is taking place, SO3 is getting decomposed into SO2 .
so 3
0.7990.7820.7650 7480.7310,7140.697
Figure 6.16: Average mass fraction o f SO3 taken along central tubes
Figure 6.17: Average mass fraction o f SO2 taken along central tubes
The heat exchanger effectiveness was calculated based on the temperatures o f the hot and
cold fluids. A detailed description o f the calculations is given in APPENDIX II. The
68

effectiveness o f the heat exchanger was 0.70 and the throughput o f sulfur dioxide was
0.007 kg/s.
6.7. Numerical analysis o f shell and tube heat exchanger with 9 baffles.
The heat exchanger design was modified in terms o f number o f baffles. Baffles were
increased from five to nine in order to observe the variation in decomposition percentage
o f SO3 . The baffles are 5 mm thick with a cut o f 20%. Baffle to baffle spacing is 125 mm.
Numerical analysis was performed on the heat exchanger with nine baffles for finding
the percentage decomposition o f sulfur trioxide.
6 . 8 Numerical results
Decomposition percentage o f sulfur trioxide in the tubes o f the heat exchanger was
found to be 26 % when nine baffles were considered at 1.5 atm with helium mass flow
rate o f 71 kg/hr and that o f the mixture o f 158.66 kg/hr. Figure 6.18 shows the
streamlines inside the heat exchanger, where we can observe small circulations in the
shell inlet as well as in the outlet region.
69

Temperature
1199.81166.51133.21099.91066.61033.31000
Figure.6.18: Streamlines inside the heat exchanger (K)
Figure 6.19 shows the temperature distribution o f the heat exchanger along the tube
side as well as along the shell side.
Temperature—». 1199 8
1166 51133 2
7^ 1093.91DB6.B10 33 31000
(a)
70

Temperature
1060
(b)
Figure.6.19: Temperature distribution o f the heat exchanger with nine baffles (K)
Figure 6.20 shows the temperature distribution along the slices when nine baffles were
considered.
V . * *\ * # # #
# # * * 4 *
• « • •# #
Y=1.45 m
Y=0.96 m
* *# « # 4
# # # # * # * « # # # *
« » • •
T enpersture
Y=0.42 m
Figure.6.20: Temperature distribution o f the heat exchanger with nine baffles (K)
71

The distribution o f SO3 in the tubes at one slice taken along the tubes (Figure 5.10) is
shown in Figure 6.21. Due to the chemical reaction that is taking place in the tubes, the
mass fraction o f SO3 is getting decreased. From Figure 6.22 it can be observed that
because SO3 is getting decomposed in to SO2 and O2 , we can find that the mass fraction
o f SO2 increases as we move towards the tube outlet.
Figure 6.21 : Average mass fraction o f SO3 taken along central tubes
Heat exchanger effectiveness was increased to 0.78 compared to the heat exchanger
with five baffles which was 0.70. As the number o f baffles is increased, the reaction
proceeds for a longer time as a result o f which an increase in the decomposition
percentage is observed. The throughput o f SO2 was also increased to 0.0075 kg/s.
72
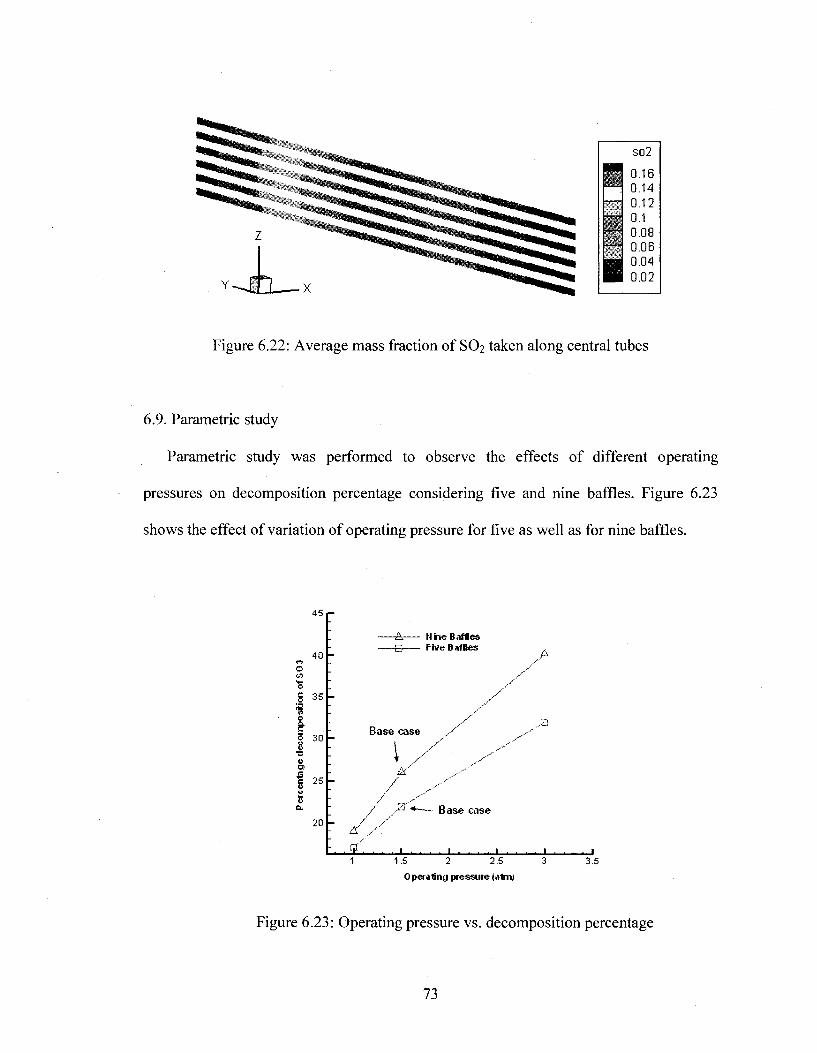
Figure 6.22: Average mass fraction o f SO2 taken along central tubes
6.9. Parametric study
Parametric study was performed to observe the effects o f different operating
pressures on decomposition percentage considering five and nine baffles. Figure 6.23
shows the effect o f variation o f operating pressure for five as well as for nine baffles.
45
40
OS 35
I■s
25
4L
20
-&---- lin e Baffles-A Five Baffles
Base case /
/\ /
//
il Base case
_i_ _L1 1.5 2 2.5
Opeialiiig piesstiielalm)3.5
Figure 6.23: Operating pressure vs. decomposition percentage
73

From the performed parametric study it was observed that there is an increase in the
decomposition percentage o f SO3 with an increase in the operation pressure for the five
as well as for the nine baffle arrangement. As we increase the operating pressure, the
density o f the fluid increases which results in a decrease o f velocity o f the fluid for a
constant mass flow rate. So as the velocity decreases, the residence time o f the mixture
increases which enhances the reacting time o f the mixture. This results in an increase in
the decomposition percentage.
The increase in the decomposition percentage was more in the heat exchanger with
nine baffles compared to the heat exchanger with five baffles.
6.10. Comparison o f temperature, SO3 , and SO 2 distributions in the tubes o f the heat
exchanger with five and nine baffles
A comparison o f temperature distributions inside the tubes was made in the heat
exchanger with five and nine baffles. Slices in y-direetion were taken at three different
positions. Figure 6.24 shows temperature distribution at the three slices which were taken
along the y-direction o f the heat exchanger considering five baffles. Figure 6.25 shows
the temperature distribution along the slices for the heat exchanger when nine baffles
were considered. From Figures 6.24 and 6.25 we can observe that the temperature in the
tubes is high for nine baffles compared to five baffles which resulted in enhancing the
decomposition percentage o f SO3 .
74
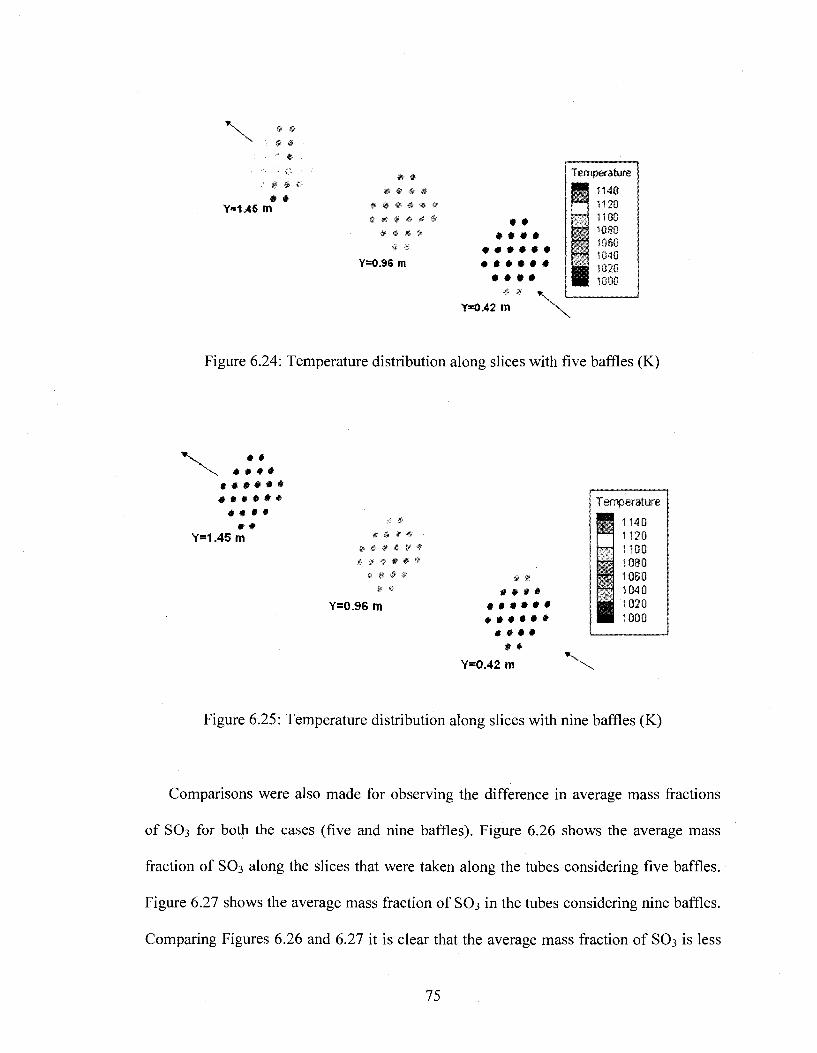
X
Y » 1 ^ 5 m
Y=0.96 m
Temperaturee
Y*0.42 m
Figure 6.24: Temperature distribution along slices with five baffles (K)
V • *X , # # # *
# # # # # # # # # # # *
« « • •# «
Y = 1 .4 5 m
Y = 0 .9 6 m# * # #
# # * # # # 0 • * 9
* «Y = 0 .4 2 m
Terrperature
1140 1120 noo1030 10G0 1040 1020 1000
Figure 6.25: Temperature distribution along slices with nine baffles (K)
Comparisons were also made for observing the difference in average mass fractions
o f SO3 for both the cases (five and nine baffles). Figure 6.26 shows the average mass
fraction o f SO3 along the slices that were taken along the tubes considering five baffles.
Figure 6.27 shows the average mass fraction o f SO 3 in the tubes considering nine baffles.
Comparing Figures 6.26 and 6.27 it is clear that the average mass fraction o f SO3 is less
75
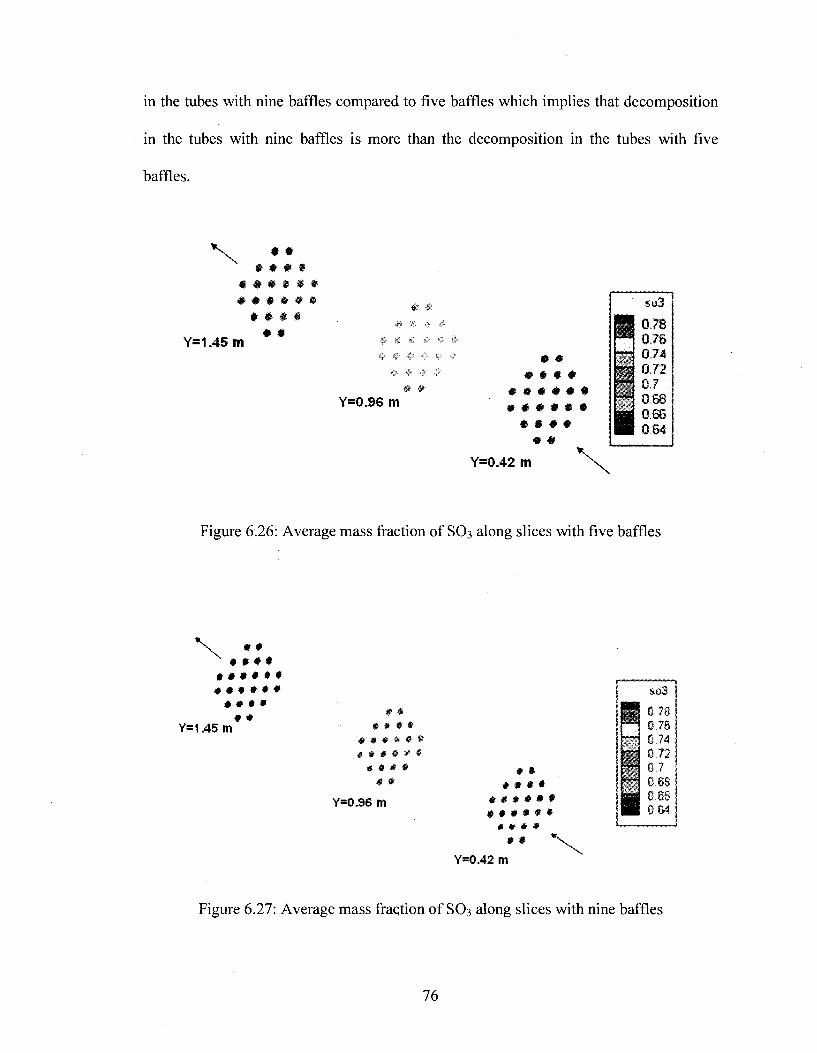
in the tubes with nine baffles compared to five baffles which implies that decomposition
in the tubes with nine baffles is more than the decomposition in the tubes with five
baffles.
Y=1.45 m
# ## # * #
# * # * * # $ # # # * #
# # # ## #
Y=0.96 m
Y=0.42 m
# # # *
Figure 6.26: Average mass fraction o f SO3 along slices with five baffles
N \
Y = 1 .4 5 m
* # # # # #
• • • « i i * # * * * #
* # # ** * * *
# # # * # # * * # #
« # * ## *
Y = 0 .9 6 m
# ** # # #
# # # # # # # # # # # #
# * # ## #
Y = 0 .4 2 m
Figure 6.27: Average m ass fraction o f SO3 along slices with nine baffles
76
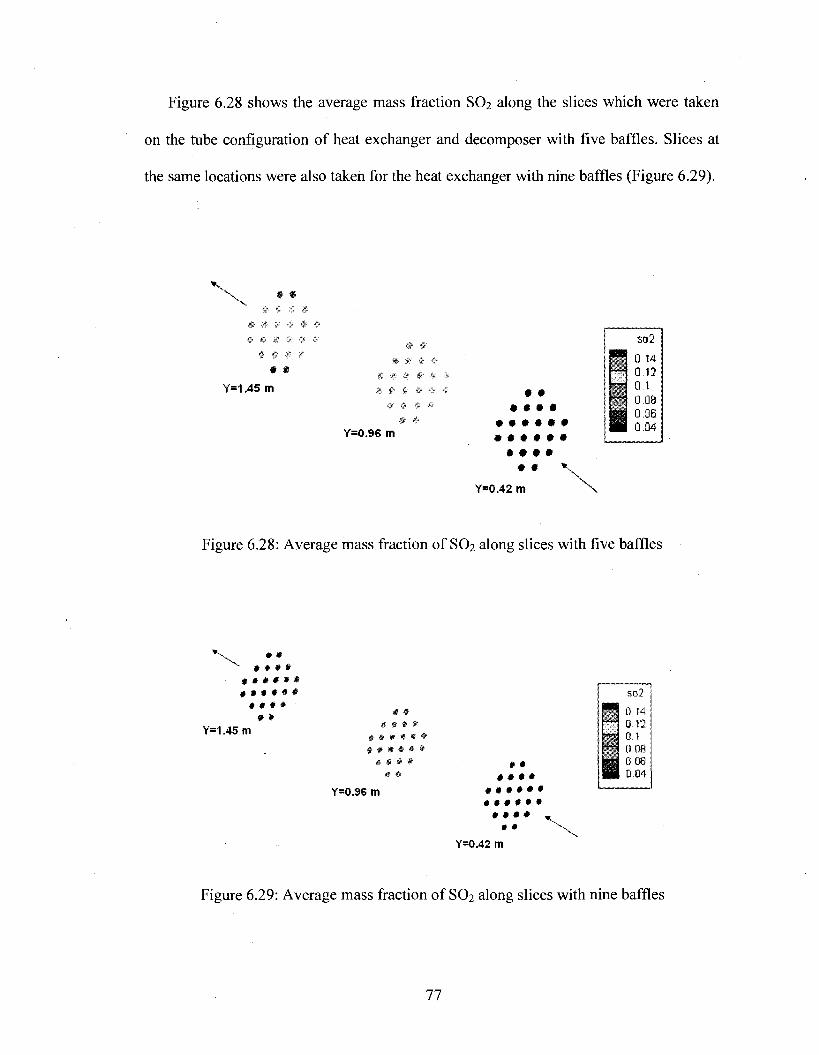
Figure 6.28 shows the average mass fraction SO2 along the slices which were taken
on the tube configuration o f heat exchanger and decomposer with five baffles. Slices at
the same locations were also taken for the heat exchanger with nine baffles (Figure 6.29).
# #
*
Y=1.45 m
Y=0.9B m
# ## # # #
* * * # # #
# # # *
Y=0.42 m
so 2
Figure 6.28: Average mass fraction o f SO2 along slices with five baffles
'X • «^ # # * #
, * # * # # • 0 » *
* *Y=1.45 m
« «# # * *
* * * # *
* #Y=0.96 m
• • # # « #
• • • • • •
# * #• •
Y=0.42 m
Figure 6.29: Average mass fraction o f SO2 along slices with nine baffles
77

Because the decomposition percentage o f SO3 is more in the heat exchanger with nine
baffles, it can be observed from Figures 6.28 and 6.29 that the average mass fraction o f
SO 2 in the tubes is more in the heat exchanger with nine baffles compared to the heat
exchanger with five baffles.
78
CHAPTER 7
RESULTS AND DISCUSSIONS
7.1. Results and discussions for two and three-dimensional models
Fluid flow, heat transfer and chemical reaction calculations were done for the tube
model as well as for the two-dimensional shell and tube configuration using porous
media approach, with counter and parallel flow arrangements. The pressure drop for the
counter flow arrangement is found to be 546 Pa and the temperature difference for the hot
fluid is 314.5 K and that o f the cold fluid is 235 K. Due to the transfer o f heat form
helium in the shell to acid vapor mixture in the tube, we can find an increase in
temperature along the tube. The percentage decomposition o f sulfur trioxide is found to
be 93% for counter flow arrangement. The pressure drop for this type o f arrangement is
found to be 568 Pa which is less compared to the counter flow arrangement and the
temperature difference for the hot fluid is observed as 220 K and that o f the cold fluid is
27.5 K. Since much o f the heat is utilized in the decomposer region; we can find a
decrease in temperature along the tube. The decomposition percentage o f sulfur trioxide
is found to be 92% for parallel flow arrangement. The decomposition percentage o f sulfur
trioxide was very high (95 %) in the tube model and shell and tube model as well. The
reason is that in a single fluid two-dimensional model the thermal energy required for
79

sulfur trioxide décomposition reaction is supplied by the constant wall surface
temperature boundary condition which provides an unlimited heat source at the
desiredtemperature. Various factors affected the decomposition percentage o f sulfur
trioxide in the tube. The percentage decomposition o f SO3 decreases with increasing the
Reynold number due to increase in the velocity and decrease in the residence time o f the
fluid. A high surface to volume area ratio enhances the rate o f chemical reaction by
increasing the area o f collisions o f molecules in the catalytic bed region. The diameter o f
the tube also affected the decomposition percentage. Because more area is available for
the reaction to take place, the decomposition percentage increased with an increase in the
diameter o f the tube. In addition to this, when the diameter is increased the velocity
decreases, which increases the residence time. Increasing the residence time allows the
reaction to happen for longer time thereby enhancing the decomposition percentage. A
preliminary parametric study o f the shell and tube configuration is conducted to explore
effects o f varying parameters on the decomposition o f sulfur trioxide. The obtained
results can be used for the optimization o f the shell and tube high temperature heat
exchanger and decomposer design and operating conditions to increase the
decomposition performance and minimize pressure drops.
. Uniformity o f the flow distribution in the heat exchanger is very critical because the
flow maldistribution among the tube or shell sides can result in decreasing o f chemical
decomposition and increasing o f pumping power. Crudely designed heat exchangers
often have lower performance and higher operating costs than more accurate designs.
One o f the most important factors influence on the performance is uniformity o f the flow
rate distribution inside the heat exchanger. The uniformity o f flow distribution depends
80
on inlet manifold geometry, internal channels configuration and flow regimes. . In the
current study the flow rate uniformity in the heat exchanger tubes has been investigated.
Simulations o f the straight tube configuration, tube configuration with baffle plate
arrangement and with pebble bed region inside the tubes were performed to examine flow
distribution on the tube side. The preliminary analysis o f the baseline design showed that
the flow distribution in the tubes is very non uniform. The difference in the velocities in
the tubes closer to the center is more than twice than the velocities in the tubes at
periphery. Due to the obtained flow maldistribution, the improvement o f the selected tube
configuration has become more exigent. Since the fluid velocities near the axial line are
high, while they are low far away from the center, a simple improvement in the
configuration is investigated to homogenize the flow distribution. A baffle plate is
designed and installed. Although a reverse flow occurs at the inlet section there is a
considerable improvement in the flow distribution. The difference in the velocities in the
tubes closer to the center and that at the periphery is very small compared to the case 1 .
The improved header installed with baffle can effectively enhance the flow uniformity. It
is noticeable that the baffle configuration has the relationship with header configuration
and fluid flow condition, which must be in consideration in the optimization o f baffle
configuration. It can be foreseen that fluid flow can be distributed uniformly when the
baffle is suitable in dimensions, the holes punched on it are distributed in in-line
arrangement and the punched ratio increases gradually from the axial line to the
boundary. For a high temperature shell and tube heat exchanger, if the catalyst is placed
on the shell side, this arrangement helps to reduce the flow maldistribution. In the third
case the problem o f flow maldistribution has been solved with a noticeable uniformity in
81
the flow distribution. The difference in the velocities in the tubes closer to the center and
in the tubes at the periphery is negligible. The pebble bed zone offers a very high
resistance to the inlet flow, due to which the flow has been re-distributed in the header
section resulting in a uniform flow in the tubes.
A counter flow type heat exchanger with hot fluid flowing through the shell and cold
fluid flowing through the tubes is simulated numerically to observe the variation in the
decomposition percentage. For the base case the decomposition percentage o f sulfur
trioxide is 17 %. The pressure drop in the tube side o f the heat exchanger was 0.30 Mpa.
The reason for a decrease in the decomposition percentage is because the heat energy
required for sulfur trioxide decomposition is supplied by the hot helium flowing through
the decomposer. The thermal energy supplied by the helium is limited when compared
with the constant temperature boundary condition. So the percentage decomposition
values are less than the constant wall surface temperature as in two-dimensional case. Fro
the performed parametric study it was found that as the mass flow rate o f helium was
increased, there was an increase in the decomposition percentage o f sulfur trioxide. This
is because as more amount o f helium enters the shell, more heat is getting transferred to
the tubes as a result o f which there is an increase in the decomposition percentage.
The heat required for decomposing sulfur trioxide can also be enhanced by
introducing baffles in to the heat exchanger. Numerical analysis performed on the h e a t,
exchanger with baffles show that there is a slight increase in the decomposition
percentage o f SO3. The decomposition percentage o f sulfur trioxide in the tubes o f the
heat exchanger was found to be 20 % when five baffles were considered at 1.5 atm and
with the mass flow rate o f helium as 71 kg/hr and that o f the mixture as 158.66 kg/hr. The
8 2
pressure drop on the tube side is found to be 0.33 Mpa. No signifieant inerease in the
deeomposition pereentage was observed in the heat exehanger beeause, the heat from
helium was not effeetively used in deeomposing sulfur trioxide. The reason for this is
that, there are few tubes in the periphery o f the tube eonfiguration where the temperature
was very less through out the length o f the tubes whieh redueed the rate o f ehemieal
reaetion. The effeetiveness o f the heat exehanger was 0.70 and the throughput o f sulfur
dioxide was 0.007 kg/s. Deeomposition pereentage o f sulfur trioxide in the tubes o f the
heat exehanger was found to be 26 % when nine baffles were eonsidered at 1.5 atm with
helium mass flow rate o f 71 kg/hr and that o f the mixture o f 158.66 kg/hr. The pressure
drop o the tube side is found to be 0.37 Mpa. Heat exehanger effeetiveness was increased
to 0.78 compared to the heat exehanger with five baffles whieh was 0.70. As the number
o f baffles is inereased, the reaetion proceeds for a longer time as a result o f whieh an
inerease in the decomposition percentage is observed. The throughput o f SO2 was also
increased to 0.0075 kg/s
83
CHAPTER 8
CONCLUSIONS AND FUTURE WORK RECOMMENDATIONS
8.1 Conclusions based on two-dimensional results
High temperature shell and tube heat exehanger with catalytic bed inside the tube has
been used in the deeomposition o f sulfur trioxide as a part o f hydrogen production
process. Numerical methods predicted the deeomposition pereentage o f sulfur trioxide for
different operating conditions and for different designs o f the heat exehanger. Some o f
the conclusions on both two-dimensional and three-dimensional investigations are
summarized below.
8.1.1. Conclusions based on two-dimensional results
• The Reynolds number played a signifieant role in affecting the sulfur trioxide
deeomposition. The pereentage deeomposition o f SO 3 decreases with increasing
the Reynolds number due to inerease in the velocity and decrease in the residence
time o f the fluid.
• The surface to volume area ratio was also one o f the important param eter whieh
influenced the deeomposition pereentage. A high surface to volume area ratio
enhances the rate o f ehemieal reaetion by increasing the area o f collisions o f
molecules in the catalytic bed region.
84

• The length o f the pebble bed region also played an important role in increasing
the decomposition percentage. The length o f the pebble bed region provides more
surface area which helps in achieving higher decompositions.
• The decomposition percentage o f sulfur trioxide is more for a counter flow
arrangement due to more temperature difference compared to parallel flow, when
the mass flow rate o f helium and the diameter o f the shell are increased.
• From the parametric studies for different activation energies that have been
completed in the research, it is observed that, the sulfuric trioxide decomposition
percentage increases with the decrease o f the activation energy for the both
parallel and counter flow arrangements. The important consideration over here is
to find a high efficient and low cost catalyst.
8.1.2. Conclusions based on three-dimensional results
The flow rate uniformity in the heat exchanger tubes has been investigated.
Simulations o f the straight tube configuration, tube configuration with baffle plate
arrangement and with pebble bed region inside the tubes were performed to examine flow
distribution on the tube side. The conclusions made are summarized below:
• The flow maldistribution in the tubes along the tube direction is very serious. The
velocities o f central passages straightly facing the inlet tube are higher becoming
more and decreases along the y-direction. To avoid flow maldistribution, this
improved inlet manifold configuration with baffle plate is best suited for the cases
where the catalyst is placed on the shell side in the decomposition o f sulfur
trioxide o f the high temperature shell and tube heat exchanger. The pressure drop
85
in the Case 2 (Design with baffle plate) is lower than the simple base line case
(Simple tube configuration). So, it can be inferred that the baffle plate serves
better in reducing the pressure drop along with improving the flow distribution.
Although a reverse flow occurs at the inlet section, there is a considerable
improvement in the flow distribution when baffle plate is eonsidered.
• In the Case 3 type o f arrangement, the problem o f flow maldistribution has been
solved with a noticeable uniformity in the flow distribution.
• From the performed numerical analysis on the three-dimensional shell and tube
heat exehanger, it was observed that the pereentage deeomposition o f sulfur
trioxide in the presence o f catalytic bed is 17 %. SO3 deeomposition can be
inereased by increasing the heat energy supplied to the mixture. Temperature o f
the helium coming from the intermediate heat exehanger (IHX) connected to
nuclear reactor power plant is constant at 1143 K, which may not be increased
due to the nuclear reactor safety and material issues. There are two different ways
to inerease the heat energy supplied to the mixture without varying the helium
temperature. One way is by increasing the mass flow rate o f helium side and other
way is to inerease the inlet temperature o f the reacting mixture. The m ass flow
rate o f the helium can be increased either by increasing the velocity o f helium or
by increasing the diameter o f the tubes on the helium side keeping the diameter o f
the tubes on the mixture side constant. Also increasing the inlet temperature o f the
reacting mixture side results in higher pereentage deeomposition o f SO 3 .
• The heat required for decomposing sulfur trioxide can also be enhanced by
introducing baffles in to the heat exehanger. Numerical analysis performed on the
86
heat exchanger with baffles show that there is a slight increase in the
decomposition percentage o f SO3 .
8.2. Future work recommendations
Numerical modeling o f the shell and tube heat exchanger with pebble bed region
inside the tubes was modeled in both 2D and 3D. These models can further improve the
decomposer performance. However there are some modifications in the numerical
models which would help in predicting the SO 3 decomposition with better accuracy.
Some o f them are discussed below
• Sulfur trioxide decomposition reaction is modeled assuming that the mixture o f
sulfur trioxide and water vapor enters the decomposer tubes but in reality there is
a possibility that some undecomposed sulfuric acid (H 2 SO4 ) may enter the
decomposer. So the sulfuric acid decomposition reaction that results in sulfur
trioxide and water vapor should also be included in the model along with the SO 3
decomposition reaction.
• Effects o f different parameters on the decomposition o f sulfur trioxide such as
Reynolds number, diameter o f the tube, length o f the pebble bed zone, surface to
volume ratio were investigated using two-dimensional model. Operating pressure
and inlet temperature o f the reacting mixture are two more parameters the have
considerable effect on the decomposition o f sulfur dioxide. So using the same
two-dimensional models, investigation is to be carried out on both the parameters
to find out how SO3 decomposition can be affected.
87
• From the three-dimensional numerical modeling it is clear that the percentage
decomposition o f sulfur trioxide is less because o f insufficient supply o f heat
energy to the reacting mixture. So analytical calculations need to be carried out to
find out exactly how much thermal energy is required to decompose at least 50%
o f the sulfur trioxide. M odifications either on the helium side or on the mixture
side are needed to the thermal energy requirements. The possible modifications
can be
1. Increasing the velocity on the helium side which allows higher mass flow
rates o f helium.
2. Increasing the diameter o f the tubes carrying the helium keeping the mass
flow rate constant.
3. Increasing the diameter o f the tubes carrying the reacting mixture keeping
the mass flow rate o f the mixture constant.
4. Increasing the inlet temperature o f the reacting mixture entering the
decomposer.
• The heat exchanger and decomposer was modeled with segmental baffles. Helical
baffles can be modeled fo enhance fhe heaf fransfer in fhe heaf exchanger to find
out how SO 3 decomposition can be affected.
• Different catalytic bed arrangements inside the tube can be modeled for finding
out the affects on sulfur trioxide decomposition.
• Different arrangement o f tubes inside the shell can be modeled. Inline
arrangement o f tubes was considered in this research. Staggered arrangement o f
tubes can be modeled to find out the variation in SO3 decomposition.
88
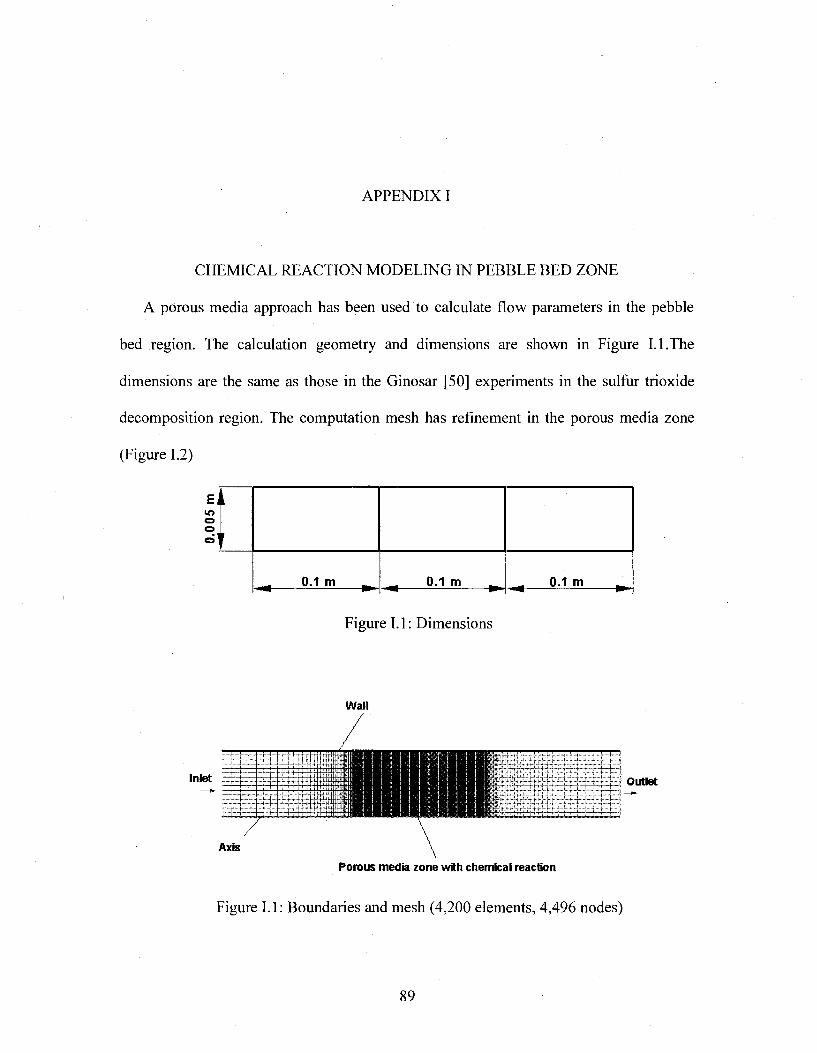
APPENDIX I
CHEMICAL REACTION MODELING IN PEBBLE BED ZONE
A porous media approach has been used to calculate flow parameters in the pebble
bed region. The calculation geometry and dimensions are shown in Figure I.l.T he
dimensions are the same as those in the Ginosar [50] experiments in the sulfur trioxide
decomposition region. The computation mesh has refinement in the porous media zone
(Figure 1.2)
LOoo
h
^ 0.1 m ^ ^ 0.1 m ^ ^ 0.1 m ^
Figure I .l: Dimensions
W all
Inlet O utlet
Axis
P o ro u s m ed ia z o n e w ith ch em ica i reac tio n
Figure I .l: Boundaries and mesh (4,200 elements, 4,496 nodes)
89
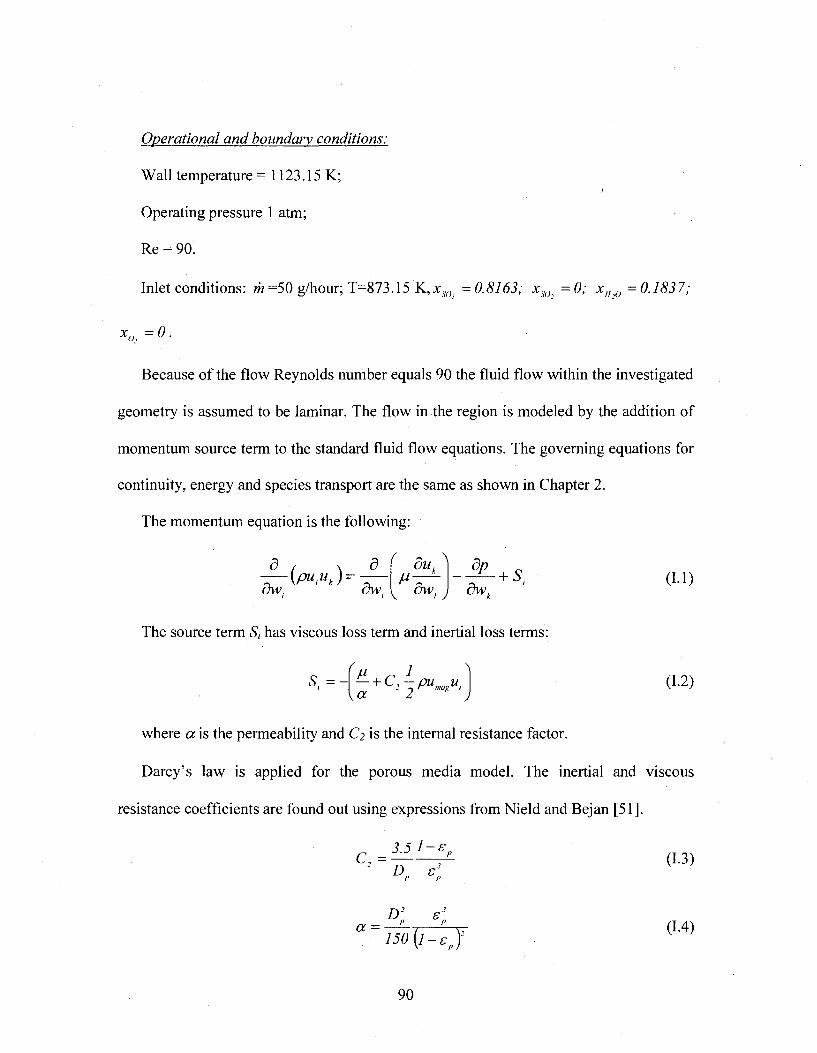
Operational and boundary conditions:
Wall temperature = 1123.15 K;
Operating pressure 1 atm;
Re = 90.
Inlet conditions: m =50 g/hour; T=873.15 =0.8163; =0; =0.1837;
= 0-
Because o f the flow Reynolds number equals 90 the fluid flow within the investigated
geometry is assumed to be laminar. The flow in the region is modeled by the addition o f
momentum source term to the standard fluid flow equations. The governing equations for
continuity, energy and species transport are the same as shown in Chapter 2.
The momentum equation is the following:
ÔW dw
du,.
i V dwI 7
Æ .dw,.
+ S. (I.l)
The source term S, has viscous loss term and inertial loss terms:
S; = ■a
(1.2)
where a is the permeability and C2 is the internal resistance factor.
Darcy’s law is applied for the porous media model. The inertial and viscous
resistance coefficients are found out using expressions from Nield and Bejan [51].
(13)
a = (1.4)
90
Considering the assumption o f the pellets uniform packing, the porosity o f the
chemical reaction region, Ep, is obtained equal 0.476.
According to the equations:
C . = 3401 m ''.
Viscous resistance = l/a= 1.5x10^ m'^.
The surface area is 0.03 m^.
The surface-to-volume ratio o f the porous zone is 4000 m ''.
The surface-to-volume ratio is applied to the porous zone region where the chemical
reaction (S0 3 -> S 0 2 + 0 .5 0 2 ) is tacking place.
91

APPENDIX II
EFFECTIVENESS CAECUEATION
One way o f measuring a heat exchanger's performance is to calculate its
effectiveness. The heat exchanger effectiveness is defined as the ratio o f the actual heat
transfer to the heat transfer attainable in an infinitely long counter flow exchanger.
In the parallel flow case shown in Figure 11.1, the two fluids enter the exchanger with
(typically knowri) inlet temperatures, Thw and Tcw and in the ideal case leave the
exchanger at the same (unknown) temperature Tm - which is somewhere in between Tnm
and Tcin-
co -cu rren t
TN OUTFigure 11.1 : Temperature distributions in a parallel flow heat exchanger.
92

An alternative is to operate the exchanger in counter flow. In this case, again, we will
assume that we know the inlet temperatures, Tnm and 7 c ,A ls o , there will eventually be
no driving force (in an infinitely long exchanger). There are two ways in which this can
happen: the hot stream can leave at the same temperature as the cold stream inlet, or the
cold stream can leave at the same temperature as the hot stream inlet.
Inside the heat exchanger the hot and cold fluid temperature distributions would have the
form sketched in Figure. II.2.
I
AT,
d ll
AT
dT,
Figure.II.2: Temperature distributions in a counter flow heat exchanger.
The effectiveness can be calculated as:
_________________________
93
Where, Ce is the heat capacity o f the cold fluid
C h is the heat capacity o f the hot fluid
Cmin is the lower o f two fluids heat capacities
II. I . Effectiveness and throughput calculations for the shell and tube heat exchanger
The inlet temperature o f the hot fluid: 1223 K
The average outlet temperature o f the hot fluid: 1054.7 K
Inlet temperature o f the cold fluid: 973 K
Average outlet temperature o f cold fluid: 1169.19 K
Substituting the values we get:
Thi = 1223 K, T|,2 = 1054.7 K, T c = 973 K, Tc2 = 1169.19 K,
Calculated e = 0.67
Throughput o f SO? calculations:
Throughput is calculated as:
Mass flow rate o f the reacting mixture • average mass fraction o f SO2 at the tube outlet
Calculated value= 0.0032 kg/s.
II.2. Effectiveness and throughput calculations for the shell and tube heat exchanger with
five baffles
The inlet temperature o f the hot fluid: 1223 K
The average outlet temperature o f the hot fluid: 1035.6 K
Inlet temperature o f the cold fluid: 973 K
94
Average outlet temperature o f cold fluid: 1153.5 K
Substituting the values we get:
Thi - 1223 K, Th2= 1036.6 K, Te, = 973 K, Tc2 - 1 1 5 3 .5 K,
Calculated s = 0.70
Throughput o f SO? calculations:
Throughput is calculated as:
Mass flow rate o f the reacting mixture • average mass fraction o f SO2 at the tube outlet
Calculated value= 0.0070 kg/s.
II.3. Effectiveness calculation for the shell and tube heat exchanger with nine baffles
The inlet temperature o f the hot fluid: 1223 K
The average outlet temperature o f the hot fluid: 1033 K
Inlet temperature o f the cold fluid: 973 K
Average outlet temperature o f cold fluid: 1145 K
Substituting the values we get:
Thi - 1223 K, Th2 = 1033 K, Td = 973 K, T ^ = 1145 K,
Calculated s = 0.78
Throughput o f SO? calculations:
Throughput is calculated as:
Mass flow rate o f the reacting mixture • average mass fraction o f SO2 at the tube outlet
Calculated value= 0.0075 kg/s.
95
REFERENCES
[1] Brown L.C., Bensenbruch G.E., Funk J.E., Marshall, Pickard A C., Schowalter P
S., Ehgh Efficiency Generation o f Hydrogen Fuels Using Nuclear Power, DE-
FG03-99-SF21888. Final technical report o f the period August 1 1999 through
September 30, 2002, GA-A24285, Rev. 1, General Atomics, 2003.
[2] DOE Office o f Nuclear Energy, Nuclear Hydrogen Initiative. Ten Year Program
Plan, Office o f Advanced Nuclear Research, Science and Technology, DOE, USA,
2005.
[3] General Atomics, Decomposition o f sulfuric acid using solar thermal energy.
General Atomics Report by Project Staff. General Atomics, USA, 1985.
[4] Huang C., Raissi T, A, Analysis o f Sulfur-Iodine Thermochemical Cycle for Solar
Hydrogen Production. Part I: Decomposition o f Sulfuric Acid, Solar Energy, vol.
78(5), pp. 632-646, 2005.
[5] Bengt., Shah R.K., Ishizuka M., Rudyand T.M., Wadekar V V High Temperature
Heat Exchangers. In: Proceedings o f Fifth International Conference on Enhanced,
Compact and Ultra-Compact Heat Exchangers, NJ, USA, September 2005.
[6 ] Ponyavin V., Chen Y., Trabia M.B, Wilson M., Hechanova A.E. Modeling and
Parametric Study o f a Ceramic High Temperature Heat Exchanger and Chemical
Decomposer, Proceedings o f IMECE 2006 ASM E International
96
Mechanical Engineering Congress and Exposition. Chicago, Illinois, USA.
November 5-10.
[7] M uramalla K., Chen Y., Hechanova A.E. Simulation and Optimization o f
Homogeneous Decomposition o f Sulfur Trioxide Gas on a Catalytic Surface,
Proceedings o f IMECE 2005 ASME International Mechanical Engineering
Congress and Exposition, Heat Transfer Division. HTD. (376), pp. 201-207.
[8 ] Ishikawa H., Ishii E., Uehara I., Nakane M., Catalyzad Thermal Decomposition o f
H2SO4 and Production o f HBr by the Reaction o f SO2 with Br2 and H2O,
Int.J.Hydrogen Energy, vol. 7(3), pp.237-246, 1982.
[9] Ozturk I.T., Hammache A., Bilgen E., Improved Process for H2 SO4 Decomposition
Step o f the Sulfur-Iodine Cycle, Energy Conversion and Management, vol. 36(1),
pp .II-21 , 1995.
[10] General Atomics Report by Project Staff, High Pressure Catalytic Metal Reactor in
a Simulated Solar Central Receiver, February, 1986.
[11] Tagawa H., and Endo T., Catalytic Decomposition o f Sulfuric Acid Using Metal
Oxides as the Oxygen Generating Reaction in Thermochemical Water Splitting
Process, Int. J. Hydrogen Energy, vol. 14, p p .11-17, 1989.
[12] Barbarossa, V, Brutti, S, Diamanti, M, Sau, S, and De Maria, G , Catalytic Thermal
Decomposition o f Sulphuric Acid in Sulphur-Iodine Cycle for Hydrogen
Production, Int. J. Hydrogen Energy, vol. 31, pp. 883-890, 2006.
[13] Seo Y S., Jeong N J., Kwang S S, Characteristics o f Surface Reaction and Heat
Transfer in a Catalytic Heat Exchanger, Journal o f Chemical Engineering. (95),
p p .I0 I - I lI ,2 0 0 3 .
97
[14] Lin S.S and Flaherty R., Design Studies o f Sulfur Trioxide Decomposition Reactor
for the Sulfur Cycle Flydrogen Production Process, Int. J. Hydrogen Energy, vol.
8 (8 ), pp.589-596, 1983.
[15] Evans R.B, Watson, G.M., Mason E.A, Gaseous Diffusion in Porous Media. II.
Effects o f Pressure Gradients Journal o f Chemical Physics, vol. 36(7), pp. 1894-
1902.
[ 16] Teruel F.E and Rizwan-uddin, Alternative Modeling for Turbulent Flow in Porous
Media, Proceedings o f ASME 2006 Joint U.S.-European Fluids Engineering
Summer Meeting July 17-20, Miami, U.S.A.
[17] Kuwahara F., KameyamaY, Yamashita S., Nakayama. A, Numerical Modeling o f
Turbulent Flow in Porous Media Using a Spatially Periodic Array Journal o f
Porous Media, vol. 1(1), pp. 47-55, 1988.
[18] Clayton D.G, New Concepts for Heat Exchangers Performance, Warme and
Stoffubertragung, vol.7, pp. 102-112, 1974.
[19] Stehlik P and Wadekar V., Different Strategies to Improve Industrial Heat
Exchange, Heat transfer Engineering vol.23 (6 ), pp 36-48, 2002.
[20] Kim and Thomas, Experimental Investigation o f Heat Transfer in Shell and Tube
Heat Exchanger without Baffles, Korean Journal o f Chemical Engineering, vol. 14
(2),pp.93-100, 1997.
[21] Donohue D A., Heat Tansfer and Pressure Drop in Heat Exchangers, Industrial and
Engineering Chemistry, vol 41, pp. 2499-2511, 1949.
98
[22] Tinker T., Shell Side Characteristics o f Shell and Tube Heat Exchanger, Parts I, II
and III, General Discussion on Heat Transfer, The Institution o f Mechanical
Engineers, London, pp. 89-116, 1951.
[23] Bell K J., Final Report o f the Cooperative Research Program on Shell and Tube
Heat Exchangers, University o f Delaware Engineering Experimental Station,
Bulletin No. 5, 1963.
[24] Gay B and Williams T A., Heat transfer on the Shell-Side o f a Cylindrical Shell-
and-Tube Heat Exchanger Fitted with Segmental Baffles I. Bundle and Zonal
Average Heat Transfer Coefficients, Transactions o f Institute o f Chem. Engrs. 46
T95-TI00, 1968.
[25] Palen J W and Taborek J., Solution o f shell side flow pressure drop and heat
transfer by stream analysis method, Chem. Eng. Progr. Symp. Ser. 92, 53-63,
1969.
[26] Gay B., M ackley N V., Jenkins J D, Shell-side heat transfer in baffled cylindrical
shell-and-tube exchangers, an electrochemical mass transfer modeling tech-nique.
Int. J. Heat Mass Transfer 19, pp 995-1002,1969.
[27] Sparrow E M and Perez J A., Internal Shell-Side Heat Transfer and Pressure Drop
Characteristics for a Shell-and-Tube Heat Exchanger, Int. J. Heat Transfer 107, pp
345-353 ,1985 .
[28] Roetzel W and Xuan Y, Dispersion Model for Divided Flow Heat Exchanger, in:
Proceedings o f the EUROTHERM Seminar No. 18, Hamburg, pp. 98-110, 1991.
99

[29] Kukral R and Stephan K, The effect o f internal leakage on steady-state and
transient behavior o f shell-and-tube heat exchangers, in: Proceedings o f the lO"
International Heat Transfer Conference, Brighton, UK, pp. 393-398,1994.
[30] Li H D and Kottke V, The effect o f baffle tube leakage on the local mass and heat
transfer in the shell-side o f shell-and-tube heat exchangers, J. Flow Visualization
and Image Processing 4, pp 129-139,1997.
[31] Li H D and Kottke V, Effect o f the leakage on pressure drop and local heat transfer
in shell-and-tube heat exchangers for staggered tube arrangement. Int. J. Heat
Mass Transfer 41 (2), pp 425-433, 1998.
[32] Li H D and Kottke V, Effect o f baffle spacing on pressure drop and local heat
transfer in shell-and-tube heat exchangers for staggered tube arrangement. Int. J.
Heat Mass Transfer 41 (1 0 ), pp 1303-1311, 1998.
[33] Taborek J, Selected problems in heat exchanger design, in: Proceedings o f the
EUROTHERM Seminar No. 18, Hamburg, pp. 3-18, 1991.
[34] Ratnasamy F, Exchanger design using disc-and-dough-nut baffles. Hydrocarbon
Processing 6 6 (4), pp 63-65, 1987.
[35] Sharif A, Klein D, Howell J R, Effectiveness o f pressure drop to heat transfer
conversion for various shell-side flow configurations, ASM E/JSM E Thermal
Engineering Proceedings 4, pp 439-448, 1991.
[36] Li.H and Kottke.V, Effect o f baffle spacing on pressure drop and local heat transfer
in shell and tube heat exchangers for staggered tube arrangement. Int. J. o f Heat
Mass Transfer, 41 (10), pp 1303-1311, 1998.
100

[37] Wen J., Li, Y., Zhou, A., Zhang K., Wang J., PIV experimental investigation o f
entrance configuration on flow maldistribution in plate-fm heat exchanger,
Cryogenics 46 (1), pp.37-48, 2006.
[38] Faure T.M., Lusseyran F., Gougat P., Launay, F., Experimental investigation o f the
flow distribution inside a tubular heat exchanger, Journal o f Fluids Engineering,
Transaction o f the ASME 128 (6), pp. 1218-1227, 2006.
[39] Pekdemir T., Davies T.W., Haseler L.E., Diaper A.D., Flow distribution on the
shell o f a cylindrical shell and tube heat exchanger. Int. J. o f Heat and Fluid Flow
14(1), pp. 76-85, 1993.
[40] Jiao A and Baek S., Effects o f distributor configuration on flow maldistribution in
plate-fm heat exchangers. Heat Transfer Engineering 26 (4), pp. 19-25, 2005.
[41] Rao B.P., Sunden B., Das S.K., An experimental and theoretical investigation o f
the effect o f flow maldistribution on the thermal performance o f plate heat
exchangers, Int.J. o f Heat Transfer 127 (3), pp. 332-343, 2005.
[42] Zhang Z and Li Y , CED simulation on inlet configuration o f plate-fm heat
exchangers, Cyrogenics 43 (12), pp.673-678, 2003.
[43] Srihari N., Rao P B., Sunden B., Das S.K., Transient response o f plate heat
exchangers considering effect o f flow maldiatribution. Int. J. o f Heat Mass
Transfer 48 (15), pp. 3231-3243, 2005.
[44] Lalot S., Florent P., Lang S.K., Bergles A.E., Flow maldistribution in heat
exchangers. Applied Thermal Engineering 19 (8), pp.847-863, 1999.
[45] Wen J and Li Y , Study o f flow distribution and its improvement on the header o f
plate-fm heat exchanger. Cryogenics 44 (II) , pp. 823-831, 2004.
lOI

[46] Kuchi G , Ponyavin V., Chen Y , M odeling o f High Temperature Shell and Tube
Heat Exchanger and Decomposer for Hydrogen Production, American Institute o f
Chemical Engineers, Annual Meeting, Nov 4-9, Salt Lake City, 2007.
[47] Menter, F.R. Kuntz, M., and Langtry, R., Ten Years o f Experience with the SST
Turbulence Model. In Hanjalic, K., Nagano, Y , and Tummers, M. editors.
Turbulence, Heat and Mass Transfer 4, pp. 625-632, Begell House Inc., 2003
[48] Spewock S., Brecher L.E., Talko F., The Thermal Catalytic Decomposition o f
Sulfur Trioxide to Sulfur Dioxide and Oxygen, Proceedings o f 1st World
Hydrogen Energy Conference, vol. 1(1), 9A-53, 1976.
[49] Scott, F.H., Elements o f Chemical Reaction Engineering, Prentice Hall, Inc., New
Jersey, 1999.
[50] Ginosar D.M., Activity and Stability o f Catalysts for the High Temperature
Decomposition o f Sulfuric Acid, Report, Idaho National Laboratory, USA, 2005
[51] Nield, D.A., and Bejan, A, Convection in Porous Media, 1st. Springer-Verlag, New
York, NY, 1992
[52] FLUENT, Inc., GAMBIT 2.2, U ser’s Guide, Lebanon, NH, USA, 2004.
102

VITA
Graduate College University o f Nevada Las Vegas
Gayatri Kuchi
Address;4247 Grove Circle, Apt # 2 Las Vegas, NV 89119
Degree;• Bachelor o f Technology, M echanical Engineering, 2003
Jawaharlal Nehru Technological University, India
Professional Experience:• W orked as Design Engineer at Concept Shapers and Hydraulics Pvt. Ltd.,
Hyderabad, India, May ’03-Nov ’04• Manufacturing cum design Engineer at Hindustan Aeronautics Limited.,
Hyderabad, India, Nov ’04-A ug’06• Research Assistant, University o f Nevada Las Vegas, Aug ’06-Present
Special Honors and Awards:• Cultural secretary, Indian Student Association (ISA), UNLV, Jan ’07-Jan ’08
Selected Publications:■ Kuchi.G, Ponyavin.V, Chen.Y, 2007, “Flow Distribution on the Tube Side o f a High
Temperature Shell and Tube H eat Exchanger and Chemical Decomposer for Hydrogen Production, ’’ Proceedings o f IMECE 2007, ASM E 2007 International Mechanical Engineering Congress and Exposition, N ovem ber 10-16, 2007, Seattle, USA
■ Kuchi.G , Ponyavin.V, Chen.Y, 2007, “M odeling o f High Temperature Shell and Tube Heat Exchanger and Decomposer fo r Hydrogen Production, ’’ American Institute o f Chemical Engineers (, Annual Meeting, Nov 4-9, Salt Lake City, Utah, USA• Kuchi. G, Ponyavin.V, Chen.Y. 2007, “Numerical M odeling o f High Temperature Shell and Tube Heat Exchanger and Decomposer fo r Hydrogen Production, ” International Journal o f Hydrogen Energy
103
Thesis Title; Numerical Modeling o f High Temperature Shell and Tube Heat Exchanger and Chemical Decomposer
Thesis Examination Committee:Chairperson, Dr. Yitung Chen, Ph.D.Committee Member, Dr. Robert F .Boehm, Ph.D.Committee Member, Dr. Antony E. Hechanova, Ph.D.Graduate College Representative, Dr. Rama Venkat Ph.D.
104