Numerical Investigation of the Response of Widened Pavement Systemdocs.trb.org/prp/11-0279.pdf ·...
16
Numerical Investigation of the Response of Widened Pavement System X. Liu (corresponding author) [email protected] Section of Structural Mechanics Faculty of Civil Engineering and Geosciences Delft University of Technology Stevinweg 1, 2628 CN Delft, The Netherlands Tel. +31 15 2787918 Fax. +31 15 2785767 A. Scarpas [email protected] Section of Structural Mechanics Faculty of Civil Engineering and Geosciences Delft University of Technology Stevinweg 1, 2628 CN Delft, The Netherlands Tel. +31 15 2784017 Fax. +31 15 2785767 C.A.P.M. (Christ) van Gurp [email protected] KOAC-NPC Schumanpark 43 7336 AS Apeldoorn Netherlands Tel. +31 (88) 5622505 Fax. +31 (88) 5622511 Arjan A. M. Venmans [email protected] Deltares Stieltjesweg 2 2628CK Delft The Netherlands Tel: +31(15)2693563 Fax: +31(15)2610821 Word Count No. of words: 3871 No. of tables: 1*250=250 No. of figures: 13*250=3250 Total: 7371 Paper number: #11-0279 Submitted for publication and presentation for the 90 th meeting of the Transportation Research Board, 23-27 January 2011 TRB 2011 Annual Meeting Paper revised from original submittal.
Transcript of Numerical Investigation of the Response of Widened Pavement Systemdocs.trb.org/prp/11-0279.pdf ·...
Numerical Investigation of the Response of Widened Pavement System X. Liu (corresponding author) [email protected] Section of Structural Mechanics Faculty of Civil Engineering and Geosciences Delft University of Technology Stevinweg 1, 2628 CN Delft, The Netherlands Tel. +31 15 2787918 Fax. +31 15 2785767 A. Scarpas [email protected] Section of Structural Mechanics Faculty of Civil Engineering and Geosciences Delft University of Technology Stevinweg 1, 2628 CN Delft, The Netherlands Tel. +31 15 2784017 Fax. +31 15 2785767 C.A.P.M. (Christ) van Gurp [email protected] KOAC-NPC Schumanpark 43 7336 AS Apeldoorn Netherlands Tel. +31 (88) 5622505 Fax. +31 (88) 5622511 Arjan A. M. Venmans [email protected] Deltares Stieltjesweg 2 2628CK Delft The Netherlands Tel: +31(15)2693563 Fax: +31(15)2610821 Word Count No. of words: 3871 No. of tables: 1*250=250 No. of figures: 13*250=3250 Total: 7371 Paper number: #11-0279
Submitted for publication and presentation for the 90th meeting of the Transportation Research Board, 23-27 January 2011
TRB 2011 Annual Meeting Paper revised from original submittal.
Liu X., Scarpas A., van Gurp C.A.P.M. and Venmans Arjan A. M. 1
Abstract: Road widening might causes problems since the new shoulder will be much narrower than the existing one, and truck traffic will travel close to the slopes of the embankment. This can cause considerable deterioration in pavements consisting of granular base materials and thin asphalt surfacing. The result is often premature cracking and permanent deformation along the pavement edge. This paper presents the results of full 3D material and structural modeling and finite element analyses of road widening performed within the framework of the Delft Cluster program 'Predictable Subsoil for Infrastructure'. Much attention has been paid to realistic modeling of the material behavior and performance and the three-dimensional interaction between various components of the structure. The finite element simulations show the development of strains and stresses inside the body of the pavement. The importance of the damage distribution in the asphalt concrete and the road foundation materials is demonstrated. The results of the analyses indicate the main issues of old road widening on soft subgrades so as to avoid the development of longitudinal and/or transverse cracks during the service life of the pavement.
Keywords: finite element, constitutive model, plasticity, damage, road widening, embankment
TRB 2011 Annual Meeting Paper revised from original submittal.
Liu X., Scarpas A., van Gurp C.A.P.M. and Venmans Arjan A. M. 2
INTRODUCTION A decade ago, the arterial road network of the Netherlands reached a mature state of coverage of the country. Since that time, traffic intensities kept on growing and congestion reached an unacceptable number of delay hours each work day. The fastest and most affordable solution for this mobility and environmental problem is widening of the pavement on the existing embankments. On motorways with a wide central reserve, widening towards the centre line may be an option. However, due to lack of space, the majority of road widening is done by reshaping the shoulders into new truck traffic lanes. This type of widening might cause problems since the new shoulder will be much narrower than the existing one, and truck traffic will travel close to the slopes of the embankment. This can cause considerable deterioration in pavements consisting of granular base materials and thin asphalt surfacing. The result is often premature cracking and permanent deformation along the pavement edge. Despite the fact that pavement edge damages represent a great problem for the Dutch road network, little research has been performed on this topic.
For narrow in-service roads, widening can only be realized by widening the embankment. In the north and west of the Netherlands, where clay or peat forms the subsurface, road widening cannot be treated as a simple dumping of sand and covering it with a few centimeters of tarmac. Serious attention should be paid to the expected differences in settlement of the new and old embankment and the response of the overall pavement structure. The solution should be focused on an integral approach addressing both, the pavement and the geotechnical problems.
This paper presents the results of full 3D material and structural modeling and finite element analyses of road widening performed within the framework of the Delft Cluster program 'Predictable Subsoil for Infrastructure'. Much attention has been paid to realistic modeling of the material behavior and performance and the three-dimensional interaction between various components of the structure.
In the first part of this paper, the details of the porous media governing equations and material constitutive model are presented and their use for describing the nonlinear behaviour of both the asphalt concrete and the road base, subbase and subgrade materials.
In order to study the influence of the change of traffic load location on pavement widening response, in the last part of this paper, two cases of loading have been investigated. In the first case, the wheel load is applied directly on the top of the new widening asphalt concrete. In the second case, the wheel load is applied on the top of the old asphalt concrete layer.
The finite element system CAPA-3D (15) developed at the Section of Structural Mechanics of TU Delft has been utilized as the numerical platform for this study. The finite element simulations show the development of strains and stresses inside the body of the pavement. The importance of the damage distribution in the asphalt concrete and the road foundation materials are demonstrated. The results of the analyses indicate the main issues of old road widening on soft subgrades so as to avoid the development of longitudinal and/or transverse cracks during the service life of the pavement.
TRB 2011 Annual Meeting Paper revised from original submittal.
Liu X., Scarpas A., van Gurp C.A.P.M. and Venmans Arjan A. M. 3
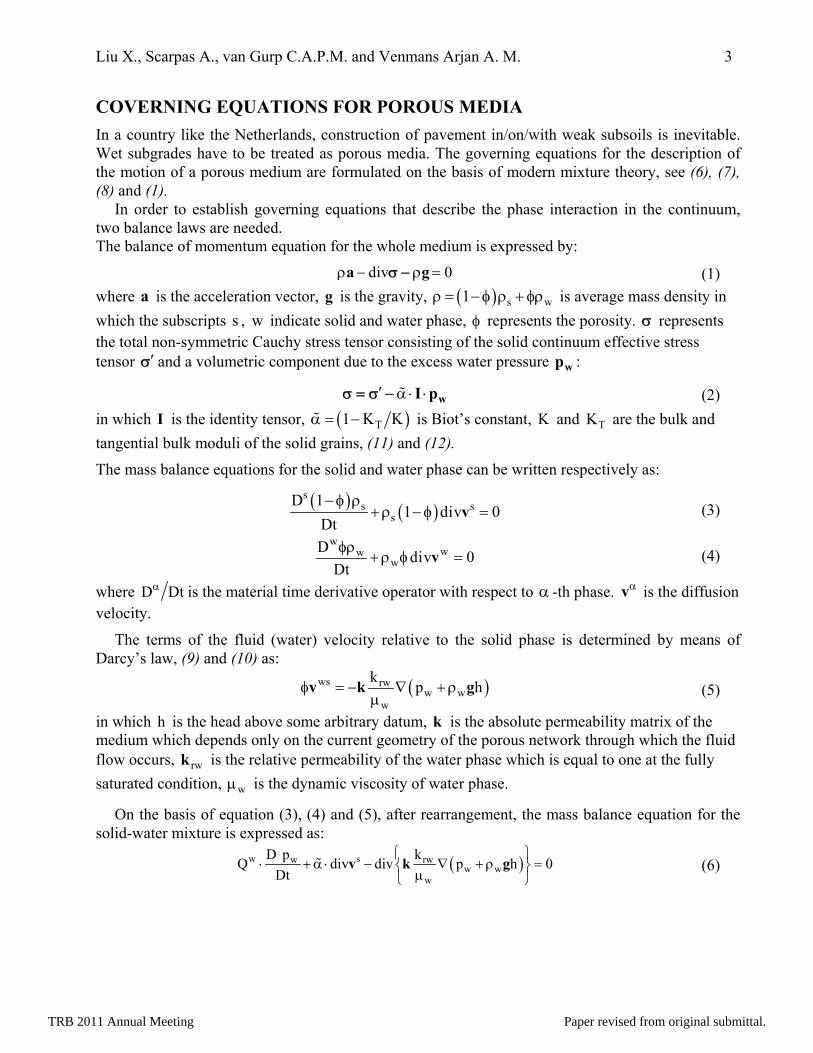
COVERNING EQUATIONS FOR POROUS MEDIA In a country like the Netherlands, construction of pavement in/on/with weak subsoils is inevitable. Wet subgrades have to be treated as porous media. The governing equations for the description of the motion of a porous medium are formulated on the basis of modern mixture theory, see (6), (7), (8) and (1).
In order to establish governing equations that describe the phase interaction in the continuum, two balance laws are needed. The balance of momentum equation for the whole medium is expressed by:
div 0ρ − ρa g =σ − (1)where a is the acceleration vector, is the gravity, g ( ) s1 wρ = −φ ρ + φρ is average mass density in which the subscripts s , indicate solid and water phase, w φ represents the porosity. σ represents the total non-symmetric Cauchy stress tensor consisting of the solid continuum effective stress tensor and a volumetric component due to the excess water pressure : ′σ wp
′ α ⋅ ⋅ wI pσ = σ − (2)in which is the identity tensor, I ( )T1 K Kα = − is Biot’s constant, and are the bulk and tangential bulk moduli of the solid grains, (11) and (12).
K TK
The mass balance equations for the solid and water phase can be written respectively as:
( ) ( )s
s ss
D 11 div
Dt−φ ρ
0+ρ −φ =v (3)
www
wD div 0
Dtφρ
+ρ φ =v (4)
where D Dtα is the material time derivative operator with respect to α -th phase. is the diffusion velocity.
αv
The terms of the fluid (water) velocity relative to the solid phase is determined by means of Darcy’s law, (9) and (10) as:
( )ws rww w
w
k p hφ = − ∇ +ρμ
v k g (5)
in which is the head above some arbitrary datum, k is the absolute permeability matrix of the medium which depends only on the current geometry of the porous network through which the fluid flow occurs, is the relative permeability of the water phase which is equal to one at the fully saturated condition, is the dynamic viscosity of water phase.
h
rwk
wμ
On the basis of equation (3), (4) and (5), after rearrangement, the mass balance equation for the solid-water mixture is expressed as:
( )w sw rww w
w
D p kQ div div p hDt
⎧ ⎫⋅ + α ⋅ − ∇ +ρ =⎨ ⎬μ⎩ ⎭
v k g 0 (6)
TRB 2011 Annual Meeting Paper revised from original submittal.
Liu X., Scarpas A., van Gurp C.A.P.M. and Venmans Arjan A. M. 4
in which ( )w
wQ
K Kα −φ φ
= + , is the bulk modulus of water, wK
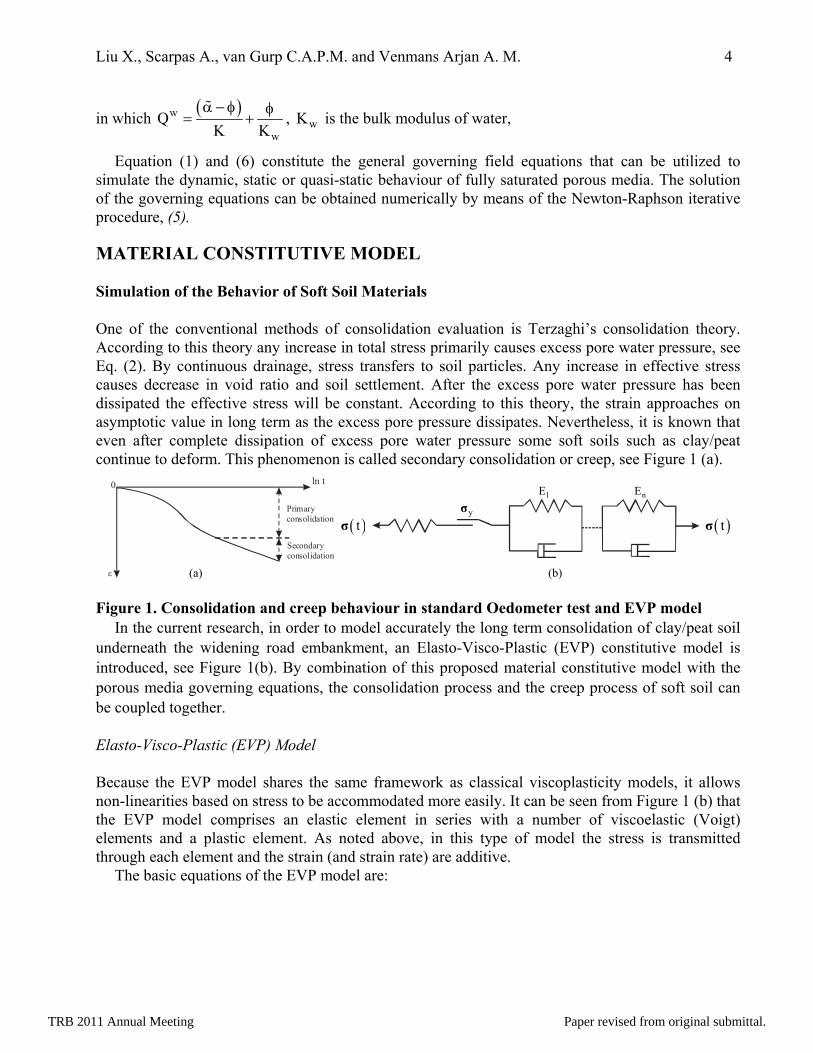
Equation (1) and (6) constitute the general governing field equations that can be utilized to simulate the dynamic, static or quasi-static behaviour of fully saturated porous media. The solution of the governing equations can be obtained numerically by means of the Newton-Raphson iterative procedure, (5). MATERIAL CONSTITUTIVE MODEL Simulation of the Behavior of Soft Soil Materials One of the conventional methods of consolidation evaluation is Terzaghi’s consolidation theory. According to this theory any increase in total stress primarily causes excess pore water pressure, see Eq. (2). By continuous drainage, stress transfers to soil particles. Any increase in effective stress causes decrease in void ratio and soil settlement. After the excess pore water pressure has been dissipated the effective stress will be constant. According to this theory, the strain approaches on asymptotic value in long term as the excess pore pressure dissipates. Nevertheless, it is known that even after complete dissipation of excess pore water pressure some soft soils such as clay/peat continue to deform. This phenomenon is called secondary consolidation or creep, see Figure 1 (a). ln t
Primary consolidation
Secondary consolidation
ε
0
( )tσ ( )tσyσ
1E nE (a) (b) Figure 1. Consolidation and creep behaviour in standard Oedometer test and EVP model
In the current research, in order to model accurately the long term consolidation of clay/peat soil underneath the widening road embankment, an Elasto-Visco-Plastic (EVP) constitutive model is introduced, see Figure 1(b). By combination of this proposed material constitutive model with the porous media governing equations, the consolidation process and the creep process of soft soil can be coupled together. Elasto-Visco-Plastic (EVP) Model Because the EVP model shares the same framework as classical viscoplasticity models, it allows non-linearities based on stress to be accommodated more easily. It can be seen from Figure 1 (b) that the EVP model comprises an elastic element in series with a number of viscoelastic (Voigt) elements and a plastic element. As noted above, in this type of model the stress is transmitted through each element and the strain (and strain rate) are additive.
The basic equations of the EVP model are:
TRB 2011 Annual Meeting Paper revised from original submittal.
Liu X., Scarpas A., van Gurp C.A.P.M. and Venmans Arjan A. M. 5
e p vt t t t t tt t+Δ +Δ +Δ+ΔΔ = Δ + Δ + Δε ε ε ε e
t
(7)e e
t t t:+Δ += Dσ ε Δ (8)
( )t t t tF ,+Δ +Δ 0α =σ (9)
( )pt t t tt t ,+Δ +Δ+ΔΔ = λ ⋅ αNε σ (10)
( )t t t tg ,+Δ +Δα = λ ⋅ ασ (11)Equation (9) is the yield function and equation (10) is the flow rule. Equation (11) finally
describes the evolution of the hardening/softening parameters. The chosen form of the yield function and model hardening/softening parameters will be presented in the next section.
eD in equation (8) is the elastic constitutive tensor, λ in equation (10) is the plastic multiplier, Q= ∂ ∂N σ is the direction of plastic flow and ( )g ,ασ is a function of the stress and
hardening/softening parameter itself. The total stress at time can be computed by: t +Δt
( )e e p vet t t tt t:+Δ +Δ+Δ= − Δε + ΔεDσ σ (12)
where e t e t e
t t: +Δ= + Δ = + ΔεDσ σ σ σ (13)is the “elastic predictor”.
The incremental viscoelastic strain in equation (7) and (12) can be expressed as:
( )i in
t t 2ve i ve i t t tt t t ve
i 1e 1 t e
2−Δ τ −Δ τ +Δ
+Δ=
⎡ σ⎛ ⎞Δ = − + Δ ⋅ ⎜ ⎟⎢ ⎥⎝ ⎠⎣ ⎦∑ε ε C +σ ⎤ (14)
with being the compliance matrix of the viscoelastic component. iveC
Substitution of equation (10) and (14) into (12), it results the total stress at : t t+Δ( )
( )i i
e et t t t t t
nt t 2e i ve i t t t
t vei 1
: ,
e 1 t e2
+Δ +Δ +Δ
−Δ τ −Δ τ +Δ
=
= − Δλ ⋅ α
⎧ ⎫⎡ σ⎛ ⎞− − + Δ ⋅⎨ ⎬⎜ ⎟⎢ ⎥⎝ ⎠⎣ ⎦⎩ ⎭∑
D N
D ε C
σ σ σ
+σ ⎤ (15)
Flow Surface Characteristics The flow surface which is used to describe the plastic response of the soil material is proposed originally by (2) and further developed by (1) and (4). The chosen form of the surface is given by:
n 22 1 12
a aa
J I R I RF 0p pp
⎡ ⎤⎛ ⎞ ⎛ ⎞+ +⎢ ⎥= − −α ⋅ + γ ⋅ =⎜ ⎟ ⎜ ⎟⎢ ⎥⎝ ⎠ ⎝ ⎠⎣ ⎦
(16)
where I1 is the first and J2 is the second stress invariants, pa is the atmospheric pressure with units of stress, R represents the triaxial strength in tension. In 3D space, equation (16) represents a closed surface. The value of the yield function F determines the response of the material to a state of stress.
TRB 2011 Annual Meeting Paper revised from original submittal.
Liu X., Scarpas A., van Gurp C.A.P.M. and Venmans Arjan A. M. 6
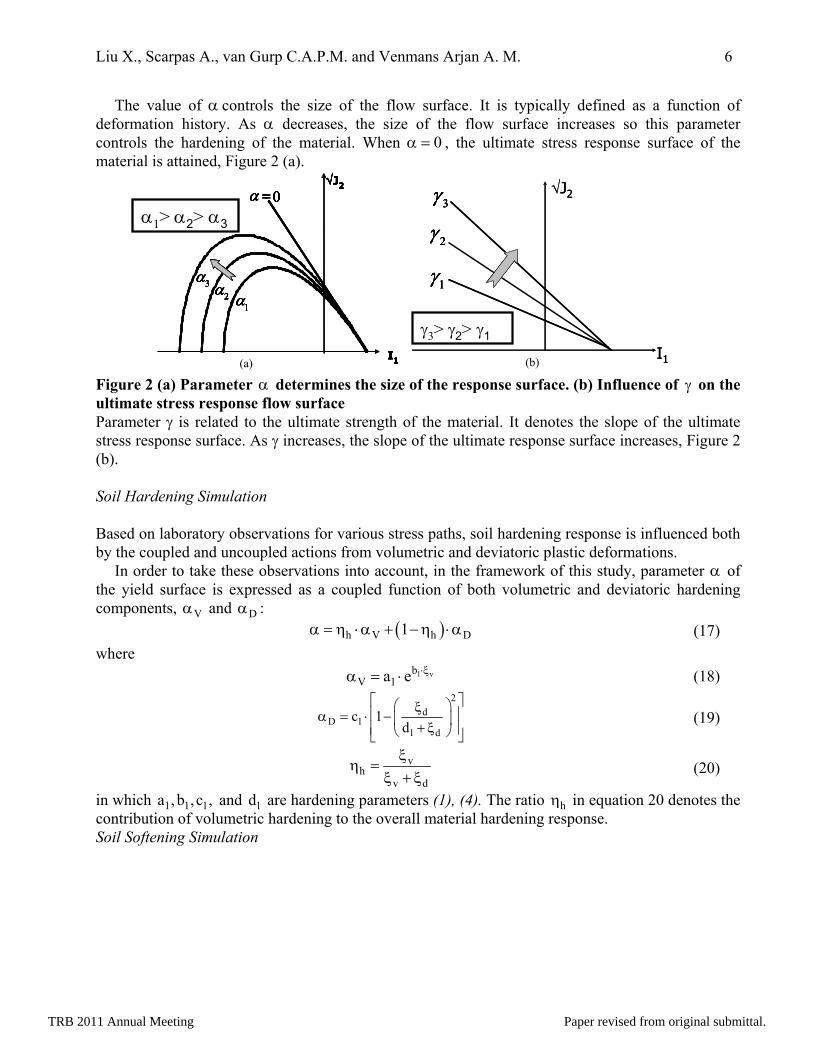
The value of α controls the size of the flow surface. It is typically defined as a function of deformation history. As α decreases, the size of the flow surface increases so this parameter controls the hardening of the material. When 0α = , the ultimate stress response surface of the material is attained, Figure 2 (a). Figure 2 (a) Parameter α determines the size of the response surface. (b) Influence of γ on the ultimate stress response flow surface Parameter γ is related to the ultimate strength of the material. It denotes the slope of the ultimate stress response surface. As γ increases, the slope of the ultimate response surface increases, Figure 2 (b). Soil Hardening Simulation Based on laboratory observations for various stress paths, soil hardening response is influenced both by the coupled and uncoupled actions from volumetric and deviatoric plastic deformations.
In order to take these observations into account, in the framework of this study, parameter α of the yield surface is expressed as a coupled function of both volumetric and deviatoric hardening components, and : Vα Dα
( )h V h D1α = η ⋅α + −η ⋅α (17)where
1 vbV 1a e ⋅ξα = ⋅ (18)
2d
D 11 d
c 1d
⎡ ⎤⎛ ⎞ξ⎢ ⎥α = ⋅ − ⎜ ⎟+ ξ⎢ ⎥⎝ ⎠⎣ ⎦
(19)
vh
v d
ξη =
ξ + ξ (20)
in which 1 1 1 and 1d are hardening parameters (1), (4). The ratio ha , b ,c , η in equation 20 denotes the contribution of volumetric hardening to the overall material hardening response. Soil Softening Simulation
(a) (b)
α1> α2> α3
σ2
√J20=α
1α3α
2α
I1
√J20=α
1α3α
2α
I1
σ2
√J20=α 0=α
1α1α3α3α
2α2α
I1
√J20=α 0=α
1α1α3α3α
2α2α
I1
γ3> γ2> γ1
√
I1
J23γ 3γ
2γ 2γ
1γ1γ
I1
√J23γ 3γ
2γ 2γ
1γ1γ
TRB 2011 Annual Meeting Paper revised from original submittal.
Liu X., Scarpas A., van Gurp C.A.P.M. and Venmans Arjan A. M. 7
An isotropic measure of response flow surface degradation has been introduced into the model to simulate the softening process This adaptation of the model is achieved by means of specifying the variation of parameter α , after response degradation initiation, as an increasing function of the monotonically varying equivalent post fracture plastic strain pfξ :
( )R s u Rα = α +η ⋅ α −α (21)in which
1 pfs e−κ ⋅ξη = (22)
and uα and R are the values of corresponding to material ultimate stress response and residual stress state respectively (1). The parameter
α α1κ is a material parameter that determines the material
degradation rate. Simulation of the Behaviour of Asphalt Concrete Materials A similar flow surface as in Figure 2 is utilized to simulate the hardening and softening response of asphalt concrete material. According to experimental evidence, the manner in which hardening/softening occurs for asphalt concrete materials can be quite complicated. The strain rate and temperature can influence significantly the response of asphalt concrete. For this reason, some assumptions must be made in view of the numerical implementation. Asphalt Concrete Hardening As discussed earlier, parameter α in the model is postulated to be a function of the plastic deformation history. In the framework of this investigation, on the basis of laboratory tests for the mixture, the following relationship was found between α and the effective plastic strain ξ over the range of test data (13):
( ) ( )0lim
limexp α
αα = ξ − ξ −κ ξ
ξ (23)
where α0 is the α value that corresponds to the initiation of plasticity, ξlim is the value of the effective inelastic strain at peak stress and κα is a material hardening parameter. Non-linear curve fitting over the available data sets results to the expression of κα for the mixture:
( )( )21 T1 exp ακ
α α⎡ ⎤κ = κ − − β ⋅ε⎢ ⎥⎣ ⎦
(24)
where is a temperature T related quantity and Tβ ε is the strain rate. Asphalt Concrete Softening An isotropic measure of the degradation response can be introduced into the model to simulate the softening response. This can be done by means of specifying the variation of the model parameter γ in equation (16), after the initiation of the degradation response, as a decaying function of a
TRB 2011 Annual Meeting Paper revised from original submittal.
Liu X., Scarpas A., van Gurp C.A.P.M. and Venmans Arjan A. M. 8
monotonically increasing physical quantity (e.g. ξpf), strain rateε and temperature T. The expression of γ is given by:
( ) ( ) 2pfmin max min 1exp
η⎡ ⎤γ = γ + γ − γ −η ξ⎢ ⎥⎣ ⎦ (25)
in which γmax and γmin are the value of γ at the point of peak stress and the point of complete annihilation of the material respectively. η1 and η2 are material constants, see (13). The material constant is given by: minγ
( ) min 3min min1 min 2 T
γγ = γ + γ ε ⋅β (26)in which are material constants. min iγ ( 31−=i )The material constant is given by: 1η
( ) 121 11 T
ηη = η ε ⋅β (27)where , , and are material constants. 11η 12η 1η 2η Cracking The tension softening model proposed by (3) is used. This implies that for states of stress exceeding the magnitude of the fracture surface, a plane of cracking is introduced perpendicular to the principal tensile stress direction. On the crack plane a Hoffman response surface is specified to control the subsequent softening response. The following expression is proposed for the softening in tension:
pftk
t tf e− ξσ = ⋅ (28)
( ) t21t t T
κκ = κ ⋅ β ⋅ε (29)
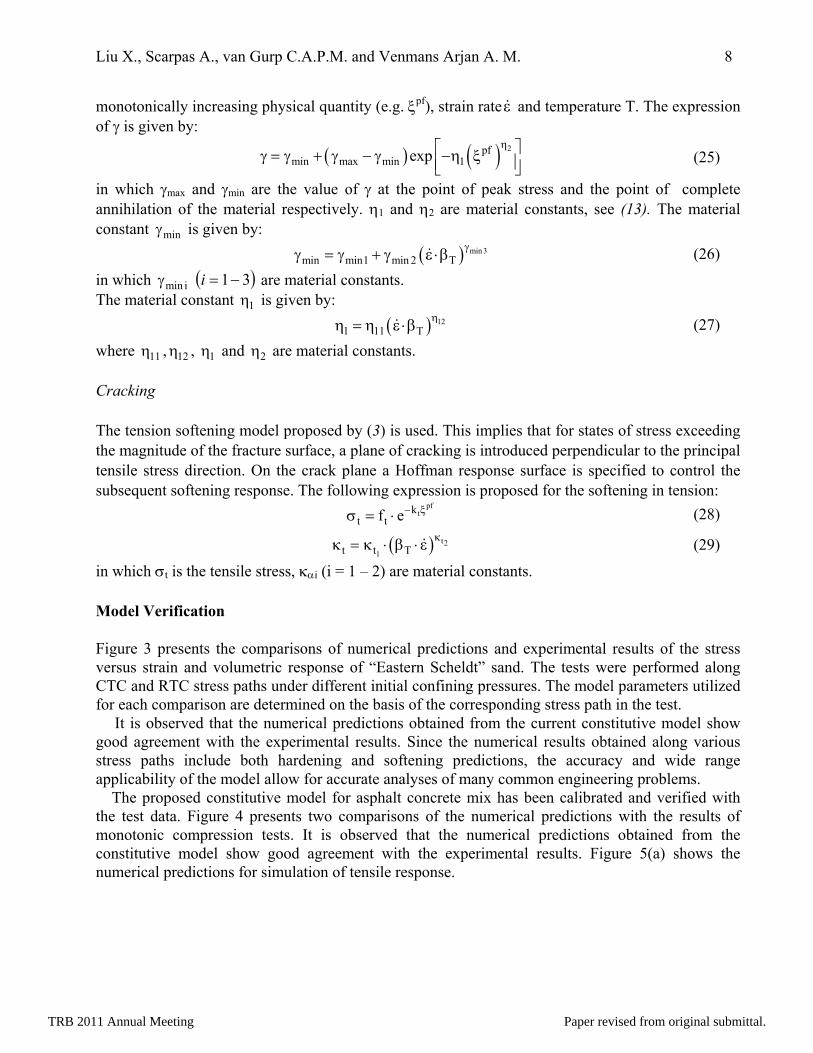
in which σt is the tensile stress, καi (i = 1 – 2) are material constants. Model Verification Figure 3 presents the comparisons of numerical predictions and experimental results of the stress versus strain and volumetric response of “Eastern Scheldt” sand. The tests were performed along CTC and RTC stress paths under different initial confining pressures. The model parameters utilized for each comparison are determined on the basis of the corresponding stress path in the test.
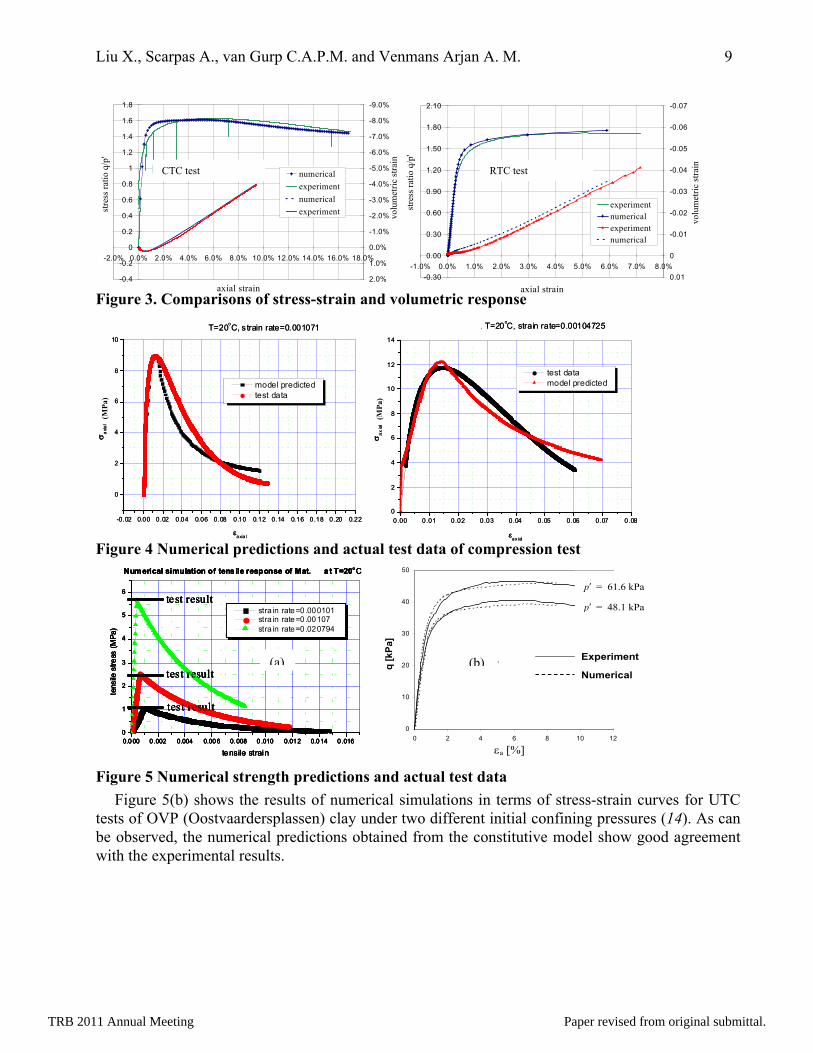
It is observed that the numerical predictions obtained from the current constitutive model show good agreement with the experimental results. Since the numerical results obtained along various stress paths include both hardening and softening predictions, the accuracy and wide range applicability of the model allow for accurate analyses of many common engineering problems. The proposed constitutive model for asphalt concrete mix has been calibrated and verified with the test data. Figure 4 presents two comparisons of the numerical predictions with the results of monotonic compression tests. It is observed that the numerical predictions obtained from the constitutive model show good agreement with the experimental results. Figure 5(a) shows the numerical predictions for simulation of tensile response.
TRB 2011 Annual Meeting Paper revised from original submittal.
Liu X., Scarpas A., van Gurp C.A.P.M. and Venmans Arjan A. M. 9
Figure 3. Comparisons of stress-strain and volumetric response
-0.4
-0.2
0
0.2
0.4
0.6
0.8
1
1.2
1.4
1.6
1.8
-2.0% 0.0% 2.0% 4.0% 6.0% 8.0% 10.0% 12.0% 14.0% 16.0% 18.0%
axial strain
stre
ss ra
tio q
/p'
-9.0%
-8.0%
-7.0%
-6.0%
-5.0%
-4.0%
-3.0%
-2.0%
-1.0%
0.0%
1.0%
2.0%
volu
met
ric st
rain
numericalexperimentnumericalexperiment
-0.30
0.00
0.30
0.60
0.90
1.20
1.50
1.80
2.10
-1.0% 0.0% 1.0% 2.0% 3.0% 4.0% 5.0% 6.0% 7.0% 8.0%
axial strain
stre
ss ra
tio q
/p'
-0.07
-0.06
-0.05
-0.04
-0.03
-0.02
-0.01
0
0.01
volu
met
ric st
rain
experimentnumericalexperimentnumerical
CTC test RTC test
Figure 4 Numerical predictions and actual test data of compression test
0.00 0.01 0.02 0.03 0.04 0.05 0.06 0.07 0.080
2
4
6
8
10
12
14
Material 45, T=20oC, strain rate=0.00104725
σ ax
ial
εax ial
test data model predicted
-0.02 0.00 0.02 0.04 0.06 0.08 0.10 0.12 0.14 0.16 0.18 0.20 0.22
0
2
4
6
8
10
Material 40, T=20oC, s train rate=0.001071
σ axi
al
εaxia l
model predicted test data
R0
(M
Pa)
(M
Pa)
0.000 0 .002 0.004 0.006 0. 008 0 .010 0.012 0.014 0.0160
1
2
3
4
5
6
Numerical simulation of tensile response of Mat. 40 at T=20o C
tens
ile s
tress
(MPa
)
tensile strain
stra in rate=0.000101 stra in rate=0.00107 stra in rate=0.020794
test result
test result
test result
0.000 0 .002 0.004 0.006 0. 008 0 .010 0.012 0.014 0.0160
1
2
3
4
5
6
Numerical simulation of tensile response of Mat. 40 at T=20o C
tens
ile s
tress
(MPa
)
tensile strain
stra in rate=0.000101 stra in rate=0.00107 stra in rate=0.020794
test result
test result
test result
0.000 0 .002 0.004 0.006 0. 008 0 .010 0.012 0.014 0.0160
1
2
3
4
5
6
Numerical simulation of tensile response of Mat. 40 at T=20o C
tens
ile s
tress
(MPa
)
tensile strain
stra in rate=0.000101 stra in rate=0.00107 stra in rate=0.020794
test result
test result
test result
0.000 0 .002 0.004 0.006 0. 008 0 .010 0.012 0.014 0.0160
1
2
3
4
5
6
Numerical simulation of tensile response of Mat. 40 at T=20o C
tens
ile s
tress
(MPa
)
tensile strain
stra in rate=0.000101 stra in rate=0.00107 stra in rate=0.020794
test result
test result
test result
εa [%]
0
10
20
30
40
50
0 2 4 6 8 10 12
q [k
Pa]
,
p′ = 61.6 kPa
p′ = 48.1 kPa Experiment Numerical
(a) (b)
Figure 5 Numerical strength predictions and actual test data Figure 5(b) shows the results of numerical simulations in terms of stress-strain curves for UTC
tests of OVP (Oostvaardersplassen) clay under two different initial confining pressures (14). As can be observed, the numerical predictions obtained from the constitutive model show good agreement with the experimental results.
TRB 2011 Annual Meeting Paper revised from original submittal.
Liu X., Scarpas A., van Gurp C.A.P.M. and Venmans Arjan A. M. 10
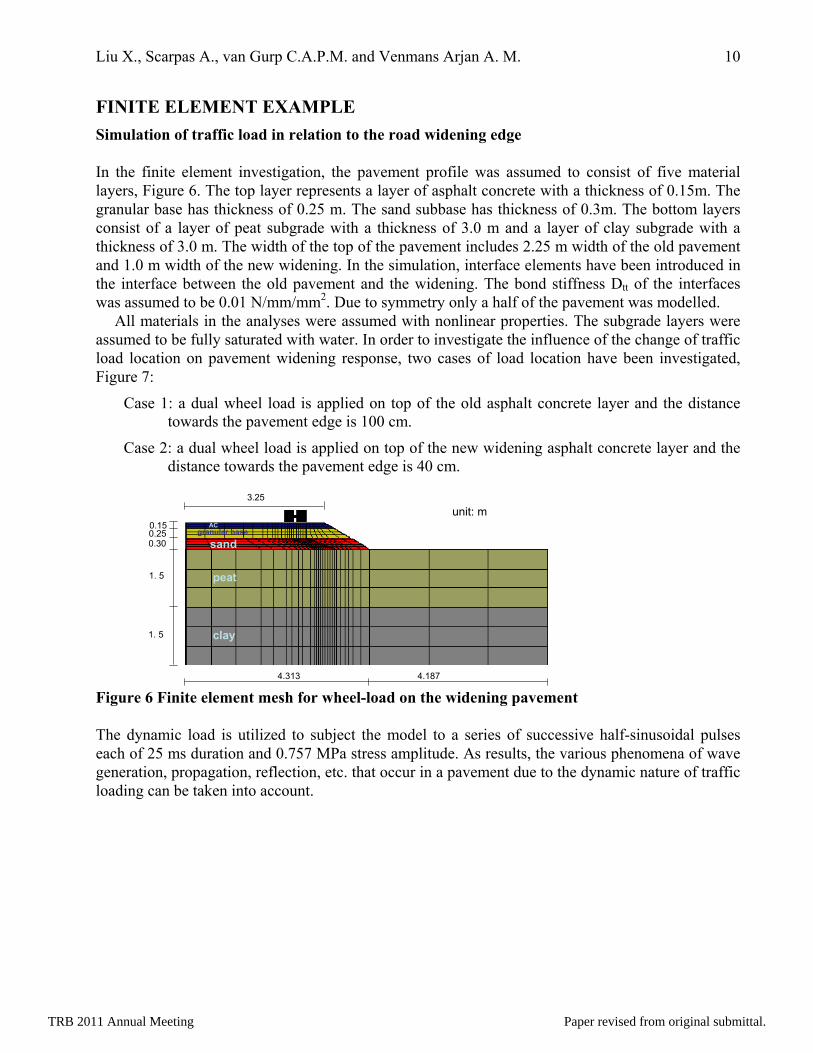
FINITE ELEMENT EXAMPLE Simulation of traffic load in relation to the road widening edge In the finite element investigation, the pavement profile was assumed to consist of five material layers, Figure 6. The top layer represents a layer of asphalt concrete with a thickness of 0.15m. The granular base has thickness of 0.25 m. The sand subbase has thickness of 0.3m. The bottom layers consist of a layer of peat subgrade with a thickness of 3.0 m and a layer of clay subgrade with a thickness of 3.0 m. The width of the top of the pavement includes 2.25 m width of the old pavement and 1.0 m width of the new widening. In the simulation, interface elements have been introduced in the interface between the old pavement and the widening. The bond stiffness Dtt of the interfaces was assumed to be 0.01 N/mm/mm2. Due to symmetry only a half of the pavement was modelled.
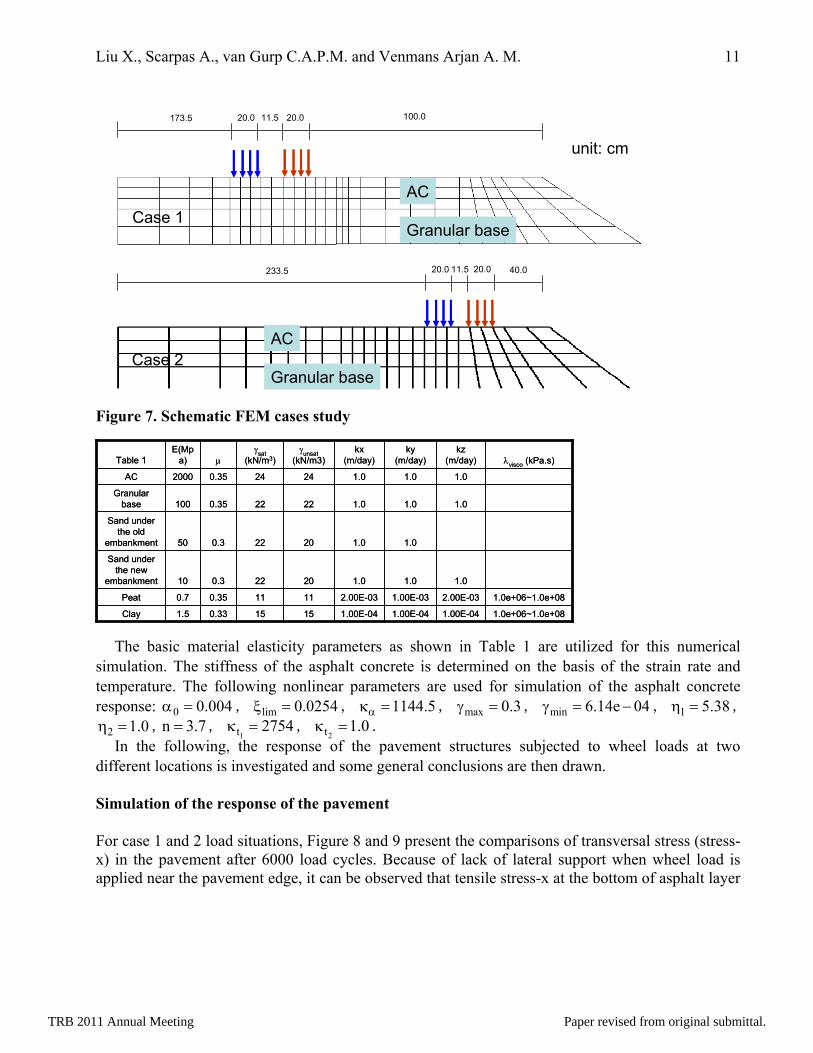
All materials in the analyses were assumed with nonlinear properties. The subgrade layers were assumed to be fully saturated with water. In order to investigate the influence of the change of traffic load location on pavement widening response, two cases of load location have been investigated, Figure 7:
Case 1: a dual wheel load is applied on top of the old asphalt concrete layer and the distance towards the pavement edge is 100 cm.
Case 2: a dual wheel load is applied on top of the new widening asphalt concrete layer and the distance towards the pavement edge is 40 cm.
3.25
0.150.25
1. 5
1. 5
4.313 4.187
unit: m
0.30
peat
clay
sandgranular base
AC Figure 6 Finite element mesh for wheel-load on the widening paveme
he dynamic load is utilized to subject the model to a series of successive half-sinusoidal pulses
nt Teach of 25 ms duration and 0.757 MPa stress amplitude. As results, the various phenomena of wave generation, propagation, reflection, etc. that occur in a pavement due to the dynamic nature of traffic loading can be taken into account.
TRB 2011 Annual Meeting Paper revised from original submittal.
Liu X., Scarpas A., van Gurp C.A.P.M. and Venmans Arjan A. M. 11
Figure 7. Schematic FEM cases study
he basic material elasticity parameters as shown in Table 1 are utilized for this numerical sim
Tulation. The stiffness of the asphalt concrete is determined on the basis of the strain rate and
temperature. The following nonlinear parameters are used for simulation of the asphalt concrete response: 0 0.004α = , lim 0.0254ξ = , 1144.5ακ = , max 0.3γ = , min 6.14e 04γ = − , 1 5.38η = ,
2 1.0η = ,n 3 t 1..7= , 1
2754κ = , 2t 0κ = .
In the following, the response of the pavement dif
imulation of the response of the pavement
r case 1 and 2 load situations, Figure 8 and 9 present the comparisons of transversal stress (stress-
1.01.020220.350
Sand under the old
embankment
1.0e+06~1.0e+081.00E-041.00E-041.00E-0415150.331.5Clay
1.0e+06~1.0e+082.00E-031.00E-032.00E-0311110.350.7Peat
1.01.01.020220.310
Sand under the new
embankment
1.01.01.022220.35100Granular
base
1.01.01.024240.352000AC
λvisco (kPa.s)kz
(m/day)ky
(m/day)kx
(m/day)γunsat
(kN/m3)γsat
(kN/m3)μE(Mp
a)Table 1
structures subjected to wheel loads at two ferent locations is investigated and some general conclusions are then drawn.
S Fox) in the pavement after 6000 load cycles. Because of lack of lateral support when wheel load is applied near the pavement edge, it can be observed that tensile stress-x at the bottom of asphalt layer
1.01.020220.350
Sand under the old
embankment
1.0e+06~1.0e+081.00E-041.00E-041.00E-0415150.331.5Clay
1.0e+06~1.0e+082.00E-031.00E-032.00E-0311110.350.7Peat
1.01.01.020220.310
Sand under the new
embankment
1.01.01.022220.35100Granular
base
1.01.01.024240.352000AC
λvisco (kPa.s)kz
(m/day)ky
(m/day)kx
(m/day)γunsat
(kN/m3)γsat
(kN/m3)μE(Mp
a)Table 1
233.5 20.0 11.5 20.0 40.0
AC
Granular base
20.0 11.5 20.0 100.0
unit: cm
AC
Granular baseCase 1
Case 2
173.5
TRB 2011 Annual Meeting Paper revised from original submittal.
Liu X., Scarpas A., van Gurp C.A.P.M. and Venmans Arjan A. M. 12
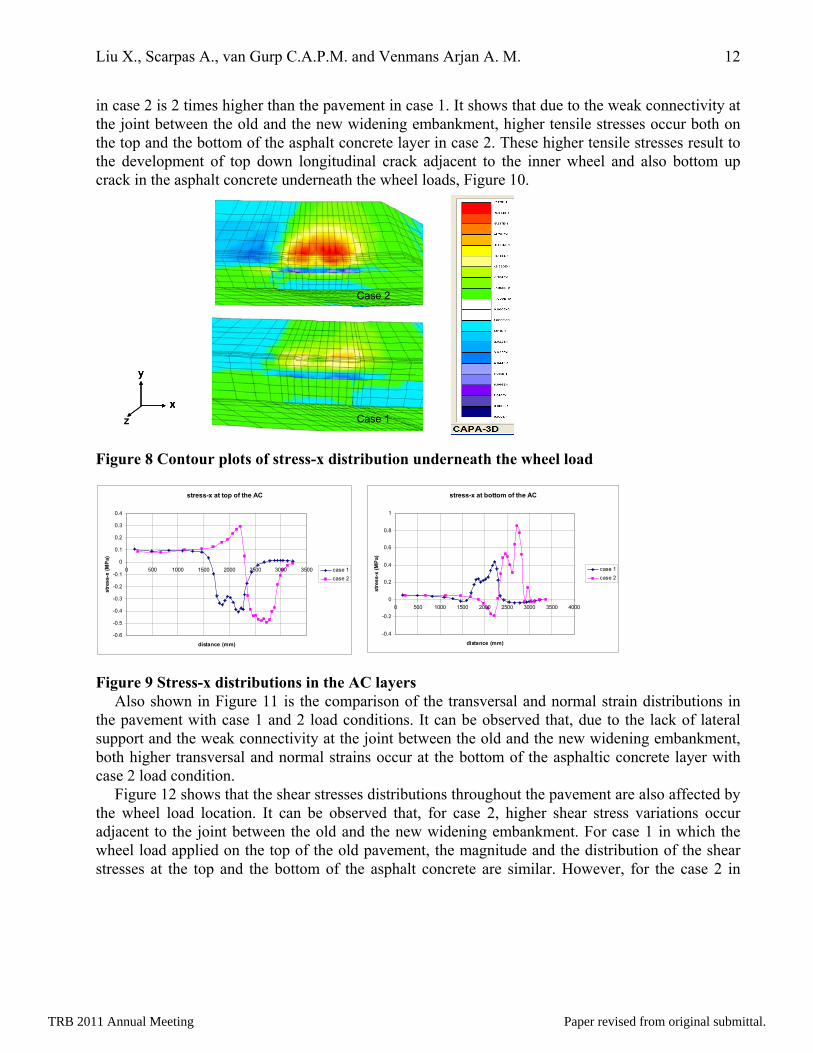
in case 2 is 2 times higher than the pavement in case 1. It shows that due to the weak connectivity at the joint between the old and the new widening embankment, higher tensile stresses occur both on the top and the bottom of the asphalt concrete layer in case 2. These higher tensile stresses result to the development of top down longitudinal crack adjacent to the inner wheel and also bottom up crack in the asphalt concrete underneath the wheel loads, Figure 10.
Case 1
Case 2
x
y
zx
y
x
y
x
y
z
Figure 8 Contour plots of stress-x distribution underneath the w eel load
igure 9 Stress-x distributions in the AC layers the transversal and normal strain distributions in
the
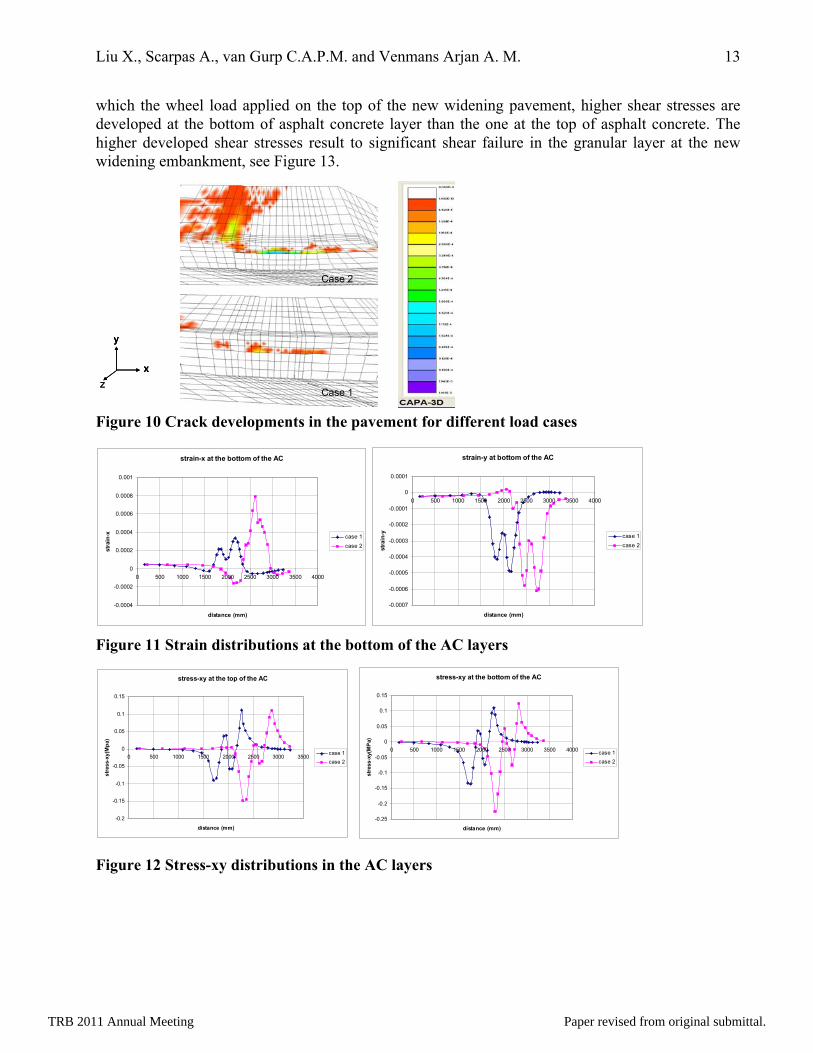
the shear stresses distributions throughout the pavement are also affected by the
h F
Also shown in Figure 11 is the comparison of pavement with case 1 and 2 load conditions. It can be observed that, due to the lack of lateral
support and the weak connectivity at the joint between the old and the new widening embankment, both higher transversal and normal strains occur at the bottom of the asphaltic concrete layer with case 2 load condition.
Figure 12 shows that wheel load location. It can be observed that, for case 2, higher shear stress variations occur
adjacent to the joint between the old and the new widening embankment. For case 1 in which the wheel load applied on the top of the old pavement, the magnitude and the distribution of the shear stresses at the top and the bottom of the asphalt concrete are similar. However, for the case 2 in
stress-x at bottom of the AC
-0.4
-0.2
0
0.2
0.4
0.6
0.8
1
0 500 1000 1500 2000 2500 3000 3500 4000
distance (mm)
stre
ss-x
(MP
a)
case 1case 2
stress-x at top of the AC
-0.6
-0.5
-0.4
-0.3
-0.2
-0.1
0
0.1
0.2
0.3
0.4
0 500 1000 1500 2000 2500 3000 3500
distance (mm)
stre
ss-x
(MPa
)
case 1case 2
TRB 2011 Annual Meeting Paper revised from original submittal.
Liu X., Scarpas A., van Gurp C.A.P.M. and Venmans Arjan A. M. 13
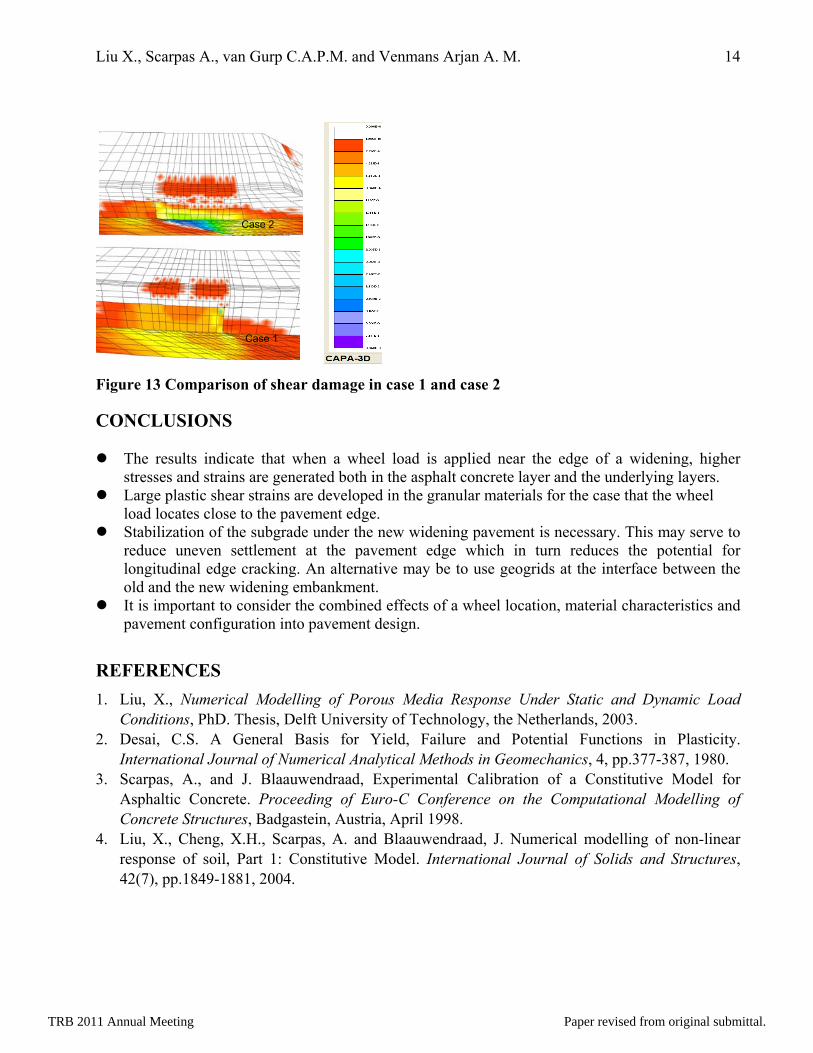
which the wheel load applied on the top of the new widening pavement, higher shear stresses are developed at the bottom of asphalt concrete layer than the one at the top of asphalt concrete. The higher developed shear stresses result to significant shear failure in the granular layer at the new widening embankment, see Figure 13. Figure 10 Crack developments in the pavement for different load cases
igure 12 Stress-xy distributions in the AC layers
Figure 11 Strain distributions at the bottom of the AC layers
F
Case 1
x
y
zx
y
x
y
x
y
z
Case 2Case 2
strain-x at the bottom of the AC
-0.0004
-0.0002
0
0.0002
0.0004
0.0006
0.0008
0.001
0 500 1000 1500 2000 2500 3000 3500 4000
distance (mm)
stra
in-x case 1
case 2
strain-y at bottom of the AC
-0.0007
-0.0006
-0.0005
-0.0004
-0.0003
-0.0002
-0.0001
0
0.0001
0 500 1000 1500 2000 2500 3000 3500 4000
distance (mm)
stra
in-y case 1
case 2
stress-xy at the bottom of the AC
-0.25
-0.2
-0.15
-0.1
-0.05
0
0.05
0.1
0.15
0 500 1000 1500 2000 2500 3000 3500 4000
distance (mm)
stre
ss-x
y(M
Pa)
case 1case 2
stress-xy at the top of the AC
-0.2
-0.15
-0.1
-0.05
0
0.05
0.1
0.15
0 500 1000 1500 2000 2500 3000 3500
distance (mm)
stre
ss-x
y(M
pa)
case 1case 2
TRB 2011 Annual Meeting Paper revised from original submittal.
Liu X., Scarpas A., van Gurp C.A.P.M. and Venmans Arjan A. M. 14
Case 1
Case 2
Figure 13 Comparison of shear damage in case 1 and case 2
ONCLUSIONS
The results indicate that when a wheel load is applied near the edge of a widening, higher
ew widening pavement is necessary. This may serve to
effects of a wheel location, material characteristics and
EFERENCES cal Modelling of Porous Media Response Under Static and Dynamic Load
in Plasticity.
d, J. Numerical modelling of non-linear response of soil, Part 1: Constitutive Model. International Journal of Solids and Structures, 42(7), pp.1849-1881, 2004.
C
stresses and strains are generated both in the asphalt concrete layer and the underlying layers. Large plastic shear strains are developed in the granular materials for the case that the wheel
load locates close to the pavement edge. Stabilization of the subgrade under the n
reduce uneven settlement at the pavement edge which in turn reduces the potential for longitudinal edge cracking. An alternative may be to use geogrids at the interface between the old and the new widening embankment.
It is important to consider the combined pavement configuration into pavement design.
R1. Liu, X., Numeri
Conditions, PhD. Thesis, Delft University of Technology, the Netherlands, 2003. 2. Desai, C.S. A General Basis for Yield, Failure and Potential Functions
International Journal of Numerical Analytical Methods in Geomechanics, 4, pp.377-387, 1980. 3. Scarpas, A., and J. Blaauwendraad, Experimental Calibration of a Constitutive Model for
Asphaltic Concrete. Proceeding of Euro-C Conference on the Computational Modelling of Concrete Structures, Badgastein, Austria, April 1998.
4. Liu, X., Cheng, X.H., Scarpas, A. and Blaauwendraa
TRB 2011 Annual Meeting Paper revised from original submittal.
Liu X., Scarpas A., van Gurp C.A.P.M. and Venmans Arjan A. M. 15
5. Liu, X. and Scarpas, A. Numerical Modeling of the Influence of Water Suction on the formation of Strain Localization in Saturated Sand, Comput. Model. Engng. Sci. 9, pp.57-74, 2005.
6. Browen, R.M., Continuum Physics, Academic Press, New York, San Fransisco, London, pp. 1-
p73-93,
. and Schrefler, B.A., The Finite Element Method in Static and Dynamic
izadeh, M., Derivation of Basic Equations of Mass Transport in Porous Media; Part 1:
ia; the General
sity of Technology, the Netherlands, 2007.
127, 1976. 7. Ehlers, W., On Thermodynamics of Elasto-Plastic Porous Media, Arch. Mech. 41(1), p
1989. 8. Lewis, R.W
Deformation and Consolidation of porous Media, second ed. John Wiley, chichester, U.K., 1998. 9. Hassan
Macroscopic Balance Laws, Adv. Water Resource, 9, pp196-206, 1986. 10. Coussy, O. Mechanics of Porous Continua, John Wiley, Chichester, U.K., 1995. 11. Biot, M.A., General Theory of Three-dimensional Consolidation, J. Appi. Phys. 12, pp 155-164,
1941. 12. Ziekiewicz, O.C. and Shiomi, T., Dynamic Behavior of Saturated Porous Med
Biot Formulation and its Numerical Solution, Int. J. Numer. Anal. Meth. Geomech. 8, pp71-96, 1985.
13. Liu, X., Medani, T.O., Sutjiadi, W., Scarpas, A., FEM Simulation of Response of Polymer Modified Asphalt Mixtures, Report CM 2007-001, Section of Structural Mechanics, Delft Univer
14. Tigchelaar, J., Feijter de, J.W., Haan den, E.J., Shear tests on reconstituted oostvaardersplassen clay, Soft Ground Technology - proceedings of the soft ground technology conference, the Netherland, 2000.
15. Scarpas, A. and Liu, X., CAPA-3D Finite Element System-User’s Manual, Part I, II and III, Section of Structural Mechanics, Delft University of Technology, the Netherlands, 2000.
TRB 2011 Annual Meeting Paper revised from original submittal.