Numerical and experimental study of new designs of all ...
165
Scholars' Mine Scholars' Mine Doctoral Dissertations Student Theses and Dissertations Spring 2017 Numerical and experimental study of new designs of all-vanadium Numerical and experimental study of new designs of all-vanadium redox flow batteries for performance improvement redox flow batteries for performance improvement Mohammed Abdulkhabeer Ali Al-yasiri Follow this and additional works at: https://scholarsmine.mst.edu/doctoral_dissertations Part of the Mechanical Engineering Commons Department: Mechanical and Aerospace Engineering Department: Mechanical and Aerospace Engineering Recommended Citation Recommended Citation Al-yasiri, Mohammed Abdulkhabeer Ali, "Numerical and experimental study of new designs of all- vanadium redox flow batteries for performance improvement" (2017). Doctoral Dissertations. 2737. https://scholarsmine.mst.edu/doctoral_dissertations/2737 This thesis is brought to you by Scholars' Mine, a service of the Missouri S&T Library and Learning Resources. This work is protected by U. S. Copyright Law. Unauthorized use including reproduction for redistribution requires the permission of the copyright holder. For more information, please contact [email protected].
Transcript of Numerical and experimental study of new designs of all ...

Scholars' Mine Scholars' Mine
Doctoral Dissertations Student Theses and Dissertations
Spring 2017
Numerical and experimental study of new designs of all-vanadium Numerical and experimental study of new designs of all-vanadium
redox flow batteries for performance improvement redox flow batteries for performance improvement
Mohammed Abdulkhabeer Ali Al-yasiri
Follow this and additional works at: https://scholarsmine.mst.edu/doctoral_dissertations
Part of the Mechanical Engineering Commons
Department: Mechanical and Aerospace Engineering Department: Mechanical and Aerospace Engineering
Recommended Citation Recommended Citation Al-yasiri, Mohammed Abdulkhabeer Ali, "Numerical and experimental study of new designs of all-vanadium redox flow batteries for performance improvement" (2017). Doctoral Dissertations. 2737. https://scholarsmine.mst.edu/doctoral_dissertations/2737
This thesis is brought to you by Scholars' Mine, a service of the Missouri S&T Library and Learning Resources. This work is protected by U. S. Copyright Law. Unauthorized use including reproduction for redistribution requires the permission of the copyright holder. For more information, please contact [email protected].

NUMERICAL AND EXPERIMENTAL STUDY OF NEW DESIGNS OF ALL-
VANADIUM REDOX FLOW BATTERIES FOR PERFORMANCE IMPROVEMENT
By
MOHAMMED ABDULKHABEER ALI AL-YASIRI
A DISSERTATION
Presented to the Faculty of the Graduate School of the
MISSOURI UNIVERSITY OF SCIENCE AND TECHNOLOGY
In Partial Fulfillment of the Requirements for the Degree
DOCTOR OF PHILOSOPHY
in
MECHANICAL ENGINEERING
2017
Approved
Jonghyun Park, Advisor
Kelly Homan
Frank Liou
Cheng Wang
Joseph Guggenberger

2017
Mohammed Abdulkhabeer Ali Al-Yasiri
All Rights Reserved

iii
PUBLICATION DISSERTATION OPTION
This dissertation contains the following three articles, formatted in the style used
by the Missouri University of Science and Technology:
Paper I: Pages 33-78 “Study on Channel Geometry of All-Vanadium Redox Flow
Batteries” have been submitted to Journal of Renewable energy.
Paper II: Pages 79-111 “New Single Cell Design of Vanadium Redox Flow
Battery” are intended for submission to Applied Energy Journal.
Paper III: Pages 112-139 “Development of a Distributed Vanadium Redox Flow
Battery for Transport Systems” are intended for submission to Energy, the international
Journal.

iv
ABSTRACT
Energy storage is envisioned as a key part of a renewable energy solution
incorporated in a grid that overcomes two critical limits of renewable energy:
intermittency and uncertainty. Among various technologies, a vanadium redox flow
battery (VRFB) offers a promise because of its unique features such as long cycle life,
separation of energy and power ratings, and capability of a deep discharge. The
remaining challenges, however, include the limited application due to low energy density
and complicated geometries. The complex geometry makes it difficult to optimize the
performance and can cause a serious concern about leakage of the liquid. The goal of this
dissertation is to resolve these challenges through modeling and experimental studies for
newly-designed VRFB. The topic can be divided into three main efforts: flow field
optimization by optimizing channels, new design for stability improvement and cost
reduction, and a new concept of distributed VRFB.
First, the effects of channel and length on battery performance were investigated
based on 3D electrochemical models validated by experimental measurements. Second,
to address the drawbacks of traditional VRFB, a new design has been introduced to
increase reliability, reduce costs, and ease assembly. This battery has a small number of
parts, which can more effectively prevent electrolyte leakage. Based on PVC (polyvinyl
chloride) material, it solves the problem caused by electrolyte penetration by replacing
existing graphite plate. Third, the development of a new distributed VRFB for transport
systems addresses the problem of insufficient power, one of the main challenges of the
flow system. This new technology is more efficient for space utilization, equal weight
distribution, and fueling like a gasoline vehicle, reducing charge time.

v
ACKNOWLEDGMENTS
First, I would like to express my sincere gratitude to my academic advisor, Prof.
Jonghyun Park, for his mentorship, patience, support, and encouragement during my PhD
study. The work that I have done for my PhD would never have been possible without his
consistent support and guide throughout my research. I must also thank my sponsor of
study, the higher committee for education development in Iraq (HCED), for giving me
such a wonderful opportunity of pursing my PhD study in the United States, and for the
full financial support and funding during these years. In addition, I would like to
appreciate Prof. Terry Bone’s effort in the Dept. of Chemistry, who helped me at the very
beginning of my research in preparation for the experimental chemical solution and
provided all the required facility services.
I would also like to thank my committee members, Prof. Kelly Homan, Prof.
Frank Liou, Prof. Cheng Wang, and Prof. Joseph Guggenberger, for their support and
appreciation of my research. My acknowledgments as well to all my colleagues in the
Advanced Energy Materials and Systems Lab for their trust and friendship, and I would
like to say thanks for all the funny stories and memories.
Last and most of all, I really want to extend my deepest appreciation to my
parents and siblings for their prayers and continuous support (material and moral) to
pursue my dream and work hard for it. Your encouragement and understanding support
me to overcome difficulties and continually move forward. Also, I must not forget my
wife, her family, and my lovely kids for their endless support and being with me every
step of the way.

vi
DEDICATION
To my big family, IRAQ.
To the people and families of those who have martyred and those currently fighting ISIS
‘‘The Holy Popular Mobilization’’.
To my family and friends who stood behind me and prayed for me with deep love and
affection.
Mohammed

vii
TABLE OF CONTENTS
Page
PUBLICATION DISSERTATION OPTION ................................................................... iii
ABSTRACT ....................................................................................................................... iv
ACKNOWLEDGMENTS .................................................................................................. v
DEDICATION ................................................................................................................... vi
LIST OF ILLUSTRATIONS ............................................................................................ xii
LIST OF TABLES ........................................................................................................... xvi
SECTION
1. INTRODUCTION ...................................................................................................... 1
1.1. NEED FOR ENERGY STORAGE .................................................................... 1
1.2. ENERGY STORAGE METHODS..................................................................... 3
1.2.1. Pumped Hydroelectric Power. .................................................................. 3
1.2.2. Compressed Air. ....................................................................................... 4
1.2.3. Flywheels. ................................................................................................. 5
1.2.4. Superconducting Magnetic Energy Storage (SMES). .............................. 6
1.2.5. Batteries. ................................................................................................... 7
1.3. ELECTROCHEMICAL ENERGY STORAGE ................................................. 9
1.3.1. Lead–Acid Batteries. ................................................................................ 9
1.3.2. Sodium Sulfur Batteries. .......................................................................... 9
1.3.3. Lithium-Ion Batteries. ............................................................................ 10
1.3.4. Redox Flow Batteries. ............................................................................ 10
1.4. FLOW BATTERIES ......................................................................................... 11

viii
1.4.1. Advantages and Disadvantages. ............................................................. 12
1.4.1.1. Advantages. ................................................................................13
1.4.1.2. Disadvantages. ...........................................................................13
1.4.2. Types of Flow Batteries. ........................................................................ 14
1.4.3. Applications of Flow Batteries. .............................................................. 14
1.5. FUNDAMENTAL PRINCIPLES OF VRFB ................................................... 15
1.5.1. Electrochemistry. .................................................................................... 20
1.5.2. Nernst Equation. ..................................................................................... 21
1.5.3. Current: The Butler–Volmer Equation. .................................................. 22
1.5.4. State of Charge. ...................................................................................... 23
1.5.5. Cell Voltage and Overpotential. ............................................................. 23
1.5.5.1. Activation overpotential.............................................................25
1.5.5.2. Concentration overpotential. ......................................................25
1.5.5.3. Ohmic and ionic overpotentials. ................................................26
1.5.5.4. Other losses of VRFBs...............................................................27
1.6. TECHNICAL SPECIFICATIONS OF VRFB ................................................. 28
1.6.1. Capacity. ................................................................................................. 28
1.6.2. Energy Density. ...................................................................................... 28
1.6.3. Current Density. ..................................................................................... 29
1.6.4. Power Density. ....................................................................................... 29
1.7. MULTIPHYSICS MODELS OF VRFB .......................................................... 29
1.8. MOTIVATION AND THESIS OBJECTIVE .................................................. 30

ix
PAPER
I. STUDY ON CHANNEL GEOMETRY OF ALL-VANADIUM REDOX FLOW
BATTERIES ................................................................................................................ 33
ABSTRACT ................................................................................................................. 33
1. INTRODUCTION .................................................................................................... 34
2. EXPERIMENTAL SETUP ...................................................................................... 37
3. MATHEMATICAL MODEL .................................................................................. 40
3.1. GEOMETRY .................................................................................................... 40
3.2. MODEL DEVELOPMENT .............................................................................. 41
4. RESULTS ................................................................................................................. 46
4.1. EFFECT OF NUMBER OF CHANNELS ....................................................... 46
4.2. GENERAL BEHAVIOR UNDER DIFFERENT FLOW RATES AND
CURRENT DENSITIES………………………………………………………46
4.3. CHANNEL GEOMETRY IMPACT ................................................................ 49
4.3.1. Voltage Responses at Different Geometries. ......................................... 49
4.3.2. Pressure Drop at Different Geometries. ................................................. 51
4.3.3. Electrolyte Penetration into the Porous Electrode. ................................. 53
4.3.4. Energy Efficiency, Battery Efficiency, and Pumping Power. ................ 54
4.3.5. Effect of the Applied Current on the System Efficiency……………….55
5. DISCUSSION .......................................................................................................... 58
6. CONCLUSIONS ...................................................................................................... 61
APPENDIX……………………………………………………………………………62
REFERENCES…………………………………….…………….……………………73
x
II. NEW SINGLE CELL DESIGN OF A VANADIUM REDOX FLOW
BATTERY…………………………………………………………………………….79
ABSTRACT ................................................................................................................. 79
1. INTRODUCTION .................................................................................................... 81
2. DETAILS OF THE EXPERIMENTAL WORK ...................................................... 86
3. RESULTS ................................................................................................................. 90
3.1. PERMEABILITY OF PVC AND GRAPHITE BIPOLAR PLATES .............. 90
3.2. CHARGE/DISCHARGE CYCLING TEST ..................................................... 91
3.3. BATTERY STORAGE CAPACITY ................................................................ 94
3.4. THE NEW BATTERY BEHAVIOR AT DIFFERENT OPERATING
CONDITIONS .................................................................................................. 96
3.5. POLARIZATION CURVES .............................................................................97
3.6. ELECTROCHEMICAL IMPEDANCE SPECTROSCOPY TEST (EIS) ...... 101
3.7. CONTACT RESISTANCE IMPROVEMENT .............................................. 103
3.8. ECONOMIC PERSPECTIVES ANALYSIS ................................................. 105
4. CONCLUSIONS .................................................................................................... 107
REFERENCES………...……...…...……………………………………...………...109
III. DEVELOPMENT OF A DISTRIBUTED VANADIUM REDOX FLOW
BATTERY FOR TRANSPORT SYSTEMS ............................................................. 112
ABSTRACT ............................................................................................................... 112
1. INTRODUCTION .................................................................................................. 114
2. ACTUAL ELECTRODE AREA ANALYSIS ....................................................... 119
3. THE EXPERIMENTAL APPROACH DETAILS................................................. 121
4. RESULTS ............................................................................................................... 126
4.1. CYCLING PERFORMANCE ........................................................................ 126

xi
4.2. POLARIZATION MEASUREMENTS……………………………………...131
4.3. ELECTROCHEMICAL IMPEDANCE TEST ANALYSIS………………...133
5. CONCLUSIONS .....................................................................................................135
REFERENCES…………………….…...…………………………………………...136
SECTION
2. SUMMARY AND FUTURE WORK…………………………………………….140
2.1. SUMMARY.....................................................................................................140
2.2. FUTURE WORK..……………….…….….………….……...…….………...143
REFERENCES……………………………………………………………………....145
VITA…………………………….……………………………...……………………148
xii
LIST OF ILLUSTRATIONS
Page
SECTION
Figure 1.1. Hydroelectric power system during day and night times [7]. ......................... 4
Figure 1.2. Schematic of a compress air storage sy stem [7]. ............................................ 5
Figure 1.3. Flywheel energy storage system [9]. ................................................................ 6
Figure 1.4. Basic structure of SMES device [10]. ............................................................. 7
Figure 1.5. A side by side comparisons of several batteries [11]. ...................................... 8
Figure 1.6. Schematic diagram of flow battery. ................................................................ 11
Figure 1.7. Typical polarization curve of a single VRFB cell. ......................................... 24
PAPER I
Figure 2.1. (a) A schematic of a flow cell: (1) end plates, (2) insulators, (3) current
collectors, (4) graphite plates with serpentine flow channels, (5) gaskets,
(6) porous electrodes, (7) membrane, (8) power source or load, (9) electrolyte
tanks, (10) pumps, (b) experimental setup of a VRFB. .............................................. 38
Figure 3.1. A serpentine channel structure (left) and a single channel path (right)
of a VRFB. .................................................................................................................. 40
Figure 4.1. Effect of the single channel pass and whole serpentine geometry models
on discharge voltage at different operating conditions. (a) Discharge voltage of
cell 1 at current densities (40 mA/cm2 (left) and 93 mA/cm2 (right)) and
volumetric flow rates (5 ml/min (left) and 150 ml/min (right)), and (b) Discharge
voltage of cell 3 at current densities (40 mA/cm2 (left) and 93 mA/cm2 (right))
and volumetric flow rates (5 ml/min (left) and 150 ml/min (right)). .......................... 47
Figure 4.2. Effect of the electrolyte volumetric flow rate and current density on
discharge voltage: (a) Current density 40 mA/cm2, (b) Current density 93 mA/cm2,
(c) Volumetric flow rate 150 ml/min, (d) Volumetric flow rate 5 ml/min. ................ 49

xiii
Figure 4.3. Cell voltage during discharge at different volumetric flow rates and current
densities: (a) Inlet flow rate at 5 ml/min and current density of 40 mA/cm2, (b) Inlet
flow rate at 150 ml/min and current density of 40 mA/cm2, (c) Inlet flow rate at 5
ml/min and current density of 93 mA/cm2, (d) Inlet flow rate at 150 ml/min and
current density of 93 mA/cm2, (e) Range of flow rates and current density of 40
mA/cm2 at a SOC =0.95. ............................................................................................ 50
Figure 4.4. (a) Pressure distribution at 150 ml/min of the three cell configurations, (b)
Pressure drop as a function of inlet flow rate. ............................................................ 52
Figure 4.5. Ratio of amount of penetrated electrolyte to the porous electrodes of the
three cells. ................................................................................................................... 54
Figure 4.6. Energy, battery efficiency, and pumping power at a current density of 40
mA/cm2. (a) Energy efficiency, (b) Battery efficiency, (c) Pumping power, (d)
Battery efficiency at a range in SOCs. ........................................................................ 56
Figure 4.7. Current density effect on: (a) Battery efficiency, (b) Cathode over-potential
at different flow rates………………………………………………………………...57
Figure 4.8. (a) Cell voltage comparison for 2D transient and steady state models at a
volumetric flow rate of 35 ml/min and current density of 40 mA/cm2, (b) Mesh-
independence of the overall cell voltage at different SOCs, (c) Comparison of
simulated and experimental values of the overall cell voltage at a current density
of 40 mA/cm2. ............................................................................................................. 59
PAPER II
Figure 1.1. A schematic diagram of a traditional VRFB. (1) End plates, (2) Insulators
(3) Current collectors, (4) Graphite flow field, (5) Gaskets, (6) Cathode and anode
electrodes, (7) Membrane, (8) load/power supply, (9) Electrolyte tanks,
(10) Pumps. ................................................................................................................. 82
Figure 2.1. Geometrical details of the two single VRFB cells (a) TD cell
at 50×50 mm2 electrode area, (b) ND cell at 80×80 mm2 electrode area, (c) Cells
assembly: ND (left), TD (right). ................................................................................. 88
Figure 3.1. Actual comparison between the graphite and PVC plates (a) Soaked PVC
plate in distilled water, (b) Soaked graphite plate in distilled water, (c) Leakage
from the graphite sides, (d) Leakage from the graphite back. .................................... 90

xiv
Figure 3.2. Charge/discharge cyclic curves of VRFB. (a) TD cell, (b) ND cell. ............. 93
Figure 3.3. Columbic and energy efficiencies for charge/discharge cycles for both
designs......................................................................................................................... 94
Figure 3.4. The relative discharge capacity of the VRFB ND and TD cells. .................. 96
Figure 3.5. The new cell performance at different currents (a) Single cycle test,
(b) Cell efficiencies CE, VE, and EE. ......................................................................... 97
Figure 3.6. Discharge polarization curves of the two designs at 25 ml/min flow rate,
(a) Battery discharge voltage, (b) Battery output power. ............................................ 99
Figure 3.7. Discharge polarization curves of the ND at a range of electrolyte feed
rates (a) Battery discharge voltage, (b) Battery output power. ................................. 100
Figure 3.8. Comparison of the impedance and voltage efficiency of the ND and TD
cells (a) EIS measurements, (b) Voltage efficiency vs. cycle numbers. ................... 102
Figure 3.9. The long PVC cell design (a) The new LC configuration and
components, (b) The polarization potential (left) and corresponding power
density (right) measurements of LC and ND cells, (c) The impedance analysis
data of LC and ND cells............................................................................................ 104
PAPER III
Figure 1.1. Schematic diagram of VRFB. ....................................................................... 115
Figure 1.2. Schematic diagrams of the proposed distributed and traditional flow
cells. (a) Tubular cell, (b) Half PVC planar cell, (c) Half traditional cell. .............. 118
Figure 2.1. A 2D front-view drawing of the active area of two cells (left: tubular cell,
right: planar cell). ...................................................................................................... 119
Figure 3.1. The assembled cells with their experimental units. (a) TC cell, (b) LC
cell, (c) TD cell. ........................................................................................................ 124
Figure 4.1. Charge/discharge curves over four cycles (a) TC cell, (b) LC cell, and
(c) TD cell. ................................................................................................................ 127
xv
Figure 4.2. Charge/discharge average efficiency over four cycles for LC, TC,
and TD cells………...……………………………………………………………...129
Figure 4.3. Typical single charge/discharge curves as a function of the current for
VRFB cells. (a)TC, (b) LC. ...................................................................................... 130
Figure 4.4. Measured polarization curves. (a) Potential polarization (left) and
corresponding power (right) for the TC, LC, and TD cells at 1 ml/min flow rate,
(b) Same of (a) but for cell TC at a range of flow rates, and (c) Same of (a) but
for cell LC only. ........................................................................................................ 132
Figure 4.5. Impedance measurements comparison of the TC, LC, and TD cells. .......... 134

xvi
LIST OF TABLES
Page
SECTION
Table 1.1. Characteristic of flow batteries compared to other storage systems. ............... 12
Table 1.2. Comparison of flow batteries based on current status. .................................... 14
PAPER I
Table 3.1. Flow field dimensions of the three cells for VRFB models. ........................... 41
Table 3.2. Properties of membrane [49]. .......................................................................... 44
Table 4.1 Optimal flow rate and corresponding maximum battery efficiency ................. 57
PAPER II
Table 3.1. Charge/Discharge test conditions. ................................................................... 97
Table 3.2. Non-similar components cost comparison. .................................................... 106
PAPER III
Table 4.1. Efficiencies of the single TC and LC VRFB cells. ........................................ 130
SECTION
Table 2.1 Energy Storage Systems. ................................................................................ 140
SECTION
1. INTRODUCTION
1.1. NEED FOR ENERGY STORAGE
As the global economy expands into new developing markets such as China and
India, the consumption of electricity increases exponentially. Currently, the majority of
electrical output is generated from the burning of fossil fuels such as coal, oil, and gas
[1]. There is a limited amount of fossil fuels on earth and with the ever-increasing
demand for energy, eventually the supply will be diminished. In addition to the limited
supply, there are a lot of negative aspects of burning fossil fuels for energy in terms of
environmental damage. The burning of fossil fuels produces CO2 and other greenhouse
gasses that cause global warming. In order to combat global warming, many countries
have begun phasing out energy production based on fossil fuels in order to reduce the
amount of greenhouse gasses produced. This has presented researchers with an
opportunity to develop new “clean” electrical energy producing technologies to replace
current technology based on fossil fuels [2].
Among these clean and renewable energy sources utilized increasingly in recent
years are wind, sun, wave, and tides. While the energy production of renewable energy
sources is still quite low (less than 1% of total energy consumption), the growth rate is
approximately 30% annually [3]. This means that the renewable sources could produce a
highly significant percentage of global energy output in the not-so-distant future. One
slight downfall of these sources is the dependence on variable factors such as weather and
sunlight. These dependencies produce strong intermittency in power production, which
2
introduces the grid to a highly variable and disruptive electrical feed that causes
frequency and voltage instabilities.
The base load, which is the nearly constant amount of power drawn by consumers
in non-peak times, is typically produced by coal and nuclear power plants. The additional
power required during peak times is produced by power plants that have an easily
variable output. A European law designed to encourage renewable energy sources gives
grid priority to clean and renewable energy sources, especially if the marginal cost is zero
like in the case of the wind and photovoltaic sources [4]. These power sources also have a
much smaller output variation time-scale in comparison to traditional power plants,
which may have to be completely powered off to adequately adjust output after a large
variation in power. In the scenario where base load power plants cannot be turned down,
the companies would have to pay grid managers to store the additional power, which
would greatly change the current business model. Distributed power generation such as
the use of photovoltaic cells on commercial buildings can cause significant problems due
to the existing power grid not being designed for distributed sources. The current power
grids can become unstable if distributed power sources produce more than 20% of the
total power output without technology to compensate [5].
Due to an increase in the presence of distributed and renewable power sources
alongside large power plants, the power grid needs to be redesigned in order to allow for
better control and more accurate management. Electrical energy storage systems (EESS)
are an effective solution that allow excess power to be stored and used when the demand
is greater than the output capabilities of active generators. EESS provide energy services
such as power quality where EESS have short time-scale in a range of minutes or

3
seconds. A second energy service is energy management, where EESS contribute to load
leveling, power balancing, and peak shaving. An advantage of EESS in both power
quality and energy management is the possibility to delay the usage of generated
electricity. The appropriate technology of EESS is chosen based on the available power
and time of operation. The time scale ranges from less than a second to several hours,
with the fastest EESS having a response time of one millisecond and available power on
the scale of a kilowatt to gigawatt [5].
1.2. ENERGY STORAGE METHODS
Energy storage requires energy conversion such as potential to kinetic, kinetic to
electric, or chemical to electric. The usage of energy generally fluctuates with time, so
energy storage is required to increase security and efficiency, especially in applications
where there is no access to a constant supply of energy (electric cars, portable devices).
Energy storage methods are listed below.
1.2.1. Pumped Hydroelectric Power. Pumped hydroelectric energy storage
uses the gravitational energy of water to store energy, where excess energy (during times
of low energy demand, or excess energy from distributed sources) is used to pump water
from a lower reservoir to an upper reservoir. A schematic of this process is shown in
Figure 1.1. At times of high energy demand, water is allowed to flow from the upper
reservoir through a turbine to the lower reservoir, which generates electricity. These
pumped hydroelectric energy systems have low operating costs with little maintenance
and can store and reliably supply large amounts of energy with trip efficiencies up to
80% [6]. The energy stored in water is given by Eq. (1):

4
(1)
where is the mass of water, is the gravitational acceleration, and is the average
height.
Figure 1.1. Hydroelectric power system during day and night times [7].
1.2.2. Compressed Air. In compressed air storage facilities, excess energy is
used to drive a compressor in order to store energy in the compressed gasses. When the
energy is needed, the compressed gasses are released through a turbine, which generates
electricity. A schematic of this process is shown in Figure 1.2. This energy storage
method has low energy density compared to batteries, which makes it not ideal for small
applications such as vehicles [8], but it can be easily used in large-scale energy storage
systems similar to pumped hydroelectric systems.

5
The energy stored in compressed air (in kJ/m3) is approximated by Eq. (2):
(2)
where and are the pressures of gas, 𝐸 is the energy, and is the volume.
Figure 1.2. Schematic of a compress air storage system [7].
1.2.3. Flywheels. A flywheel is a rotating mechanical system used to store
energy in the form of rotational kinetic energy. Excess energy is used to drive a motor
that applies torque to the flywheel, causing it to accelerate and store more kinetic energy.
Energy can then be released in the form of mechanical energy by allowing the flywheel
to apply torque and drive a shaft. A flywheel energy storage system is shown in Figure
1.3. Flywheels are used to supply energy to a system between loading cycles of a
discontinuous source. Flywheels can also be used in vehicles to store braking energy to
be used at a later time. Flywheels can be compact and used in conjunction with other
flywheels to store more energy, and they have a high efficiency of 80–90% [8].

6
The energy storage in a flywheel system depends on the geometry, mass, and
rotational frequency of the device. The energy stored in flywheels can be calculated with
Eq. (3):
(3)
where is the angular velocity and 𝐼 is the moment of inertia, which depends on
the geometry and mass of the device.
Figure 1.3. Flywheel energy storage system [9].
1.2.4. Superconducting Magnetic Energy Storage (SMES). These systems
inject currents into superconducting coils where the current loops indefinitely and creates
a magnetic field in which energy is stored. Energy can be released by discharging the
coil, which happens in a very short amount of time. Due to technological limitations, this
method is not viable for large-scale application, though it has a high energy efficiency of
95% [8]. A basic SMES system is depicted in Figure 1.4. Superconducting magnets have

7
a critical temperature at which the electrical resistivity is zero. High-temperature
superconducting materials are popular because they do not require such a low
temperature to obtain zero resistivity, which allows for the use of less advanced
equipment. SMES provide direct current (DC), so conversion is required in applications
that require alternative current (AC).
Figure 1.4. Basic structure of SMES device [10].
The energy stored in a coil is given by the following equation:
(4)
where 𝐿 is the inductance of the coil (which depends on the coil dimension, number of
turns of wire, and material) and 𝐼 is the current.
1.2.5. Batteries. Batteries are devices that convert stored chemical energy
into electrical energy and contain one or more cell, each having three components: anode,
cathode, and electrolyte. They can be rechargeable or non-rechargeable, where non-

8
rechargeable batteries are suitable for devices that draw little power, such as watches and
flashlights. Rechargeable batteries are suitable for mobile systems that draw large
amounts of power, such as electric vehicles and laptop computers [8]. The capacity of a
battery depends on its chemistry and dimensions. Batteries have a very high energy cost
compared to a typical power outlet, where one kWh delivered by non-rechargeable AAA
batteries costs $900, which is 8000 times the cost of energy from the outlet. The main
advantage of batteries is that they have high energy densities that enable the mobility of
significant amounts of energy that can be used to power mobile devices such as cell
phones and cameras [8]. Figure 1.5 shows multiple batteries for size comparison.
Figure 1.5. A side by side comparisons of several batteries [11].

9
1.3. ELECTROCHEMICAL ENERGY STORAGE
Electrochemistry is frequently used for energy storage, especially in mobile
applications. Batteries, the most common form of electrochemical energy storage,
generally fall into two main categories: primary batteries that produce electrical energy
through an irreversible chemical reaction that make them non-rechargeable, and
secondary batteries that utilize a reversible chemical reaction, allowing them to be
recharged. Batteries can abruptly adjust to changes in power demand and typically have
low standby losses and high energy efficiency, especially advanced batteries designed for
a specific application. The majority of batteries use toxic chemicals in their
electrochemical reactions, so special precautions must be taken regarding their disposal in
order to prevent environmental pollution and other adverse effects.
1.3.1. Lead–Acid Batteries. Lead–acid batteries, first invented by Gaston
Plantè in 1859, are one of the oldest battery technologies and the first known batteries
capable of being recharged. Plantè’s battery consisted of alternating layers of lead metal
and lead oxide electrodes placed a sulfuric acid electrolyte solution. Since neither lead
nor sulfur is particularly expensive, the lead–acid battery is a relatively inexpensive
energy storage solution capable of high power quality and UPS [12]. Lead–acid batteries
are unable to withstand deep discharges and have short cycle lives, which limits
application.
1.3.2. Sodium Sulfur Batteries. Sodium sulfur batteries are still a relevant
research topic even though they were first developed in the 1970s. The main advantage of
sodium sulfur batteries is that the materials are much less expensive than those used in
lithium-ion batteries, and they still have fairly high energy density [13]. These batteries

10
use liquid sodium and liquid sulfur for the anode and cathode, which require an operating
temperature of 300⁰C. These high operating temperatures cause the battery to be fairly
impractical.
1.3.3. Lithium-Ion Batteries. Lithium-ion batteries are popular in applications
that require high levels of battery performance, such as electric vehicles and mobile
electronics. Lithium-ion batteries have extremely high energy densities that allow them to
be much smaller than batteries made of other materials for the same storing amount of
energy. This is due to lithium, which is the lightest metallic material that has very high
electrochemical potential allowing for cells with specific energies ranging from 100-150
Wh/kg [14]. The main limitation of lithium-ion batteries is that the materials are very
expensive, leading to a high cost per kWh and making large-scale lithium-ion storage
systems not cost-effective.
1.3.4. Redox Flow Batteries. Redox flow batteries (RFBs) have recently been
the topic of extensive research and have very promising prospects for stationary energy
storage. This system utilizes redox reactions of fluid electrolytes to provide and store
electrochemical energy. The fluid electrolytes are stored in an external tank that allows
for large-scale systems and easy expansion. RFB technology is further described in the
following section [15].

11
1.4. FLOW BATTERIES
Flow batteries, as previously mentioned, are currently a popular topic in battery
research area, which are relatively new technology. Flow batteries are a very promising
solution to large-scale energy storage such as backup power systems and excess energy
storage from the power grid due to the electrolyte storage tanks being easily expanded
[15]. The battery’s charging and discharging is driven by redox reactions between the
electrolyte solutions, where the properties of the two solutions and the size of the storage
tanks determine energy capacity. The size of the electrodes determines the power
capacity of the battery. The electrolyte solutions are pumped from the storage tanks
through cell stacks where the redox reactions store or release electrochemical energy. The
electrolyte solutions are also pumped through heat exchangers to maintain the optimal
operating temperature of the device. A schematic of a flow battery can be found in Figure
1.6.
Figure 1.6. Schematic diagram of flow battery.

12
Table 1.1 shows a comparison of the flow battery and other energy storage
systems in terms of parameters such as typical power and duration of discharge [16]. It
can be seen that flow batteries are suitable for both medium and large-scale operations
with a typical power range of 100 kW–10MW and an energy capacity of up to 100 MWh.
1.4.1. Advantages and Disadvantages. Like all methods of energy
storage, flow batteries have advantages and disadvantages, though the benefits greatly
outweigh the drawbacks. These advantages and disadvantages are listed below [17].
Table 1.1. Characteristic of flow batteries compared to other storage systems.
Battery type Typical
Power
Typical
Energy
Typical
duration
discharge
Maturity
Batteries (lead-
acid, NiCd,
NiMH, Li-ion)
1–500 kW MWh–100
MWh 1 h–8 h Mature
Flywheels 500 kW–1
MW
100 kWh–
100 MWh < 5 minutes Mature
Pumped hydro 100–4000
MW
500 MW–15
GWh 4–12 h Mature
CAES 25–3000
MW
200 MWh–
10 GWh 1–20 hours
Developed, the
first generation
demonstrated
NaS 1 MW 1 MWh 1 hour
Developed,
commercially
available
SMES 10 kW–10
MW 1–30 minutes
Developed, not
commercial yet
Supercapacitors < 250 kW 10 kWh–1
MWh < 1 minute Developed
Flow batteries 100 kW–10
MW 1–100 MWh 10 hours
Developed, stage
of demonstration
projects
Hydrogen
storage 10 MW unlimited > 5 hours Developing
13
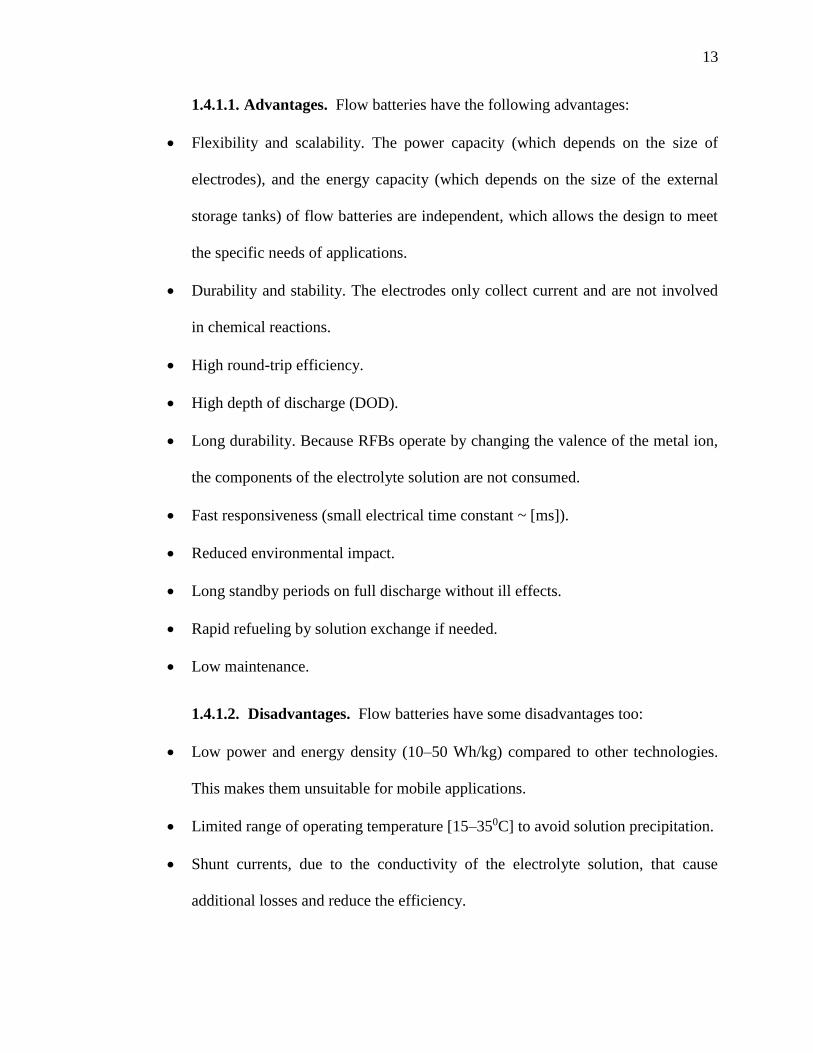
1.4.1.1. Advantages. Flow batteries have the following advantages:
Flexibility and scalability. The power capacity (which depends on the size of
electrodes), and the energy capacity (which depends on the size of the external
storage tanks) of flow batteries are independent, which allows the design to meet
the specific needs of applications.
Durability and stability. The electrodes only collect current and are not involved
in chemical reactions.
High round-trip efficiency.
High depth of discharge (DOD).
Long durability. Because RFBs operate by changing the valence of the metal ion,
the components of the electrolyte solution are not consumed.
Fast responsiveness (small electrical time constant ~ [ms]).
Reduced environmental impact.
Long standby periods on full discharge without ill effects.
Rapid refueling by solution exchange if needed.
Low maintenance.
1.4.1.2. Disadvantages. Flow batteries have some disadvantages too:
Low power and energy density (10–50 Wh/kg) compared to other technologies.
This makes them unsuitable for mobile applications.
Limited range of operating temperature [15–350C] to avoid solution precipitation.
Shunt currents, due to the conductivity of the electrolyte solution, that cause
additional losses and reduce the efficiency.
14
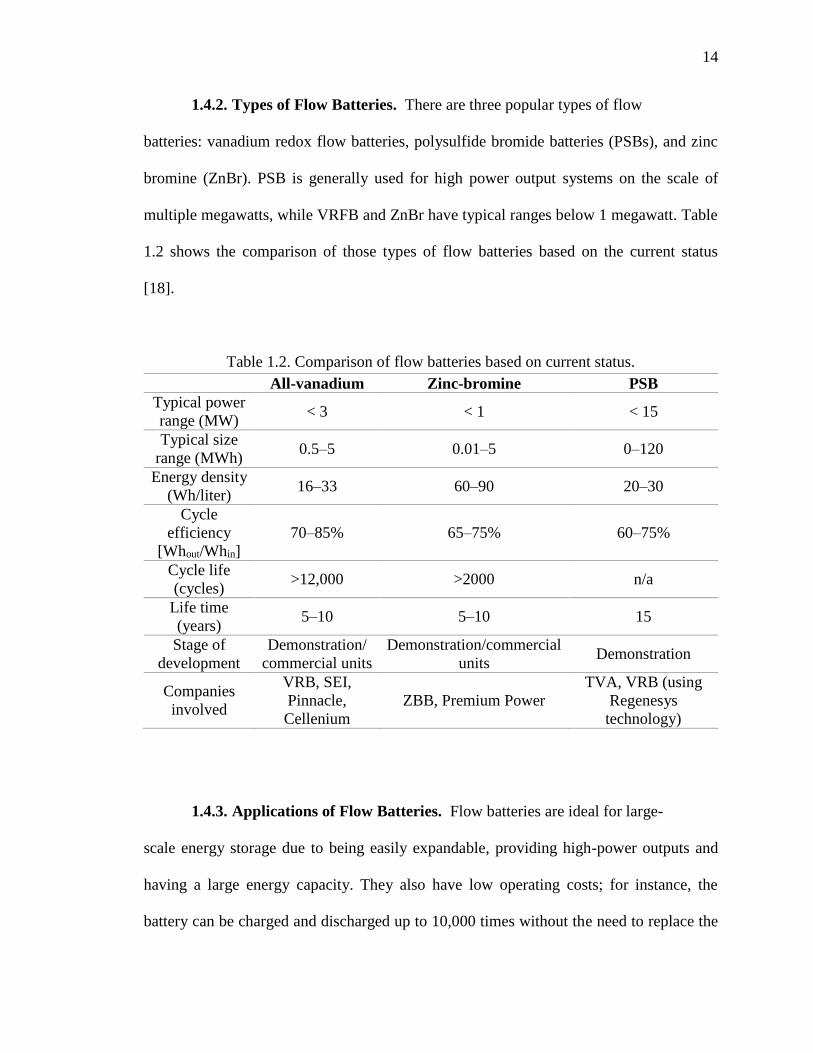
1.4.2. Types of Flow Batteries. There are three popular types of flow
batteries: vanadium redox flow batteries, polysulfide bromide batteries (PSBs), and zinc
bromine (ZnBr). PSB is generally used for high power output systems on the scale of
multiple megawatts, while VRFB and ZnBr have typical ranges below 1 megawatt. Table
1.2 shows the comparison of those types of flow batteries based on the current status
[18].
Table 1.2. Comparison of flow batteries based on current status.
All-vanadium Zinc-bromine PSB
Typical power
range (MW) < 3 < 1 < 15
Typical size
range (MWh) 0.5–5 0.01–5 0–120
Energy density
(Wh/liter) 16–33 60–90 20–30
Cycle
efficiency
[Whout/Whin]
70–85% 65–75% 60–75%
Cycle life
(cycles) >12,000 >2000 n/a
Life time
(years) 5–10 5–10 15
Stage of
development
Demonstration/
commercial units
Demonstration/commercial
units Demonstration
Companies
involved
VRB, SEI,
Pinnacle,
Cellenium
ZBB, Premium Power
TVA, VRB (using
Regenesys
technology)
1.4.3. Applications of Flow Batteries. Flow batteries are ideal for large-
scale energy storage due to being easily expandable, providing high-power outputs and
having a large energy capacity. They also have low operating costs; for instance, the
battery can be charged and discharged up to 10,000 times without the need to replace the
15
separation membrane, and the electrodes should never need to be replaced [19]. They are
also capable of being rapidly charged, which makes them suitable for applications such as
load balancing, storing renewable energy, and peak saving.
Load balancing is the storage of excess energy from the power grid and
distributed power generators, which is then released at times of high demand, increasing
the reliability of the electrical distribution system [5]. Distributed energy generators such
as the wind and solar energy systems have dependencies on variable sources such as the
sun or weather, which leads to fluctuations in energy output. Therefore, energy storage is
required to supply continuous power. Peak saving is also an application of flow batteries,
which is the process of storing energy during non-peak times in order to avoid the higher
costs during peak times. Another potential application of flow batteries is the powering of
electric vehicles, where flow batteries have an interesting advantage over other battery
systems. Flow batteries can be instantly “recharged” by replacing the depleted electrolyte
solution with charged solution, which can be compared to filling the gas tank in a
combustion-powered vehicle. Flow batteries also may have lower operating costs per
kilometer than lithium-ion [20].
1.5. FUNDAMENTAL PRINCIPLES OF VRFB
A simple schematic of a VRFB system during the charge and discharge processes
is shown in Figure 1.6. In both charge/discharge processes, the VO2+/VO2+ couple is
defined as positive, whereas the V2+/V3+ couple is defined as negative for convenient
explanation in the following sections. The reactions of VRFB systems at the anode and
cathode are shown below in Eqs. (5) and (6) respectively. Nitrogen gas is generally
circulated through the negative storage loop to prevent V2+ from reacting with oxygen. In

16
an ideal system, there is no consumption of the electrolyte solutions during the
charge/discharge cycle, though in reality complicated side reactions occur and change the
composition of the electrolyte solutions to an extent. Eqs. (7) and (8) show side reactions
of H2 and O2 produced from water molecules [21].
(5)
(6)
(7)
(8)
During the charging process, H+ ions are transported from the positive half-cell to
the negative half-cell through a hydrogen permeable membrane that separates the positive
and negative half-cells, while electrons are externally supplied through a connection to an
electrical power source. During the discharging process, H+ ions pass back through the
permeable membrane to the positive half-cell. The hydrogen permeable membrane is
composed of a polymeric film that is not electrically conductive. Therefore, the electrons
involved in the redox reaction must travel through the bipolar plate and through the
external load to get to the cathode. The electrolyte solution is pumped through the
positive and negative half-cells from storage tanks in order to provide fresh ions to drive
the redox reaction until the desired state of charge is reached.

17
Energy is carried by the electrolyte solution in the form of dissolved vanadium
redox couples, meaning that the stability and concentration of vanadium ions in the
sulfuric acid solution greatly impact the performance of VRFBs. All VRFBs employ
VO2+/VO2+ (V4+/V5+) as the positive electrolyte and V2+/V3+ as the negative electrolyte.
The supporting electrolytes are generally 1–2 M vanadium ion solutions using 2–5 M
sulfuric acid as a solvent [22], where the sulfuric acid increases vanadium solubility and
enhances conductivity. It is possible to increase the energy density of VRFBs by
increasing the concentration of vanadium, though concentrations above 2 M present
issues with vanadium precipitation [23]. The supersaturation of the solution can cause
V2+/V3+ and V4+ solutions to precipitate at low temperatures and V5+ solutions will
precipitate at elevated temperatures. Therefore, methods must be developed to stabilize
highly concentrated vanadium solutions in order to prevent precipitation and increase
energy density [23].
The most common materials used in the hydrogen permeable separator
membranes are Nafion® 115 and 117. The membranes have an approximate dry
thickness of 51 to 183 microns [24] and, ideally, prevent the transfer of electrons and
cross-contamination of water molecules and vanadium ions. However, during the
charging and discharging processes, some water molecules and vanadium ions are able to
pass through the membrane and change the concentration of the electrolyte solutions,
causing the battery to be less efficient. Researchers have attempted to reduce cross-
contamination by modifying the polymer film with SiO2, which was successful in
reducing cross-contamination and also significantly increased the self-discharge time
[25].

18
The electrode material generally used in VRFBs is porous carbon or graphite due
to it being electrically conductive and resistant to chemical and electrochemical corrosion
[26-29]. The porous structure increases surface area relative to a solid structure, which
helps promote vanadium redox reactions and improves mass transport capabilities by
allowing internal space for electrolyte convection. Polyacrylonitrile (PAN) based graphite
or carbon felt is typically used as the electrode material in VRFBs due to their wide
operation potential range, their stability as both an anode and a cathode, and their high
surface areas at relatively low costs [30]. Thermal treatments and the addition of a
catalyst have both been shown to enhance the kinetic reversibility of the graphite felt
electrode, which reduces activation loss [31]. The addition of Na2Sx catalyst coatings on
the graphite felt electrodes has shown to increase the energy efficiency of the sodium
polysulfide/ bromine flow battery (PSB) by approximately 20% compared to uncoated
electrodes. Though the kinetics of the reactions inside the VRFB are different than those
used by the PSB, the coated electrode will likely also have positive effects in the VRFB
[32].
Each half-cell of the flow frame consists of a carbon felt electrode backed by a
graphite bipolar plate. The graphite bipolar plate in a cell stack acts as a current collector
and connects the electrodes to an external circuit in order to provide power. It is
important for the bipolar plate to be impermeable to both the electrolyte solutions and air
in order to prevent electrolytes from escaping the system and air penetration. It is also
important for the current collector to be resistant to electrolyte corrosion in order to
increase the life of the battery and also its reliability. In the flow-by cell architecture,
flow channels are engraved in the face of the current collector. This allows for the

19
electrolyte solution to be more easily distributed throughout the electrodes, but also
presents issues in the form of mechanical stability. Because the engraved structures cause
stress concentrations and graphite is relatively delicate, the plates must be designed in a
way that can withstand the pressure and frictional forces exerted by the flowing
electrolyte solution [28, 29]. When designing the electrolyte storage and transport system,
certain design considerations must be taken into account; otherwise, the performance of
the battery will be greatly affected. In order to prevent atmospheric oxygen from
interfering with the redox reactions that drive the battery, the electrolyte solutions must
be contained in a sealed and oxygen-free environment. This is especially important for
the negative electrolyte solution due to it containing V2+, which is especially sensitive to
air oxidization. Nitrogen gas is used to purge the system and establish an inert
atmosphere inside the system to prevent unwanted oxidization, which causes capacity
loss. The electrolyte solutions use 2–5 M sulfuric acid as a solvent; therefore, the
components that come into contact with the solution must be chemically stable. This is an
important factor in increasing the life of the battery, where components such as the
storage tanks, transport tubing, and pumps must be able to properly contain the
electrolyte as well as not contaminate it. Several polymeric materials meet these stability
requirements such as polypropylene (PP) and polytetrafluoroethylene (PTFE). During
charging and discharging the electrolyte solutions are continuously pumped through
loops connecting the storage tanks to the cell stack; therefore, an optimal flow rate must
be used in order to balance battery performance and pump pressure loss [28].
20
1.5.1. Electrochemistry. Vanadium redox flow batteries are driven by
redox (reduction-oxidation) reactions. These reactions involve the four oxidation states of
vanadium Eqs. (5) and (6), where the species that loses an electron is said to be oxidized
and the species that gains an electron is reduced. An oxidizing agent (also called an
oxidant) is a species that takes electrons from another substance in order to become
reduced [5].
(9)
A reducing agent (or reductant) gives electrons to other substances and is oxidized
in the process.
(10)
A battery is a device that converts chemical energy into electrical energy and vice
versa through utilization reactions. Therefore, it is possible to write the formulas of the
two simultaneous chemical reactions occurring during the charging and discharging
processes of the VRFB. During the discharge, the electrons move from the anolyte to the
catholyte by flowing through the external load, as follows:
(11)
During the discharge, takes an electron from , while during the charge,
the reversed flow of electrons gives the following redox reaction:

21
(12)
Previous equations are simplified versions of the reactions that actually occur in
the VRFB, where and exist as oxides. The redox equation must therefore be
modified to guarantee the balancing of charges, stoichiometry, and the dissociation of
H2O, as shown in Eq. (5) and Eq. (6).
1.5.2. Nernst Equation. The individual potential of an electrode with
respect to the standard hydrogen electrode measured at standard conditions, i.e.,
25oC and 100 kPa with a concentration of 1M. The standard thermodynamic open circuit
voltage of the flow VRFB battery cell can be calculated by summing the standard
reduction potentials of the half-cell reactions [5].
For the anode,
(13)
and for the cathode,
(14)
(15)
where the last equation shows the standard potential for the cathode and anode of a
VRFB. The relationship of the electrode potential and the operating conditions is given
by the Nernst equation when the operating conditions are not standard, where the product
ratio of the activity coefficient should be set to 1[5].

22
(16)
The equation above can be obtained by considering the thermodynamics. Cell
potential can be approximated by examining the Gibbs free energy (which represents the
maximum amount of energy that can be obtained from a chemical) in cases where their
concentrations of the different species of vanadium are similar relative to one another.
Typically, the operating range of the battery does not exceed high charge states, meaning
the approximation is acceptable. Therefore, the Nernst equation proves to be a useful
relation between standard potential and non-standard operating conditions, which allows
the equilibrium voltage to be calculated for any operating condition [5].
1.5.3. Current: The Butler–Volmer Equation. The electrode kinetics and
activation overpotential can be understood by starting with some basic principles of
chemistry and ending with a comprehensive equation known as the Butler–Volmer
equation in a way that considers the thermodynamics of the system and the activation
overpotential (a detailed explanation can be found in [5]):
(17)
where [A] is the exchange current, which is the absolute value of the anodic or
cathodic current, and is the charge transfer coefficient. The charge transfer coefficient
is the fraction of interfacial potential that helps lower the activation energy barrier for the
electrochemical reaction at the electrode-electrolyte interface [5].

23
1.5.4. State of Charge. To evaluate the available energy with respect to the
maximum stored energy, it is possible to use the state of charge, which is expressed as a
ratio between the different vanadium species [5]:
(18)
This parameter is equal to zero when the battery is completely discharged, and it
is equal to one when the battery is completely charged. Since the total concentration of
vanadium ( ) is equal to the sum of the concentrations of the vanadium species of each
electrolyte,
(19)
the can be written as
(20)
1.5.5. Cell Voltage and Overpotential. The operating voltage of VRFB cells
is dependent on many variables such as operating temperature, operating current density,
the degree of reactant crossover, electrolyte flow rate, and membrane conductivity. The
performance of any electrochemical device such as VRFB cells is normally characterized
by different diagnostic methods to clarify limiting factors (activation, ohmic, or mass
transport) in device performance, which are include cycling test, polarization curve,
current interruption, and electrochemical impedance spectroscopy measurements [6].
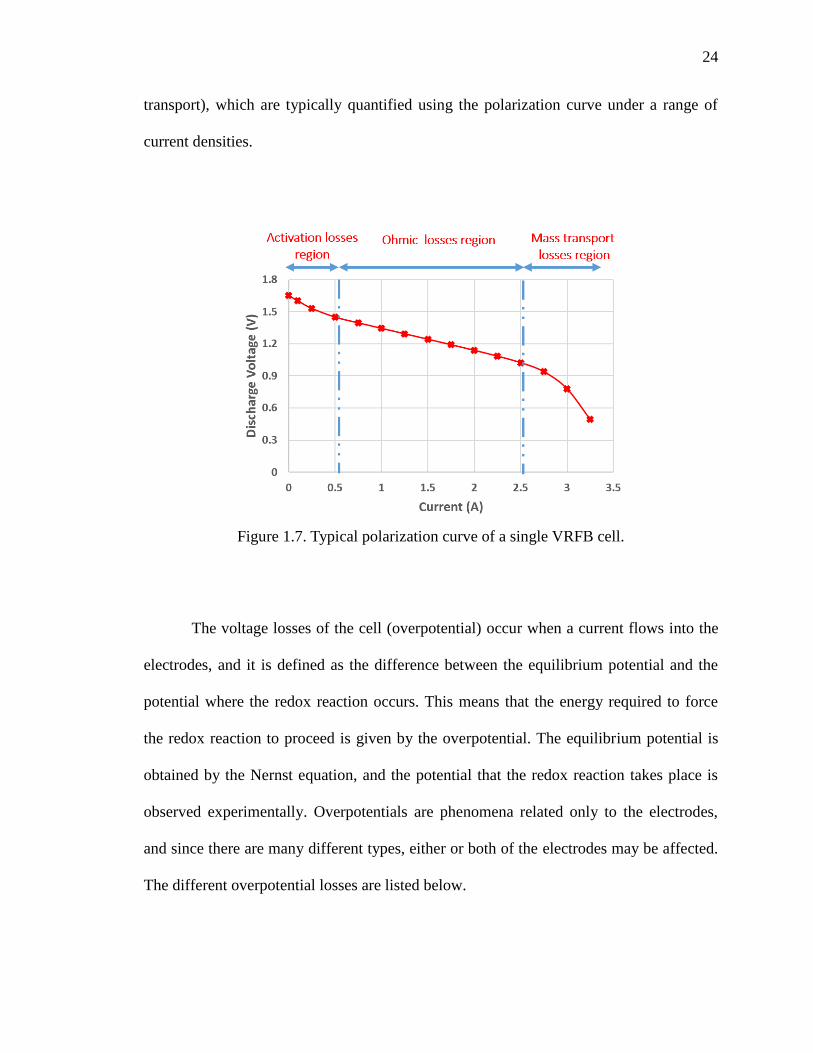
Figure 1.7 shows the main three kinds of loss regions (activation, ohmic, or mass
24
transport), which are typically quantified using the polarization curve under a range of
current densities.
Figure 1.7. Typical polarization curve of a single VRFB cell.
The voltage losses of the cell (overpotential) occur when a current flows into the
electrodes, and it is defined as the difference between the equilibrium potential and the
potential where the redox reaction occurs. This means that the energy required to force
the redox reaction to proceed is given by the overpotential. The equilibrium potential is
obtained by the Nernst equation, and the potential that the redox reaction takes place is
observed experimentally. Overpotentials are phenomena related only to the electrodes,
and since there are many different types, either or both of the electrodes may be affected.
The different overpotential losses are listed below.

25
1.5.5.1. Activation overpotential. Activation overpotential represents the
energy needed to start the transferring of charges. Therefore, an applied overpotential
causes a change in the equilibrium condition, which leads to electrical currents. The
magnitude of this current is limited by the mass transfer of reactants and the rate of
electron transfer between the electrodes and the reactants. The magnitude of the
overpotential depends on the rate of the redox reaction taking place, where a fast reaction
requires lower overpotential than a slow reaction. This overpotential is the energy
required to overcome the activation energy barrier of the redox reaction [5]. Therefore, if
the concentration of reduced and oxidized species is equal, then the activation barrier is
symmetric; however, that is not the case with unequal concentrations. This means that the
activation energy required for the cathode and anode reactions is not equal.
1.5.5.2. Concentration overpotential. Concentration overpotential is related
to the difference in concentration between the solution near the surface of the electrode
and the remaining solution. The electroactive species can have different concentrations
near the surface of the electrodes, which causes concentration overpotential. To maintain
a steady current, the surface of the electrode must be exposed to fresh solution because
this is where the reaction takes place. If the reaction rate is high, the species may not
come into contact with the electrode fast enough to maintain a steady reaction and
therefore a steady current causes an overpotential [5]. There are three mechanisms that
drive the movement of species into the electrolyte solution, and each has specific
characteristics and associated velocities. The mechanisms are diffusion, migration, and
convection [5].
26
1.5.5.3. Ohmic and ionic overpotentials. Other overpotentials, which are
analytically determinable, are the ohmic and the ionic overpotentials.These
overpotentials provide another way to consider the losses caused by the electrical
resistance of the carbon felt electrodes, the bipolar plates, and the carbon collector plates.
Therefore, the ohmic overpotential, can be seen as [5].
where is the sum of the resistances, as described above.
Furthermore, the current flow is hindered by the resistance of the electrolyte itself
and by the resistance of the membrane. To consider this effect, it is possible to refer to an
ionic overpotential , analogously to the ohmic overpotential. The conductivity of the
electrolyte is a function of the number of charges and the mobility of the ions dissolved in
it. This parameter can therefore be written as
where is the Faraday constant, is the charge of the ion , and is
the mobility. Also, depending on the size of the ion and its interactions with the other
components of the electrolyte, it is possible to write the ionic overpotential as

27
where is the length, is the cross section, and is the resistance of
the membrane. Given the operating conditions of the cell or the stack, it is possible to
determine the operating voltage of the stack, , as
where is the number of cells that compose the stack, and refers to the various
overpotentials mentioned above.
1.5.5.4. Other losses of VRFBs. The cross-contamination of vanadium ions
and water molecules can cause side reactions and therefore energy losses during the
VRFBs cell operation [33]. Vanadium crossover through the separator is mainly caused
by the difference in vanadium concentrations in the negative and positive half-cells. Each
species of vanadium ion has a different diffusion coefficient through the membrane.
Vanadium and hydrogen ions drag water molecules through the membrane during
crossover during both charge/discharge and self-discharge cycles. Osmosis is the main
force driving water crossover contamination and is responsible for 75% of the water
molecules transferring through the membrane [33]. During charge/discharge cycles,
additional protons diffuse through the barrier and form an internal electric circuit in the
solution.
Side reactions consume electrolyte and current, which impacts the efficiency of
the flow battery. Two essential side reactions in VRFBs are oxygen and hydrogen
evolutions from water molecules. The hydrogen reaction consumes current from the
cathode, while the oxygen reaction consumes current from the anode during the charging
process [34]. These side reactions form gas bubbles approximately 25–100 μm in

28
diameter on the surfaces of the electrodes, which reduces the effective area of the
electrodes. Complex side reactions take place in the vanadium electrolyte, and these
reactions are complicated due to there being may species of vanadium such as HVO3 and
H2VO4-, which exist in the solutions and will react with water and other vanadium
species [35].
1.6. TECHNICAL SPECIFICATIONS OF VRFB
The technical specifications of VRFBs, including capacity, energy density,
current density, and power density, are presented in the following sections. These
quantities show how the basic performance of the battery is measured.
1.6.1. Capacity. Since VRFB is a secondary battery type that can be
recharged, the total capacity, the charge density of the anolyte/catholyte, and the state of
charge (SOC) are important parameters. The total capacity of an electrolyte to pass
electrons is a function of the electroactive species concentration, vanadium solution (C),
the number of electrons transferred (n), and the volume of vanadium solution in each tank
(V). The capacity of a VRFB can be expressed as
1.6.2. Energy Density. Energy density is dependent on the chemistry of the
battery and is determined by the solubility of active materials in the electrolyte solution.
Energy density has the unit of watt-hour/liter as it is defined as the amount of energy that
can be delivered per unit volume of the cell [36]. It is used to determine the appropriate
size of a storage tank required to achieve a given energy capacity. In applications where
29
the availability of space to store electrolyte is limited, the energy density should be as
high as possible in order to reduce size.
1.6.3. Current Density. Current density is defined as the available current
per surface area of the electrode. The redox chemical reactions take place near the
surfaces of the electrodes; therefore, a steady flow of electrolyte solution allows for more
reactions to occur. This increases the amount of reactions per unit area and thus results in
higher current densities [37].
1.6.4. Power Density. Power density is defined as the maximum amount of
power that can be delivered per unit volume and has the unit of watt/liter or watt/kg.
Power density is dependent on the chemistry of the battery and determines the sizes of
the cell required to meet a specified level of power performance. Increasing the surface
area of a cell’s electrodes can increase the cell’s current at a specified current density and
therefore delivers more power for a given cell chemistry [36].
1.7. MULTIPHYSICS MODELS OF VRFB
In last decade, numerous 2D and 3D VRFB modeling studies have successfully
integrated the electrochemical reactions and the transport phenomena with computational
fluid dynamics (CFD) [5, 21, 34, 38-40]. The electrochemical reactions in a VRFB
involve various transport phenomena, including the dissociation and association of
molecules, ions, and electrons. The VRFB model involves various governing equations,
including flow and electrochemistry physics. Commonly, the set of governing equations
used in VRFB model are mass conservation, momentum conservation, energy
conservation, species conservation, and charge conservation. In this work, a 3D model of

30
VRFB is presented by studying different geometric parameters under various operating
conditions.
1.8. MOTIVATION AND THESIS OBJECTIVE
There is an increasing need for efficient large-scale electrical energy storage
systems to meet the demands of the ever-expanding sources of intermittent renewable
energy such as solar and wind farms. Flow batteries are attractive for load leveling and
stabilization applications for power companies as well as consumers who require
increased capacities, uninterrupted supply, and backup power. VRFBs among other flow
battery systems are currently being extensively researched due to their numerous
desirable factors such as quick response, deep discharge tolerance, long cycle life, high
energy efficiencies of over 80% in large-scale systems, and active thermal management
with ultimate goals of improving the performance and reducing the operational costs to
help their commercialization.
VRFBs lack flow field design parameters and are expensive, heavy, large, and
have less mechanical strength components such as porous flow field graphite plates that
make them unable to be used in mobile and distributed power applications due to
insufficient power. These issues currently prevent economic feasibility despite the many
advantages. This PhD study aims to address these critical challenges through the use of
3D electrochemical models and the design and fabrication of new cell geometries in order
to conduct experiments. The fundamental mechanisms responsible for species transport
will be explored through the 3D electrochemical modeling of a single cell with the
addition of serpentine flow channels. New cell geometries will also be explored through
the use of physical experimentation. The overall objective is to better understand flow

31
battery performance by investigating the impact of channel flow geometry and operating
conditions on flow battery performance at a system level through a 3D numerical model.
Also, new experimental designs will be utilized in order to solve issues such as cost, size,
weight, and limited power, which will increase the commercialization of the VRFB
technology.
The main body of this dissertation is comprised of five chapters.
Chapter 1 summarizes the types of energy storage systems and explains why
energy storage systems are needed. VRFBs are an attractive solution for large-
scale energy storage in terms of both economics and system capabilities. The
fundamental electrochemistry, component materials, and the system design of the
VRFB are also discussed.
Chapter 2 details of the model generation and development of the vanadium flow
battery systems. There are numerous physical and chemical phenomena that must
be taken into consideration due to electrochemical reactions in flow systems, such
as the transport of various species and the association and disassociation of
molecules, ions, and electrons. Generally, the convective mass transport increases
with flow velocity; therefore, VRFB performance should improve as the flow
velocity increases. This can be obtained from changing channel height while
keeping the same inlet flow rate (same pumping power). A 3D multiphysics
single pass model (which is verified with the fully serpentine flow field model at
different ranges of operating conditions, volumetric flow rates, and applied
currents) has been developed in order to investigate the impact of channel height
and load conditions on the overall battery performance. The effect of flow

32
channel thickness on the mass flow penetration into the porous layer is also
discussed.
Chapter 3 introduces a new lab-scale single cell battery design that has serpentine
flow channels at less cost compared to the traditional design. The design has been
fabricated and tested experimentally in our laboratory. The new design is safe
(zero electrolyte permeation), easy to assemble (having far fewer components),
and more compatible in harsh environment (constructed of PVC material as a
flow field plate compared to the brittle and porous graphite flow plate in
traditional designs). Tests such as cycling, polarization with a range of currents
and flow rates, and electrochemical impedance spectroscopy (EIS) have been
conducted in order to compare this design performance with the conventional one,
which is normally based on using graphite flow field.
Chapter 4 develops a new type of distributed flow battery capable of being
installed in transport systems such as electric vehicles or any other type of
transport system that requires a clean power source. These cells have high aspect
ratios and can be looped throughout the transport system in a serpentine
configuration. A membrane within the reaction cell has a length substantially
equal to the length of the reaction cell such that the surface area of the membrane
is maximized relative to the volume of the reaction cell to increase electrical
power provided to an electrical load of the transport system.
Chapter 5 summarizes the major findings of this dissertation study along with a
discussion on the future work.
33
PAPER
I. STUDY ON CHANNEL GEOMETRY OF ALL-VANADIUM REDOX FLOW
BATTERIES
ABSTRACT
Flow field in a vanadium redox flow battery, which is determined by flow rate
and geometry of flow channel, is one of main components that determine performance of
flow battery. Therefore, flow rate and flow channel must be carefully controlled and
designed to provide a smooth supply of electrolyte to the area where the electrochemical
reactions take place. Through a verified three-dimensional electrochemical model
involving fluid motion, we have found that channel height is an important geometric
parameter that determines battery performance. We investigated its impact on pressure
drop and penetration of the electrolyte into the electrode, and then examined how it
ultimately played a role in voltage response, energy efficiency, and battery efficiency. To
find the optimal channel shape, various operating parameters, including flow rate,
current, and state of charge, were investigated at different channel heights. Overall, low-
height cells had better energy and battery efficiency, and could operate relatively low
flow rates, but there was a trade-off between improved flow field and pumping loss
depending on geometry and loading conditions. A judicious balance between them will
be useful for finding optimal design and load conditions for the best performance of flow
batteries.

34
1. INTRODUCTION
Energy storage is envisioned as a key part of a renewable energy solution
incorporated in a grid that overcomes two critical limits of renewable energy:
intermittency and uncertainty [4, 41-43]. Among various technologies, a vanadium redox
flow battery (VRFB) offers a promise because of its unique features that include a long
cycle life, separation of energy and power ratings, and capability of a deep discharge [44-
51]. As evidence, over the last two decades, large numbers of projects concerning VRFBs
have been conducted throughout the world [52-54]. As VRFB system costs continue to
lower, the commercialization and industrialization of VRFBs will continue to accelerate
[55, 56]. Further, battery performance has been continuously improved by introducing
new materials (such as membrane, electrodes, and electrolyte) [57-62] and optimizing the
system (battery/stack structure and operating conditions) [29, 63].
One unique feature of a flow battery is, as the name implies, a mass flow is
involved in performing its function. Accordingly, there has been significant effort
expended to improve the mass transport of electrolytes. In the commonly used flow-
through battery architecture (without a flow field), electrolyte is directly supplied to
electrodes from the lateral side. However, in this case, the in-plane concentration
distribution cannot be uniform, which leads to mass transport polarization in the region
far from the inlet. One simple way to minimize this mass transport polarization is to
increase the flow rate but, unfortunately, this causes a large parasitic pumping loss. This
issue can be addressed by introducing a flow field through a channel between the current
collector and the porous electrode. This flow field can distribute the electrolyte with
reasonable pumping power [64-68]. The importance of this is well introduced in the fuel

35
cell state of the art [69-71] and many types of flow fields have been proposed in the
literature [72-74]. Here, one critical issue in flow field design is to uniformly distribute
the electrolyte on the surface of an electrode to minimize the mass transport polarization.
However, this requires a higher flow rate, thereby requiring higher pumping power,
which reduces the overall efficiency of a flow battery.
There have been several experiments and numerical studies on the VRFB channel.
Most of them, however, focused on comparing different types of channels, including
serpentine, interdigital, parallel, and spiral. A recent study of the effects of three different
flow fields on the performance of VRFB has shown that a serpentine shaped cell offers
the best voltage efficiency, pumping power, and battery efficiency [75]. In [76], the mass
transport effects of various flow field designs paired with raw and laser perforated carbon
paper electrodes in redox flow batteries were investigated. It has been shown that when
coupled with perforated electrodes, performance gains (up to 31%) can be achieved in
field designs such as serpentine, parallel, and spiral. On the other hand, interdigitated
flow fields are adversely affected by the creation of perforations due to the high
permeability ‘channels’ in the electrode. In [77], parallel flow field of a VRFB was
selected to describe the distribution of electrolyte solution numerically and
experimentally. Further, it was shown that an interdigitated flow field configuration has
better performance compared with the serpentine pattern in VRFB systems [78].
Comparing a cell with a serpentine channel to a cell without the flow field through the
polarization test showed that the kinetic and mass transfer losses were not significant
compared to internal resistance losses for the cell with a serpentine flow field [28]. A
number of numerical studies have been conducted by focusing on: improvement of

36
system efficiency [79]; 3D pore scale model [80]; finding the flow distribution in the
channel [81]; impact of single-inlet and multi-inlet flow rate of interdigitated flow field
[38]; and energy and battery efficiency of different cell configurations.
Despite considerable prior research, the remaining important questions are how to
design the cross section of the flow channel itself and how to determine its length.
Apparently, small areas allow more flow to the electrodes at higher flow rates, but also
increased pumping power is required. In addition, long channels can provide more
reaction sites, but pressure losses increase with increasing length. Furthermore, to
maximize battery performance, channel design must be considered simultaneously with
flow rate and electric current, since mass transport must be balanced with electrochemical
reactions.
In order to address this problem, this paper has developed a three-dimension
electrochemical model base on the most detailed models in the literature so far. After
verification of the developed model, first, the channel length effect was studied by
comparing the single channel and the five serpentine channels. After confirming that the
five-channel model and the single-channel model do not significantly differ in battery
response, channel height effects have been focused. Three different channel heights of a
single channel were considered. The effects of different ranges of applied currents, State
of Charge (SOC), and flow rates on pressure drop and penetration of electrolyte into
electrodes, and eventually on battery performance were investigated. Although this has
critical influences on battery performance, there is no evidence that this has been studied
and reported in the literature.

37
2. EXPERIMENTAL SETUP
A schematic diagram of a fabricated VRFB is shown in Figure 2.1a and its
experimental setup is shown in Figure 2.1b. The active area of a cell was 5×5 cm2. In
order to minimize ionic and contact resistances between the membrane and electrode, a
“zero-gap” configuration is used, which means that the membrane, electrodes, and
current collectors are in direct contact. A Nafion 117 (Ion-Power, Inc.) membrane served
as the separator. The electrodes are made of a graphite felt (SGL Technologies GmbH)
with an uncompressed thickness of 6mm and a specific resistance of 0.12 Ohm-cm.
Graphite plates (Fuel cell store), with machined serpentine flow channels, distribute the
electrolyte across the active area of the VRFB, while also serving as the current
collectors. PTFE (polytetrafluoroethylene) gaskets are applied between the adjacent cell
compartments for sealing and the whole assembly is tightly pressed using 12 bolts and
nuts to prevent leakage. The fluid inlets and outlets of the cell are constructed on the side
of 10 mm- thick polymer insulators.
An all-vanadium electrolyte is prepared by dissolution of 1.04 M VOSO4 (99.9%
purity, Alfa Aesar) in a sulfuric acid solution with a total SO42− concentration of 4 M.
Both electrolyte reservoirs initially consisted of a solution containing only V4+ ion. The
positive electrolyte volume is initially 200 mL, twice the negative electrolyte volume.
This electrolyte is then charged until V4+ is converted to V2+ (negative electrode
electrolyte) and V5+ (positive electrode electrolyte), and subsequently, half of the positive
electrolyte solution is removed from its reservoir to make the solution volumes in the
anode and cathode equal. Both positive and negative electrolytes are supplied to the cell
via two diaphragm pumps (SMART Digital DDA7.5-16AR-PVC/V/C, Grundfos,
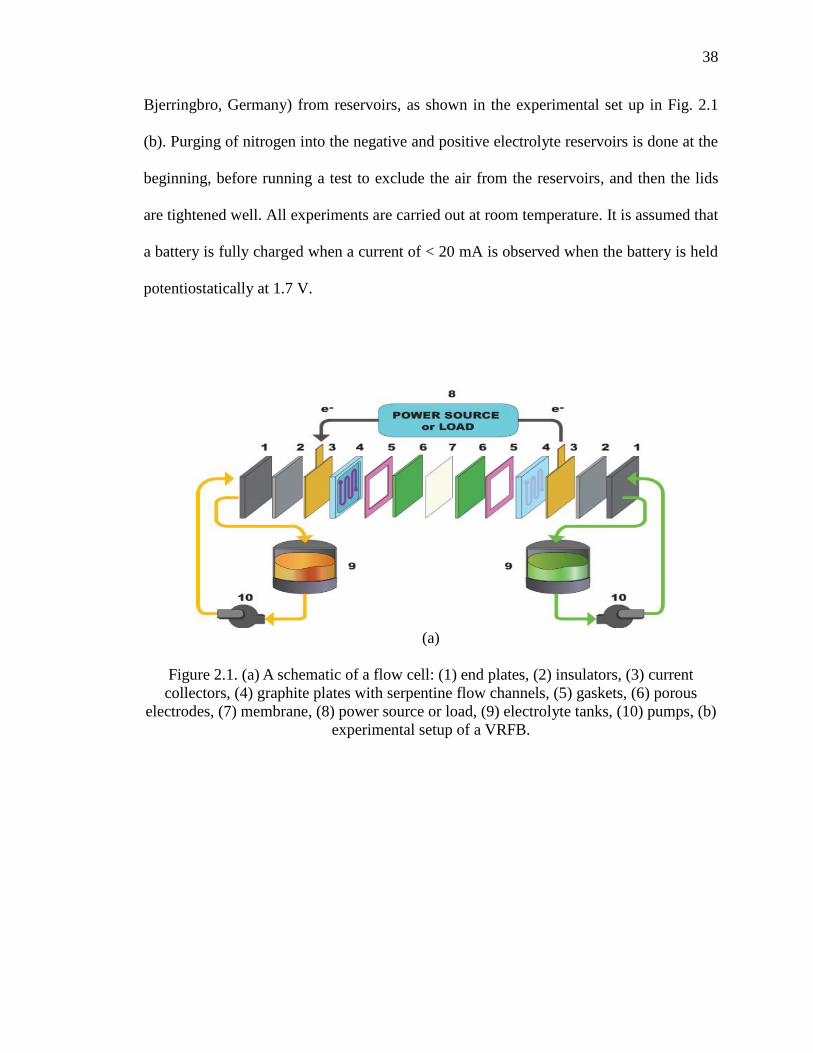
38
Bjerringbro, Germany) from reservoirs, as shown in the experimental set up in Fig. 2.1
(b). Purging of nitrogen into the negative and positive electrolyte reservoirs is done at the
beginning, before running a test to exclude the air from the reservoirs, and then the lids
are tightened well. All experiments are carried out at room temperature. It is assumed that
a battery is fully charged when a current of < 20 mA is observed when the battery is held
potentiostatically at 1.7 V.
(a)
Figure 2.1. (a) A schematic of a flow cell: (1) end plates, (2) insulators, (3) current
collectors, (4) graphite plates with serpentine flow channels, (5) gaskets, (6) porous
electrodes, (7) membrane, (8) power source or load, (9) electrolyte tanks, (10) pumps, (b)
experimental setup of a VRFB.

39
(b)
Figure 2.1. (a) A schematic of a flow cell: (1) end plates, (2) insulators, (3) current
collectors, (4) graphite plates with serpentine flow channels, (5) gaskets, (6) porous
electrodes, (7) membrane, (8) power source or load, (9) electrolyte tanks, (10) pumps, (b)
experimental setup of a VRFB (cont.).
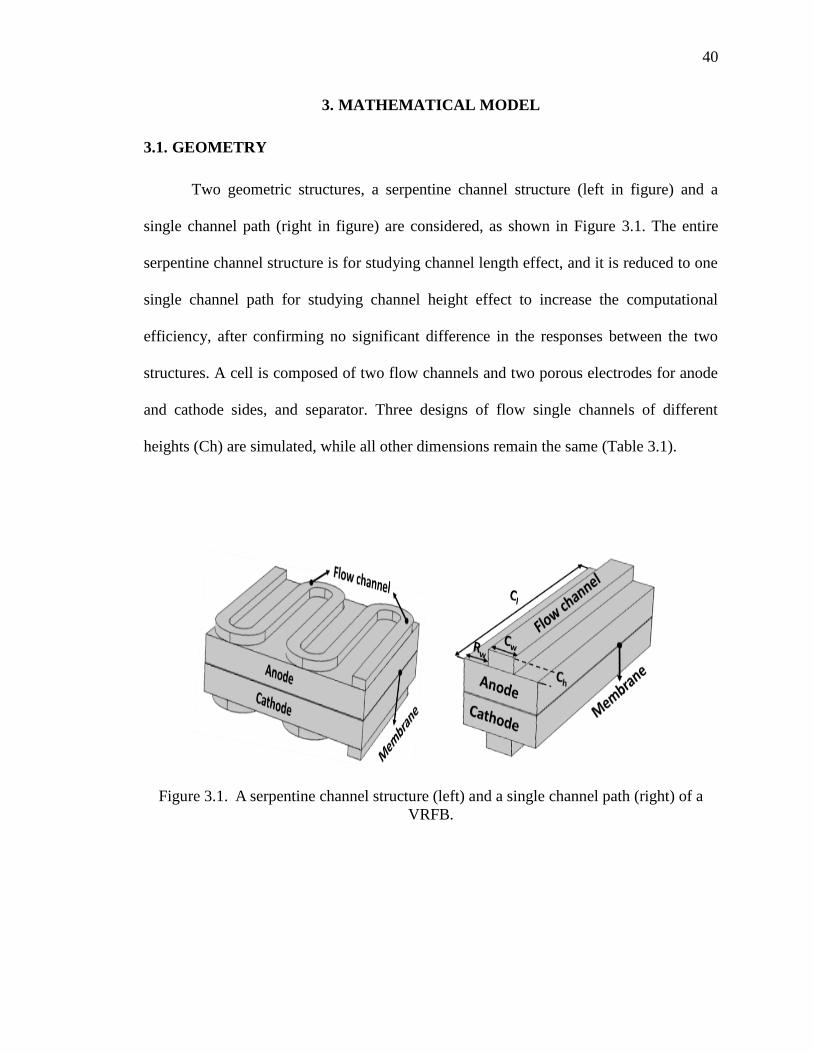
40
3. MATHEMATICAL MODEL
3.1. GEOMETRY
Two geometric structures, a serpentine channel structure (left in figure) and a
single channel path (right in figure) are considered, as shown in Figure 3.1. The entire
serpentine channel structure is for studying channel length effect, and it is reduced to one
single channel path for studying channel height effect to increase the computational
efficiency, after confirming no significant difference in the responses between the two
structures. A cell is composed of two flow channels and two porous electrodes for anode
and cathode sides, and separator. Three designs of flow single channels of different
heights (Ch) are simulated, while all other dimensions remain the same (Table 3.1).
Figure 3.1. A serpentine channel structure (left) and a single channel path (right) of a
VRFB.

41
Table 3.1. Flow field dimensions of the three cells for VRFB models.
Parameters Three different cell designs
Cell 1 Cell 2 Cell 3
Channel height (Ch) 1.19 (mm) 1.59 (mm) 1.98 (mm)
Channel length (Cl) 50.00 (mm) 50.00 (mm) 50.00 (mm)
Channel width (Cw) 4.00 (mm) 4.00 (mm) 4.00 (mm)
Rib width (Rw) 7.50 (mm) 7.50 (mm) 7.50 mm)
3.2. MODEL DEVELOPMENT
Several assumptions are made to simplify the model. First, an incompressible
fluid is assumed for the electrolyte as the volume change is small. A dilute solution, with
liquid water as the dominant species in the electrolyte, is also assumed. The typical
concentrations of vanadium species (~1000 mol/m3) are much lower than water molecule
concentration (~55,000 mol/m3). Also, according to the calculated Reynolds number
(Re) for the given channel dimensions and range of flow rates, Re = 86.7 to 2280, so it is
reasonable to consider a laminar regime flow. This paper focuses on battery performance
with channel structure, not performance degradation, so performance degradation is not
considered. That is, the separator can pass only proton ions (H+) to prevent vanadium
ions from crossing with water, and hydrogen and oxygen generation (side reactions) are
not considered in this model. In addition, if the reservoir is large enough, a transient
process can be treated as a steady state process. This is confirmed by comparing the
transient and steady state calculations in the discussion section.
In order to model the flow field, two adjacent regions, a free flow region of the
channel and a porous flow region of the electrodes must be considered. For laminar flow,

42
the flow inside the channel can be represented by the Navier-Stoke (NS) equation with
the continuity equation. For the porous electrode, the steady state Brinkman equation for
single-phase incompressible flow is used. The details are described in Eqs. (A.1-A.5) in
the appendix.
A battery electrode is a porous medium with interconnected pore networks,
allowing the flow of electrolyte. The electrochemical reactions occur at the interfaces
between the electrolyte and the solid structure. The main reaction in the anode electrode
is:
(1)
In the cathode electrode, the main reaction is
(2)
where and are the standard electrode potentials of anode and cathode
electrodes, respectively. Typically, each electrolyte solution is composed of water,
sulfuric acid (i.e., and ), and charged vanadium species (i.e., , ,
, and ) flowing through the porous graphite electrodes. A steady state mass
conservation for each charged species can be formulated through the Nernst–Planck
equation. Species conservation equation, which is applied in the whole domain including
electrode and channel, can be described as follows [82]:
(3)

43
where is the flux of the charged species (species of i) in the electrolyte (represented by
subscript e), and denotes the source term for the species. All the charged species in the
electrolyte solution can be applied in Eq. (3), except , which is evaluated from the
electroneutrality in the electrolyte solution as follows:
(4)
where is the species concentration and is the valence for the species (i).
The local reaction current density for both electrodes are expressed by using the
Butler-Volmer equations. In literature, many models consider a simple form of Butler-
Volmer question without accounting the effect of species transport between the bulk
solution and the liquid-solid interface [83]. In the current model, the bulk and surface
concentrations are distinguished by considering the mass transport resistance. Details are
given in the appendix (Eqs. A-18~A-24).
The separator is designed to prevent cross-over of other species except proton
ions to avoid reactant mixing. In separators such as Nafion membranes, fixed sulfonic
acid charges are present in local, and remain immobile [84]. Their presence has little
effect on the diffusion of mobile sulfonic acid ions, but has an effect on the electric field.
For this, the fixed sulfonic acid ions can be treated separately from the mobile sulfonic
acid ions. From the electro-neutrality condition, the proton concentration in separators
satisfies [84]:
(5)

44
where is the fixed charge site concentration in the membrane and is the fixed site
charge. The value of is taken as constant in the separator region. Assuming that
protons are the only (or dominant) mobile ions, only ionic current exists, and similar to
the porous electrode, it is proportional to the flux of proton concentration only. All the
parameter values of the separator are listed in Table 3.2.
Table 3.2. Properties of membrane [40].
Flow rate has a considerable effect on the pumping power, battery capacity, and
efficiency. Battery performance is evaluated by comparing energy efficiency and battery
efficiency using various flow rates and current rates. The definitions of energy efficiency,
and battery efficiency, are defined as below [5]:
(6)
(7)
Symbol Description Value and unit Origin
Membrane thickness 183
Provided by
manufacturer
Fixed acid concentration -1 -
Fixed acid charge 1990 [85]
Membrane proton
diffusion coefficient 3.35×10⁻⁹ [86]
Electronic conductivity of
membrane 24.88 (S ) Calculated

45
where E, P are energy and power, the subscripts ‘ch’ and ‘disch’ represent charging and
discharging, respectively. Since input and output power are a function of SOC, efficiency
is compared as a function of SOC and an average value is used for overall evaluation.
, the pumping power to supply the electrolyte into VRFBs, is evaluated through
pressure drop and electrolyte volumetric flow rate as follows [87]:
(8)
where is the number of the utilized pumps, is the provided volumetric flow rate in
ml/min, is the pump efficiency ( , and represents the total pressure drop
through the piping and the battery. Large external pipe sizes are assumed so that
associated pressure losses are negligible. Thus, only the pressure drops in the porous
electrodes are considered.
The governing equations are solved by the COMSOL Multiphysics® package. A
Lagrange-quadratic basis is used for all of the simulations. The relative error tolerance is
set as 1 ×10⁻⁵.
46
4. RESULTS
4.1. EFFECT OF NUMBER OF CHANNELS
First, we compared the two geometries shown in Figure 3.1 to investigate the
effect of channel length on battery voltage response during discharging at different SOCs,
volumetric flow rates, current densities, and channel depths. Figure 4.1 represents the
discharge voltage at different SOCs (0.15, 0.55, and 0.95) under different operating
conditions and channel heights. Both upper and lower left figures show a mild condition
with low flow rate (5 ml/min) and low current density (40 mA/cm2) while the figures on
the right show a severe condition with high flow rate (150 ml/min) and high current
density (93 mA/cm2). The results from different channel height are shown in figures 4.1
(a) and (b) for the lowest and highest channel height, respectively. All the results indicate
that there is no significant difference between the single channel and whole serpentine
geometry model with a difference less than 0.5%. This is also justifying the sufficiency of
using a single model for the channel height study.
4.2. GENERAL BEHAVIOR UNDER DIFFERENT FLOW RATES AND
CURRENT DENSITIES
The electrolyte flow rate and current density are two important parameters that
determine the overall performance of a VRFB system. A general understanding of the
impact of those two key parameters on battery performance is essential to identifying the
impact of channel geometry. To understand this, simple galvanostatic discharge
simulations are performed with different flow rates from 5 to 150 ml/min and current
densities from 40 to 93 mA/cm2. Figure 4.2 shows the cell voltage responses with
different flow rate and current density conditions. The figures 4.2(a) and (b) shows the
influence of the flow rate at a constant current density (a: 40 mA/cm2 and b: 93 mA/cm2).

47
(a)
(b)
Figure 4.1. Effect of the single channel pass and whole serpentine geometry models on
discharge voltage at different operating conditions. (a) Discharge voltage of cell 1 at
current densities (40 mA/cm2 (left) and 93 mA/cm2 (right)) and volumetric flow rates (5
ml/min (left) and 150 ml/min (right)), and (b) Discharge voltage of cell 3 at current
densities (40 mA/cm2 (left) and 93 mA/cm2 (right)) and volumetric flow rates (5 ml/min
(left) and 150 ml/min (right)).

48
The flow rate affects polarization leading to voltage drop, especially at the end of
the discharge (at low SOCs). This effect is dominant as the current density increased
(Figure 4.2b). This can be interpreted as a result of competition between diffusion and
surface reaction. At low flow rates, the diffusion rate limited the process compared to the
rate of surface reactions. Due to the poor supply of active species to the electrode surface,
a high concentration polarization occurs and the cell voltage is lowered. On the other
hand, the mass transfer at sufficiently high flow rates is no longer limiting, and rather, the
cell performance is limited by the rate of surface reactions. The mass-transfer-limit
phenomenon becomes more dominant when the current density increases. Another
observation is that, in general, there is a larger voltage drop when current density is
higher. This is mainly caused by an ohmic drop (as seen in Fig. 4.2c and Fig. 4.2d) in
which the current density changed at a fixed flow rate (c: 5 ml/min, d: 150 ml/min). One
significant difference is observed between the voltage drop due to concentration
polarization and ohmic loss. As the discharge process progresses (SOC decreases), the
concentration polarization is accumulated, but the ohmic drop is almost instantaneous at
all SOCs because it occurs immediately.

49
(a) (b)
(c) (d)
Figure 4.2. Effect of the electrolyte volumetric flow rate and current density on discharge
voltage: (a) Current density 40 mA/cm2, (b) Current density 93 mA/cm2, (c) Volumetric
flow rate 150 ml/min, (d) Volumetric flow rate 5 ml/min.
4.3. CHANNEL GEOMETRY IMPACT
4.3.1. Voltage Responses at Different Geometries. Figure 4.3 shows the
voltage responses of different channel heights at different flow rates and current
densities. At lower current densities, the geometric impact is stronger at lower flow rates.
Also, as the current density increases, the channel impact becomes dominant, but again
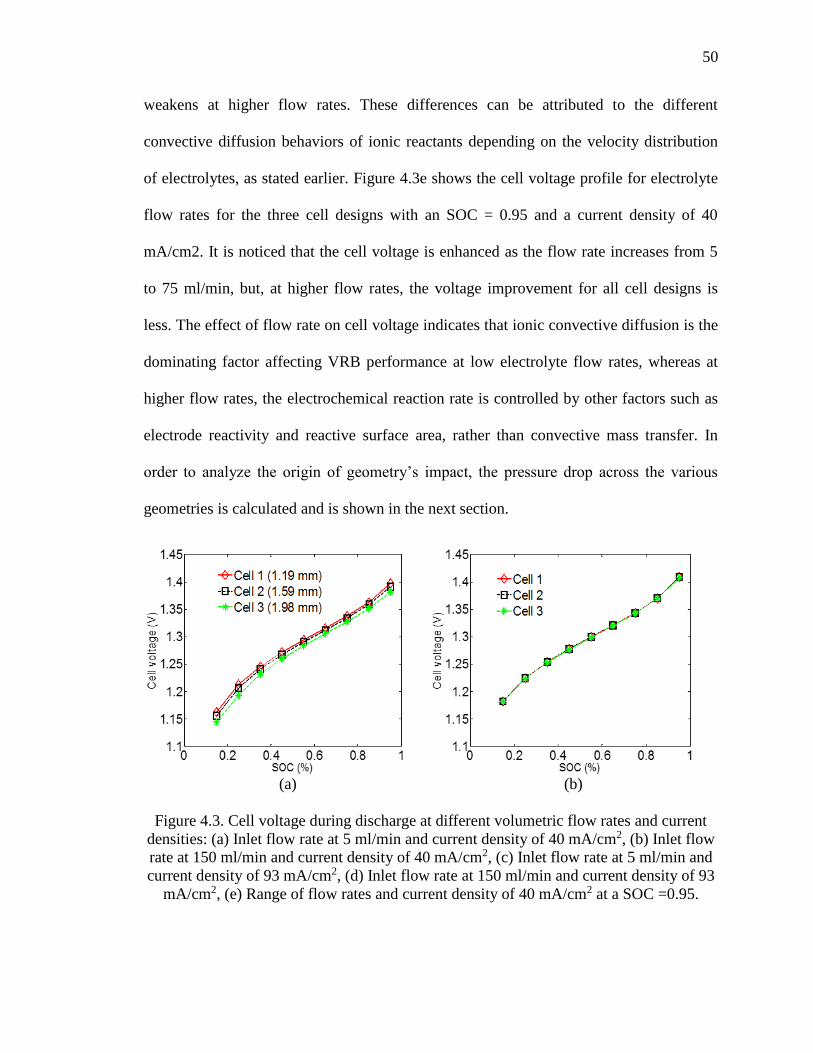
50
weakens at higher flow rates. These differences can be attributed to the different
convective diffusion behaviors of ionic reactants depending on the velocity distribution
of electrolytes, as stated earlier. Figure 4.3e shows the cell voltage profile for electrolyte
flow rates for the three cell designs with an SOC = 0.95 and a current density of 40
mA/cm2. It is noticed that the cell voltage is enhanced as the flow rate increases from 5
to 75 ml/min, but, at higher flow rates, the voltage improvement for all cell designs is
less. The effect of flow rate on cell voltage indicates that ionic convective diffusion is the
dominating factor affecting VRB performance at low electrolyte flow rates, whereas at
higher flow rates, the electrochemical reaction rate is controlled by other factors such as
electrode reactivity and reactive surface area, rather than convective mass transfer. In
order to analyze the origin of geometry’s impact, the pressure drop across the various
geometries is calculated and is shown in the next section.
(a) (b)
Figure 4.3. Cell voltage during discharge at different volumetric flow rates and current
densities: (a) Inlet flow rate at 5 ml/min and current density of 40 mA/cm2, (b) Inlet flow
rate at 150 ml/min and current density of 40 mA/cm2, (c) Inlet flow rate at 5 ml/min and
current density of 93 mA/cm2, (d) Inlet flow rate at 150 ml/min and current density of 93
mA/cm2, (e) Range of flow rates and current density of 40 mA/cm2 at a SOC =0.95.

51
(c) (d)
0 50 100 1501.38
1.385
1.39
1.395
1.4
1.405
Volumetric flow rate (ml/min)
Cell
voltage (
V)
Cell 1
Cell 2
Cell 3
(e)
Figure 4.3. Cell voltage during discharge at different volumetric flow rates and current
densities: (a) Inlet flow rate at 5 ml/min and current density of 40 mA/cm2, (b) Inlet flow
rate at 150 ml/min and current density of 40 mA/cm2, (c) Inlet flow rate at 5 ml/min and
current density of 93 mA/cm2, (d) Inlet flow rate at 150 ml/min and current density of 93
mA/cm2, (e) Range of flow rates and current density of 40 mA/cm2 at a SOC =0.95
(cont.).
4.3.2. Pressure Drop at Different Geometries. The pressure drop losses in
the stack as well as the associated pipes between the stack and storage tanks must be kept
to a minimum to minimize pumping power. At the same time, it is necessary to maintain
good supply of fresh electrolyte to the reaction sites. In a VRFB, this is achieved by

52
ensuring good crossflow through the electrode material. Figure 4.4a shows the pressure
distribution in the cathode electrode at a 150 ml/min flow rate with different channel
designs. The distribution looks generally similar, but there is a big difference in
magnitude. The fluid pressure drop of cell 1 is about 52% higher than that of cell 3. This
is because the velocity in cell 1 is the highest of the three cells, as the cross sectional area
is the smallest. As shown in Figure 4.4b, the pressure drop increases nonlinearly as the
flow rate increases. This may be related to the frictional factor, which is approximately
proportional to the square of velocity for a fully developed flow in a square channel. This
pressure drop is later used to evaluate the pumping power to calculate efficiencies.
(a)
Figure 4.4. (a) Pressure distribution at 150 ml/min of the three cell configurations, (b)
Pressure drop as a function of inlet flow rate.

53
0 50 100 1500
100
200
300
400
500
Volumetric flow rate (ml/min)
Pre
ssure
dro
p,
p (
Pa)
Cell 1 (1.19 mm)
Cell 2 (1.59 mm)
Cell 3 (1.98 mm)
(b)
Figure 4.4. (a) Pressure distribution at 150 ml/min of the three cell configurations, (b)
Pressure drop as a function of inlet flow rate (cont.).
4.3.3. Electrolyte Penetration into the Porous Electrode. As the actual
electrochemical reaction occurs in porous electrodes, consequently, the transport of the
electrolyte to the electrode determines the cell performance. In order to evaluate transport
to the electrode, a ratio value (Rp) representing the penetrated electrolytes is introduced,
by calculating the flow volume ratio at the electrode to the interface of the channel. The
flow volume is estimated by multiplying the average velocity at each point by the area
and the input flow rate. Figure 4.5 shows the impact of flow channel height on Rp at
different flow rates on cathode side. As shown, cell 1 penetrates more than the other two
cells, which can be attributed to the pressure difference across the half-cell geometry
resulting from the small cross-sectional area of the cell. This explains the better
performance of cell 1 shown Figure 4.3a. However, at a higher flow rate, the impact of
channel height becomes weak, as shown Fig. 4.3b. This means that the amount of

54
electrolyte entering the porous electrode is less influential on performance as it transits
into the reaction-limited region, which is consistent with the previous discussion.
0 50 100 1500
0.1
0.2
0.3
0.4
0.5
0.6
0.7
Volumetric flow rate (ml/min)
Penetr
ate
d r
atio t
o t
he e
lectr
ode (
--)
Cell 1 (1.19 mm)
Cell 2 (1.59 mm)
Cell 3 (1.98 mm)
Figure 4.5. Ratio of amount of penetrated electrolyte to the porous electrodes of the three
cells.
4.3.4. Energy Efficiency, Battery Efficiency, and Pumping Power. High
efficiency is one of the key requirements for energy storage components in all
applications. Energy efficiency and battery efficiency are analyzed under various flow
rates, based on Eqs. (6) and (7). Energy efficiency of all three cells in Figure 4.6a
improves gradually with increased flow rates, and it is obvious that cell 1 is more
efficient than the others. The efficiencies of batteries, depicted in Figure 4.6b, reach
maximum values of 90.10%, 90.06%, and 89.90% for cell 1, cell 2, and cell 3,
respectively, at around 35 ml/min and 40 mA/cm2. Efficiency declines at high flow rates
(behind the optimal flow value) due to increasing pump energy consumption, as shown in
Figure 4.6c.

55
Note that the battery efficiency in Figure 4.6c is based on the average charging-
discharging voltage calculation in the range of SOCs. Figure 4.6d shows the battery
efficiency of cell 2 at each SOC and the highest battery efficiency is around 90.1% at
SOC=0.55 for the same applied boundary conditions. This can be attributed to the fact
that a minimum over-potential occurs when the SOC=0.55 due to the symmetrical anodic
and cathodic coefficients. Besides, there is an equal supply of both oxidized and reduced
vanadium active species at the electrodes. As shown in Figure 4.6d, the pumping power
increases due to an increased pressure drop with a higher flow rate. Also, as shown in
Figure 4.6a, the battery efficiency of cell 3 drops more slowly after reaching maximum
efficiency than the others do. This is because the power consumption rate for cell 3 is
lower than others due to a smaller pressure drop (see Figure 4.4b). The variation in
battery efficiency with an increasing flow rate is mainly caused by non-linear pumping
power consumption. As the flow rate becomes higher, the energy loss due to pumping
becomes significant. This implies that the flow rate must be tuned to, and depend on,
operating conditions.
4.3.5. Effect of the Applied Current on the System Efficiency. The
impacts of three different current densities (40, 66, and 93 mA/cm2) on performance are
compared. Figure 4.7a shows the battery efficiency for cell 2. It is obvious that an
increase in applied current would lead to decreased battery efficiency due to an increment
in the corresponding over-potential cathode side (as illustrated in Figure 4.7b). In
addition, it is observed in the three battery configurations, that the optimal flow rate (VoB)
is not the same for each cell at different applied currents (as listed in Table 4.1).
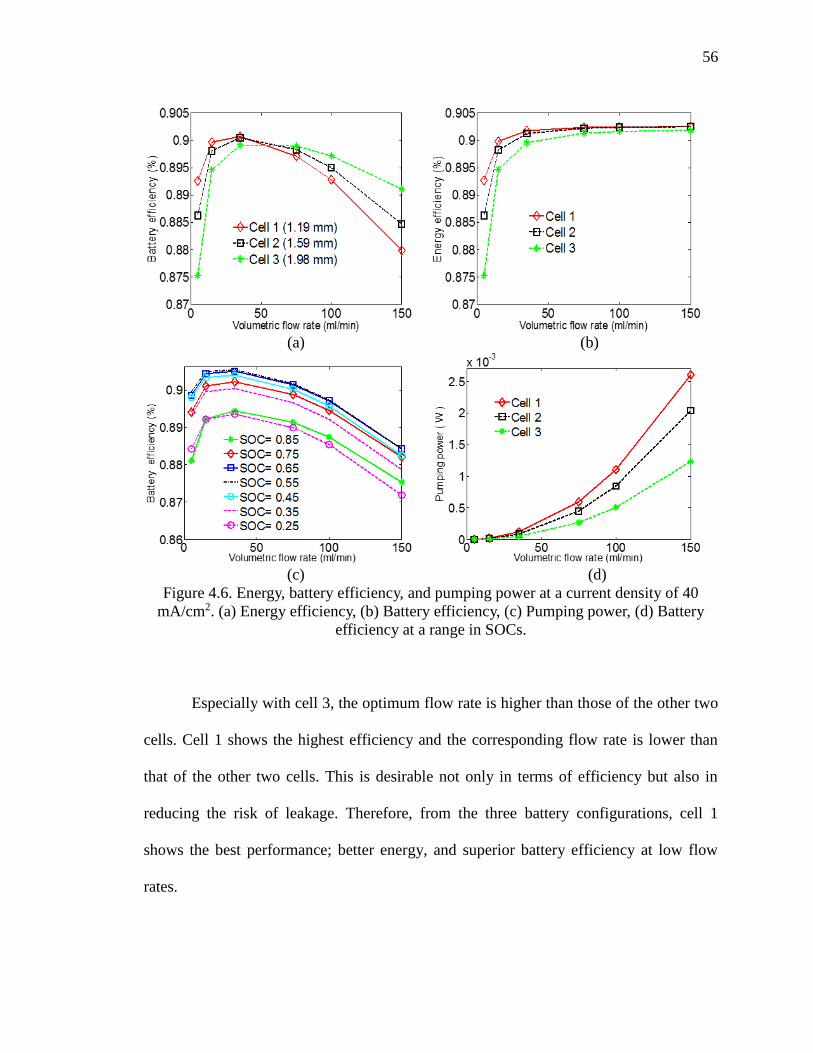
56
(a) (b)
(c) (d)
Figure 4.6. Energy, battery efficiency, and pumping power at a current density of 40
mA/cm2. (a) Energy efficiency, (b) Battery efficiency, (c) Pumping power, (d) Battery
efficiency at a range in SOCs.
Especially with cell 3, the optimum flow rate is higher than those of the other two
cells. Cell 1 shows the highest efficiency and the corresponding flow rate is lower than
that of the other two cells. This is desirable not only in terms of efficiency but also in
reducing the risk of leakage. Therefore, from the three battery configurations, cell 1
shows the best performance; better energy, and superior battery efficiency at low flow
rates.

57
(a) (b)
Figure 4.7. Current density effect on: (a) Battery efficiency, (b) Cathode over-potential at
different flow rates.
Table 4.1 Optimal flow rate and corresponding maximum battery efficiency
Cell Maximum battery efficiency ( %) with optimal flow rate ( , ml/min)
40 mA/cm2 66 mA/cm2 93 mA/cm2
Cell 1 91.09 35 85.45 35 80.4 75
Cell 2 90.06 35 84.38 75 79.41 75
Cell 3 89.33 75 83.71 75 78.68 100

58
5. DISCUSSION
In general, a transient simulation is more costly than a steady-state simulation. In
this work, all simulations are conducted with an assumption of the steady-state condition.
Consequently, it is necessary to check whether this assumption is reasonable. Figure
4.8(a) compares the results from the steady-state and transient models. Both results match
each other well. Since the cell voltage in the transient simulation is measured as a
function of time, the time-dependent responses needs to be converted to SOC-dependent
data for comparison. The conversion is done as follows [88]:
(9)
where is the total charging/discharging operating time, and is the state of charge
at the corresponding time and and are the values of at the initial and final
status of charge/discharge, respectively. The SOC values can be estimated from the open
circuit voltage, , as follows,
(10)
where is the open circuit voltage at 50% SOC which is 1.4V [89].
Next, it is essential to examine the effect of mesh size on convergence because
simulation results are quite dependent on mesh size. In order to investigate mesh-
dependent convergence, four different meshes of 626/1,902/2,430/3,520 elements with a
total degree of freedom of 8,563/26,015/33,237/48,146, respectively, are compared for
cell 2. Figure 4.8b shows a cell voltage with different mesh sizes. All results from the

59
meshes with more than 1,902 elements are well converged; hence, 1,902 elements are
selected for all simulations.
In order to validate the model, cell 2 design (in Table 3.1.) is fabricated and
tested. Figure 4.8c shows a comparison of the voltage responses from the model and an
experiment with a different SOC under a galvanostatic current density of 40 mA/cm2 and
a 75 ml/min volumetric flow rate during a charge-discharge cycle. In general, they are in
good agreement. The average relative error of the simulated results compared to the
experimental data is less than1% (4 mV) during charging (SOC 0.15-0.95), and (7.2 mV)
during the discharge cycle (SOC 0.95-0.15). Any discrepancies may have resulted from
the quick depletion of reactant concentrations at a quite high SOC, during charging, and
at a very low SOC, during discharge. Additional factors could be side reactions and ion
cross-overs through the membrane, which are not considered in the simulation.
(a) (b)
Figure 4.8. (a) Cell voltage comparison for 2D transient and steady state models
at a volumetric flow rate of 35 ml/min and current density of 40 mA/cm2, (b) Mesh-
independence of the overall cell voltage at different SOCs, (c) Comparison of simulated
and experimental values of the overall cell voltage at a current density of 40 mA/cm2.

60
0 0.2 0.4 0.6 0.8 1
1.2
1.3
1.4
1.5
1.6
1.7
SOC (%)
Cell
voltage (
V)
Charge (simulated)
Charge (experimental)
Discharge (simulated)
Discharge (experimental)
(c)
Figure 4.8. (a) Cell voltage comparison for 2D transient and steady state models at a
volumetric flow rate of 35 ml/min and current density of 40 mA/cm2, (b) Mesh-
independence of the overall cell voltage at different SOCs, (c) Comparison of simulated
and experimental values of the overall cell voltage at a current density of 40 mA/cm2
(cont.).

61
6. CONCLUSIONS
A three-dimensional electrochemical model for a vanadium redox flow battery
(VRFB) is developed, validated and, then, used to study the impact of the channel height
of a VRFB. The study focuses on discovering the relationship between flow rate, SOCs,
and current density, along with channel height and battery performance, including
voltage response and energy/battery efficiency. Fast flow rates enhance electrochemical
responses during the charge/ discharge cycle, while they also degrade overall battery
efficiency due to pumping energy losses. As a result, the expected battery efficiency is
closely related to flow rates and current density. Generally, energy efficiency improves
gradually with increased flow rate, while battery efficiency first increases and then drops
due to large pump losses. The effect of channel height on battery performance becomes
noticeable as the flow rate decreases and the current density increases. For the three
selected representative configurations, there are different optimal flow rates for each cell
design, and they change as current is applied. Also, battery efficiency varies as a function
of the SOC, which is related to minimal over-potential. Overall, the energy and battery
efficiency of cell 1 (smallest height among them) is better than the others. Further, its
required optimal flow rate is lower than those of other cells. It is found that an optimal
condition is determined by the pressure drop, amount of penetrated solutions to the
electrode, and electrochemical reaction rates. This developed model can also be applied
to study other factors, such as temperature and other electrode physical properties.
Eventually, it can help provide guidance for optimal flow battery design and loading
conditions.

62
APPENDIX
EQUATIONS OF THE MODEL
FLOW FIELD AND POROUS MEDIA:
The flow in the channel can be described by the momentum and continuity
equation for laminar flow as follows [38]:
(A.1)
(A.2)
where is the fluid density, is the velocity, is the pressure, is the volume force
vector and is the dynamic viscosity of the fluid.
The Brinkman equation for single-phase incompressible flow is used for the
transport through the porous electrode [38]:
(A.3)
(A.4)
where is the electrode porosity, is the mass source and is the permeability of the
porous electrode which is normally described by the Carman–Kozeny equation [90]:
(A.5)
where is the fiber diameter and is the Carman–Kozeny constant, which depends on
the type of media and is used as a fitting parameter.
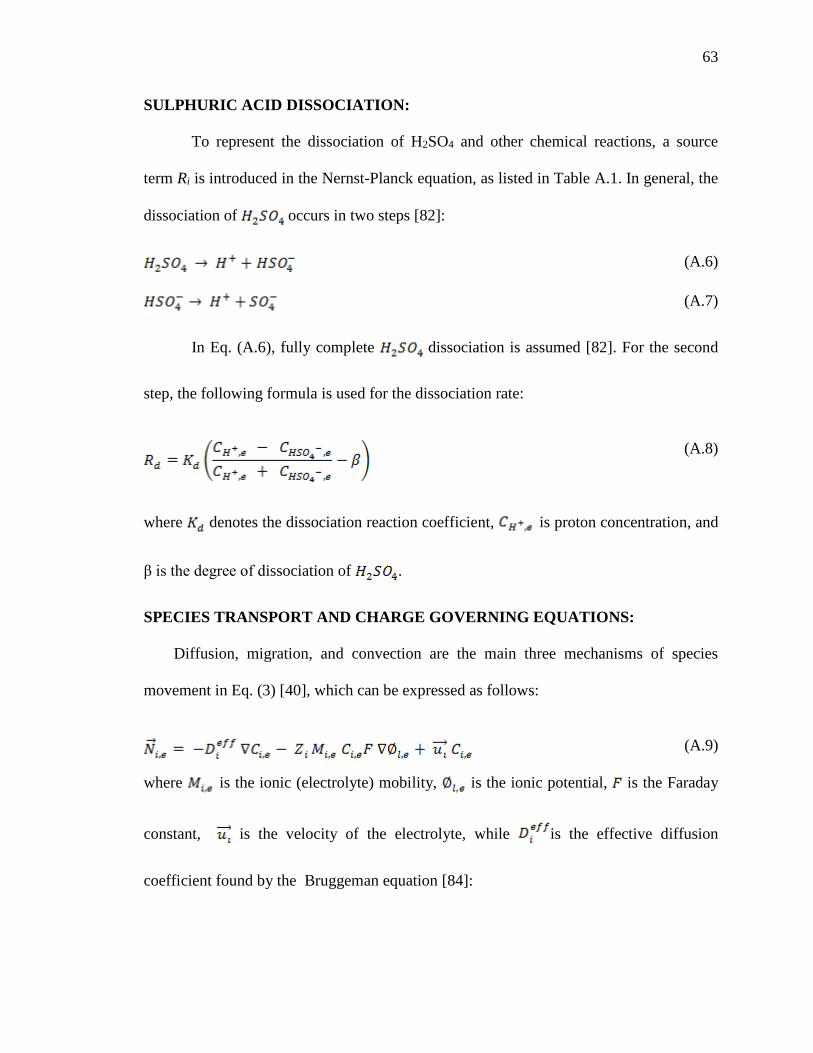
63
SULPHURIC ACID DISSOCIATION:
To represent the dissociation of H2SO4 and other chemical reactions, a source
term Ri is introduced in the Nernst-Planck equation, as listed in Table A.1. In general, the
dissociation of occurs in two steps [82]:
(A.6)
(A.7)
In Eq. (A.6), fully complete dissociation is assumed [82]. For the second
step, the following formula is used for the dissociation rate:
(A.8)
where denotes the dissociation reaction coefficient, is proton concentration, and
β is the degree of dissociation of .
SPECIES TRANSPORT AND CHARGE GOVERNING EQUATIONS:
Diffusion, migration, and convection are the main three mechanisms of species
movement in Eq. (3) [40], which can be expressed as follows:
(A.9)
where is the ionic (electrolyte) mobility, is the ionic potential, is the Faraday
constant, is the velocity of the electrolyte, while is the effective diffusion
coefficient found by the Bruggeman equation [84]:

64
(A.10)
The ionic mobility, , can be evaluated under the dilute solution approximation
from Nernst- Einstein equation as follows [50]:
(A.11)
where is the temperature and is the universal gas constant.
Since there is no real data in regards to electrolyte viscosity of a VRFB, it is
considered a constant value of for both anolyte and catholyte at 50% state of charge
[40]. Table A.2 contains all the electrolyte solution properties in this model.
In the charge conservation equation, porous electrode regions combine all
phenomenon of species movement, electrochemical reactions, and current transfer [84]:
(A.12)
where is the reaction current, while and denote the total electrolyte (ionic) and
solid (electronic) current density in the porous electrode region, respectively [84]:
(A.13)
After applying the electroneutrality equation, the total ionic current density in the
porous electrode can be expressed as follows:
(A.14)
where the effective conductivity, , is given by:
(A.15)

65
The electronic potential, , in the porous electrode is given by Ohm’s law:
(A.16)
where is the electrode effective conductivity based on the solid material
conductivity , which can be determined from the Bruggeman equation as follows:
(A.17)
All the porous electrode properties are shown in Table A.3.
Butler-Volmer equations are used to express the local reaction current density,
, for both anode (‘a’) and cathode (‘c’) electrodes [84].
(A.18)
(A.19)
In the Bulter-Volmer equation, denotes the species surface concentration at
the porous electrode liquid-solid interface. For the anode electrode, these concentrations
can be calculated by solving for and in the following equations [40]:
(A.20)

66
(A.21)
where (electrode mean pore radius) represents the average diffusive path
length. A similar approach can be developed to find the concentrations in the positive
half-cell by using Eq. (A.19). Also, in Eq. (A.18-A.19), represents the reaction rate
constant and ( and are anodic and cathodic charge transfer coefficients,
respectively. The surface-to-volume ratio describes the roughness of porous electrodes,
whilst represents the overpotential and it is defined as follows:
(A.22)
where denotes to the open circuit voltage (OCV) for anode and cathode, which can
be obtained from Nernst equations as follows:
(A.23)
(A.24)
and represent the standard reduction potentials for the negative and
positive electrodes, respectively. Since the proton ion is included in the main reaction of

67
positive electrode in Eq. (2), the proton concentration, is involved in (A.24) as
well.
Typically, the proton ions are not equal across the separator, therefore the Donnan
potential effect was taken into account, which represents the potential difference between
the membrane phase boundaries when the cell is in equilibrium conditions as follows
[91]:
(A.25)
where refers to either the anode or cathode electrode and m represents the separator.
The required parameters for reaction kinetics in addition to the other properties of the
electrodes are listed in Tables A.3 and A.4.
BOUNDARY CONDITIONS:
The developed VRFB model consists of a set of governing equations, along with
their corresponding boundary conditions, as described below. For the conservation of
momentum, velocity and pressure conditions apply to the inlet of inflow channel and
outlet of outflow channel, respectively,
(A.26)
where is the electrolyte volumetric flow rate, is the cross-sectional area of the inlet
channel. The outlet gauge pressure is usually set to zero. The no-slip boundary condition
applies to the walls of the inflow/outflow channel, but there is a slip boundary condition
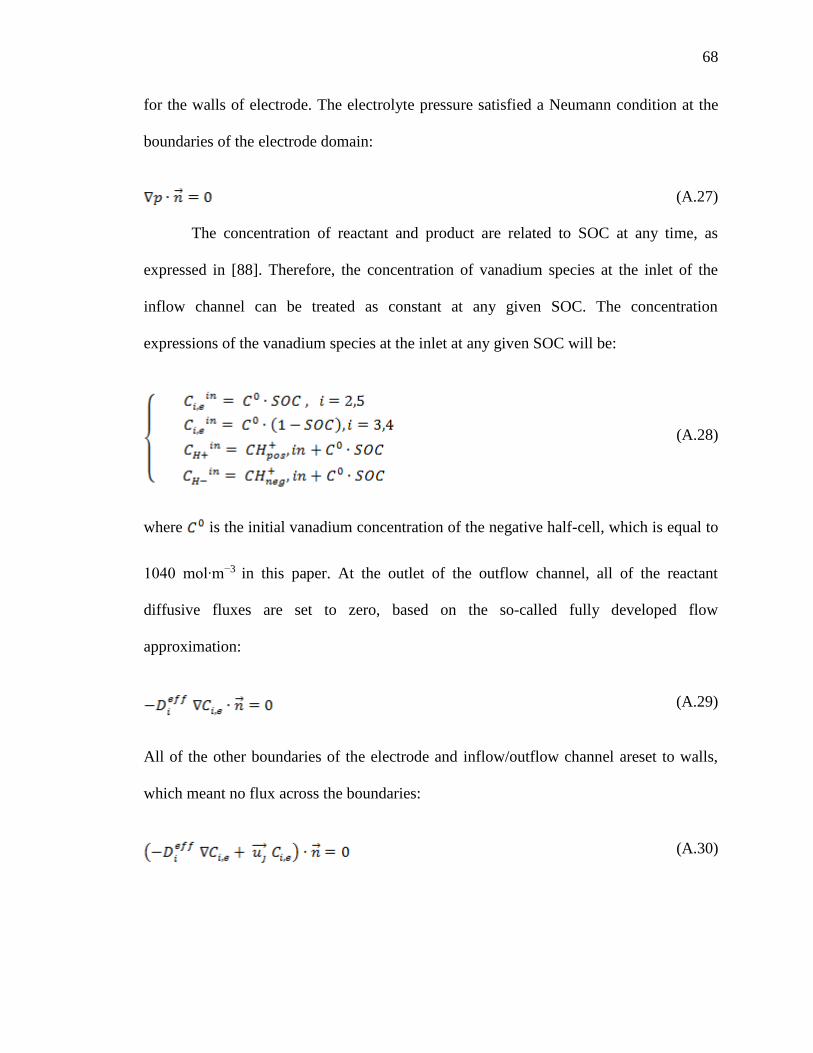
68
for the walls of electrode. The electrolyte pressure satisfied a Neumann condition at the
boundaries of the electrode domain:
(A.27)
The concentration of reactant and product are related to SOC at any time, as
expressed in [88]. Therefore, the concentration of vanadium species at the inlet of the
inflow channel can be treated as constant at any given SOC. The concentration
expressions of the vanadium species at the inlet at any given SOC will be:
(A.28)
where is the initial vanadium concentration of the negative half-cell, which is equal to
1040 mol∙m−3 in this paper. At the outlet of the outflow channel, all of the reactant
diffusive fluxes are set to zero, based on the so-called fully developed flow
approximation:
(A.29)
All of the other boundaries of the electrode and inflow/outflow channel areset to walls,
which meant no flux across the boundaries:
(A.30)
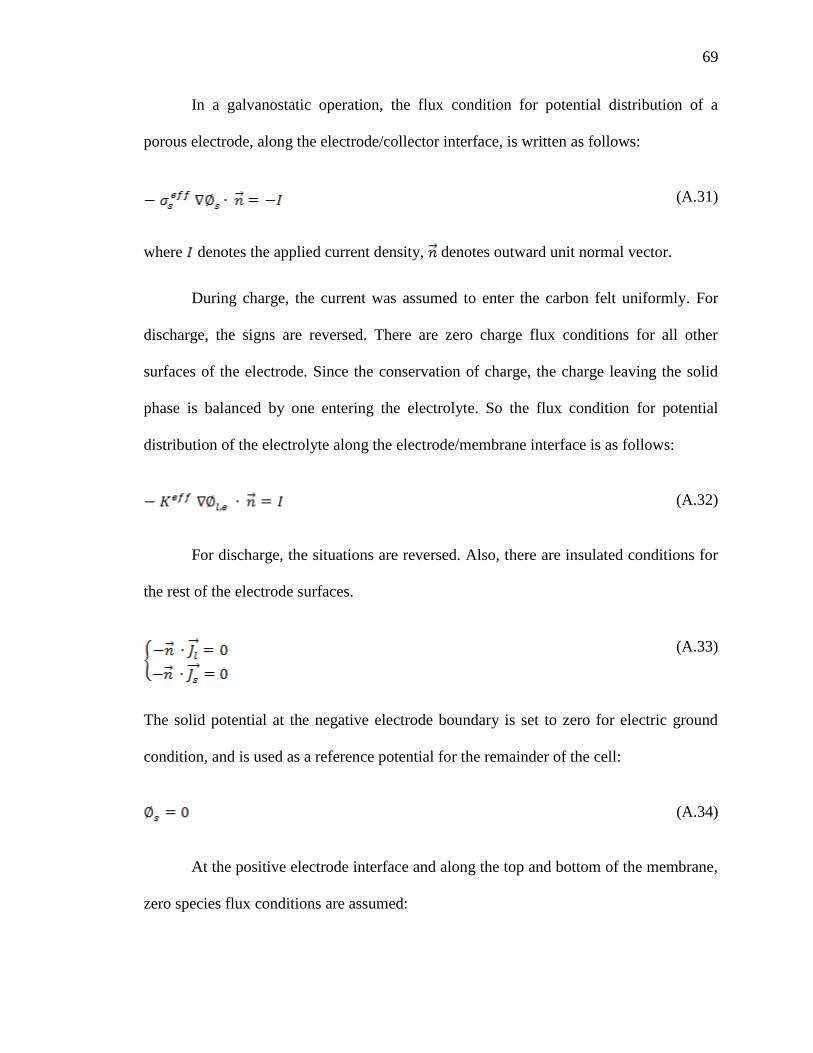
69
In a galvanostatic operation, the flux condition for potential distribution of a
porous electrode, along the electrode/collector interface, is written as follows:
(A.31)
where denotes the applied current density, denotes outward unit normal vector.
During charge, the current was assumed to enter the carbon felt uniformly. For
discharge, the signs are reversed. There are zero charge flux conditions for all other
surfaces of the electrode. Since the conservation of charge, the charge leaving the solid
phase is balanced by one entering the electrolyte. So the flux condition for potential
distribution of the electrolyte along the electrode/membrane interface is as follows:
(A.32)
For discharge, the situations are reversed. Also, there are insulated conditions for
the rest of the electrode surfaces.
(A.33)
The solid potential at the negative electrode boundary is set to zero for electric ground
condition, and is used as a reference potential for the remainder of the cell:
(A.34)
At the positive electrode interface and along the top and bottom of the membrane,
zero species flux conditions are assumed:

70
(A.35)
Consequently, the rest of the cell (top and bottom of the electrode and membrane
domains) is taken to be electrically insulated:
(A.36)
The initial species concentrations and operating conditions for the simulations are
given in Table A.5. The initial concentrations in the electrolytes represent a VRFB at
15% state of charge (SOC), where SOC is defined as follows:
(A.37)
(A.38)
(A.39)
Table A.1. Source and sink terms [40].
Term Description Cathode Anode
Source reaction of ion - I/F
Source reaction of ion - - I/F
Source reaction of ion I/F -
Source reaction of ion - I/F -
Source reaction of proton
Source reaction of ion

71
Table A.2. Properties of electrolyte solution.
Symbol Description Value and unit Origin
dissociation degree 0.25 [92]
dissociation rate 104 Fitted parameter
Anolyte viscosity 0.0025 [5]
Catholyte viscosity 0.0050 [5]
Anolyte density 1300 [5]
Catholyte density 1350 [93]
diffusion coefficient 2.4×10⁻¹⁰ [94]
diffusion coefficient 2.4×10⁻¹⁰ [94]
diffusion coefficient 3.9×10⁻¹⁰ [94]
diffusion coefficient 3.9×10⁻¹⁰ [94]
Proton diffusion coefficient 9.312×10⁻⁹ [95]
diffusion coefficient 1.33×10⁻⁹ [95]
diffusion coefficient 1.065×10⁻⁹ [95]
Table A.3. Porous electrode properties [40].
Symbol Description Value and unit Origin
Electrode porosity 0.929 [32]
Fiber diameter 50.3 (µm)
Provided by
manufacturer
a Specific surface area 3.5×10⁴ (m -1) [32]
Kozeny-carmen coefficient 180 [96]
Electrode height 50 (mm) Measured
Electrode width 50 (mm) Measured
Electrode thickness 6 (mm) Measured
Electronic conductivity of
electrode 66.7 (S ) Provided by
manufacturer

72
Table A.4. Kinetic parameters [40].
Symbol Description Value and unit Origin
Anode reaction rate constant 7×10⁻⁸ (m s-1) [97]
Cathode reaction rate constant 2.5×10⁻⁸ (m s-1) [94]
Negative charge transfer coefficient 0.45 Estimated
Positive charge transfer coefficient 0.55 Estimated
Standard potential for anode -0.255 (V) [84]
Standard potential for cathode 1.004 (V) [84]
Table A.5. Initial species concentrations and operating conditions [40].
Symbol Description Value and unit
initial concentration in anolyte 156
initial concentration in anolyte 884
initial concentration in catholyte 884
initial concentration in catholyte 156
initial concentration in anolyte 4447.5
initial concentration in catholyte 5097.5
initial concentration in catholyte 3058.5
initial concentrationanolyte
2668.5
T Operating temperature 300
I Current range 0.15-0.35
Volumetric flow rate range
5-150
Outlet pressure condition 0

73
REFERENCES
[1] C. Blanc and A. Rufer, Understanding the vanadium redox flow batteries: INTECH
Open Access Publisher, 2010.
[2] B. Dunn, H. Kamath, and J.-M. Tarascon, "Electrical energy storage for the grid: a
battery of choices," Science, vol. 334, pp. 928-935, 2011.
[3] A. Demirbas, "Potential applications of renewable energy sources, biomass
combustion problems in boiler power systems and combustion related
environmental issues," Progress in energy and combustion science, vol. 31, pp.
171-192, 2005.
[4] A. Mostafaeipour and N. Mostafaeipour, "Renewable energy issues and electricity
production in Middle East compared with Iran," Renewable and Sustainable Energy
Reviews, vol. 13, pp. 1641-1645, 2009.
[5] E. Sum, M. Rychcik, and M. Skyllas-Kazacos, "Investigation of the V (V)/V (IV)
system for use in the positive half-cell of a redox battery," Journal of Power
sources, vol. 16, pp. 85-95, 1985.
[6] M. Skyllas-Kazacos, M. Rychcik, R. G. Robins, A. Fane, and M. Green, "New all-
vanadium redox flow cell," J. Electrochem. Soc.;(United States), vol. 133, 1986.
[7] M. Schreiber, M. Harrer, A. Whitehead, H. Bucsich, M. Dragschitz, E. Seifert, et
al., "Practical and commercial issues in the design and manufacture of vanadium
flow batteries," Journal of Power Sources, vol. 206, pp. 483-489, 2012.
[8] H. L. Ferreira, R. Garde, G. Fulli, W. Kling, and J. P. Lopes, "Characterisation of
electrical energy storage technologies," Energy, vol. 53, pp. 288-298, 2013.
[9] A. M. Howlader, Y. Izumi, A. Uehara, N. Urasaki, T. Senjyu, A. Yona, et al., "A
minimal order observer based frequency control strategy for an integrated wind-
battery-diesel power system," Energy, vol. 46, pp. 168-178, 2012.
[10] C. W. Tan, T. C. Green, and C. A. Hernandez-Aramburo, "A stochastic method for
battery sizing with uninterruptible-power and demand shift capabilities in PV
(photovoltaic) systems," Energy, vol. 35, pp. 5082-5092, 2010.
[11] P. Arun, R. Banerjee, and S. Bandyopadhyay, "Optimum sizing of battery-
integrated diesel generator for remote electrification through design-space
approach," Energy, vol. 33, pp. 1155-1168, 2008.
[12] V. Virulkar, M. Aware, and M. Kolhe, "Integrated battery controller for distributed
energy system," Energy, vol. 36, pp. 2392-2398, 2011.

74
[13] G. Kear, A. A. Shah, and F. C. Walsh, "Development of the all‐vanadium redox
flow battery for energy storage: a review of technological, financial and policy
aspects," International journal of energy research, vol. 36, pp. 1105-1120, 2012.
[14] P. Leung, X. Li, C. P. De León, L. Berlouis, C. J. Low, and F. C. Walsh, "Progress
in redox flow batteries, remaining challenges and their applications in energy
storage," Rsc Advances, vol. 2, pp. 10125-10156, 2012.
[15] A. Shibata and K. Sato, "Development of vanadium redox flow battery for
electricity storage," Power Engineering Journal, vol. 13, pp. 130-135, 1999.
[16] B. K. Bose, "Global energy scenario and impact of power electronics in 21st
century," IEEE Transactions on Industrial Electronics, vol. 60, pp. 2638-2651,
2013.
[17] M. Y. Suberu, M. W. Mustafa, and N. Bashir, "Energy storage systems for
renewable energy power sector integration and mitigation of intermittency,"
Renewable and Sustainable Energy Reviews, vol. 35, pp. 499-514, 2014.
[18] H. Zhang, H. Zhang, X. Li, Z. Mai, and J. Zhang, "Nanofiltration (NF) membranes:
the next generation separators for all vanadium redox flow batteries (VRBs)?,"
Energy & Environmental Science, vol. 4, pp. 1676-1679, 2011.
[19] H. Zhang, H. Zhang, X. Li, Z. Mai, and W. Wei, "Silica modified nanofiltration
membranes with improved selectivity for redox flow battery application," Energy
Environ. Sci., vol. 5, pp. 6299-6303, 2012.
[20] S. Zhong, M. Kazacos, R. Burford, and M. Skyllas-Kazacos, "Fabrication and
activation studies of conducting plastic composite electrodes for redox cells,"
Journal of power sources, vol. 36, pp. 29-43, 1991.
[21] V. Haddadi‐Asl, M. Kazacos, and M. Skyllas‐Kazacos, "Carbon–polymer
composite electrodes for redox cells," Journal of applied polymer science, vol. 57,
pp. 1455-1463, 1995.
[22] S. Zhong, M. Kazacos, M. S. Kazacos, and V. Haddadi-Asl, "Flexible, conducting
plastic electrode and process for its preparation," ed: Google Patents, 1997.
[23] W. Wang, Q. Luo, B. Li, X. Wei, L. Li, and Z. Yang, "Recent progress in redox
flow battery research and development," Advanced Functional Materials, vol. 23,
pp. 970-986, 2013.
[24] D. Aaron, Q. Liu, Z. Tang, G. Grim, A. Papandrew, A. Turhan, et al., "Dramatic
performance gains in vanadium redox flow batteries through modified cell
architecture," Journal of Power sources, vol. 206, pp. 450-453, 2012.

75
[25] M. Skyllas-Kazacos and M. Kazacos, "State of charge monitoring methods for
vanadium redox flow battery control," Journal of Power Sources, vol. 196, pp.
8822-8827, 2011.
[26] X. Li and I. Sabir, "Review of bipolar plates in PEM fuel cells: Flow-field designs,"
International Journal of Hydrogen Energy, vol. 30, pp. 359-371, 2005.
[27] P. Hamilton and B. Pollet, "Polymer electrolyte membrane fuel cell (PEMFC) flow
field plate: design, materials and characterisation," Fuel cells, vol. 10, pp. 489-509,
2010.
[28] H. Yang and T. Zhao, "Effect of anode flow field design on the performance of
liquid feed direct methanol fuel cells," Electrochimica Acta, vol. 50, pp. 3243-3252,
2005.
[29] C. W. Wong, T. Zhao, Q. Ye, and J. Liu, "Experimental investigations of the anode
flow field of a micro direct methanol fuel cell," Journal of Power Sources, vol. 155,
pp. 291-296, 2006.
[30] X. Ma, H. Zhang, C. Sun, Y. Zou, and T. Zhang, "An optimal strategy of electrolyte
flow rate for vanadium redox flow battery," Journal of Power Sources, vol. 203, pp.
153-158, 4/1/ 2012.
[31] A. Kazim, H. Liu, and P. Forges, "Modelling of performance of PEM fuel cells with
conventional and interdigitated flow fields," Journal of Applied Electrochemistry,
vol. 29, pp. 1409-1416, 1999.
[32] H. Dohle, R. Jung, N. Kimiaie, J. Mergel, and M. Müller, "Interaction between the
diffusion layer and the flow field of polymer electrolyte fuel cells—experiments
and simulation studies," Journal of Power Sources, vol. 124, pp. 371-384, 2003.
[33] W.-M. Yan, C.-H. Yang, C.-Y. Soong, F. Chen, and S.-C. Mei, "Experimental
studies on optimal operating conditions for different flow field designs of PEM fuel
cells," Journal of power sources, vol. 160, pp. 284-292, 2006.
[34] C. Xu and T. Zhao, "A new flow field design for polymer electrolyte-based fuel
cells," Electrochemistry communications, vol. 9, pp. 497-503, 2007.
[35] P. Suresh, S. Jayanti, A. Deshpande, and P. Haridoss, "An improved serpentine
flow field with enhanced cross-flow for fuel cell applications," International
journal of hydrogen energy, vol. 36, pp. 6067-6072, 2011.
[36] R. J. Kee and H. Zhu, "Distribution of incompressible flow within interdigitated
channels and porous electrodes," Journal of Power Sources, vol. 299, pp. 509-518,
2015.

76
[37] S. Kumar and S. Jayanti, "Effect of flow field on the performance of an all-
vanadium redox flow battery," Journal of Power Sources, vol. 307, pp. 782-787,
2016.
[38] C. Dennison, E. Agar, B. Akuzum, and E. Kumbur, "Enhancing mass transport in
redox flow batteries by tailoring flow field and electrode design," Journal of The
Electrochemical Society, vol. 163, pp. A5163-A5169, 2016.
[39] J. Q. Chen, B. G. Wang, and H. L. Lv, "Numerical simulation and experiment on
the electrolyte flow distribution for all vanadium redox flow battery," in Advanced
Materials Research, 2011, pp. 604-607.
[40] S. Tsushima, S. Sasaki, and S. Hirai, "Influence of cell geometry and operating
parameters on performance of a redox flow battery with serpentine and
interdigitated flow fields," in Meeting Abstracts, 2013, pp. 1664-1664.
[41] D. Aaron, Z. Tang, A. B. Papandrew, and T. A. Zawodzinski, "Polarization curve
analysis of all-vanadium redox flow batteries," Journal of Applied
Electrochemistry, vol. 41, pp. 1175-1182, 2011.
[42] B. J. Koeppel, K. P. Recknagle, D. E. Stephenson, D. Reed, E. Thomsen, and V.
Sprenkle, "Redesign of a vanadium redox flow battery for reduced pressure loss
using an interdigitated flow field," in Meeting Abstracts, 2013, pp. 1660-1660.
[43] G. Qiu, A. S. Joshi, C. Dennison, K. Knehr, E. Kumbur, and Y. Sun, "3D pore-scale
resolved model for coupled species/charge/fluid transport in a vanadium redox flow
battery," Electrochimica Acta, vol. 64, pp. 46-64, 2012.
[44] J. Escudero-Gonzalez and P. A. López-Jiménez, "Methodology to optimize fluid-
dynamic design in a redox cell," Journal of Power Sources, vol. 251, pp. 243-253,
2014.
[45] C. Yin, Y. Gao, S. Guo, and H. Tang, "A coupled three dimensional model of
vanadium redox flow battery for flow field designs," Energy, vol. 74, pp. 886-895,
2014.
[46] Y. Wang and S. C. Cho, "Analysis and three-dimensional modeling of vanadium
flow batteries," Journal of The Electrochemical Society, vol. 161, pp. A1200-
A1212, 2014.
[47] M. Vynnycky, "Analysis of a model for the operation of a vanadium redox battery,"
Energy, vol. 36, pp. 2242-2256, 2011.
[48] A. Shah, M. Watt-Smith, and F. Walsh, "A dynamic performance model for redox-
flow batteries involving soluble species," Electrochimica Acta, vol. 53, pp. 8087-
8100, 2008.

77
[49] K. Knehr, E. Agar, C. Dennison, A. Kalidindi, and E. Kumbur, "A transient
vanadium flow battery model incorporating vanadium crossover and water transport
through the membrane," Journal of The Electrochemical Society, vol. 159, pp.
A1446-A1459, 2012.
[50] D. M. Bernardi and M. W. Verbrugge, "Mathematical model of a gas diffusion
electrode bonded to a polymer electrolyte," AIChE journal, vol. 37, pp. 1151-1163,
1991.
[51] G. Pourcelly, A. Lindheimer, C. Gavach, and H. D. Hurwitz, "Electrical transport of
sulphuric acid in nation perfluorosulphonic membranes," Journal of
electroanalytical chemistry and interfacial electrochemistry, vol. 305, pp. 97-113,
1991.
[52] C. Blanc, "Modeling of a vanadium redox flow battery electricity storage system,"
2009.
[53] C. Blanc and A. Rufer, "Optimization of the operating point of a vanadium redox
flow battery," in Energy Conversion Congress and Exposition, 2009. ECCE 2009.
IEEE, 2009, pp. 2600-2605.
[54] D. You, H. Zhang, and J. Chen, "A simple model for the vanadium redox battery,"
Electrochimica Acta, vol. 54, pp. 6827-6836, 2009.
[55] T. Sukkar and M. Skyllas-Kazacos, "Water transfer behaviour across cation
exchange membranes in the vanadium redox battery," Journal of Membrane
Science, vol. 222, pp. 235-247, 2003.
[56] X. Ma, H. Zhang, and F. Xing, "A three-dimensional model for negative half cell of
the vanadium redox flow battery," Electrochimica Acta, vol. 58, pp. 238-246, 2011.
[57] K. Knehr and E. Kumbur, "Open circuit voltage of vanadium redox flow batteries:
Discrepancy between models and experiments," Electrochemistry Communications,
vol. 13, pp. 342-345, 2011.
[58] D. Knopf, B. Luo, U. Krieger, and T. Koop, "Thermodynamic dissociation constant
of the bisulfate ion from Raman and ion interaction modeling studies of aqueous
sulfuric acid at low temperatures," The Journal of Physical Chemistry A, vol. 107,
pp. 4322-4332, 2003.
[59] G. Oriji, Y. Katayama, and T. Miura, "Investigation on V (IV)/V (V) species in a
vanadium redox flow battery," Electrochimica Acta, vol. 49, pp. 3091-3095, 2004.
[60] T. YAMAMURA, N. WATANABE, T. YANO, and Y. SHIOKAWA, "Electron-
transfer kinetics of Np3/Np4, NpO (/NpO2 2, V2/V3, and VO2/VO 2 at carbon
electrodes," J. Electrochem. Soc, vol. 152, pp. A830-A836.

78
[61] J. Newman and K. E. Thomas-Alyea, Electrochemical systems: John Wiley & Sons,
2012.
[62] H. Zhou, H. Zhang, P. Zhao, and B. Yi, "A comparative study of carbon felt and
activated carbon based electrodes for sodium polysulfide/bromine redox flow
battery," Electrochimica Acta, vol. 51, pp. 6304-6312, 2006.
[63] P. Xu and B. Yu, "Developing a new form of permeability and Kozeny–Carman
constant for homogeneous porous media by means of fractal geometry," Advances
in water resources, vol. 31, pp. 74-81, 2008.
[64] E. Sum and M. Skyllas-Kazacos, "A study of the V (II)/V (III) redox couple for
redox flow cell applications," Journal of Power sources, vol. 15, pp. 179-190, 1985.

79
II. NEW SINGLE CELL DESIGN OF A VANADIUM REDOX FLOW BATTERY
ABSTRACT
Vanadium redox flow battery (VRFB) is a type of electrochemical energy storage
device commonly used in stationary applications. In this study, a new single-cell design
of VRFB with a serpentine flow channel was designed and built. The introduced design is
made with fewer components than the existing VRFB cells, making it very economical
and greatly enhancing safety and ease of assembly. In addition, mechanical strength and
impermeability are greatly improved by replacing graphite for the flow path, which is
fragile and porous, with PVC (polyvinyl chloride) sheet. This makes it possible to expect
a longer life, particularly in harsh environments exposed to shocks and vibrations.
Many tests have been conducted to compare this new design with traditional
design. These tests include cycling, polarization across the current range with flow range,
and electrochemical impedance spectroscopy (EIS) for internal resistance analysis. The
results show that the new design has a very stable cycling performance with better
columbic and energy efficiency compared to the existing designs.
To evaluate the applicability of this design, cycle tests of different current
conditions were performed. The polarization test reaffirmed that a higher output was
obtained from the new design than the existing cell for the same external cell dimensions.
However, a sharp drop in voltage was observed through the polarization test, which is
considered to be due to the high contact resistance between the current collector and the
porous electrode. This is solved by introducing a thin graphite film as the current

80
collector. Finally, according to economic analysis, the new assembly is not only easy to
assemble, but also lightweight and cost-effective.

81
1. INTRODUCTION
Vanadium redox flow batteries (VRFBs) are being widely considered for grid-
scale energy storage applications due to them having many attractive features such as
system flexibility, uncoupled energy and power capacities, relative safety, and long lives
due to the decreased risk of cross-contamination of the electrode compartments [41, 44,
98]. Traditional VRFB cells with flow field design consist of a cathode and anode, a
membrane separator, current collectors, gaskets, insulators, and graphite plates engraved
with flow channels. All of these components are carefully compressed between two
endplates. The schematic diagram of VRFB is shown in Figure 1.1. The electrolyte
solutions are stored in external reservoirs; the positive couple (V+5/V+4) (present as
VO2+/VO2+ in cathode side) and the negative couple (V+3/V+2 in anode side) are the
vanadium solutions that flow into the battery cell, where redox reactions occur near the
surfaces of the electrodes. Electrons leave the anode side to the cathode during the
discharge process, whereas a reverse process during the charge occurs. This redox stores
or releases electrical energy, allowing the battery to be charged or discharged as
described below [62]:
At the positive electrode,
(1)
At the negative electrode,
(2)

82
Overall reaction:
(3)
Figure 1.1. A schematic diagram of a traditional VRFB. (1) End plates, (2) Insulators (3)
Current collectors, (4) Graphite flow field, (5) Gaskets, (6) Cathode and anode electrodes,
(7) Membrane, (8) load/power supply, (9) Electrolyte tanks, (10) Pumps.
All reactants and products of the redox reaction that occurs in the electrodes
remain dissolved in the two electrolyte solutions used in VRFBs. If crossover
contamination occurs, the two electrolyte solutions will mix together which retrieves the
initial system electrolyte, and eventually leads to energy loss [6]. The number and surface
area of the electrodes determine the output power of the VRFB, whereas the amount and
concentration of the liquid electrolyte at each tank can determine the system capacity and
energy. This means that the storage capacity and output power of the VRFB are
independent [44].

83
It is important that redox flow battery systems are optimized in terms of
performance and/or cost in order to perform well in the commercial marketplace. It has
been reported that the majority of the cost of VRFB systems is the materials required for
construction [7]. If new materials are not developed in order to reduce cost, the battery
system performance must be improved to make the systems more cost effective. This
enables a reduction in the multi-cell battery size and cost coupled with achieving certain
output power needs.
In general, vanadium redox flow battery and fuel cell technology share almost the
same internal components. Bipolar plate, also called the flow-field plate, is considered as
one of the main components. The bipolar plate performs the following functions:
distribute the electrolyte solution inside the battery cells, isolate different cells in the
multi-cell battery core, convey current into and out of the cell, and dissipate the stack
heat [9]. Its main role is to deliver reactants to and from the porous anode and cathode
materials via flow field channels. It has been noticed that the way of flow-field design has
a partial impact on the success of electrolyte transport [99]. Finding appropriate materials
of bipolar plates becomes an important requirement in both VRFB and fuel cell stack
development technologies. The bipolar plate materials should have unique features such
as high availability, low cost, low permeability to the chemical solution, good chemical
compatibility to acids, high corrosion resistance, and reasonable strength [10].
In the literature of fuel cells, three different kinds of bipolar materials have been
examined and can be categorized as metals, nonmetals (graphite), and graphite composite
materials (polymers) [100]. For mobile applications, metal bipolar plates are considered
suitable and safe candidates because they show the major constraints of the required

84
features of bipolar plates such as very good electrical conductivity, low cost, excellent
mechanical strength, easy manufacture, and simple maintenance, though it requires a
corrosion-protective coating for lifetime improvement [101-105]. Nonmetal plate (pure
graphite) offers excellent chemical resistance for strong acids and high thermal
conductivity for heat management, and it works as a good electric conductive material
with a high corrosion and lower density as compared to metal ones; nevertheless,
engraving the flow field channel is difficult process and requires more time, which results
in very high costs [106]. Additionally, graphite plates are porous and brittle by nature,
which requires them to be coated to prevent reactant penetration, making them poor
candidates for low-cost components [19]. Last of all, polymer composites are specified to
improve and achieve the desired properties of bipolar plates. Composites have less bulk
density than the other two types and can be shaped into any structure and dimension,
which makes them an excellent option for flow battery and fuel cell stacks. Normally,
composite plates consist of commercial polymers and work as binders and high loading
conductive carbon compounds to enhance the plate conductivity [107]. For VRFB
systems, the environment is not the same as in the fuel cell due to using an acidic
concentrated vanadium with the bipolar plates, which needs different requirements for
bipolar plates to be operated at different applied operating conditions [108].
Despite efforts to create new composite materials to improve the bulk
conductivity and the properties of bipolar plates as an alternative to the permeable and
brittle graphite plates in traditional VRFB systems, those approaches are still initially
complex and costly because they require additional operating equipment at specific
environment conditions, e.g., specific conditions for temperature, pressure, and species

85
ratios. The efforts also require more time to prepare the materials for specific
requirements. In this new design, a thermoplastic material, PVC (Polyvinyl chloride), is
used to replace the traditional graphite plate in VRFB. This material has great key
technical advantages such as light weight, good mechanical strength, impermeability,
resistance to weathering, chemical rotting, and corrosion [109]. Also, it can be cut,
shaped, and joined easily in a variety of styles, which is important to make the flow field
channels for electrolyte distribution in flow systems. Through conducting many tests such
as cycling, system efficiencies (columbic, voltage, and energy), polarization, and
impedance measurements, the performance of the new cell is compared with the
traditional single VRFB cell at different operating conditions.
86
2. DETAILS OF THE EXPERIMENTAL WORK
Two lab-scale with the single-cell configuration of VRFB have been designed,
fabricated and tested in this study. The first one is the traditional design cell, referred as
(TD) in the future discussion (the most common flow cell design used among the VRFB
community research), which uses a graphite plate to engrave the flow field channels. The
cell is assembled from the following components: proton exchange membrane, 50×50
mm2 area (Nafion 117, and 0.183 mm thickness-Fuel Cell Store, Texas, USA); two
symmetric electrodes of graphite felt, GFA6 of 50×50 mm2 area as cathode and anode
(SGL Technologies GbH) with 6 mm total thickness and specific resistance of 0.12
Ohm.cm; electrolyte distributors (flow field channels) to divide the electrolyte uniformly
across the active area of the VRFB, which patterned with serpentine pattern on black
graphite plate from (McMaster-Carr, USA) that can serve as a current collector too;
gaskets and electric insulators are made of PTFE (polytetrafluoroethylene) from
(McMaster-Carr, USA) and are, respectively, utilized to avoid electrolyte leakage among
the assembled components and to prevent electronic current to go away from flow field
plate to endplates; two Garolite sheets from (Fuel Cell Store, Texas, USA) with 120×120
mm2 outer dimensions offering excellent strength and good electrical insulating qualities
were used as endplates with a total of 12 bolts distributed in a uniform way along the
endplate boundary to compact the cell components with no leaking; finally, a high-
density polyethylene (HDPE) material for tubing, compression fittings (1/8 NPT × 1/4
inches OD tube), and tank, was used to feed the electrolyte solution into the cell stack
from external tanks and vice versa by two pumps from (SMART Digital DDA7.5-16AR-
PVC/V/C, Grundfos, Bjerringbro, Germany). The second cell refers to the new design

87
(ND) in which a thermoplastic material, PVC, from McMaster-Carr, 12.7 mm thickness
and 120 mm side length, was used to replace the graphite plate. Almost all of the same
components that are used in TD were applied in ND except some extra ones. The extra
components are as follows: gaskets (which are avoided by making a square pocket at
specific depth, 5mm), insulators (as the PVC is a good dielectric material), and end plates
(as PVC is hard enough to provide assembling force), all of which makes this design
easier to assemble, lighter, more mechanically strong, and more cost-effective. Based on
same exterior dimensions of the assembled cells (120×120 mm2), the utilized electrode
area and membrane in ND are larger than in TD (80×80 mm2 vs. 50×50 mm2)
respectively. All the geometric details of TD and ND are presented in Figure 2.1 (a) and
Figure 2.1 (b), respectively, whereas the assembled cells of both designs are shown
Figure 2.1 (c).
The flow field plates of each design include flow channels of 4×2 mm2 cross
section area with a land width of 7.5 mm among the channels. Also, one graphite rod
material from (McMaster-Carr, 1/4 inches thickness and 2.5 inches side length) was fixed
in the new design through each PVC compartment to serve as a current collector. The
depth of the PVC pocket (where the felt electrode sits in) was purposely made less than
the original thickness of the electrode (6 mm) to accomplish approximately 16.5%
compression ratio. Since increasing the compression ratio results in the high-pressure
drop (high pumping power) due to the reduction in felt permeability, the graphite felt
electrode compression ratio was limited to 1 mm.

88
(a) (b)
(c)
Figure 2.1. Geometrical details of the two single VRFB cells (a) TD cell at 50×50 mm2
electrode area, (b) ND cell at 80×80 mm2 electrode area, (c) Cells assembly: ND (left),
TD (right).
For both prototypes, the electrolyte solution was prepared by dissolving 1.04 M
VOSO4.xH2O (99.9% wt. purity, Alfa Aesar) in 4 M sulphuric acid solution to get the
electrolyte V4+. Each tank has 100 ml of anolyte and catholyte, which were pumped to
the cell electrodes from tanks and vice versa by two pumps. Constant lab temperature,
around 24 oC, was observed during all tests. The battery was regarded as fully charged
after being charged constantly at 1.75 V until the current density dropped to 40 mA/cm2.

89
In the first charging (where 100 ml V4+ electrolyte solution was placed in anode side tank
and 200 ml was placed in cathode side tank), V4+ was transformed into V5+ and V2+ in
both solutions (catholyte and anolyte), respectively. Then, half of the catholyte amount
was taken away after observing new colors on both sides (i.e., violet in the anode side
and yellow on the cathode side).
The cell columbic efficiency, CE, represents the fraction of total current that is
produced by the desired reactions (low CE indicates the strong presence of unwanted
secondary reactions); the voltage efficiency, VE, reflects all combined voltage losses that
reduce the operating voltage of the cell below the theoretical equilibrium voltage of the
VRFB cell; and the energy efficiency, EE, was computed from EE = CE×VE. These
types of efficiency were measured and compared for the two designs. During discharge,
same charge current was applied to reach 1 V voltage value. All the experimental
measurements such as cycling plots, polarization curves, and impedance analysis data are
conducted with (4 Channel Battery Analyzer, BST8-20A-CST, MTI Corporation, CA
94804, USA) at a range of flow rates and applied currents. During the test time, leaking
issues (which can have an impact on the cell performance) were not observed except
some amount of electrolyte leakage from the graphite plates was present due to their
permeability. Results from these experiments are discussed below.

90
3. RESULTS
3.1. PERMEABILITY OF PVC AND GRAPHITE BIPOLAR PLATES
One of the main design criteria of the excellent bipolar plate is its low
permeability to the electrolyte. As shown in Figure 3.1(a) and Figure 3.1(b), a simple test
was done by soaking the PVC and graphite plates (after the test was completed) in
distilled water to demonstrate the electrolyte leakage from each plate. For PVC plates, no
electrolyte was found in the distilled water after approximately 100 hrs. While the
graphite plate showed some amount of electrolyte in the distilled water just after a couple
of hours, it was also found that the electric conductivity was much lower after utilizing
the graphite plate than before the test started. It is obvious that the PVC plate cannot
allow the electrolyte to penetrate in a perfect way. In addition, Figure 3.1(c) and Figure
3.1(d) clearly show how the graphite flow field plate suffers from the electrolyte
penetration from the sides and back, respectively.
(a) (b)
Figure 3.1. Actual comparison between the graphite and PVC plates (a) Soaked PVC
plate in distilled water, (b) Soaked graphite plate in distilled water, (c) Leakage from the
graphite sides, (d) Leakage from the graphite back.
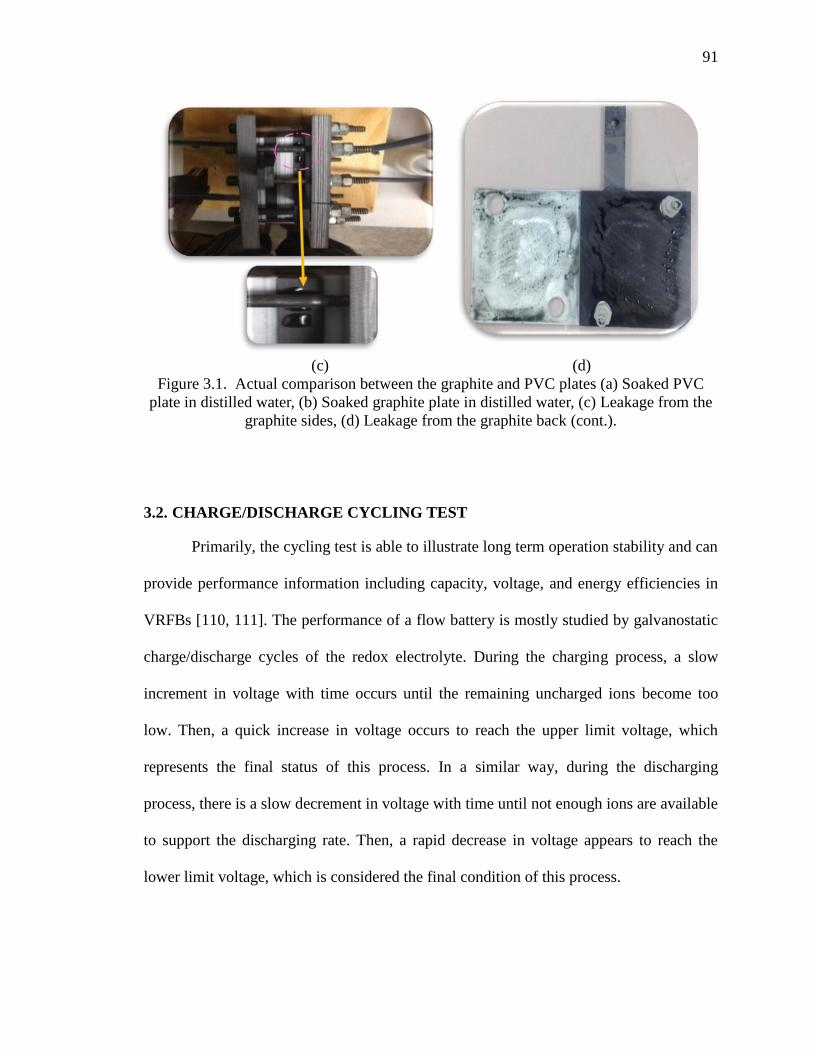
91
(c) (d)
Figure 3.1. Actual comparison between the graphite and PVC plates (a) Soaked PVC
plate in distilled water, (b) Soaked graphite plate in distilled water, (c) Leakage from the
graphite sides, (d) Leakage from the graphite back (cont.).
3.2. CHARGE/DISCHARGE CYCLING TEST
Primarily, the cycling test is able to illustrate long term operation stability and can
provide performance information including capacity, voltage, and energy efficiencies in
VRFBs [110, 111]. The performance of a flow battery is mostly studied by galvanostatic
charge/discharge cycles of the redox electrolyte. During the charging process, a slow
increment in voltage with time occurs until the remaining uncharged ions become too
low. Then, a quick increase in voltage occurs to reach the upper limit voltage, which
represents the final status of this process. In a similar way, during the discharging
process, there is a slow decrement in voltage with time until not enough ions are available
to support the discharging rate. Then, a rapid decrease in voltage appears to reach the
lower limit voltage, which is considered the final condition of this process.

92
Two single VRFB cell configurations (TD and ND) are typically assembled, as
described in Section 2 and performed in a constant current mode. During cycling, a
constant current of 500 mA was applied at 1.7/1 V of (upper/lower) potential limits and
maintained at 35 mL/min volumetric flow rate. The voltage was recorded after each time
period (20 seconds) during cycling tests. Four charge/discharge cycles were initially
programmed at the aforementioned experimental conditions. The charge/discharge cycles
of TD cell (shown in Figure 3.2(a)) exhibited high electrochemical reversibility as
anticipated for VRFB systems [112]. Single charge and discharge potential plateaus were
observed, indicating that a single reaction occurred in each half-cell of the flow battery.
The charge/discharge behavior of the ND unit cell is shown in Figure 3.2(b), and
it also exhibited high electrochemical reversibility with a single charge/discharge
potential plateaus. In fact, both cells showed excellent stability over the four cycles;
however, the total run time to achieve four cycles in the TD cell is less than the ND cell.
The decrease in time was associated with the concentration and capacity loss effects,
which come mainly from the shortage in vanadium ions due to electrolyte penetration in
TD, whereas longer operating period in ND is observed due to more available vanadium
electrolyte.

93
(a) (b)
Figure 3.2. Charge/discharge cyclic curves of VRFB. (a) TD cell, (b) ND cell.
Specific information about kinetics, cell overpotential, and battery efficiencies
can also be extracted from battery cycling. CE and EE (VE will be presented with
impedance analysis in another section) for the TD and ND cells at 500 mA applied
charge/discharge current and maintained at 35 mL/min electrolyte flow rate are presented
in Figure 3.3. On average, the ND exhibited a CE of ca. 90.57% and EE of ca. 79.03%
for four charge/discharge cycles. The loss in CE was likely associated with a decrease in
the concentration of active species due to cross-over through the Nafion 117 membrane
and also to parallel side reactions inside each electrode. For the TD cell, the average CE
and EE efficiencies were ca. 84.53% and ca. 74.84%, respectively, for four cycles at
same operating conditions of ND. The CE loss was more noticeable in TD cell as
compared to the ND cell (~ 9% vs. ~ 15%), which can be attributed, besides the ion-
crossover through the membrane, to the fact that TD has a big chance to lose actual
vanadium species due to the permeability of the graphite plate and to the possibility of
V+2 ion oxidation, which comes from the way of assembling TD cell, thus, leading to a

94
reduced amount of electrical charge (main factor in finding CE). Since the CE of TD cell
is lower than the ND cell and the VE is higher (as will see), the energy efficiency (EE),
which is the combination of CE and VE, was lower in TD as compared to the ND cell.
1 2 3 4
65
70
75
80
85
90
Cycle Number
Eff
icie
ncy (
%)
CE of TD
CE of NDEE of TDEE of ND
Figure 3.3. Columbic and energy efficiencies for charge/discharge cycles for both
designs.
3.3. BATTERY STORAGE CAPACITY
It was reported that continued production of H2 and O2 inside electrodes during
cycling besides vanadium ions and water crossover through the membrane (which can
result in an imbalance of SOC in both sides) are the main reasons for battery fading [21].
For both prototypes and specifically the ND configuration, an acceptable energy
efficiency was demonstrated (Figure 3.3). The energy efficiency of the VRFB cells is
directly linked to the battery capacity. Capacity is defined as the amount of electrical
charge that can be removed from the battery under defined discharge conditions, and it is
closely related to the concentration and volume of the redox electrolyte used in the VRFB
system. The stability of capacity in a battery is of great importance for the long-time

95
application. The capacity of the two cells was also investigated over battery cycling in
this work. To do so, the ratio of the discharge capacity of each nth cycle to the 1st
discharge capacity was considered. The evolution of the relative discharge capacity vs.
cycle number plot of both cells was presented in Figure 3.4, where both redox systems
exhibited capacity fade over battery cycling. The rapid capacity decay and low columbic
efficiency in battery TD were caused by vanadium crossover during its operation, likely
V+2 ion oxidation, and electrolyte shortage due to its penetration through the graphite
plate. It has been proved that the positive and negative electrolyte can become
unbalanced due to vanadium crossover and water osmosis [33], thus causing efficiency
and capacity loss in the battery. The ND cell exhibited a continuous capacity fade over
battery cycling in a similar trend to the TD cell. Nonetheless, the ND cell demonstrated a
slower rate of the loss in capacity than the TD cell. For instance, the capacity of the TD
cell faded 35% by cycle 4 as compared to 20% in the ND cell by cycle 4 (Figure 3.3). It
is important to recall that the charge/discharge cycle experiments were performed using
cut-off potential limits; therefore, any cell polarization led to an increase in the total
overpotential, thus leading to an apparent reduction of capacity.

96
1 2 3 4
0.65
0.7
0.75
0.8
0.85
0.9
0.95
Cycle Number
Re
lative D
isch
arg
e C
apa
city
ND cell
TD cell
Figure 3.4. The relative discharge capacity of the VRFB ND and TD cells.
3.4. THE NEW BATTERY BEHAVIOR AT DIFFERENT OPERATING
CONDITIONS
To further understand the behavior and performance of the new design ND, a
typical single charge/discharge cycle tests at three different currents listed in Table 3.1
were performed. It was observed in Figure 3.5(a) that the charge/discharge time (i.e.,
capacity) decreases dramatically with increasing current. The capacity decay at higher
currents can be associated with the increase in overpotential losses as a result of the fast
rate of charging and discharging, which lowers the desired potential value.
Figure 3.5(b) shows the corresponding columbic, voltage, and energy efficiencies
at the same currents. When the applied current increased, the CE was increased due to the
high rate of electrolyte consumption, which in turn minimizes the electrolyte crossover
through the membrane. Also, it can be seen that the VE was decreased at higher currents
values, which can be attributed to the elevated ohmic overpotential losses [113]. The EE
represents the product of CE and VE [114, 115], and since CE is increasing at a rate less
than the rate of VE decreasing, EE decreases as current increases.
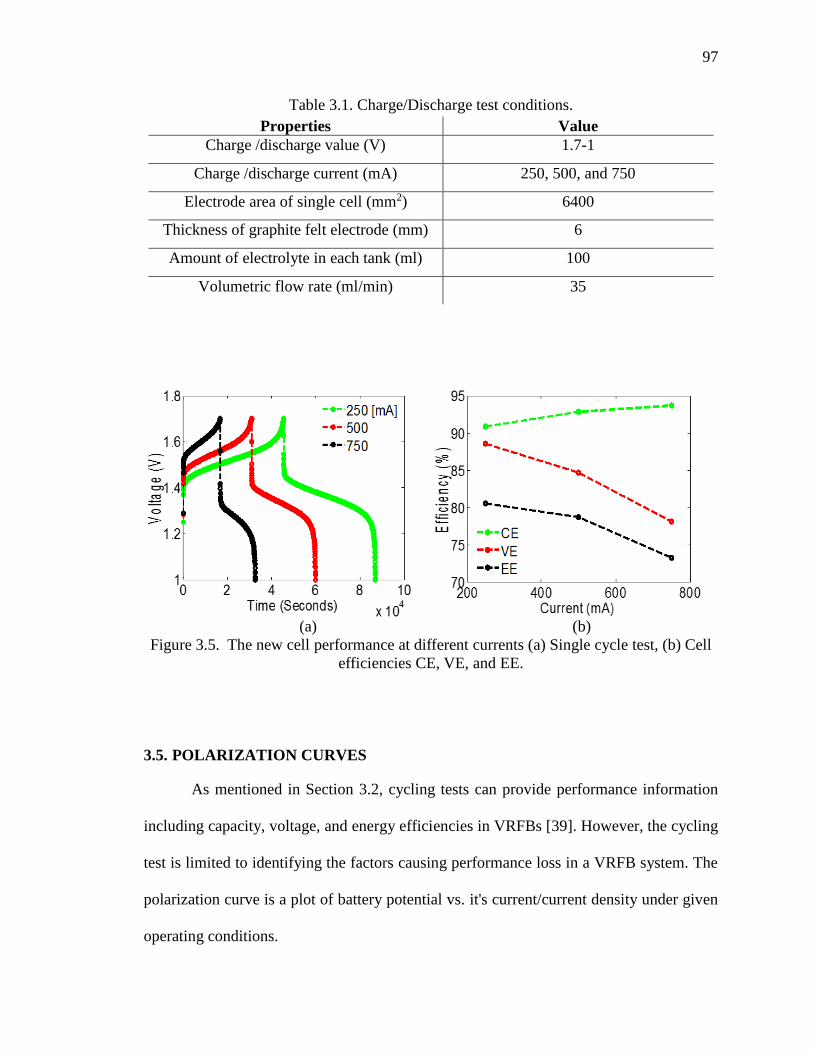
97
Table 3.1. Charge/Discharge test conditions.
Properties Value
Charge /discharge value (V) 1.7-1
Charge /discharge current (mA) 250, 500, and 750
Electrode area of single cell (mm2) 6400
Thickness of graphite felt electrode (mm) 6
Amount of electrolyte in each tank (ml) 100
Volumetric flow rate (ml/min) 35
(a) (b)
Figure 3.5. The new cell performance at different currents (a) Single cycle test, (b) Cell
efficiencies CE, VE, and EE.
3.5. POLARIZATION CURVES
As mentioned in Section 3.2, cycling tests can provide performance information
including capacity, voltage, and energy efficiencies in VRFBs [39]. However, the cycling
test is limited to identifying the factors causing performance loss in a VRFB system. The
polarization curve is a plot of battery potential vs. it's current/current density under given
operating conditions.

98
The discharging polarization curves of the two designs was measured at 25
ml/min flow rate for comparison purposes to illustrate battery performance under
practical conditions, i.e., various ranges of discharge currents. Polarization data were
obtained at steady-state under potentiostatic control. The measurements of discharge
polarization curves were achieved at fully charged battery condition, where steady
current of 40 mA at a cell potential of 1.7 V was maintained. For both designs, the cells
were discharged under a range of current values until 0.1 V lower limit voltage was
reached. A half-minute was specified for each current during discharge; then, the cell was
set up to two minutes as a rest time to represent its open circuit potential (OCP). To get
the data points on the polarization curve, the measured voltage over each half-minute was
averaged during this period, which represents one point on the curve at the specified
current. The generated mass transport limiting currents from the TD and ND were,
respectively, 3250 and 6000 mA for the graphite felt electrodes, as shown in Figure
3.6(a). This difference in maximum limiting current can be attributed to the difference in
electrochemical surface area in both cells. The ND cell, which is based on the same outer
dimensions of the TD cell, can expose more surface area (80×80 mm) as compared to the
TD cell (50×50 mm), which results in a more local current. At a given current across the
battery, the high surface area in the ND cell can reduce the local current on the surface of
the electrode. The lower current density at the electrode surface would lead to lowered
activation overpotential loss.
Figure 3.6(b) presents the corresponding output power curves for both cells. The
output power has a similar tendency as the cell voltage, where the maximum power was
obtained as ~ 2561 mW in the TD and ~2750 mW in the ND (the peak power increases

99
by 7.38%). Also, a wider range of power was observed in ND than in TD due to the
higher produced current.
(a) (b)
Figure 3.6. Discharge polarization curves of the two designs at 25 ml/min flow rate, (a)
Battery discharge voltage, (b) Battery output power.
For the ND cell, the effects of electrolyte transport on polarization were further
investigated by systematically varying the electrolyte flow rate. The flow rate was
controlled by the setting of dosing pumps ranging from 1 to 45 ml/min.
The results of the multi-voltage polarization curves and their corresponding
output powers are shown in Figure 3.7(a) and Figure 3.7(b), respectively. High
electrolyte feed rate can obviously improve mass transport in electrodes, which means
that concentration overpotentials are substantial and a very swift electrochemical reaction
occurs inside each graphite felt. It is reasonable that higher flow rate into the cell can
bring more active species onto the electrode surface to support the redox reaction to

100
generate higher current. It is noticed that the limiting current can be increased (from 425
to 650 mA) at an analog range of flow rates (from 1 to 45 ml/min).
(a) (b)
Figure 3.7. Discharge polarization curves of the ND at a range of electrolyte feed rates (a)
Battery discharge voltage, (b) Battery output power.
Despite the improvement in the output current and power for the new design, it is
important to notice the approximately linear shape of the polarization curves, where the
normal mass transport region of polarization curves is not shown clearly as we should
expect from the polarization curve due to the sharp slope of potential drop. Such a
phenomenon is mainly caused by the rapid change in the ohmic resistance as discussed
below.
It was observed that adopting graphite felt as a porous electrode in vanadium
redox flow battery systems was the main reason of ohmic resistance that affects the cell
performance, which becomes more dominant at higher applied currents due to the
relatively high electrode thickness [116]. Generally, the porous electrode, flow field plate

101
bulk resistivities, and the contact resistance between them (the latter was considered the
main source of internal ohmic resistance, IOR, of VRB) were considered the most
parameters that affect the cell performance. We guess this new design has high IOR (as
can be seen from the Electrochemical Impedance Spectroscopy (EIS) test results next
Section) due to the large contact resistance (no much contact) between the small portion
of graphite rod (which works as a current collector) inside PVC compartment and the
graphite felt electrode. Loose contact between the current collector, graphite rod, and the
graphite felt electrode inside the flow field house can lead to significant contact
resistance. The sharp potential decay becomes more and more significant at higher
polarization currents due to the increased impact of contact resistance, leading to higher
overpotentials.
3.6. ELECTROCHEMICAL IMPEDANCE SPECTROSCOPY TEST (EIS)
In order to further study the electrochemical behavior of the ND, an EIS test was
conducted under almost fully charged operating conditions at 1.7 V and 35 ml/min. The
EIS was conducted with potential-controlled electrochemical impedance spectroscopy
over an AC frequency range of 20 kHz to 0.01 Hz and with 10 mV perturbation
amplitude. During an EIS measurement, small AC perturbation/signals (potential or
galvanic) of varying frequency are applied to the electrochemical (flow battery) device,
and the resulting ratios of voltage to current are determined and plotted as implicit
functions of signal frequency. [36, 117]. The Nyquist plots for the two prototypes were
plotted in Figure 3.8(a), where the original data were fitted by a circuit diagram model
R(CR)(CRW) [118]. The high-frequency intercept at Z1 axis corresponded to the battery
internal resistance, which can reveal the ohmic loss during battery operation. It can be
seen that the ND cell has higher ohmic resistance (~ twice) compared to the TD (0.27 vs.

102
0.135 Ω, respectively), which could be mainly due to the high contact resistance, as
discussed above. In addition, Figure 3.8(b) demonstrates the voltage efficiency vs. cycle
number of ND and TD cells. It can be seen that the average VE over four cycles of ND
cell (~86.21%) is lower than the TD cell (~88.55%). This difference can be associated
with the ohmic losses registered for each type, where the EIS test showed higher ohmic
resistance in the ND cell. Both configuration types also started to exhibit a slight voltaic
efficiency decay (associated with the increases in the cell overpotential). The EE fade
shown in (Figure 3.4) was related to the increases in the cell overpotential that directly
affected the VE of the VRFB cells. Therefore, it was suggested that the storage capacity
of the VRFB cells was decreasing over time.
(a) (b)
Figure 3.8. Comparison of the impedance and voltage efficiency of the ND and TD cells
(a) EIS measurements, (b) Voltage efficiency vs. cycle numbers.

103
3.7. CONTACT RESISTANCE IMPROVEMENT
In this section, a second-long PVC cell (LC) has been fabricated and tested with
the goal of reducing the contact resistance between the current collector and electrode.
This cell shares the same components of the ND cell (described above) except the shape
and the size of electrode area (255 × 28 mm2), as shown in Figure 3.9(a). A pure
compressible graphite sheet of 1/16-inch thickness from McMaster-Carr was used to
serve as a flow field channel and current collector. Since the electrode area of the ND (64
mm2) is less than the LC (71.4 mm2), the polarization potentials and their corresponding
powers were measured and compared against the current density (mA/cm2) at the same
practical operating conditions, as shown in Figure 3.9(b). It can be seen that higher
current density can be obtained from the modified cell, LC, due to the larger contact area
between the current collector and electrode, resulting in lower contact resistance. For
instance, the maximum current density of the ND cell at 1 and 45 ml/min volumetric flow
rates is 66.41 and 101.56 mA/cm2, respectively, whereas it is 73.53 and 115.55 mW/cm2
for the LC cell at the same flow conditions. Also, the maximum obtained power density
of the ND cell at the same flow conditions is 37.25 and 45.33 mW/cm2, respectively,
whereas it is 43.59 and 53.67 mA/cm2 for the LC cell. The improvement in the maximum
current density and output power density can be attributed to the new configuration of
current collector, which ensures more contact area between the current collector and
electrode surface, reducing the internal resistance of the cell. The impedance analysis test
of the LC cell was also conducted and compared with the ND cell, as shown in Figure
3.9(c). A lower ohmic resistance in LC than in ND was observed (0.18 vs. 0.27 Ω,
respectively).

104
(a)
(b)
Figure 3.9. The long PVC cell design (a) The new LC configuration and components, (b)
The polarization potential (left) and corresponding power density (right) measurements of
LC and ND cells, (c) The impedance analysis data of LC and ND cells.

105
0 0.2 0.4 0.6 0.80
0.1
0.2
0.3
0.4
Z1 (Ohm)
Z2
(O
hm
)
LC cell
ND cell
(c)
Figure 3.9. The long PVC cell design (a) The new LC configuration and components, (b)
The polarization potential (left) and corresponding power density (right) measurements of
LC and ND cells, (c) The impedance analysis data of LC and ND cells (cont.).
3.8. ECONOMIC PERSPECTIVES ANALYSIS
Based on same exterior dimensions of TD and ND designs (i.e., 120×120 mm), a
cost comparison has been performed. The ND single VRFB cell (based on PVC material)
shares the same initial cost of some components in the TD cell (based on graphite plate
material) such as electrolyte solution amount, external tubing, membrane, bolts,
electrodes, pumps, labor, molds, and energy consumption to prepare the solution and
machine the flow field. However, other components have different costs, and Table 3.2
shows the cost difference between the two designs. It is also worth mentioning that the
gross weight of the new single cell design is 0.78 kg without any leaking issues, while the
traditional cell weighs 1.1 kg, besides the issues of electrolyte leaking from the graphite
plate, as discussed in Section 3.1. As a result, the new design assembly is more cost-
effective, requires fewer components, and has less weight than the traditional setup. In

106
another word, the new design cost represents ~ 17% of the traditional cell for the non-
similar components, and ~ 65% including all components.
Table 3.2. Non-similar components cost comparison.
Single cell components Traditional design cost in
dollar New design cost in dollar
Graphite plate OR PVC
sheet 23.7×2 9.96×2
Gaskets 7 ----
Insulators 7 ----
End plates 51×2 ----
Current collectors ----- 7.47
All other components ----- ----
Total $ 163.4 $ 27.39

107
4. CONCLUSIONS
A new cost-effective assembly design for VRFB applications was fabricated and
tested in the current work. The new cell shows perfect proof of preventing electrolyte
leakage during the 100 hours of permeability test as compared to the traditional cell
design. It is also more lightweight, costs less, is easy to assemble, and has more
mechanical strength than the brittle graphite plate, which ensures longer lifetime,
especially in harsh environments exposed to shocks and vibrations. The performance of
this assembly after four cycles showed higher average columbic and energy efficiencies
than the traditional cell, which leads to less capacity degradation during cycling at the
same operating conditions. Polarization measurements of this new design showed that
high feed rate of electrolyte solutions into both sides of a battery cell can immediately
increase output capacity of the battery. A higher power was obtained with the new cell as
a result of the higher output current due to the larger electrochemical surface area, which
is utilized in this design based on the same outer dimensions for both cells.
The single cycle test of the ND cell further demonstrated the applicability of this
design in VRFB applications by reflecting the normal qualitative behavior of the
traditional VRFB system; however, polarization curves at different flow rates showed a
quick drop in voltage before reaching the mass transport region, which could reduce the
limiting currents and corresponding output power due to the high IOR. This issue has
been treated by introducing a new design, LC, in which the contact resistance between
the current collector and electrodes was reduced, and the obtained results showed higher
current and power densities compared to the ND cell. Many other approaches can be
implemented to minimize the contact resistance, such as utilizing either high electrical

108
conductive current collectors or covering the rib areas among flow channels with a good
electrical conductive deposit, which can provide more active contact areas with graphite
felt electrode to carry more electrons into and out of the cell core.

109
REFERENCES
1. Bartolozzi, M., Development of redox flow batteries. A historical bibliography.
Journal of Power Sources, 1989. 27(3): p. 219-234.
2. Dunn, B., H. Kamath, and J.-M. Tarascon, Electrical energy storage for the grid:
a battery of choices. Science, 2011. 334(6058): p. 928-935.
3. Sum, E., M. Rychcik, and M. Skyllas-Kazacos, Investigation of the V (V)/V (IV)
system for use in the positive half-cell of a redox battery. Journal of Power
sources, 1985. 16(2): p. 85-95.
4. Wang, W., et al., Recent progress in redox flow battery research and
development. Advanced Functional Materials, 2013. 23(8): p. 970-986.
5. De Leon, C.P., et al., Redox flow cells for energy conversion. Journal of Power
Sources, 2006. 160(1): p. 716-732.
6. Moore, M., et al. Sensitivity Analysis of Design Variables of an All-Vanadium
Redox-Flow Battery. in Meeting Abstracts. 2011. The Electrochemical Society.
7. Ito, H., et al., Effect of through-Plane Polytetrafluoroethylene Distribution in a
Gas Diffusion Layer. ECS Transactions, 2014. 64(3): p. 501-508.
8. Cooper, J.S., Design analysis of PEMFC bipolar plates considering stack
manufacturing and environment impact. Journal of Power Sources, 2004. 129(2):
p. 152-169.
9. Heinzel, A., et al., Injection moulded low cost bipolar plates for PEM fuel cells.
Journal of Power Sources, 2004. 131(1): p. 35-40.
10. Heinzel, A., F. Mahlendorf, and C. Jansen, Bipolar plates. Fuel Cells—Proton-
Exchange Membrane Fuel Cells, Elsevier, New York, 2009.
11. Wind, J., et al., Metallic bipolar plates for PEM fuel cells. Journal of Power
Sources, 2002. 105(2): p. 256-260.
12. Davies, D., et al., Stainless steel as a bipolar plate material for solid polymer fuel
cells. Journal of Power Sources, 2000. 86(1): p. 237-242.
13. Wang, H. and J.A. Turner, Ferritic stainless steels as bipolar plate material for
polymer electrolyte membrane fuel cells. Journal of Power Sources, 2004. 128(2):
p. 193-200.

110
14. Hornung, R. and G. Kappelt, Bipolar plate materials development using Fe-based
alloys for solid polymer fuel cells. Journal of Power Sources, 1998. 72(1): p. 20-
21.
15. Makkus, R.C., et al., Use of stainless steel for cost competitive bipolar plates in
the SPFC. Journal of power sources, 2000. 86(1): p. 274-282.
16. Cho, E., et al., Characteristics of composite bipolar plates for polymer electrolyte
membrane fuel cells. Journal of Power Sources, 2004. 125(2): p. 178-182.
17. Kuan, H.-C., et al., Preparation, electrical, mechanical and thermal properties of
composite bipolar plate for a fuel cell. Journal of Power Sources, 2004. 134(1): p.
7-17.
18. Lee, Y.K., et al., Activation energy and curing behavior of resol‐and novolac‐type
phenolic resins by differential scanning calorimetry and thermogravimetric
analysis. Journal of applied polymer science, 2003. 89(10): p. 2589-2596.
19. Lee, N.J., et al., Development of carbon composite bipolar plates for vanadium
redox flow batteries. Bulletin of the Korean Chemical Society, 2012. 33(11): p.
3589-3592.
20. https://en.wikipedia.org/wiki/Polyvinyl_chloride. Available from:
https://en.wikipedia.org/wiki/Polyvinyl_chloride.
21. Watt‐Smith, M.J., et al., The importance of key operational variables and
electrolyte monitoring to the performance of an all vanadium redox flow battery.
Journal of Chemical Technology and Biotechnology, 2013. 88(1): p. 126-138.
22. Skyllas-Kazacos, M., et al., Characteristics and performance of 1 kW UNSW
vanadium redox battery. Journal of Power Sources, 1991. 35(4): p. 399-404.
23. Shinkle, A.A., et al., Electrode kinetics in non-aqueous vanadium acetylacetonate
redox flow batteries. Journal of Applied Electrochemistry, 2011. 41(10): p. 1191-
1199.
24. Tang, A., J. Bao, and M. Skyllas-Kazacos, Dynamic modelling of the effects of ion
diffusion and side reactions on the capacity loss for vanadium redox flow battery.
Journal of Power Sources, 2011. 196(24): p. 10737-10747.
25. Sun, C., et al., Investigations on transfer of water and vanadium ions across
Nafion membrane in an operating vanadium redox flow battery. Journal of Power
Sources, 2010. 195(3): p. 890-897.

111
26. Hwang, G.-J. and H. Ohya, Crosslinking of anion exchange membrane by
accelerated electron radiation as a separator for the all-vanadium redox flow
battery. Journal of Membrane Science, 1997. 132(1): p. 55-61.
27. Chen, D., et al., Selective anion exchange membranes for high coulombic
efficiency vanadium redox flow batteries. Electrochemistry Communications,
2013. 26: p. 37-40.
28. Chen, D., et al., Optimizing membrane thickness for vanadium redox flow
batteries. Journal of membrane science, 2013. 437: p. 108-113.
29. Xu, Q., T. Zhao, and C. Zhang, Effects of SOC-dependent electrolyte viscosity on
performance of vanadium redox flow batteries. Applied energy, 2014. 130: p.
139-147.
30. Yuan, X., et al., AC impedance technique in PEM fuel cell diagnosis—A review.
International Journal of Hydrogen Energy, 2007. 32(17): p. 4365-4380.
31. Kong, C.S., et al., Influence of pore-size distribution of diffusion layer on mass-
transport problems of proton exchange membrane fuel cells. Journal of Power
Sources, 2002. 108(1): p. 185-191.
32. Song, J., S. Cha, and W. Lee, Optimal composition of polymer electrolyte fuel cell
electrodes determined by the AC impedance method. Journal of Power Sources,
2001. 94(1): p. 78-84.

112
III. DEVELOPMENT OF A DISTRIBUTED VANADIUM REDOX FLOW
BATTERY FOR TRANSPORT SYSTEMS
ABSTRACT
In general, a vanadium redox flow battery (VRFB) is considered suitable only for
stationary applications because of its low energy and power density. With a new design
that can generate higher power per cell unit volume without material changes, however,
VRFB can also open up the possibility of being applied to other fields such as
transportation. This study consists of designing, fabricating, and testing two new types of
VRFB configurations that can serve as distributed VRFBs for fully operational transport
systems using two vanadium redox couples. The first design assembles into a tubular cell
configuration, and the other solves the first design problems with a long rigid flat cell,
which is impermeable PVC (polyvinyl chloride) sheet to replace the brittle and porous
graphite flow plate. According to a comparative study using conventional flow battery,
the new two designs provide significant benefits for transportation applications such as
safety, space efficiency, and charge time.
Through tests including cycling, impedance analysis, and polarity under various
load conditions for current and flow rate, the proposed design demonstrates that it can
function as an energy storage device, comparable to conventional cells. In particular,
tubular designs have shown that under certain geometric conditions, larger electrode
active areas can be created than in planar shapes, resulting in higher power density.
However, some improvements are still required, including the following: (1) reducing
contact resistance between components; (2) applying a uniform pressure to the cathode
and anode sides and designing a new configuration with different orientations to utilize

113
the entire electrode area; and (3) using a flow field channel to distribute the electrolyte
flow in a uniform manner and minimize mass transport overpotential.

114
1. INTRODUCTION
The need to find a new source of clean energy with higher efficiency and less
overall impact on the environment is growing with the increasing worldwide demand for
energy. This has led to the development of high potential energy storage technologies
[119-131]. Due to the desirable characteristics of vanadium redox flow battery (VRFB)
such as long cycle life, design flexibility, energy and power separation, and tolerance to
deep discharge, it is considered a new promising technology among various technologies
for large-scale stationary applications [20, 35, 132, 133]. A VRFB can be broken into
three main components: the anode, polymer membrane, and cathode. At the anode and
cathode sides, the negative/positive couples (anolyte/catholyte) diffuse through a porous
graphite felt electrode and they are circulated between the external tanks and the
electrodes by a pump. The polymer membrane acts as an electrolyte and an electrical
insulator, separating the anode and cathode sides while allowing proton transport. VRFB
is an electrochemical energy conversion device that takes energy provided by vanadium
redox couples (V2+/V3+ in the negative and V4+/V5+ in the positive half-cells) to produce a
current of electrons (i.e., electricity). During discharge, an oxidation reaction in the anode
side occurs and electrons are released. The electrons then move through an external wire
to the cathode side, where the reduction process takes place to achieve positive work.
During charge, the opposite direction of the redox reaction occurs, as depicted in Figure
1.1.

115
Figure 1.1. Schematic diagram of VRFB.
Despite the advantages of VRFB technology, many challenges still exist, such as
effective flow control, cell/stack geometry structure, intrinsically low specific energy,
economic efficiency, and improvement of new materials of cell components such as
membrane, electrodes, and electrolytes to enhance the battery’s system performance and
its commercial application [62, 133-137].
Up to now, all research efforts (numerical and experimental work) has been
focused on flat VRFB designs (planar geometries) because it is a straightforward design
that uses a brittle and porous graphite flow field plate. Corresponding to the documented
experimental work, different patterns of flow field channels such as parallel, serpentine,
and interdigitated, have been achieved to study the overall VRFB performance, and the
results showed that a cell with a serpentine pattern provided the best battery efficiency
among them, which can be attributed to the dual impact of better voltage efficiency and
lower pumping power losses [75]. The parallel flow field design of a VRFB was selected
to describe the distribution of electrolyte solution through an experimental and numerical

116
study [77], and the simulated results were in good agreement with those obtained from
experiment work. Temperature impact on the capacity degradation and columbic
efficiency of a single cell VRFB setup has been conducted under different operating
conditions [138], and it is found that increasing the temperature from 15 to 55 oC can
increase both voltage efficiency and peak discharge power density, while current
efficiency slightly decreases. A polarization study was performed to investigate the
performance of two VRFB cells with a serpentine flow channel and without a flow field
[28], and it was concluded that the kinetics and mass transport losses are not significant
compared to the internal resistance losses for cells with a serpentine flow field.
The goal of this work is to develop a radical new flow battery cell optimized for
use in electric vehicles or any other type of transport system that requires a clean power
source by designing, fabricating, and experimentally testing novel tubular-shaped and
long planar PVC configuration cells. A tubular-shaped VRFB has several advantages
compared to a planar-shaped cell, namely (1) it can be performed at any orientation; (2)
for specific geometries, it can provide a larger active area without increasing the overall
cell volume; (3) it has lower fabrication cost because of decreased volume; and (4) it does
not require other components such as gaskets, endplates, and bolts. The new flow battery
systems are innovations that will create a new market and a valuable network of energy
supplies for transport systems by resolving the key obstacles of current battery
technology. The main obstacles involve long charging time, safety concerns, and poor
cycle life. The key innovation is to make a looped flow tube (which is currently just
being used as an input/output supply path) with larger sites of the active area for
electrochemical reactions. This will enable the development of a battery system that can

117
become an energy distribution system much like what has been used in direct methanol
fuel cell (DMFC) systems [139, 140]. This has many advantages over conventional
lumped systems such as lithium-ion batteries. The results will be 1) reduction of the
charging time for a battery by refueling like a conventional combustion vehicle [141], 2)
more efficient utilization of space since the battery system could be embedded into the
structure of the vehicle, 3) independent control of power and energy, where power can be
increased by using a larger loop that winds through the structure of the vehicle, and
energy can be increased by increasing the size of the fuel tank and electrolyte
concentration [133, 137, 140, 142], and 4) significantly improved battery cycle life
because the system will not involve any mechanical degradation mechanisms such as the
large volume change that are characteristic of high-energy lithium-ion batteries [141,
143, 144]. Recently, novel redox species of aqueous and non-aqueous systems have been
explored to overcome the issue of low energy density and to improve the cell’s potential
upper limit [145-148]; these new materials can also be applied in the proposed system.
Figures 1.2(a), 1.2(b), and 1.2(c) are the VRFB schematic diagrams of a novel tubular
cell, a half PVC planar cell, and a half traditional cell, respectively.

118
(a)
(b)
(c)
Figure 1.2. Schematic diagrams of the proposed distributed and traditional flow cells. (a)
Tubular cell, (b) Half PVC planar cell, (c) Half traditional cell.

119
2. ACTUAL ELECTRODE AREA ANALYSIS
A simple analytical analysis of a single VRFB cell is adopted in a similar way to
the DMFC system [140]. This analysis reveals that the tubular VRFB cell can have larger
electrochemical active area than the planar cell under specific geometry conditions for
same total volume, which eventually leads to higher output current and power. Figure 2.1
shows the 2D tubular (left) and planar (right) cells under the assumption of having same
characteristic length ( ) and total volume (V).
Figure 2.1. A 2D front-view drawing of the active area of two cells (left: tubular cell,
right: planar cell).
The total volume of each configuration can be expressed as follows:
(1)
where r is the outer radius of the tubular cell, which can be formulated in the following
form:
(2)

120
Now, the ratio of the active area to the total volume of the tubular cell to the same
ratio of the planar cell is presented as follows:
(3)
Substituting Eq. (2) into Eq. (3) leads to the following final formula:
(4)
By utilizing Eq. (4), the tubular cell can have larger active surface area than the planar
cell under the following specific geometry condition:
(5)
This geometric condition is reasonable for small-scale cells in portable applications,
which reflects the importance of tubular configuration to provide more electrode surface
area compared to the planar cell.

121
3. THE EXPERIMENTAL APPROACH DETAILS
In this study, two single cells as distributed VRFB and a third traditional cell have
been experimentally performed. First, the tubular cell (TC) was constructed, which
consisted of a proton exchange membrane, electrodes, electrolyte distributors (nozzles),
and current collectors. The proton exchange membrane was constructed out of Nafion
212 (15 x 15 cm in area with a thickness of 25.7 µm, Fuel Cell Store, Texas, USA). The
electrodes were composed out of graphite felt (GFA6, SGL Technologies GmbH), where
the cathode and anode had uncompressed thicknesses of 3 mm and 6 mm respectively.
The graphite felt making up the anode has dimensions of 3.5 x 12 cm, while the cathode
had dimensions of 7 x 12 cm, making both electrodes the same volume (25.2 cm3). Two
nozzles constructed out of PVC material were used as electrolyte distributors, where one
nozzle can separately deliver the catholyte and anolyte to each respective electrode, and
the other can return the electrolytes into their tanks. One graphite rod (McMaster-Carr,
1/4 in. thickness, and 2.5 in. side length) was inserted into the anode (inner side), while
two rods were inserted into the cathode (outer side), which served as the current collector.
Each rod was attached to the polytetrafluoroethylene (PTFE) wrapped copper wires to
allow current to leave/enter the cell. These components were then systematically
assembled to create the tubular cell. The graphite felt making up the anode was first
rolled into a tubular shape and then firmly wrapped in the proton exchange membrane
three times to separate the anolyte and catholyte electrolytes. The graphite felt making up
the cathode was then rolled around the anode–membrane assembly to form the equivalent
of a cell stack. The stack assembly was then inserted into a vinyl tube that would act as
the outer wall of the cell. The membrane was then attached to the inner nozzles of the

122
electrolyte distributors in such a way to prevent electrolyte mixing. The outer vinyl tube
was then attached with PVC glue to the outer nozzles of the electrolyte distributors to
prevent air penetration, thus forming the completed cell assembly. The second cell refers
to the long cell (LC), in which a thermoplastic material PVC from McMaster-Carr was
used to replace the graphite plate in traditional VRFB cells. The outer dimension of the
half PVC cell was 27.5 × 4.8 cm with 1.27 cm thickness. The graphite felt electrode, 25.5
× 2.8 cm with 6 mm thickness, sat inside an engraved rectangular pocket in the main
PVC sheet. Proton exchange membrane (Nafion 117 with 0.183 mm thickness, Fuel Cell
Store, Texas, USA) was used to separate the two different electrolytes and to allow only
proton passing. Also, a pure compressible graphite sheet of 1/16 in. thickness from
McMaster-Carr was used to serve two functions, as flow field channels and current
collector. The flow field had three channels of 4 × 1.6 mm2 cross section areas with a land
width of 4 mm among the channels, which was machined by water-jet technique. Each
half cell had one copper wire, which was rolled around part of the compressible graphite
sheet inside the cell and then wrapped with PTFE tape. Afterwards, the wire was pulled
out to connect the battery tester terminals for the measurements. The depth of the PVC
pocket was 6.6 mm, and it was purposely made less than the sum of the original electrode
and flow channel thicknesses to accomplish approximately 16.5% compression ratio,
where the graphite felt electrode compression ratio was limited to 1 mm. The two cell
halves were combined together with a total of 24 stainless steel bolts distributed in a
uniform way along the PVC boundary to make a compact cell with no leaking. The last
cell stood for the traditional design (TD) cell, the most common VRFB cell in literature,
where the serpentine flow channels cut in a graphite plate. The cell was composed of

123
almost the same components of LC design except the electrode and membrane
dimensions (5 × 5 cm2), including PTFE (polytetrafluoroethylene) gaskets and electric
insulators from McMaster-Carr, USA to avoid electrolyte leakage among the assembled
components and to prevent electronic current to go away from the flow field plate to
endplates. Two Garolite sheets from Fuel Cell Store, Texas, USA were used as endplates
with 12 × 12 cm2 outer dimensions to offer excellent strength and good electrical
insulation with a total of 12 bolts distributed in a uniform way along the endplate
boundary to compact the cell components with no leaking. A high-density polyethylene
(HDPE) material for tubing, compression fittings (1/8 NPT × 1/4 in. OD tube), and tanks
was used to feed the electrolyte solution into the cell stack from external tanks and vice
versa by two pumps. Figures 3.1(a), 3.1(b), and 3.1(c) show the assembled tubular, PVC
planar, and traditional cells with their experimental units, respectively.
For all VRFB prototypes, the electrolyte solution of vanadium (V+4) was prepared
in lab temperature ~24 oC via dissolving 1.04 M VOSO4.xH2O (99.9% wt. purity, Alfa
Aesar) in 4 M sulphuric acid solution. After fully charging the two cells, the amount of
anolyte and catholyte of both cells was 100 ml in each tank. Both the anolyte and
catholyte were pumped to the cell electrodes by two pumps (SMART Digital DDA7.5-
16AR-PVC/V/C, Grundfos, Bjerringbro, Germany) from tanks and vice versa. The upper
and lower limits during charging/discharging operations were set to 1.7 V and 1 V,
respectively, by using the constant current method. A fully charged condition was held
when the cell was first charged at constant current, 500 mA, until reaching 1.75 V cell
voltage, then further charging was conducted at constant voltage 1.75 V until the current
dropped to 40 mA. In the first charging (where 100 ml of V4+ electrolyte solutions was

124
placed in anode side tank and 200 was placed in cathode side tank for all cells), V4+ was
transformed into V5+ and V2+ in both solutions (catholyte and anolyte for all cells,
respectively). Afterwards, half of the catholyte amount was taken away after observing
new colors on both sides (i.e., violet in the anode side and yellow on the cathode side).
The voltage was recorded after each time period (20 seconds) in cycling tests. All the test
measurements, including charging/discharging plots, polarization curves, and impedance
analysis data were performed with (4 Channel Battery Analyzer, BST8-20A-CST, MTI
Corporation, CA 94804, USA) at different operating conditions. The obtained results are
discussed below.
(a)
Figure 3.1. The assembled cells with their experimental units. (a) TC cell, (b) LC
cell, (c) TD cell.

125
(b)
(c)
Figure 3.1. The assembled cells with their experimental units. (a) TC cell, (b) LC cell, (c)
TD cell (cont.).

126
4. RESULTS
4.1. CYCLING PERFORMANCE
The cycling test is able to show the long-term capacity and efficiency loss due to
self-discharge and side reactions, and it can also partially reflect battery activation loss
[110, 111]. Charging/discharging tests for all cells were conducted using the same test
equipment to investigate their performance. The cycling currents were 750 mA for the
TC cell and 500 mA for the LC and TD cells at 35 ml/min volumetric flow rate. The
charging and discharging voltage limits were 1.7 V and 0.9 V for the TC cell and 1.7 V
and 1 V for the LC and TD cells. Figures 4.1(a), 4.1(b), and 4.1(c) present the cyclic
behaviors of the units TC, LC, and TD, respectively. All prototypes show stable and high
electrochemical reversibility performance under repeated cycles (four cycles) at the
aforementioned experimental conditions. A single charge and discharge potential plateau
was observed, indicating that a single reaction occurred in each half-cell of the flow
battery. However, it was observed that the total run time to achieve four cycles of the TC
cell was less than the other cells. The fast decrease in time of TC cell was mainly
associated with the higher applied current during cycling, 750 mA, which can reduce the
cell capacity, and to the large contact resistance among cell components, leading to
higher ohmic resistance. Although the same current, 500 mA, was applied in TD and LC
cells, the discharge capacity time of TD was less than LC, which can be attributed to the
vanadium penetration (shortage in vanadium concentration) through the porous graphite
plate during the four-cycle test.

127
(a) (b)
0 5 10 15
x 104
1
1.2
1.4
1.6
1.8
Time (Seconds)
Voltage (
V)
(c)
Figure 4.1. Charge/discharge curves over four cycles (a) TC cell, (b) LC cell, and (c) TD
cell.
Columbic efficiency (CE), voltage efficiency (VE), and energy efficiency (EE)
are considered to be among the common features that can detect the VRFB performance
through cycling tests [23, 149-152], which are defined as follows:
The CE represents the ratio of the actual amount of charges used during the discharge
process to the actual charges used during the charging process:

128
(6)
where is charging time and is discharging time. Having a very low vanadium
permeability membrane can lead to ~100% CE [137, 153-157].
The VE represents the ratio of the average discharge voltage to the average charge
voltage:
(7)
The EE equals the product of VE and CE:
(8)
Figure 4.2 illustrates the average CE, VE, and EE of the TC, LC, and TD cells
over four cycles at the aforementioned operating conditions. It is obvious that the TC cell
has less average voltage and energy efficiencies (70.25% and 64.43%) compared to the
other two cells, LC and TD, (90.12%, 83.12% and 88.54%, 74.84%, respectively) due to
the high contact resistance among the cell components. In addition, lower CE was
obtained in the TD cell (84.52% compared to 92.23% and 91.71% for the LC and TC
cells, respectively), due to the lost amount of vanadium penetration through the porous
graphite plate.

129
1 2 30
20
40
60
80
100
Cell Type
Eff
icie
ncy (
%)
CE
VE
EE
LC TDTC
Figure 4.2. Charge/discharge average efficiency over four cycles for LC, TC, and TD
cells.
A typical single charge/discharge cycle test at a range of current values was also
conducted to further evaluate the applicability of the new distributed VRFB designs, as
shown in Figures 4.3(a) and 4.3(b) for the TC and LC cells, respectively. It can be seen
for all cells that increasing the current decreases the charge/discharge time (capacity) in a
dramatic way, which reflects the normal behavior of all battery systems. At higher
currents, the capacity decay can be related to the increase in overpotential losses as a
result of the fast charging and discharging rates, which lowers the desired potential value.
Table 4.1 also presents the corresponding CE, VE, and EE at each applied current, and it
clearly shows that increasing current results in higher CE values due to the high rate of
electrolyte consumption, which in turn minimizes the electrolyte crossover through the
membrane [137, 142, 150, 152, 155, 157]. Higher ohmic overpotential losses can also be
obtained as current increases [113], which results in lower VE values. Since CE increases
at a rate less than the decreasing rate of VE, EE decreases as current increases. As
discussed above, the values of VE (the main factor in finding EE) and EE in the TC cell

130
were less than in the LC cell at the applied current range (shown in Table 4.1) of the
single charge/discharge test.
(a) (b)
Figure 4.3. Typical single charge/discharge curves as a function of the current for VRFB
cells. (a)TC, (b) LC.
Table 4.1. Efficiencies of the single TC and LC VRFB cells.
Current (mA) CE (%) VE (%) EE (%)
TC LC TC LC TC LC TC LC
500 250 92.891 92.214 72.365 92.865 67.220 83.790
750 500 94.369 94.165 68.124 86.358 64.288 81.319
1000 750 95.956 95.565 63.659 80.963 61.084 77.372

131
4.2. POLARIZATION MEASUREMENTS
The discharge polarization curves are plots of the flow cell potential under a range
of applied currents to identify the main three regions of losses. Figure 4.4(a) (left and
right) compares the discharge polarization and corresponding power data, respectively, of
the three cells at 1 ml/min flow rate. All the tests were conducted at fully charged
conditions (charging the cell at 1.7 V until 40 mA steady state current was obtained).
Regardless of the different actual electrode areas used in all cells, it can be seen that the
TC cell suffers from a quick potential drop due to the high overpotential losses, which
becomes more significant at high current values. Since the LC cell has higher electrode
surface area and lower overpotential losses (higher VE), the maximum obtained current
(5500 mA) is much higher than the current in the TC and TD cells, 3250 and 2250 mA,
respectively.
The new distributed flow cells, TC and LC, were further investigated by studying
the electrolyte transport effect on the cell potential and corresponding power
measurements under a range of flow rates, as shown in the Figures 4.4(b) and 4.4(c),
respectively. A high flow rate can obviously increase the maximum current (reduce the
mass transport overpotential effect) by bringing more active species onto the electrode
surface to support the redox reaction. It is noticed that the limiting current can be
increased (from 3250 to 3750 mA) in the TC cell and (from 5550 to 8250 mA) in the LC
cell at an analog range of flow rates from 1 to 45 ml/min.
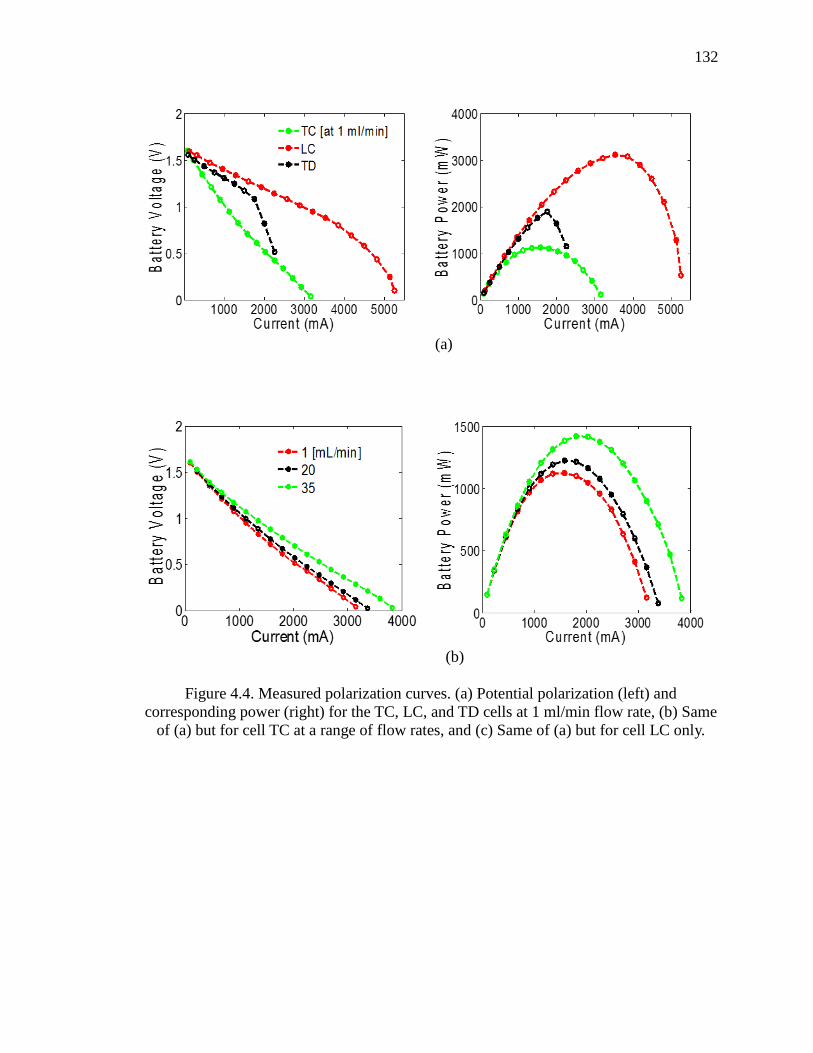
132
(a)
(b)
Figure 4.4. Measured polarization curves. (a) Potential polarization (left) and
corresponding power (right) for the TC, LC, and TD cells at 1 ml/min flow rate, (b) Same
of (a) but for cell TC at a range of flow rates, and (c) Same of (a) but for cell LC only.

133
(c)
Figure 4.4. Measured polarization curves. (a) Potential polarization (left) and
corresponding power (right) for the TC, LC, and TD cells at 1 ml/min flow rate, (b) Same
of (a) but for cell TC at a range of flow rates, and (c) Same of (a) but for cell LC only
(cont.).
4.3. ELECTROCHEMICAL IMPEDANCE TEST ANALYSIS
An electrochemical impedance spectroscopy test under fully charged condition at
35 ml/min was conducted to characterize the full voltage losses of the three cells. The
Nyquist impedance was plotted in Figure 4.5 over an AC frequency range of 20 kHz to
0.01 Hz and with 10 mV perturbation amplitude, where a circuit diagram model
R(CR)(CRW) was implemented to fit the original data [118]. The high-frequency
intercept with the real axis (Z1) corresponded to all ohmic processes in the battery, which
includes both the ionic and electronic resistance in the graphite electrode in addition to
the ionic resistance from charge transfer through the membrane. It is obvious that the TC
cell has higher ohmic resistance (0.5 Ω) compared to LC and TD cells (0.178 and 0.135
Ω, respectively), which explains the lower VE of TC due to the high contact resistance
among cell components. The impedance measurement of the TC cell also shows much
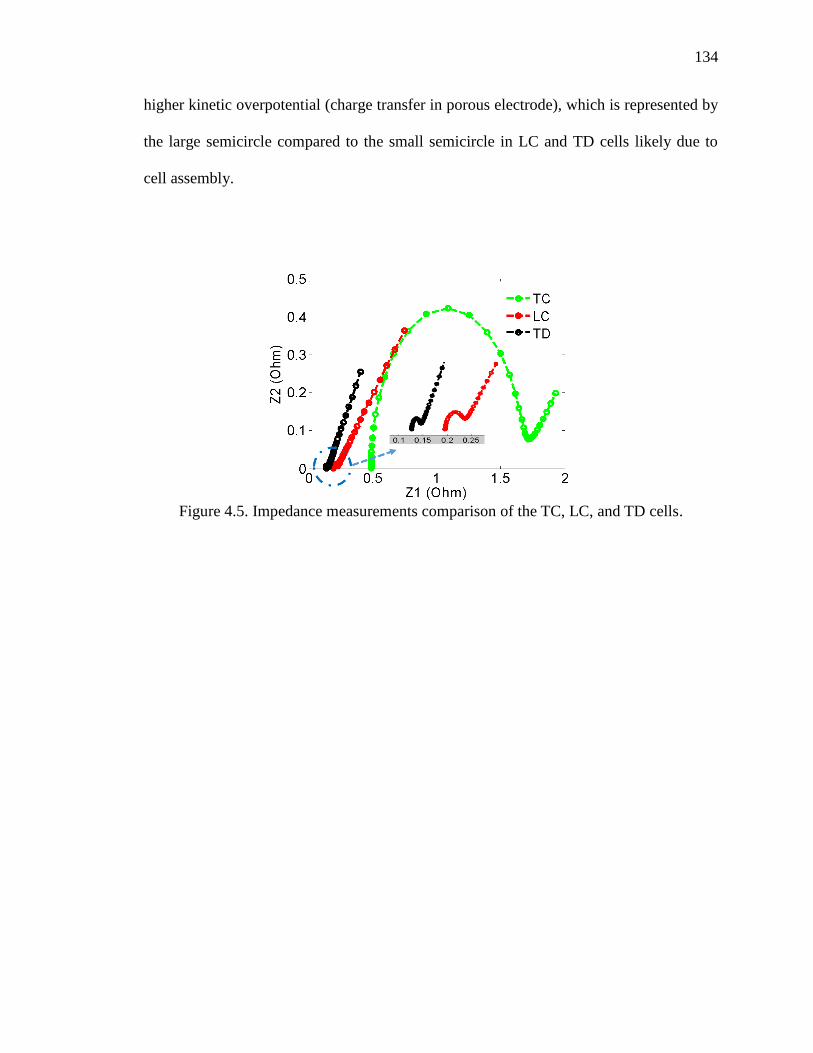
134
higher kinetic overpotential (charge transfer in porous electrode), which is represented by
the large semicircle compared to the small semicircle in LC and TD cells likely due to
cell assembly.
Figure 4.5. Impedance measurements comparison of the TC, LC, and TD cells.

135
5. CONCLUSIONS
Most flow batteries were targeted for stationary applications, and one of the most
important issues in their development was enhancing power density. In this paper, a new
concept of distributed VRFB has been introduced through designing and testing two
single VRFB cells (tubular and long PVC planar cells) configured for distribution in a
transport system. An analytical study has been also performed for the tubular and planar
cells and it has shown that under certain geometric conditions, tubular cell can utilize
larger electrode active areas than planar shapes, leading to higher power density.
Many tests have been conducted to evaluate the new design’s performance
compared to the traditional design. The results showed that the tubular cell has lower VE
and EE than the other cells in addition to a quick drop of polarization potential, which
needs to be further improved by reducing the high contact resistance among cell
components, applying uniform pressure to the anode and cathode sides, and using a flow
field channel to minimize the concentration overpotential. The tubular design issues were
solved by introducing a long PVC planar cell, which shows very stable cycling
performance with better VE and EE compared to the existing ones. The flow rate impact
in polarization tests has also been investigated, and it shows that a higher circulation rate
reduces the mass transport polarization.
136
REFERENCES
1. Barton, J.P. and D.G. Infield, Energy storage and its use with intermittent
renewable energy. IEEE transactions on energy conversion, 2004. 19(2): p. 441-
448.
2. Blarke, M.B. and H. Lund, The effectiveness of storage and relocation options in
renewable energy systems. Renewable Energy, 2008. 33(7): p. 1499-1507.
3. Chen, H., et al., Progress in electrical energy storage system: A critical review.
Progress in Natural Science, 2009. 19(3): p. 291-312.
4. Denholm, P., et al., The Role of energy storage with renewable electricity
generation. 2010.
5. Divya, K.C. and J. Østergaard, Battery energy storage technology for power
systems—An overview. Electric Power Systems Research, 2009. 79(4): p. 511-
520.
6. Evans, A., V. Strezov, and T.J. Evans, Assessment of utility energy storage
options for increased renewable energy penetration. Renewable and Sustainable
Energy Reviews, 2012. 16(6): p. 4141-4147.
7. Hadjipaschalis, I., A. Poullikkas, and V. Efthimiou, Overview of current and
future energy storage technologies for electric power applications. Renewable
and Sustainable Energy Reviews, 2009. 13(6-7): p. 1513-1522.
8. Sharma, A., et al., Review on thermal energy storage with phase change materials
and applications. Renewable and Sustainable Energy Reviews, 2009. 13(2): p.
318-345.
9. Yang, Z., et al., Electrochemical energy storage for green grid. Chem Rev, 2011.
111(5): p. 3577-613.
10. Kanase-Patil, A.B., R.P. Saini, and M.P. Sharma, Integrated renewable energy
systems for off grid rural electrification of remote area. Renewable Energy, 2010.
35(6): p. 1342-1349.
11. Hafez, O. and K. Bhattacharya, Optimal planning and design of a renewable
energy based supply system for microgrids. Renewable Energy, 2012. 45: p. 7-15.
12. Carrasco, J.M., et al., Power-electronic systems for the grid integration of
renewable energy sources: A survey. IEEE Transactions on industrial electronics,
2006. 53(4): p. 1002-1016.

137
13. Turner, J.A., A Realizable Renewable Energy Future. Science, 1999. 285(5428):
p. 687-689.
14. Alotto, P., M. Guarnieri, and F. Moro, Redox flow batteries for the storage of
renewable energy: A review. Renewable and Sustainable Energy Reviews, 2014.
29: p. 325-335.
15. Fabjan, C., et al., The vanadium redox-battery: an efficient storage unit for
photovoltaic systems. Electrochimica Acta, 2001. 47(5): p. 825-831.
16. Joerissen, L., et al., Possible use of vanadium redox-flow batteries for energy
storage in small grids and stand-alone photovoltaic systems. Journal of Power
Sources, 2004. 127(1-2): p. 98-104.
17. Kear, G., A.A. Shah, and F.C. Walsh, Development of the all-vanadium redox
flow battery for energy storage: a review of technological, financial and policy
aspects. International Journal of Energy Research, 2012. 36(11): p. 1105-1120.
18. RYCHCIK, M. and M. SKYLLAS-KAZACOS*, Characteristics of a new all-
vanadium redox flow battery. Journal of Power Sources 1988. 22(1): p. 59-67.
19. Painuly, J.P., Barriers to renewable energy penetration; a framework for
analysis. Renewable energy, 2001. 24(1): p. 73-89.
20. Leung, P., et al., Progress in redox flow batteries, remaining challenges and their
applications in energy storage. RSC Advances, 2012. 2(27): p. 10125.
21. Aaron, D.S., et al., Dramatic performance gains in vanadium redox flow batteries
through modified cell architecture. Journal of Power Sources, 2012. 206: p. 450-
453.
22. Wang, W., et al., Recent progress in redox flow battery research and
development. Advanced Functional Materials, 2013. 23(8): p. 970-986.
23. Kumar, S. and S. Jayanti, Effect of flow field on the performance of an all-
vanadium redox flow battery. Journal of Power Sources, 2016. 307: p. 782-787.
24. Chen, J.Q., B.G. Wang, and H.L. Lv. Numerical simulation and experiment on the
electrolyte flow distribution for all vanadium redox flow battery. in Advanced
Materials Research. 2011. Trans Tech Publ.
25. Zhang, C., et al., Effects of operating temperature on the performance of
vanadium redox flow batteries. Applied Energy, 2015. 155: p. 349-353.
26. Aaron, D., et al., Polarization curve analysis of all-vanadium redox flow
batteries. Journal of Applied Electrochemistry, 2011. 41(10): p. 1175-1182.

138
27. Shao, Z.-G., et al., A tubular direct methanol fuel cell with Ti mesh anode. Journal
of Power Sources, 2006. 160(2): p. 1003-1008.
28. Ward, T., X. Li, and A. Faghri, Performance characteristics of a novel tubular-
shaped passive direct methanol fuel cell. Journal of Power Sources, 2011.
196(15): p. 6264-6273.
29. ZIMMERMAN, N., VANADIUM REDOX FLOW BATTERY Sizing of VRB in
electrified heavy construction equipment. 2014.
30. Houser, J., et al., Influence of architecture and material properties on vanadium
redox flow battery performance. Journal of Power Sources, 2016. 302: p. 369-
377.
31. Zhang, Y., C.-Y. Wang, and X. Tang, Cycling degradation of an automotive
LiFePO4 lithium-ion battery. Journal of Power Sources, 2011. 196(3): p. 1513-
1520.
32. Ebner, M., et al., Visualization and quantification of electrochemical and
mechanical degradation in Li ion batteries. Science, 2013. 342(6159): p. 716-20.
33. Pan, F. and Q. Wang, Redox Species of Redox Flow Batteries: A Review.
Molecules, 2015. 20(11): p. 20499-20517.
34. Liu, Q., et al., Non-aqueous vanadium acetylacetonate electrolyte for redox flow
batteries. Electrochemistry Communications, 2009. 11(12): p. 2312-2315.
35. Brushett, F.R., J.T. Vaughey, and A.N. Jansen, An All‐Organic Non‐aqueous
Lithium‐Ion Redox Flow Battery. Advanced Energy Materials, 2012. 2(11): p.
1390-1396.
36. Palomares, V., et al., Na-ion batteries, recent advances and present challenges to
become low cost energy storage systems. Energy & Environmental Science, 2012.
5(3): p. 5884-5901.
37. Watt‐Smith, M.J., et al., The importance of key operational variables and
electrolyte monitoring to the performance of an all vanadium redox flow battery.
Journal of Chemical Technology and Biotechnology, 2013. 88(1): p. 126-138.
38. Skyllas-Kazacos, M., et al., Characteristics and performance of 1 kW UNSW
vanadium redox battery. Journal of Power Sources, 1991. 35(4): p. 399-404.
39. Baccino, F., et al., Experimental testing procedures and dynamic model validation
for vanadium redox flow battery storage system. Journal of Power Sources, 2014.
254: p. 277-286.

139
40. Rahman, F. and M. Skyllas-Kazacos, Vanadium redox battery: Positive half-cell
electrolyte studies. Journal of Power Sources, 2009. 189(2): p. 1212-1219.
41. Shah, A.A., et al., A dynamic unit cell model for the all-vanadium flow battery.
Journal of the Electrochemical society 2011. 158(6): p. A671-A677.
42. Xiao-gang, L., et al., Electrochemical behavior of diverse vanadium ions at
modified graphite felt electrode in sulphuric solution. Journal of Central South
University of Technology, 2007. 14: p. 51-56.
43. Al-Fetlawi, H., A.A. Shah, and F.C. Walsh, Non-isothermal modelling of the all-
vanadium redox flow battery. Electrochimica Acta, 2009. 55(1): p. 78-89.
44. Jia, C., J. Liu, and C. Yan, A significantly improved membrane for vanadium
redox flow battery. Journal of Power Sources, 2010. 195(13): p. 4380-4383.
45. Mai, Z., et al., Nafion/polyvinylidene fluoride blend membranes with improved
ion selectivity for vanadium redox flow battery application. Journal of Power
Sources, 2011. 196(13): p. 5737-5741.
46. Qiu, G., et al., 3-D pore-scale resolved model for coupled species/charge/fluid
transport in a vanadium redox flow battery. Electrochimica Acta, 2012. 64: p. 46-
64.
47. Shah, A.A., H. Al-Fetlawi, and F.C. Walsh, Dynamic modelling of hydrogen
evolution effects in the all-vanadium redox flow battery. Electrochimica Acta,
2010. 55(3): p. 1125-1139.
48. Xu, W., et al., Membranes with well-defined ions transport channels fabricated
via solvent-responsive layer-by-layer assembly method for vanadium flow battery.
Sci Rep, 2014. 4: p. 4016.
49. Hwang, G.-J. and H. Ohya, Crosslinking of anion exchange membrane by
accelerated electron radiation as a separator for the all-vanadium redox flow
battery. Journal of Membrane Science, 1997. 132(1): p. 55-61.
50. Song, J., S. Cha, and W. Lee, Optimal composition of polymer electrolyte fuel cell
electrodes determined by the AC impedance method. Journal of Power Sources,
2001. 94(1): p. 78-84.

140
SECTION
2. SUMMARY AND FUTURE WORK
2.1. SUMMARY
The interest in electrical energy storage has grown substantially in the last few
decades. Industry, research, and also communities have been triggered by the growing
demand of energy, the finite sources of fossil fuels, and the increasing pollution caused
by fossil fuels to develop and improve electrical energy storage from renewable power
sources. Electrical storage systems can be categorized in three major sections: a)
mechanical b) capacitative (no redox couples involved) and c) electrochemical systems
(Table 2.1).
Table 2.1 Energy Storage Systems.
Mechanical Capacitative Electrochemical
Pumped Hydro Super Capacitors Batteries
Compressed Air Redox Flow Batteries
Fly Wheels Fuel Cells
Only the electrochemical section can be implemented to both mobile and
stationary applications with large energy storage capabilities. However, the existing
systems show several major drawbacks that need to be solved. Some of these drawbacks
are the small amount of energy density that can be utilized, the weight and the limited
space of the system (regarding mobile applications), and the costs of some components.
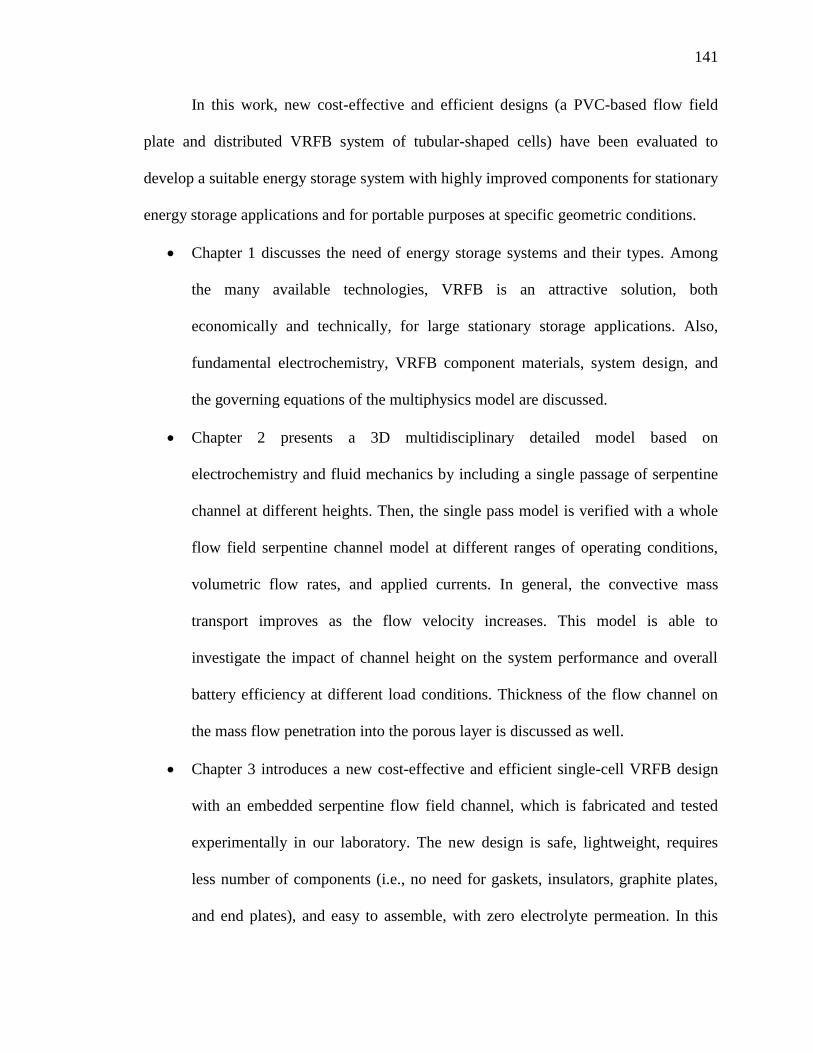
141
In this work, new cost-effective and efficient designs (a PVC-based flow field
plate and distributed VRFB system of tubular-shaped cells) have been evaluated to
develop a suitable energy storage system with highly improved components for stationary
energy storage applications and for portable purposes at specific geometric conditions.
Chapter 1 discusses the need of energy storage systems and their types. Among
the many available technologies, VRFB is an attractive solution, both
economically and technically, for large stationary storage applications. Also,
fundamental electrochemistry, VRFB component materials, system design, and
the governing equations of the multiphysics model are discussed.
Chapter 2 presents a 3D multidisciplinary detailed model based on
electrochemistry and fluid mechanics by including a single passage of serpentine
channel at different heights. Then, the single pass model is verified with a whole
flow field serpentine channel model at different ranges of operating conditions,
volumetric flow rates, and applied currents. In general, the convective mass
transport improves as the flow velocity increases. This model is able to
investigate the impact of channel height on the system performance and overall
battery efficiency at different load conditions. Thickness of the flow channel on
the mass flow penetration into the porous layer is discussed as well.
Chapter 3 introduces a new cost-effective and efficient single-cell VRFB design
with an embedded serpentine flow field channel, which is fabricated and tested
experimentally in our laboratory. The new design is safe, lightweight, requires
less number of components (i.e., no need for gaskets, insulators, graphite plates,
and end plates), and easy to assemble, with zero electrolyte permeation. In this

142
design, a new thermoplastic material, PVC (polyvinyl chloride), is used to replace
the brittle and porous graphite flow field plate in the traditional VRFB. The cell
performance is conducted under many tests such as cycling at different range of
currents, polarization analysis, and electrochemical impedance spectroscopy (EIS)
for resistance analysis. Then, the results are compared with the traditional VRFB
cell, and it shows better columbic and energy efficiencies with less capacity
degradation for the new design in addition to other benefits such as handling the
cost and leakage issues.
Chapter 4 develops for the first time two new types of distributed flow battery for
transport systems (tubular-shaped and long PVC cells) that can be installed in
electric vehicles or any other type of transport system that requires a clean power
source. The length of both reaction cells is substantially greater than their width
and it can be looped throughout the transport system in a serpentine configuration.
In the tubular design, the membrane within the reaction cell has a length
substantially equal to the length of the reaction cell such that surface area of the
membrane is maximized relative to volume of the reaction cell to increase
electrical power provided to an electrical load of the transport system. An
analytical analysis of the two designs shows that the tubular design can result in
larger active surface area than the long PVC cell for the same total volume and
under specific geometric conditions, producing more output power. Different
types of tests are conducted to study the cell’s performance, and the results from
the executive tests showed that both designs reflect the normal qualitative
behavior of the traditional VRFB cell.
143
2.2. FUTURE WORK
The work of this dissertation focused on studying the channel height impact of the
flow field on the overall performance of VRFB energy storage systems numerically, but
also on investigating and developing new feasible design configurations as additional
and/or alternative designs to the traditional VRFB. As a continuation of the present study,
the following recommendations can be considered:
A 3D non-isothermal model with different flow channel fields such as serpentine,
interdigitated, and parallel should be developed to study the uniformity
distribution of the electrolyte and the temperature distribution inside the porous
electrode (it is important to avoid any kind of hotspots inside the electrode, which
come from the uneven distribution of the electrolyte, where hotspots mean the
temperature of the cell overcomes a limit value, then the vanadium ions start to
precipitate, making the cell useless). Also, an experimental study of VRFB with
flow field can be conducted to guarantee an even and homogeneous distribution
of the electrolyte into the cell.
Continuous numerical and then experimental work is required to design
innovative flow cell configurations for uniform solution distribution at lower
pressure drop to obtain higher limiting current density, power density, and overall
efficiency, which means reducing the three sources of overpotential losses
(activation, ohmic, and mass transport losses).
The flow regime impact (laminar, transition, and turbulent) should be simulated at
different Reynold number values on the mass transfer enhancement inside the
porous electrode and the final VRFB performance.

144
Despite the observed benefits of the new PVC-based cell and the tubular design,
they still require additional work to minimize the contact resistance area between
the current collector and the porous electrode. Reducing the contact resistance can
be performed by either coating the rib area (space between channels) with a
suitable composite and good electric conductive materials (carbon black or nano
fiber composites) to enhance the electron movement externally and the
electrochemical reaction internally, or by investigating a new configuration of the
current collector that ensures lower contact resistance area. Improving the contact
area produces higher current density and subsequently higher output power.
A 3D numerical model of the tubular-shaped geometry design should be
evaluated with and without including the flow field to study the VRFB cell
performance. Also, a numerical comparison study of the planar and tubular VRFB
cells can be investigated at different operating and geometry conditions to
determine the optimal voltage performance and output power for both stationary
and mobile purposes.
Improving the performance of the current tubular-shaped design in such a way
that more electrode area can be utilized (to produce larger power) by altering the
orientation of the cell into vertical position or at specific angle degree. Also, a
numerical and/or experimental study of adding flow field channels (to distribute
the electrolyte in a uniform way along the inner (anode) and outer (cathode) cell
sides) on the overall battery performance can be conducted.
145
REFERENCES
1. Dresselhaus, M. and I. Thomas, Alternative energy technologies. Nature, 2001.
414(6861): p. 332-337.
2. Reuters, T., ISI web of knowledge. Available in the internet at: http://apps.
isiknowledge. com, 2011.
3. Chalk, S.G. and J.F. Miller, Key challenges and recent progress in batteries, fuel
cells, and hydrogen storage for clean energy systems. Journal of Power Sources,
2006. 159(1): p. 73-80.
4. Blanc, C. and A. Rufer, Understanding the vanadium redox flow batteries. 2010:
INTECH Open Access Publisher.
5. Blanc, C., Modeling of a vanadium redox flow battery electricity storage system.
2009.
6. De Leon, C.P., et al., Redox flow cells for energy conversion. Journal of Power
Sources, 2006. 160(1): p. 716-732.
7. Moore, M., et al. Sensitivity Analysis of Design Variables of an All-Vanadium
Redox-Flow Battery. in Meeting Abstracts. 2011. The Electrochemical Society.
8. Dunlap, R., Sustainable energy. 2014: Cengage Learning.
9. Ito, H., et al., Effect of through-Plane Polytetrafluoroethylene Distribution in a
Gas Diffusion Layer. ECS Transactions, 2014. 64(3): p. 501-508.
10. Heinzel, A., et al., Injection moulded low cost bipolar plates for PEM fuel cells.
Journal of Power Sources, 2004. 131(1): p. 35-40.
11. Mehta, V. and J.S. Cooper, Review and analysis of PEM fuel cell design and
manufacturing. Journal of Power Sources, 2003. 114(1): p. 32-53.
12. Bullock, K.R., Lead/acid batteries. Journal of power sources, 1994. 51(1-2): p. 1-
17.
13. Sudworth, J., The sodium/sulphur battery. Journal of power sources, 1984. 11(1-
2): p. 143-154.
14. Scrosati, B. and J. Garche, Lithium batteries: Status, prospects and future. Journal
of Power Sources, 2010. 195(9): p. 2419-2430.
15. Weber, A.Z., et al., Redox flow batteries: a review. Journal of Applied
Electrochemistry, 2011. 41(10): p. 1137-1164.

146
16. de Boer, P. and J. Raadschelders, Briefing Paper–Flow Batteries. Leonardo
Energy. Available on line at http://www. leonardo-energy. org/webfm_send/164,
2007.
17. Nguyen, T. and R.F. Savinell, Flow batteries. Electrochem. Soc. Interface, 2010.
19(3): p. 54.
18. de Boer, P. and J. Raadschelders, Flow batteries. Leonardo Energy, 2007: p. 1-9.
19. Kuan, H.-C., et al., Preparation, electrical, mechanical and thermal properties of
composite bipolar plate for a fuel cell. Journal of Power Sources, 2004. 134(1): p.
7-17.
20. Alotto, P., M. Guarnieri, and F. Moro, Redox flow batteries for the storage of
renewable energy: A review. Renewable and Sustainable Energy Reviews, 2014.
29: p. 325-335.
21. Tang, A., J. Bao, and M. Skyllas-Kazacos, Dynamic modelling of the effects of ion
diffusion and side reactions on the capacity loss for vanadium redox flow battery.
Journal of Power Sources, 2011. 196(24): p. 10737-10747.
22. Kjeang, E., et al., High-performance microfluidic vanadium redox fuel cell.
Electrochimica Acta, 2007. 52(15): p. 4942-4946.
23. Rahman, F. and M. Skyllas-Kazacos, Vanadium redox battery: Positive half-cell
electrolyte studies. Journal of Power Sources, 2009. 189(2): p. 1212-1219.
24. Larminie, J., A. Dicks, and M.S. McDonald, Fuel cell systems explained. Vol. 2.
2003: J. Wiley Chichester, UK.
25. Xi, J., et al., Nafion/SiO 2 hybrid membrane for vanadium redox flow battery.
Journal of Power Sources, 2007. 166(2): p. 531-536.
26. Skyllas‐Kazacos, M. and F. Grossmith, Efficient vanadium redox flow cell.
Journal of the Electrochemical Society, 1987. 134(12): p. 2950-2953.
27. Rychcik, M. and M. Skyllas-Kazacos, Characteristics of a new all-vanadium
redox flow battery. Journal of Power Sources, 1988. 22(1): p. 59-67.
28. Aaron, D., et al., Polarization curve analysis of all-vanadium redox flow
batteries. Journal of Applied Electrochemistry, 2011. 41(10): p. 1175-1182.
29. Aaron, D., et al., Dramatic performance gains in vanadium redox flow batteries
through modified cell architecture. Journal of Power sources, 2012. 206: p. 450-
453.

147
30. Kaneko, H., et al., Vanadium redox reactions and carbon electrodes for vanadium
redox flow battery. Electrochimica Acta, 1991. 36(7): p. 1191-1196.
31. Rychcik, M. and M. Skyllas-Kazacos, Evaluation of electrode materials for
vanadium redox cell. Journal of Power Sources, 1987. 19(1): p. 45-54.
32. Zhou, H., et al., A comparative study of carbon felt and activated carbon based
electrodes for sodium polysulfide/bromine redox flow battery. Electrochimica
Acta, 2006. 51(28): p. 6304-6312.
33. Sun, C., et al., Investigations on transfer of water and vanadium ions across
Nafion membrane in an operating vanadium redox flow battery. Journal of Power
Sources, 2010. 195(3): p. 890-897.
34. Shah, A., H. Al-Fetlawi, and F. Walsh, Dynamic modelling of hydrogen evolution
effects in the all-vanadium redox flow battery. Electrochimica Acta, 2010. 55(3):
p. 1125-1139.
35. Fabjan, C., et al., The vanadium redox-battery: an efficient storage unit for
photovoltaic systems. Electrochimica Acta, 2001. 47(5): p. 825-831.
36. Kong, C.S., et al., Influence of pore-size distribution of diffusion layer on mass-
transport problems of proton exchange membrane fuel cells. Journal of Power
Sources, 2002. 108(1): p. 185-191.
37. Larsson, A., Evaluation of flow battery technology: An assessment of technical
and economic feasibility. 2009, Massachusetts Institute of Technology.
38. Yin, C., et al., A coupled three dimensional model of vanadium redox flow battery
for flow field designs. Energy, 2014. 74: p. 886-895.
39. Qiu, G., et al., Pore-scale analysis of effects of electrode morphology and
electrolyte flow conditions on performance of vanadium redox flow batteries.
Journal of power sources, 2012. 219: p. 223-234.
40. Knehr, K., et al., A transient vanadium flow battery model incorporating
vanadium crossover and water transport through the membrane. Journal of The
Electrochemical Society, 2012. 159(9): p. A1446-A1459.

148
VITA
Mohammed Al-yasiri was born in Qulaat Sukar in Thi-Qar province, Republic of
Iraq. He attended school in Qulaat Sukar before entering University of Science and
Technology in Baghdad, Iraq. Mohammed earned his Bachelor (B.Sc.) and Master
(M.Sc.) of Science degrees in Mechanical Engineering from University of Science and
Technology/Baghdad, Iraq in May 2002 and 2005, respectively. His master’s study
focused on designing thermal energy storage in air-conditioning and refrigeration
applications. In July 2006, he joined the Mechanical Engineering Department at Wassit
University/Iraq. afterwards, he worked as a lecturer until December 2011. In Spring
2012, Mohammed went to Missouri University of Science and Technology in the United
States, and in Spring 2013 started as a graduate student in the Mechanical and Aerospace
Engineering Department. Mohammed joined the research group of Dr. Jonghyun Park in
Spring 2015 to work under his supervision as a Ph.D. candidate. For his Ph.D.
dissertation, Mohammed focused on building a 3D numerical model and developing new
novel single cell designs of vanadium redox flow batteries (VRFBs) to improve their
performance and to reduce the capital costs, which can help with their widespread
commercialization. Mohammed was granted his second Master of Science (M.Sc.) degree
in Mechanical Engineering from Missouri University of Science and Technology in Fall
2016. He received Doctor of Philosophy (Ph.D.) in Mechanical Engineering by the same
University in May 2017. Mohammed Al-yasiri became a member of the Iraqi Engineers
Association (IEA) in 2002. He also became a member of the American Society of
Mechanical Engineers (ASME) and American Chemical Society (ACS) in 2014 and
2015, respectively.