Numerical and experimental comparative study of ... · investigated. Meanwhile, the merits and...
32
1 Numerical and experimental comparative study of microfluidic fuel cells with different flow configurations: Co-flow vs. Counter-flow cell Yifei Wang a* , Dennis Y.C. Leung a* , Hao Zhang b , Jin Xuan c , Huizhi Wang c a Department of Mechanical Engineering, the University of Hong Kong, Hong Kong, China b School of Mechanical and Electrical Engineering, Jiangxi University of Science and Technology, Ganzhou, China c Institute of Mechanical, Process and Energy Engineering, School of Engineering and Physical Sciences, Heriot-Watt University, Edinburgh, UK *Corresponding author: Dennis Y.C. Leung, Yifei Wang Tel: (852) 3917 7911 Fax: (852) 2858 5415 Email: [email protected] Abstract Microfluidic fuel cell (MFC) is a new type of fuel cell which utilizes two laminar flows as electrolyte for both reactant delivery and ionic conduction purposes. According to the flow configuration, two MFC designs, that is, the co-flow cell and the counter-flow cell, have been proposed in the literature, but the specific merits and demerits between them have not been well understood yet. Therefore, in this work both experimental and numerical comparative studies are conducted on this issue. It is found that the counter- flow MFC encounters an inherent drawback on its power output because the outer part of its electrodes contributes much less than the inner part due to the longer ionic transport path. In conclusion, short and wide electrodes are more appropriate for counter-flow MFCs rather than the conventional long and narrow ones. Nevertheless, the counter-flow MFC does exhibit great advantage on low flow rate tolerance, leading to much improved fuel utilization and energy density at the same time. Considering this huge superiority for real applications, structural optimization of the counter-flow MFC is further conducted by reducing the electrode distance and discarding the outer part of the electrodes. The
Transcript of Numerical and experimental comparative study of ... · investigated. Meanwhile, the merits and...
1
Numerical and experimental comparative study of microfluidic fuel cells with
different flow configurations: Co-flow vs. Counter-flow cell
Yifei Wanga*
, Dennis Y.C. Leunga*
, Hao Zhangb, Jin Xuan
c, Huizhi Wang
c
aDepartment of Mechanical Engineering, the University of Hong Kong, Hong Kong,
China
bSchool of Mechanical and Electrical Engineering, Jiangxi University of Science and
Technology, Ganzhou, China
cInstitute of Mechanical, Process and Energy Engineering, School of Engineering and
Physical Sciences, Heriot-Watt University, Edinburgh, UK
*Corresponding author: Dennis Y.C. Leung, Yifei Wang
Tel: (852) 3917 7911
Fax: (852) 2858 5415
Email: [email protected]
Abstract
Microfluidic fuel cell (MFC) is a new type of fuel cell which utilizes two laminar
flows as electrolyte for both reactant delivery and ionic conduction purposes. According
to the flow configuration, two MFC designs, that is, the co-flow cell and the counter-flow
cell, have been proposed in the literature, but the specific merits and demerits between
them have not been well understood yet. Therefore, in this work both experimental and
numerical comparative studies are conducted on this issue. It is found that the counter-
flow MFC encounters an inherent drawback on its power output because the outer part of
its electrodes contributes much less than the inner part due to the longer ionic transport
path. In conclusion, short and wide electrodes are more appropriate for counter-flow
MFCs rather than the conventional long and narrow ones. Nevertheless, the counter-flow
MFC does exhibit great advantage on low flow rate tolerance, leading to much improved
fuel utilization and energy density at the same time. Considering this huge superiority for
real applications, structural optimization of the counter-flow MFC is further conducted by
reducing the electrode distance and discarding the outer part of the electrodes. The

2
optimized counter-flow cell performance is successfully improved to the same level with
its co-flow counterpart.
Keywords
Microfluidic fuel cell, co-flow, counter-flow, electrode configuration, fuel utilization
Nomenclature
Symbol:
ρ: Density (kgm-3
)
u: Velocity (ms-1
)
P: Pressure (Pa)
µ: Dynamic viscosity (Pas)
ω: Mass fraction
x: Molar fraction
j: Diffusion flux (kgm-2
s-1
)
S: Production/consumption rate due to electrochemical reactions (kgm-3
s-1
)
M: Molar mass (kgmol-1
)
D: Diffusion coefficient (m2s
-1)
c: Molar concentration (molm-3
)
Mn: Average molar mass of the mixture (kgmol-1
)
σ: Conductivity (Sm-1
)
φ: Potential (V)
i: Current density (Am-2
)
ν: Stoichiometric coefficient
n: Number of transfer electrons
F: Faraday’s constant (96485 Cmol-1
)
i0: Exchange current density (Am-2
)
χ: Reaction order
α: Charge transfer coefficient
η: Activation overpotential (V)
R: Gas constant (8.314 Jmol-1
K-1
)
3
T: Temperature (K)
Eeq: Equilibrium potential (V)
Q: Charge source term (Am-3
)
Subscript:
a: Anode
c: Cathode
f: Fuel
i, j, k: Species
l: Electrolyte
m: Main reaction
o: Oxidant
p: Parasitic reaction
s: Electrode
0: Standard, reference, or boundary value
Superscript:
x→1: Infinite solution
1. Introduction
Fuel cell is very promising as a future power source because of its distinct
characteristics such as high energy efficiency, superior energy density, environmental
friendliness, long-term energy storage and generation ability, and so on. Various
applications of this technology are emerging in recent years, especially in the field of
transportation and stationary power generation where high rated power is required. As for
the market of small-power applications, the competitiveness of fuel cell is greatly
impaired by its relatively high cost compared with other existing technologies such as
batteries. To lower down the cost, a novel-type microfluidic fuel cell (MFC) has been
proposed recently [1, 2], which utilizes the characteristics of laminar flow for fuel-
oxidant separation purpose instead of the conventional solid membrane. As shown in Fig.
1(a), a typical MFC employs two laminar flow streams, one mixed with fuel (anolyte)
4
and the other mixed with oxidant (catholyte), to flow in parallel along the micro-channel.
In this manner, the high-cost membrane in conventional fuel cells can be eliminated
together with its dry-out and degradation issues [3, 4]. In addition, the reaction heat and
water generated can be efficiently removed by the flowing electrolyte, leading to a much
simplified balance of plant (BOP). As a consequence, the fabrication cost of MFC is
much lowered, which makes it especially suitable as mini-watt power sources.
To date, there are plenty of MFC prototypes proposed in the literature, which have
greatly contributed to the research and development of this technology. Most of these
prototypes utilize the co-flow configuration as shown in Fig. 1(a), in which the diffusion
direction of reactant crossover is orthogonal to the flow direction of electrolyte solution.
This configuration has been the mainstream ever since the MFC technology was
proposed, probably because of its simple structure and easy fabrication. During the cell
operation, the convective electrolyte flow is much faster than the diffusive reactant
crossover (that is, a high Peclet number), which can restrict the mixing zone of fuel and
oxidant (as indicated by the white dash line in the figure) to a thin layer in the middle of
the channel. In this manner, both the anode and cathode can work well so the co-flow
MFC can generate very high power output with various types of fuels, some of which are
even comparable to the PEMFC. Kjeang et al. [5] developed an all-vanadium co-flow
MFC which can obtain a peak power density of 70 mWcm-2
at room temperature. Lu et al.
[6] employed the dual-electrolyte technique in their hydrogen-oxygen co-flow MFC with
acid electrolyte for the cathode side and alkaline electrolyte for the anode side. A peak
power density as high as 1.3 Wcm-2
was achievable together with a high OCV of 1.89V.
Hollinger et al. [7] proposed a direct methanol co-flow MFC which can generate a power
output of 70 mWcm-2
and a current output of about 650 mAcm-2
. As for the formic acid
fuel, a peak power density of 55 mWcm-2
was achieved by Jayashree et al. [8] using 1M
formic acid and 50sccm oxygen. These high power outputs are mainly attributed to both
the sufficient supply of reactant to the electrode surface and the effective suppression of
reactant crossover, which generally requires a relatively high electrolyte flow rate.
Nevertheless, the fuel utilization is consequently sacrificed due to the limited retention
time of the fuel inside the channel. Moreover, a large amount of solution needs to be
stored inside the co-flow MFC system, leading to a low energy density. These
5
shortcomings will greatly impair its application potential. In addition to the co-flow
configuration, the counter-flow configuration as shown in Fig. 1(b) has also been
proposed, in which the diffusion direction of fuel and oxidant crossover is opposite to the
flow direction of catholyte and anolyte, respectively. This kind of MFC is less studied in
the literature, although the fabrication process is as easy as its co-flow counterpart. When
coupled with 3D flow-through electrodes, the counter-flow MFC can also achieve
satisfactory power output. Ibrahim et al. [9] developed an all-vanadium counter-flow
MFC and obtained a peak power density of 760 mWcm-2
. Gurrola et al. [10] utilized 3M
formic acid as fuel and the achieved peak power density was as high as 100 mWcm-2
. As
for the ethanol fuel, a peak power density of 99.4 mWcm-2
was generated by a dual-
electrolyte counter-flow MFC developed by López-Rico et al. [11] Furthermore, the
counter-flow MFC is considered to be highly tolerable to low electrolyte flow rates
without the detrimental effect from aggravated reactant crossover. This is because that
the convective electrolyte counter-flow can effectively prevent the diffusive reactant
crossover from the electrode surface. As a consequence, high fuel utilization and low
electrolyte consumption may be achievable by counter-flow MFCs. However, the cell
power output may be sacrificed due to the insufficient reactant supply.
In addition to experimental approaches, numerical modeling is also an effective
method for MFC study, which cannot only reveal the in-depth mechanisms behind the
experimental phenomenon but also optimize the cell performance economically. A
number of MFC modeling studies have already been published in the past decade, most
of which focused on the co-flow configuration while only a few of them investigated the
counter-flow configuration. For the co-flow MFC, great efforts have been made on the
improvement of its fuel utilization by using various strategies, such as the increase of
channel aspect ratio [12-14], the utilization of tapered electrodes [12] or very small
electrodes [15], introduction of a third electrolyte [14, 16, 17], using multiple inlets [18],
employing flow-through porous electrodes [19], using novel channel geometries [20], and
so on. As for the counter-flow MFC, Xuan et al. [21] introduced micro-ridges into the
microfluidic channel in order to generate chaotic flows, which can dramatically improve
the cell current and power output. Xu et al. [22] investigated the possibility of counter-
flow MFCs with low flow rate operation. With 1M formic acid as fuel, the highest fuel

6
utilization of 91.4% was achieved at 1 μlmin-1
. Other modeling studies focused on
counter-flow MFCs with flow-through electrodes, which is especially suitable for the all-
vanadium fuel cell [23-25].
Although there are already plenty of research works focused on the development of
either co-flow or counter-flow MFCs, it is still unclear and questionable about which
flow configuration is more suitable and promising for future MFC development. This
issue cannot be addressed by the direct comparison between co-flow and counter-flow
MFCs in the literature, since they were studied with different cell parameters and under
different test conditions. Therefore, a comprehensive comparison of the merits and
demerits between these two distinctive flow configurations under identical cell
parameters and test conditions is very important for future MFC development, which has
not been conducted yet to the best of our knowledge. In this study, we have conducted
both experimental and numerical investigations on this issue. Two MFC prototypes, one
with the co-flow and the other with the counter-flow configuration, have been designed
and fabricated with similar cell parameters, and tested under identical conditions. The
testing results obtained were further utilized to validate the corresponding numerical
models. Based on the models, effects of electrode aspect ratio, channel thickness, and
electrolyte flow rate on both cell performance and fuel utilization have been fully
investigated. Meanwhile, the merits and demerits between the two different MFCs were
also specifically compared with each other. Furthermore, several optimization strategies
for the counter-flow MFC have been proposed and testified by modeling, which were
found to successfully improve the cell performance of the original counter-flow prototype.
7
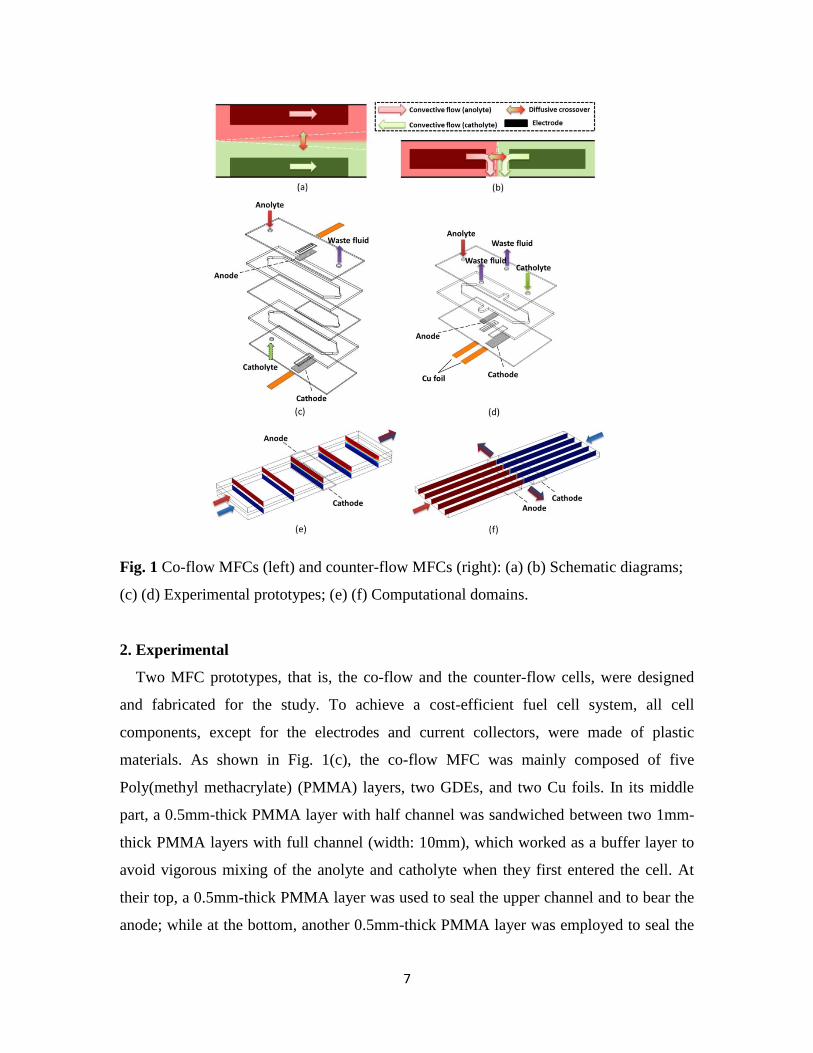
Fig. 1 Co-flow MFCs (left) and counter-flow MFCs (right): (a) (b) Schematic diagrams;
(c) (d) Experimental prototypes; (e) (f) Computational domains.
2. Experimental
Two MFC prototypes, that is, the co-flow and the counter-flow cells, were designed
and fabricated for the study. To achieve a cost-efficient fuel cell system, all cell
components, except for the electrodes and current collectors, were made of plastic
materials. As shown in Fig. 1(c), the co-flow MFC was mainly composed of five
Poly(methyl methacrylate) (PMMA) layers, two GDEs, and two Cu foils. In its middle
part, a 0.5mm-thick PMMA layer with half channel was sandwiched between two 1mm-
thick PMMA layers with full channel (width: 10mm), which worked as a buffer layer to
avoid vigorous mixing of the anolyte and catholyte when they first entered the cell. At
their top, a 0.5mm-thick PMMA layer was used to seal the upper channel and to bear the
anode; while at the bottom, another 0.5mm-thick PMMA layer was employed to seal the
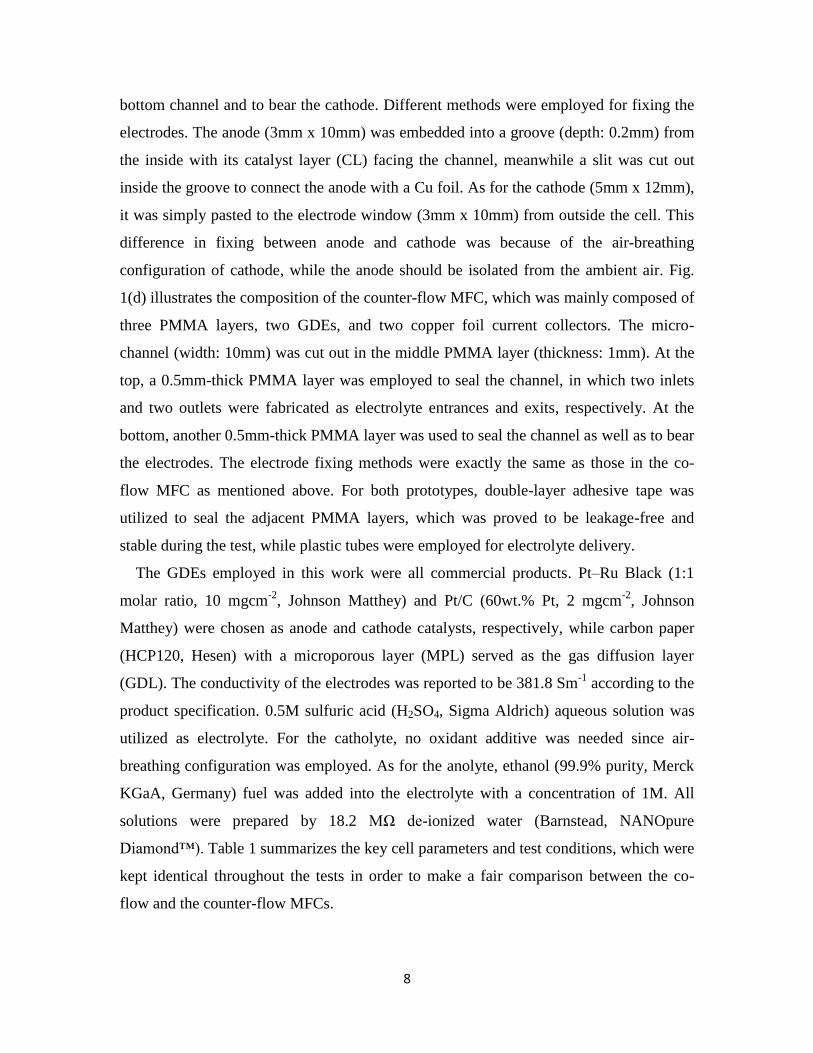
8
bottom channel and to bear the cathode. Different methods were employed for fixing the
electrodes. The anode (3mm x 10mm) was embedded into a groove (depth: 0.2mm) from
the inside with its catalyst layer (CL) facing the channel, meanwhile a slit was cut out
inside the groove to connect the anode with a Cu foil. As for the cathode (5mm x 12mm),
it was simply pasted to the electrode window (3mm x 10mm) from outside the cell. This
difference in fixing between anode and cathode was because of the air-breathing
configuration of cathode, while the anode should be isolated from the ambient air. Fig.
1(d) illustrates the composition of the counter-flow MFC, which was mainly composed of
three PMMA layers, two GDEs, and two copper foil current collectors. The micro-
channel (width: 10mm) was cut out in the middle PMMA layer (thickness: 1mm). At the
top, a 0.5mm-thick PMMA layer was employed to seal the channel, in which two inlets
and two outlets were fabricated as electrolyte entrances and exits, respectively. At the
bottom, another 0.5mm-thick PMMA layer was used to seal the channel as well as to bear
the electrodes. The electrode fixing methods were exactly the same as those in the co-
flow MFC as mentioned above. For both prototypes, double-layer adhesive tape was
utilized to seal the adjacent PMMA layers, which was proved to be leakage-free and
stable during the test, while plastic tubes were employed for electrolyte delivery.
The GDEs employed in this work were all commercial products. Pt–Ru Black (1:1
molar ratio, 10 mgcm-2
, Johnson Matthey) and Pt/C (60wt.% Pt, 2 mgcm-2
, Johnson
Matthey) were chosen as anode and cathode catalysts, respectively, while carbon paper
(HCP120, Hesen) with a microporous layer (MPL) served as the gas diffusion layer
(GDL). The conductivity of the electrodes was reported to be 381.8 Sm-1
according to the
product specification. 0.5M sulfuric acid (H2SO4, Sigma Aldrich) aqueous solution was
utilized as electrolyte. For the catholyte, no oxidant additive was needed since air-
breathing configuration was employed. As for the anolyte, ethanol (99.9% purity, Merck
KGaA, Germany) fuel was added into the electrolyte with a concentration of 1M. All
solutions were prepared by 18.2 MΩ de-ionized water (Barnstead, NANOpure
Diamond™). Table 1 summarizes the key cell parameters and test conditions, which were
kept identical throughout the tests in order to make a fair comparison between the co-
flow and the counter-flow MFCs.
9
A CHI660E electrochemical workstation (Shanghai Chenhua) was used to record the
experimental results. When the OCV stabilized, cell polarization curve was obtained by
measuring the potentiostatic currents at multiple potential steps from open-circuit to
short-circuit. Sufficient time was given for current stabilization at each potential step. To
obtain the single electrode potentials, a reference electrode (Ag/AgCl in saturated KCl,
Shanghai Leici) was placed in the exit fluid and connected to the cathode through a
multimeter (Fluke 116C).
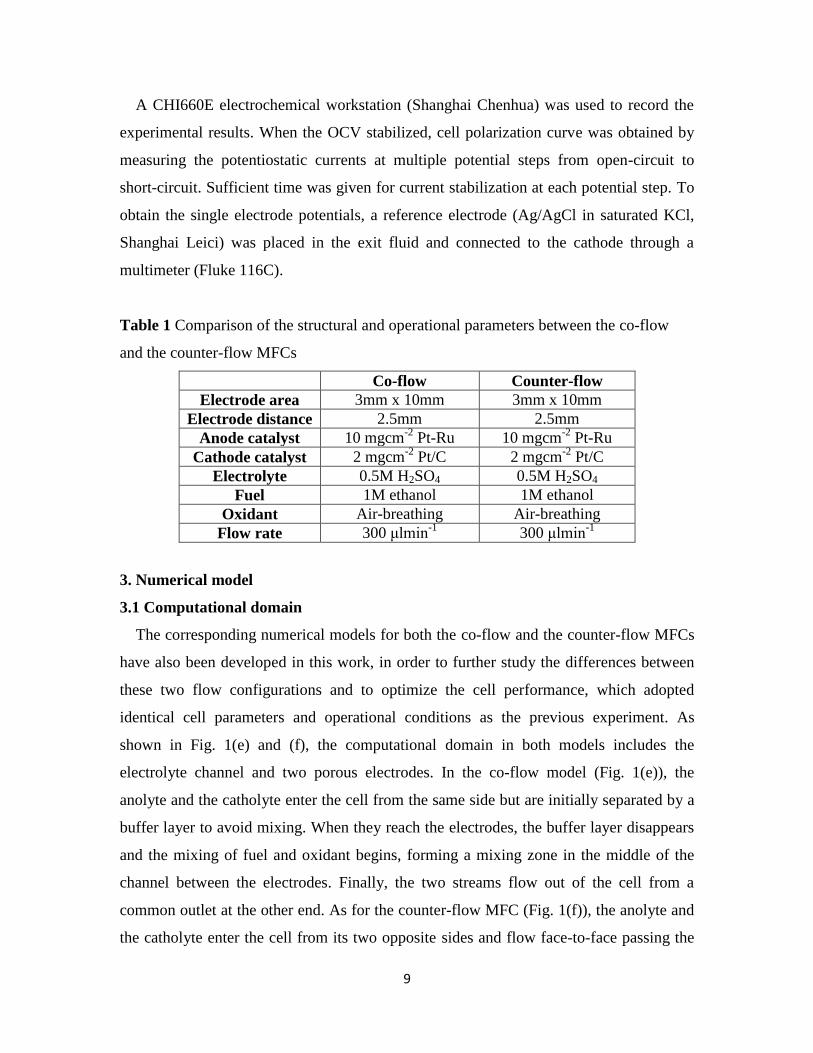
Table 1 Comparison of the structural and operational parameters between the co-flow
and the counter-flow MFCs
Co-flow Counter-flow
Electrode area 3mm x 10mm 3mm x 10mm
Electrode distance 2.5mm 2.5mm
Anode catalyst 10 mgcm-2
Pt-Ru 10 mgcm-2
Pt-Ru
Cathode catalyst 2 mgcm-2
Pt/C 2 mgcm-2
Pt/C
Electrolyte 0.5M H2SO4 0.5M H2SO4
Fuel 1M ethanol 1M ethanol
Oxidant Air-breathing Air-breathing
Flow rate 300 μlmin-1
300 μlmin-1
3. Numerical model
3.1 Computational domain
The corresponding numerical models for both the co-flow and the counter-flow MFCs
have also been developed in this work, in order to further study the differences between
these two flow configurations and to optimize the cell performance, which adopted
identical cell parameters and operational conditions as the previous experiment. As
shown in Fig. 1(e) and (f), the computational domain in both models includes the
electrolyte channel and two porous electrodes. In the co-flow model (Fig. 1(e)), the
anolyte and the catholyte enter the cell from the same side but are initially separated by a
buffer layer to avoid mixing. When they reach the electrodes, the buffer layer disappears
and the mixing of fuel and oxidant begins, forming a mixing zone in the middle of the
channel between the electrodes. Finally, the two streams flow out of the cell from a
common outlet at the other end. As for the counter-flow MFC (Fig. 1(f)), the anolyte and
the catholyte enter the cell from its two opposite sides and flow face-to-face passing the
10
corresponding electrodes, until they meet with each other in the middle of the channel. In
addition, double outlets are employed as electrolyte exit. The electrode employed here
includes both a gas diffusion layer (GDL) and a catalyst layer (CL), of which the latter is
simplified to a 2-D plane next to the channel surface, considering the small thickness of
CL (~20μm) compared with that of GDL (~200μm) in real cases.
During the previous experiment, no CO2 bubbles were observed because of the
relatively small current values. Therefore, gas bubble disturbance to the microfluidic flow
is not considered in the present models. In addition, the gravity effect is also neglected
considering the small size of the present models. According to Shaegh et al. [26], the
oxygen concentration gradient through the thin GDL is negligible in MFCs. Therefore,
the oxygen concentration at the cathode CL is assumed to be a constant, that is, the
solubility of air dissolved in water at saturated level (0.25 molL-1
[27, 28]).
3.2 Governing equations and boundary conditions
3.2.1 Hydrodynamics
The laminar flow in the micro-channel is governed by the continuity equation and
Navier-Stokes equation:
∇ ∙ (ρu) = 0 (1)
ρ(u ∙ ∇u) = −∇p + ∇ ∙ (μ(∇u)) (2)
3.2.2 Mass transport
Mass transport inside the flowing electrolyte is governed by the conservation equation
of species:
∇ ∙ (ρ𝜔𝑖u) = −∇ ∙ 𝑗𝑖 + 𝑆𝑖 (3)
Maxwell–Stefan theory with a mixture-average approximation is utilized to describe
the diffusion process of multiple components in water, including ethanol, oxygen and
H2SO4.
11
𝑗𝑖 = −(𝜌𝐷𝑖∇𝜔𝑖 + 𝜌𝜔𝑖𝐷𝑖∇𝑀𝑛
𝑀𝑛) (4)
𝐷𝑖 =1−𝜔𝑖
∑𝑥𝑘
𝐷𝑖𝑘𝑘≠𝑖
(5)
𝑀𝑛 = (∑𝜔𝑖
𝑀𝑖𝑖 )−1 (6)
Maxwell–Stefan diffusivities are calculated by the generalized Vignes equation [29]:
𝐷𝑖𝑗 = (𝐷𝑖𝑗𝑥𝑖
→1
)𝑥𝑖(𝐷𝑖𝑗
𝑥𝑗
→1)𝑥𝑗 ∏ (𝐷𝑖𝑗
𝑥𝑘
→1)𝑥𝑘𝑛
𝑘=1, 𝑘≠𝑖,𝑗 (7)
where “𝐷𝑖𝑗
𝑥𝑗
→1” means the diffusivity of species “i” in species “j” at infinite dilution,
which can be calculated by the Wilke-Chang Equation [30].
3.2.3 Electrochemical kinetics
Electrolyte potential is derived from the conservation equation of charge:
−σ∇φ = i (8)
The species consumption or production rates due to electrochemical reaction are
derived from:
𝑆𝑖 = 𝑀𝑖𝑣𝑖∇∙𝑖
𝑛𝑖𝐹 (9)
The current density is calculated by the Butler-Volmer equation. To consider the
negative effect of species crossover, both the main reaction and the parasitic reaction are
involved in the models [22, 31]. However, since the solubility of oxygen in water is
rather low compared with the fuel concentration, it is reasonable to neglect the effect of
oxygen crossover at the anode side [22]. Therefore, only the parasitic current of ethanol
oxidation at the cathode side is considered here.
12
𝑖𝑎 = 𝑖0,𝑎(𝑐𝑓
𝑐0,𝑓)𝜒(exp (
𝛼𝑎𝐹𝜂
𝑅𝑇) − exp (
−𝛼𝑐𝐹𝜂
𝑅𝑇)) (10)
𝑖𝑐,𝑚 = 𝑖0,𝑐(𝑐𝑜
𝑐0,𝑜)𝜒(exp (
𝛼𝑎𝐹𝜂
𝑅𝑇) − exp (
−𝛼𝑐𝐹𝜂
𝑅𝑇)) (11)
𝑖𝑐,𝑝 = 𝑖0,𝑎(𝑐𝑓
𝑐0,𝑓)𝜒(exp (
𝛼𝑎𝐹𝜂
𝑅𝑇) − exp (
−𝛼𝑐𝐹𝜂
𝑅𝑇)) (12)
𝑖𝑐 = 𝑖𝑐,𝑚 + 𝑖𝑐,𝑝 (13)
η = 𝜑𝑠 − 𝜑𝑙 − 𝐸𝑒𝑞 (14)
At the electrode surfaces, current source Q is derived from:
Q = ∇ ∙ 𝑖 (15)
3.2.4 Boundary conditions
At the inlet and outlet of the micro-channel, velocity and pressure are set as follows,
respectively:
𝑢𝑖𝑛𝑙𝑒𝑡 = 𝑢0 (16)
𝑃𝑜𝑢𝑡𝑙𝑒𝑡 = 0 (17)
In addition, the non-slip condition is applied to the channel boundaries where the velocity
is set to be zero. For the mass transport in the electrolyte, KOH and ethanol
concentrations are set at the flow inlet and convective mass transport is set at the flow
outlet. To simplify the cathode calculation, oxygen concentration at the cathode CL is set
to be a constant as mentioned in Section 3.1. For the current distribution calculation,
potential of the anode and cathode outer surfaces are set to be ground and cell voltage,
respectively.
Key input parameters used in this study are summarized in Table 2. Considering the
scarcity of the anode and cathode exchange current densities for the modeling of direct
ethanol microfluidic fuel cells, these values are fitted from our own experimental results.
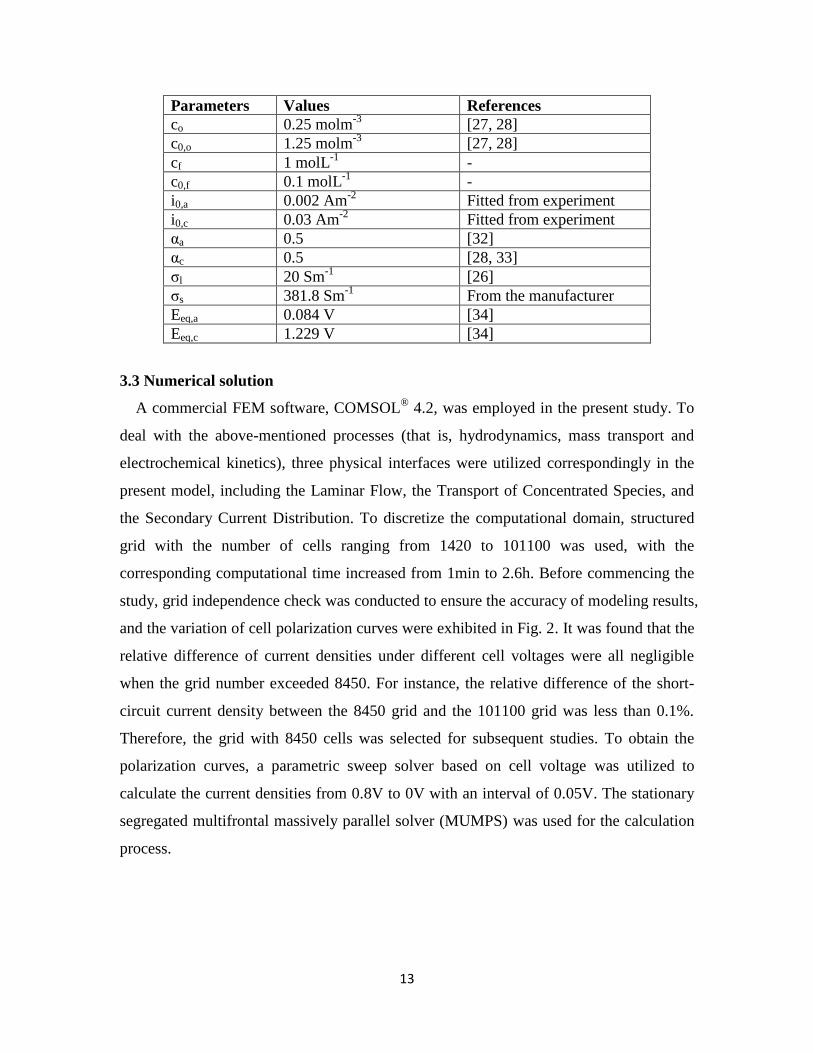
Table 2 Key input parameters in the present MFC models
13
Parameters Values References
co 0.25 molm-3
[27, 28]
c0,o 1.25 molm-3
[27, 28]
cf 1 molL-1
-
c0,f 0.1 molL-1
-
i0,a 0.002 Am-2
Fitted from experiment
i0,c 0.03 Am-2
Fitted from experiment
αa 0.5 [32]
αc 0.5 [28, 33]
σl 20 Sm-1
[26]
σs 381.8 Sm-1
From the manufacturer
Eeq,a 0.084 V [34]
Eeq,c 1.229 V [34]
3.3 Numerical solution
A commercial FEM software, COMSOL®
4.2, was employed in the present study. To
deal with the above-mentioned processes (that is, hydrodynamics, mass transport and
electrochemical kinetics), three physical interfaces were utilized correspondingly in the
present model, including the Laminar Flow, the Transport of Concentrated Species, and
the Secondary Current Distribution. To discretize the computational domain, structured
grid with the number of cells ranging from 1420 to 101100 was used, with the
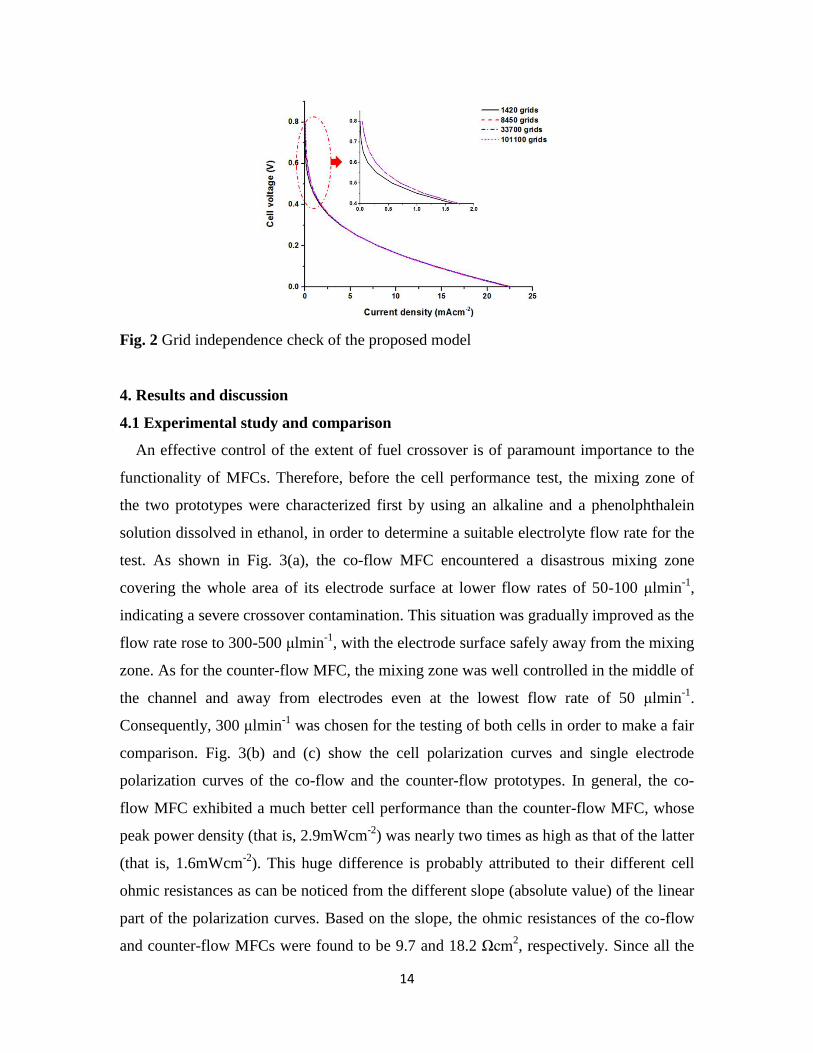
corresponding computational time increased from 1min to 2.6h. Before commencing the
study, grid independence check was conducted to ensure the accuracy of modeling results,
and the variation of cell polarization curves were exhibited in Fig. 2. It was found that the
relative difference of current densities under different cell voltages were all negligible
when the grid number exceeded 8450. For instance, the relative difference of the short-
circuit current density between the 8450 grid and the 101100 grid was less than 0.1%.
Therefore, the grid with 8450 cells was selected for subsequent studies. To obtain the
polarization curves, a parametric sweep solver based on cell voltage was utilized to
calculate the current densities from 0.8V to 0V with an interval of 0.05V. The stationary
segregated multifrontal massively parallel solver (MUMPS) was used for the calculation
process.
14
Fig. 2 Grid independence check of the proposed model
4. Results and discussion
4.1 Experimental study and comparison
An effective control of the extent of fuel crossover is of paramount importance to the
functionality of MFCs. Therefore, before the cell performance test, the mixing zone of
the two prototypes were characterized first by using an alkaline and a phenolphthalein
solution dissolved in ethanol, in order to determine a suitable electrolyte flow rate for the
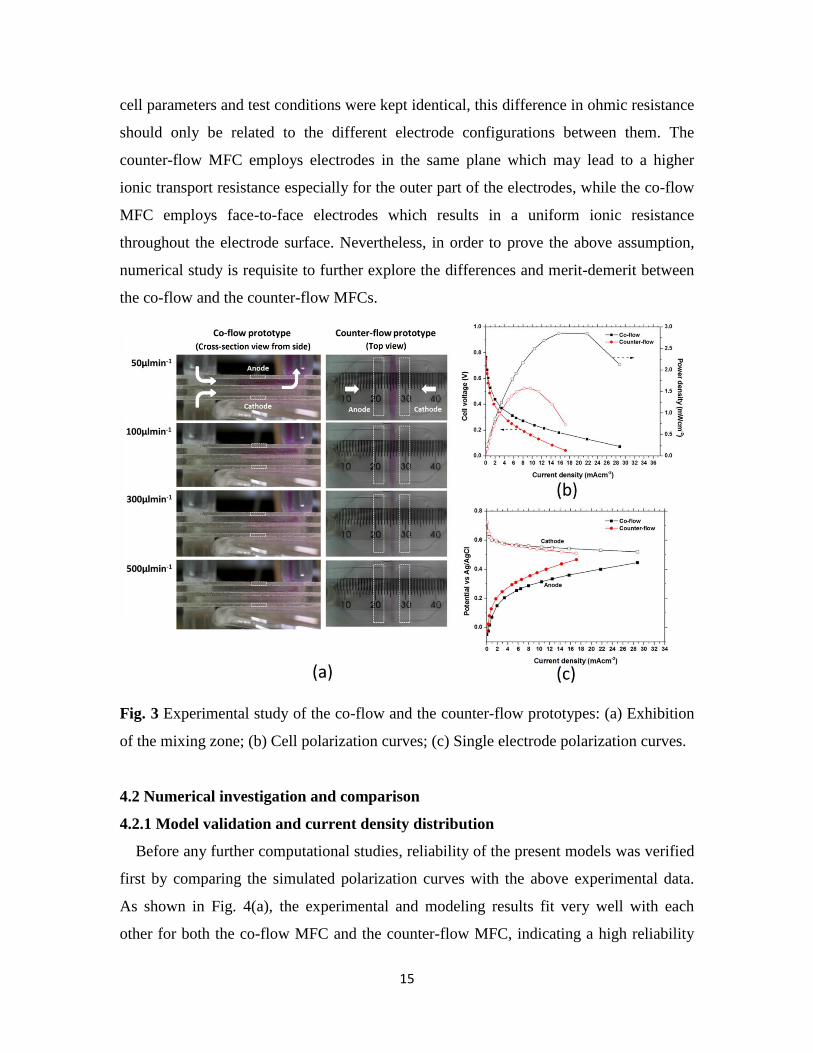
test. As shown in Fig. 3(a), the co-flow MFC encountered a disastrous mixing zone
covering the whole area of its electrode surface at lower flow rates of 50-100 μlmin-1
,
indicating a severe crossover contamination. This situation was gradually improved as the
flow rate rose to 300-500 μlmin-1
, with the electrode surface safely away from the mixing
zone. As for the counter-flow MFC, the mixing zone was well controlled in the middle of
the channel and away from electrodes even at the lowest flow rate of 50 μlmin-1
.
Consequently, 300 μlmin-1
was chosen for the testing of both cells in order to make a fair
comparison. Fig. 3(b) and (c) show the cell polarization curves and single electrode
polarization curves of the co-flow and the counter-flow prototypes. In general, the co-
flow MFC exhibited a much better cell performance than the counter-flow MFC, whose
peak power density (that is, 2.9mWcm-2
) was nearly two times as high as that of the latter
(that is, 1.6mWcm-2
). This huge difference is probably attributed to their different cell
ohmic resistances as can be noticed from the different slope (absolute value) of the linear
part of the polarization curves. Based on the slope, the ohmic resistances of the co-flow
and counter-flow MFCs were found to be 9.7 and 18.2 Ωcm2, respectively. Since all the
15
cell parameters and test conditions were kept identical, this difference in ohmic resistance
should only be related to the different electrode configurations between them. The
counter-flow MFC employs electrodes in the same plane which may lead to a higher
ionic transport resistance especially for the outer part of the electrodes, while the co-flow
MFC employs face-to-face electrodes which results in a uniform ionic resistance
throughout the electrode surface. Nevertheless, in order to prove the above assumption,
numerical study is requisite to further explore the differences and merit-demerit between
the co-flow and the counter-flow MFCs.
Fig. 3 Experimental study of the co-flow and the counter-flow prototypes: (a) Exhibition
of the mixing zone; (b) Cell polarization curves; (c) Single electrode polarization curves.
4.2 Numerical investigation and comparison
4.2.1 Model validation and current density distribution
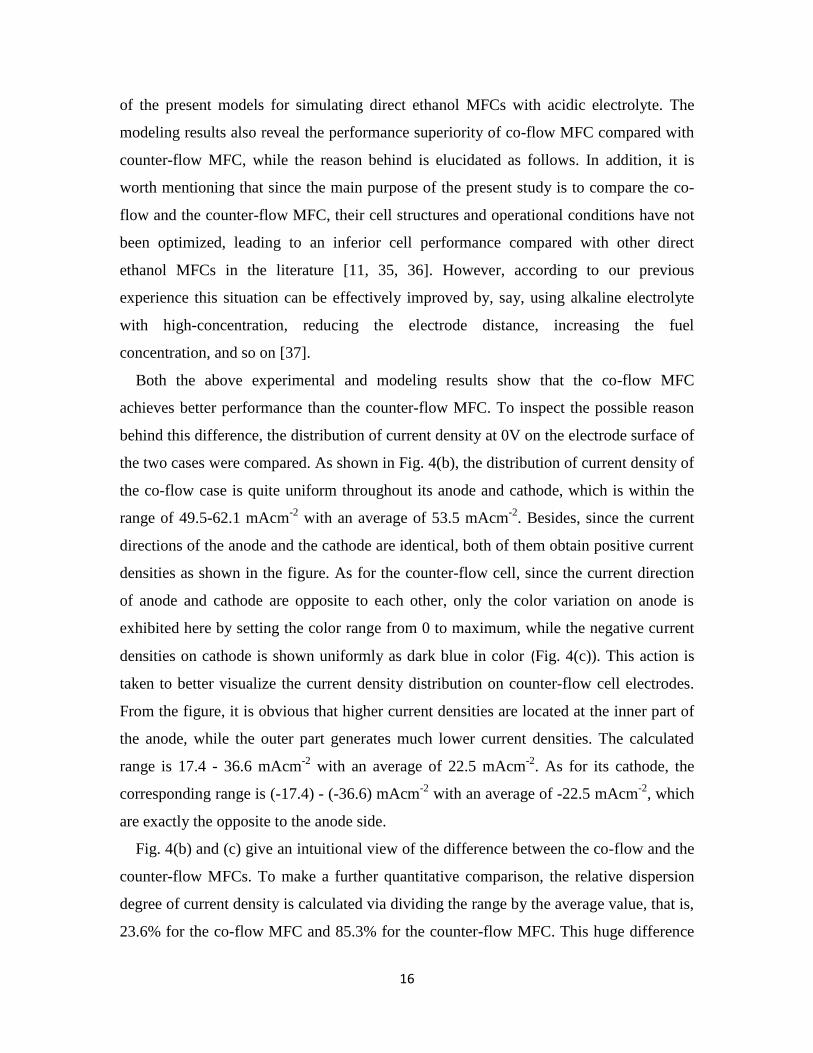
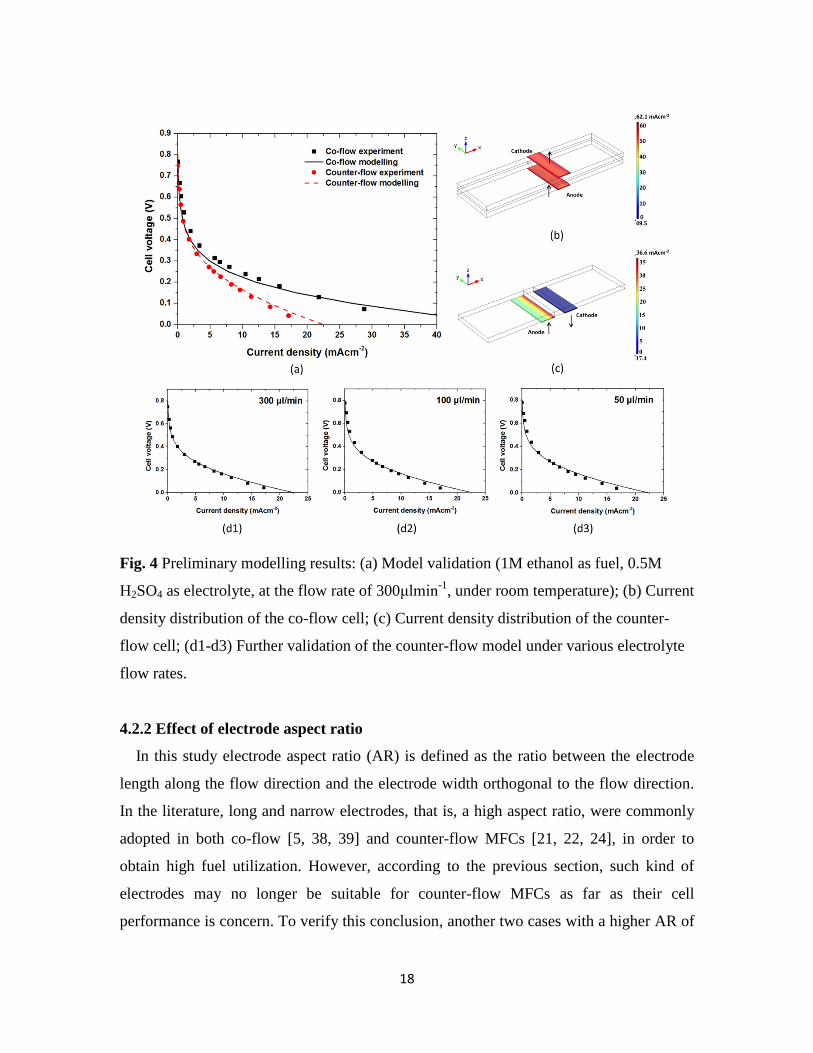
Before any further computational studies, reliability of the present models was verified
first by comparing the simulated polarization curves with the above experimental data.
As shown in Fig. 4(a), the experimental and modeling results fit very well with each
other for both the co-flow MFC and the counter-flow MFC, indicating a high reliability
16
of the present models for simulating direct ethanol MFCs with acidic electrolyte. The
modeling results also reveal the performance superiority of co-flow MFC compared with
counter-flow MFC, while the reason behind is elucidated as follows. In addition, it is
worth mentioning that since the main purpose of the present study is to compare the co-
flow and the counter-flow MFC, their cell structures and operational conditions have not
been optimized, leading to an inferior cell performance compared with other direct
ethanol MFCs in the literature [11, 35, 36]. However, according to our previous
experience this situation can be effectively improved by, say, using alkaline electrolyte
with high-concentration, reducing the electrode distance, increasing the fuel
concentration, and so on [37].
Both the above experimental and modeling results show that the co-flow MFC
achieves better performance than the counter-flow MFC. To inspect the possible reason
behind this difference, the distribution of current density at 0V on the electrode surface of
the two cases were compared. As shown in Fig. 4(b), the distribution of current density of
the co-flow case is quite uniform throughout its anode and cathode, which is within the
range of 49.5-62.1 mAcm-2
with an average of 53.5 mAcm-2
. Besides, since the current
directions of the anode and the cathode are identical, both of them obtain positive current
densities as shown in the figure. As for the counter-flow cell, since the current direction
of anode and cathode are opposite to each other, only the color variation on anode is
exhibited here by setting the color range from 0 to maximum, while the negative current
densities on cathode is shown uniformly as dark blue in color (Fig. 4(c)). This action is
taken to better visualize the current density distribution on counter-flow cell electrodes.
From the figure, it is obvious that higher current densities are located at the inner part of
the anode, while the outer part generates much lower current densities. The calculated
range is 17.4 - 36.6 mAcm-2
with an average of 22.5 mAcm-2
. As for its cathode, the
corresponding range is (-17.4) - (-36.6) mAcm-2
with an average of -22.5 mAcm-2
, which
are exactly the opposite to the anode side.
Fig. 4(b) and (c) give an intuitional view of the difference between the co-flow and the
counter-flow MFCs. To make a further quantitative comparison, the relative dispersion
degree of current density is calculated via dividing the range by the average value, that is,
23.6% for the co-flow MFC and 85.3% for the counter-flow MFC. This huge difference
17
in current distribution should be the main reason behind their performance difference. In
the co-flow MFC, since the electrodes are placed face-to-face, the electrode distance at
every point is the same (2.5mm), leading to a uniform ionic resistance throughout the
electrode surface. As for the counter-flow MFC, the electrodes are placed in the same
plane, so the inner part of it has a shorter ionic diffusion path while the outer part has a
much longer one. As a consequence, the outer part of electrode suffers from greater ionic
resistance and poorer electricity generation ability. This drawback of counter-flow MFC
is determined inherently by its special flow configuration, which can be improved by
structural optimization as will be discussed in Section 4.3 below. To support the
reliability of the optimization results, a more extended validation of the present counter-
flow MFC model in terms of electrolyte flow rate has been further conducted as shown in
Fig. 4(d1-d3). The simulation results can still fit the experimental data very well. In
addition, it is worth mentioning that the difference in cell performance under the three
different electrolyte flow rates is very limited. This phenomenon will be further
investigated and elaborated in Section 4.2.4.
18
Fig. 4 Preliminary modelling results: (a) Model validation (1M ethanol as fuel, 0.5M
H2SO4 as electrolyte, at the flow rate of 300μlmin-1
, under room temperature); (b) Current
density distribution of the co-flow cell; (c) Current density distribution of the counter-
flow cell; (d1-d3) Further validation of the counter-flow model under various electrolyte
flow rates.
4.2.2 Effect of electrode aspect ratio
In this study electrode aspect ratio (AR) is defined as the ratio between the electrode
length along the flow direction and the electrode width orthogonal to the flow direction.
In the literature, long and narrow electrodes, that is, a high aspect ratio, were commonly
adopted in both co-flow [5, 38, 39] and counter-flow MFCs [21, 22, 24], in order to
obtain high fuel utilization. However, according to the previous section, such kind of
electrodes may no longer be suitable for counter-flow MFCs as far as their cell
performance is concern. To verify this conclusion, another two cases with a higher AR of
19
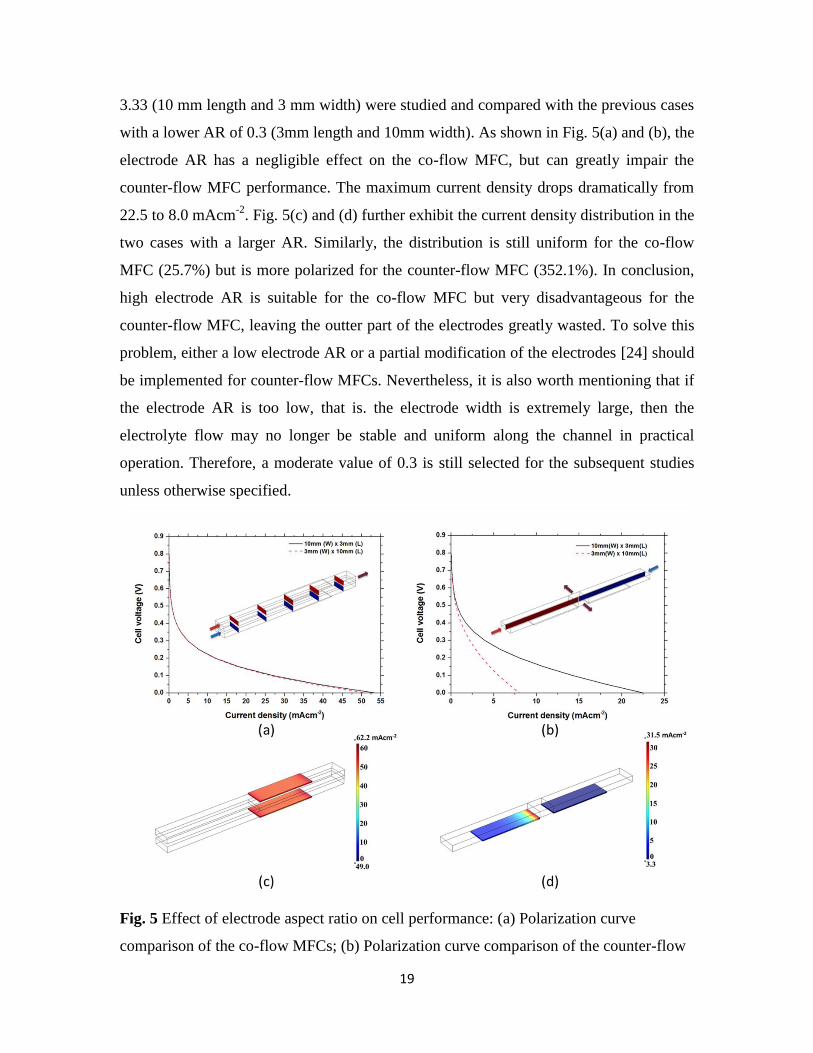
3.33 (10 mm length and 3 mm width) were studied and compared with the previous cases
with a lower AR of 0.3 (3mm length and 10mm width). As shown in Fig. 5(a) and (b), the
electrode AR has a negligible effect on the co-flow MFC, but can greatly impair the
counter-flow MFC performance. The maximum current density drops dramatically from
22.5 to 8.0 mAcm-2
. Fig. 5(c) and (d) further exhibit the current density distribution in the
two cases with a larger AR. Similarly, the distribution is still uniform for the co-flow
MFC (25.7%) but is more polarized for the counter-flow MFC (352.1%). In conclusion,
high electrode AR is suitable for the co-flow MFC but very disadvantageous for the
counter-flow MFC, leaving the outter part of the electrodes greatly wasted. To solve this
problem, either a low electrode AR or a partial modification of the electrodes [24] should
be implemented for counter-flow MFCs. Nevertheless, it is also worth mentioning that if
the electrode AR is too low, that is. the electrode width is extremely large, then the
electrolyte flow may no longer be stable and uniform along the channel in practical
operation. Therefore, a moderate value of 0.3 is still selected for the subsequent studies
unless otherwise specified.
Fig. 5 Effect of electrode aspect ratio on cell performance: (a) Polarization curve
comparison of the co-flow MFCs; (b) Polarization curve comparison of the counter-flow
20
MFCs; (c) Current density distribution on the electrodes of the co-flow MFC; (d) Current
density distribution on the electrodes of the counter-flow MFC.
4.2.3 Effect of channel thickness
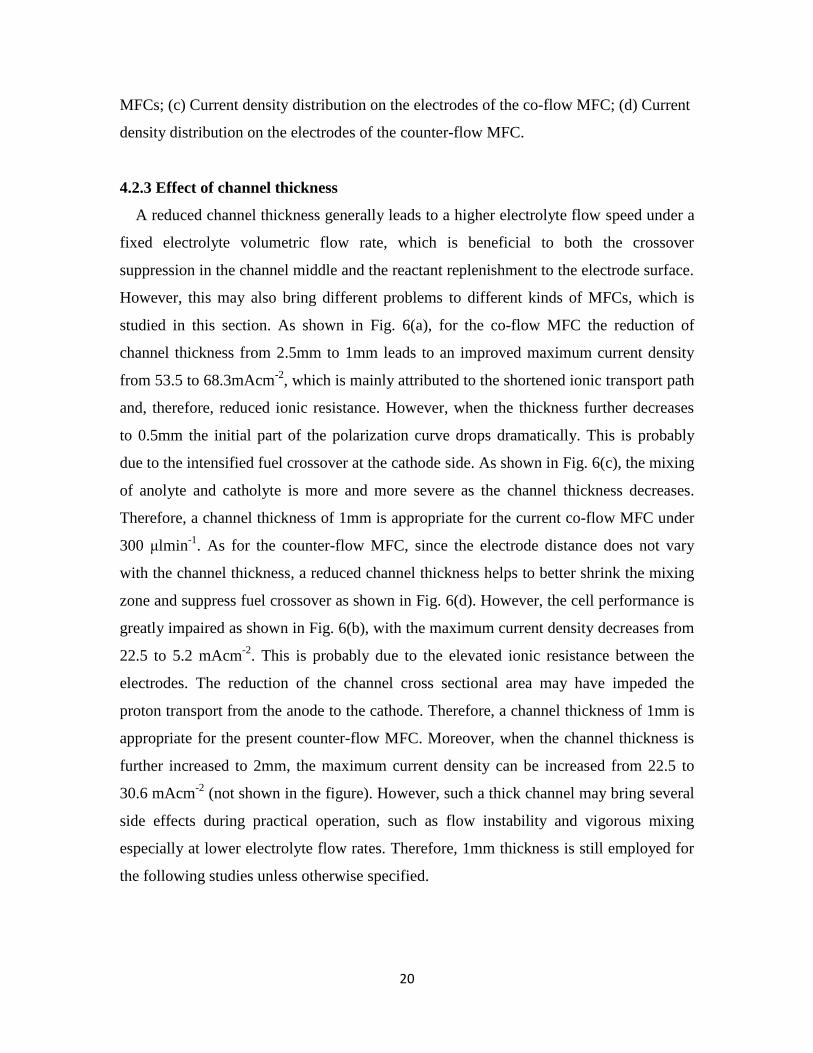
A reduced channel thickness generally leads to a higher electrolyte flow speed under a
fixed electrolyte volumetric flow rate, which is beneficial to both the crossover
suppression in the channel middle and the reactant replenishment to the electrode surface.
However, this may also bring different problems to different kinds of MFCs, which is
studied in this section. As shown in Fig. 6(a), for the co-flow MFC the reduction of
channel thickness from 2.5mm to 1mm leads to an improved maximum current density
from 53.5 to 68.3mAcm-2
, which is mainly attributed to the shortened ionic transport path
and, therefore, reduced ionic resistance. However, when the thickness further decreases
to 0.5mm the initial part of the polarization curve drops dramatically. This is probably
due to the intensified fuel crossover at the cathode side. As shown in Fig. 6(c), the mixing
of anolyte and catholyte is more and more severe as the channel thickness decreases.
Therefore, a channel thickness of 1mm is appropriate for the current co-flow MFC under
300 μlmin-1
. As for the counter-flow MFC, since the electrode distance does not vary
with the channel thickness, a reduced channel thickness helps to better shrink the mixing
zone and suppress fuel crossover as shown in Fig. 6(d). However, the cell performance is
greatly impaired as shown in Fig. 6(b), with the maximum current density decreases from
22.5 to 5.2 mAcm-2
. This is probably due to the elevated ionic resistance between the
electrodes. The reduction of the channel cross sectional area may have impeded the
proton transport from the anode to the cathode. Therefore, a channel thickness of 1mm is
appropriate for the present counter-flow MFC. Moreover, when the channel thickness is
further increased to 2mm, the maximum current density can be increased from 22.5 to
30.6 mAcm-2
(not shown in the figure). However, such a thick channel may bring several
side effects during practical operation, such as flow instability and vigorous mixing
especially at lower electrolyte flow rates. Therefore, 1mm thickness is still employed for
the following studies unless otherwise specified.
21
Fig. 6 Different responses of co-flow and counter-flow MFCs to channel thickness: (a)
Performance variation of co-flow MFC; (b) Performance variation of counter-flow MFC;
(c) Mixing zone variation of co-flow MFC; (d) Mixing zone variation of counter-flow
MFC.
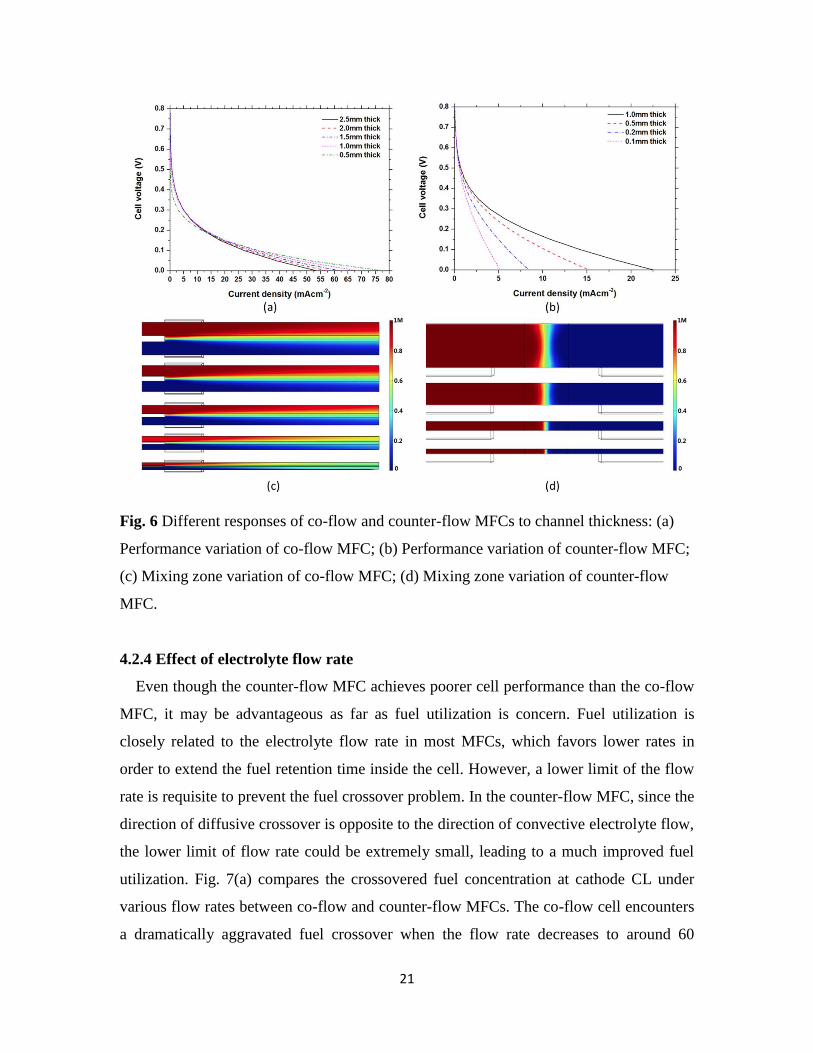
4.2.4 Effect of electrolyte flow rate
Even though the counter-flow MFC achieves poorer cell performance than the co-flow
MFC, it may be advantageous as far as fuel utilization is concern. Fuel utilization is
closely related to the electrolyte flow rate in most MFCs, which favors lower rates in
order to extend the fuel retention time inside the cell. However, a lower limit of the flow
rate is requisite to prevent the fuel crossover problem. In the counter-flow MFC, since the
direction of diffusive crossover is opposite to the direction of convective electrolyte flow,
the lower limit of flow rate could be extremely small, leading to a much improved fuel
utilization. Fig. 7(a) compares the crossovered fuel concentration at cathode CL under
various flow rates between co-flow and counter-flow MFCs. The co-flow cell encounters
a dramatically aggravated fuel crossover when the flow rate decreases to around 60

22
μlmin-1
, while the counter-flow MFC can tolerate a flow rate as low as 5 μlmin-1
. At an
extremely low flow rate of 1 μlmin-1
, the crossovered fuel concentration at cathode CL is
as high as 370 mM for the co-flow case, while the value can still be maintained less than
40 mM for the counter-flow case. Fig. 7(b) shows the fuel concentration distribution
under four different flow rates. It is apparent that the mixing is more drastic in the co-
flow channel than in the counter-flow one especially at lower flow rates. Furthermore,
Fig. 7(c) and (d) exhibit the degradation of cell performance with the decrease of flow
rate for the co-flow and the counter-flow cells, respectively. The former case encounters
a much greater degradation in both its OCV and maximum current density due to the
increasing severity of the fuel crossover, while the latter case achieves a fairly uniform
cell performance from 300 to 5 μlmin-1
. Even at 1 μlmin-1
, the counter-flow cell can still
function well which retains 90% of its maximum current density. The fuel utilization is
calculated based on the following equation:
𝜉𝑓𝑢𝑒𝑙 =𝐼𝑚𝑎𝑥
𝑛𝐹𝑣𝑐 (18)
where Imax, n, F, v, c represent, respectively, the maximum current, the number of
electron transferred in the reaction, the Faraday’s constant, the volumetric electrolyte
flow rate, and the fuel concentration. If the crossovered fuel concentration at cathode CL
is stipulated to be less than 1% of the fuel concentration (that is, 10 mM), then the
minimum flow rate for the co-flow and the counter-flow cells are 30 and 2 μlmin-1
, and
the corresponding fuel utilizations are calculated to be 2.7% and 16.6%, respectively. It is
noteworthy that these moderate values can be further improved by using high-
concentration alkaline electrolytes instead of the present low-concentration acid
electrolyte. In conclusion, the counter-flow MFC can adapt a much lower electrolyte flow
rate to maintain its normal operation, leading to a much improved fuel utilization and
reduced parasitic energy loss. In addition, electrolyte storage in the MFC system is also
greatly alleviated. All these merits make counter-flow MFCs more suitable for practical
applications than its co-flow counterpart, which could be even more advantageous if their
cell performance can be further optimized, as will be discussed in Section 4.3 below.
23
Fig. 7 Different sensitivity of co-flow and counter-flow MFCs to electrolyte flow rate: (a)
Fuel concentration at cathode CL; (b) Extent of fuel crossover under four different flow
rates; (c) Co-flow MFC performances under four different flow rates; (d) Counter-flow
MFC performances under four different flow rates.
4.3 Optimization of the counter-flow MFC
4.3.1 Effect of electrode distance
Since the ionic resistance between the two electrodes is the most significant factor that
restricts the counter-flow cell performance, it is straightforward to move its electrodes
closer to each other in order to promote the ionic conduction. A series of different
electrode distances from 2.5 to 0.5 mm have been studied under an electrolyte flow rate
of 300 μlmin-1
with their cell performances compared. As shown in Fig. 8(a), when the
electrode distance decreases from 2.5mm to 1mm, the cell performance is gradually
improved with the maximum current density increased from 22.5 to 28.9mAcm-2
.
However, when the distance further decreases to only 0.5mm, even though there is a
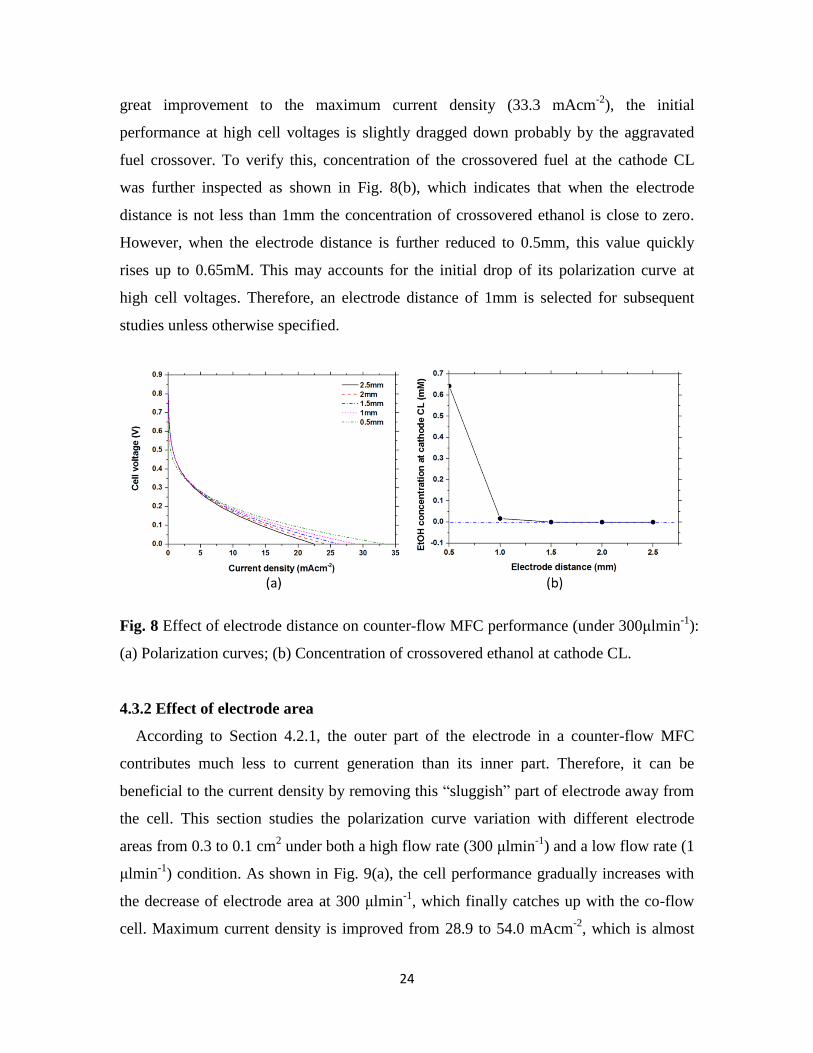
24
great improvement to the maximum current density (33.3 mAcm-2
), the initial
performance at high cell voltages is slightly dragged down probably by the aggravated
fuel crossover. To verify this, concentration of the crossovered fuel at the cathode CL
was further inspected as shown in Fig. 8(b), which indicates that when the electrode
distance is not less than 1mm the concentration of crossovered ethanol is close to zero.
However, when the electrode distance is further reduced to 0.5mm, this value quickly
rises up to 0.65mM. This may accounts for the initial drop of its polarization curve at
high cell voltages. Therefore, an electrode distance of 1mm is selected for subsequent
studies unless otherwise specified.
Fig. 8 Effect of electrode distance on counter-flow MFC performance (under 300μlmin-1
):
(a) Polarization curves; (b) Concentration of crossovered ethanol at cathode CL.
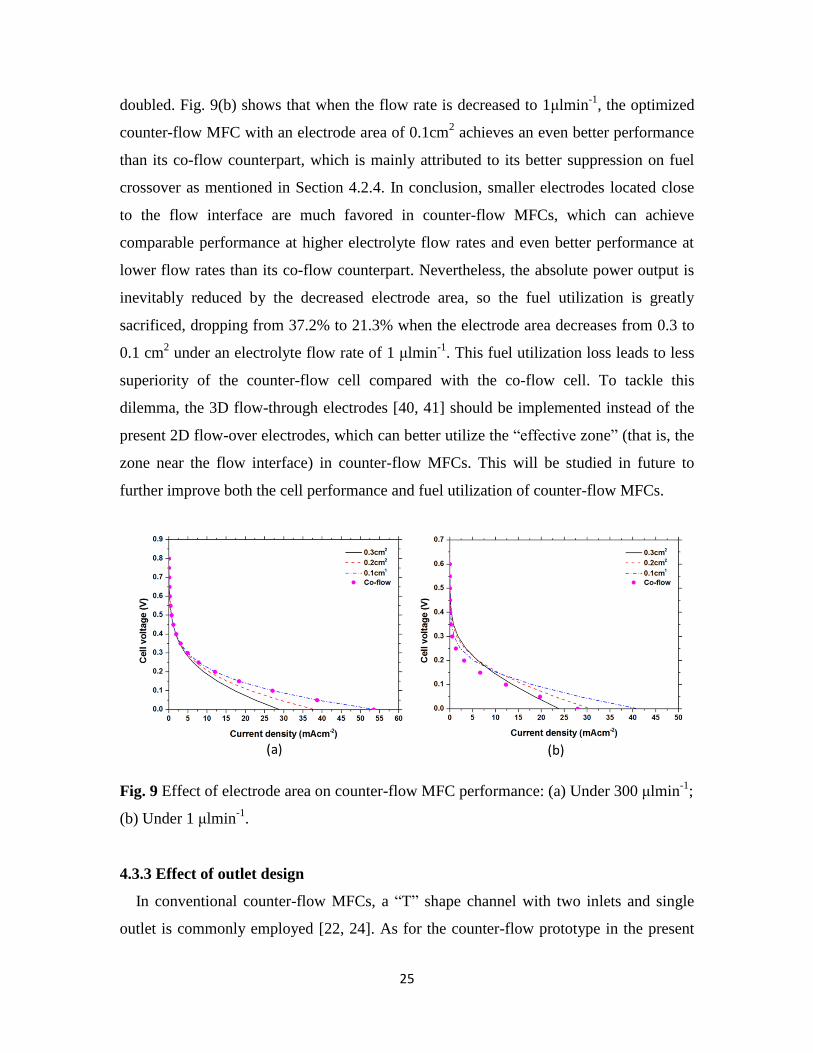
4.3.2 Effect of electrode area
According to Section 4.2.1, the outer part of the electrode in a counter-flow MFC
contributes much less to current generation than its inner part. Therefore, it can be
beneficial to the current density by removing this “sluggish” part of electrode away from
the cell. This section studies the polarization curve variation with different electrode
areas from 0.3 to 0.1 cm2 under both a high flow rate (300 μlmin
-1) and a low flow rate (1
μlmin-1
) condition. As shown in Fig. 9(a), the cell performance gradually increases with
the decrease of electrode area at 300 μlmin-1
, which finally catches up with the co-flow
cell. Maximum current density is improved from 28.9 to 54.0 mAcm-2
, which is almost
25
doubled. Fig. 9(b) shows that when the flow rate is decreased to 1μlmin-1
, the optimized
counter-flow MFC with an electrode area of 0.1cm2 achieves an even better performance
than its co-flow counterpart, which is mainly attributed to its better suppression on fuel
crossover as mentioned in Section 4.2.4. In conclusion, smaller electrodes located close
to the flow interface are much favored in counter-flow MFCs, which can achieve
comparable performance at higher electrolyte flow rates and even better performance at
lower flow rates than its co-flow counterpart. Nevertheless, the absolute power output is
inevitably reduced by the decreased electrode area, so the fuel utilization is greatly
sacrificed, dropping from 37.2% to 21.3% when the electrode area decreases from 0.3 to
0.1 cm2 under an electrolyte flow rate of 1 μlmin
-1. This fuel utilization loss leads to less
superiority of the counter-flow cell compared with the co-flow cell. To tackle this
dilemma, the 3D flow-through electrodes [40, 41] should be implemented instead of the
present 2D flow-over electrodes, which can better utilize the “effective zone” (that is, the
zone near the flow interface) in counter-flow MFCs. This will be studied in future to
further improve both the cell performance and fuel utilization of counter-flow MFCs.
Fig. 9 Effect of electrode area on counter-flow MFC performance: (a) Under 300 μlmin-1
;
(b) Under 1 μlmin-1
.
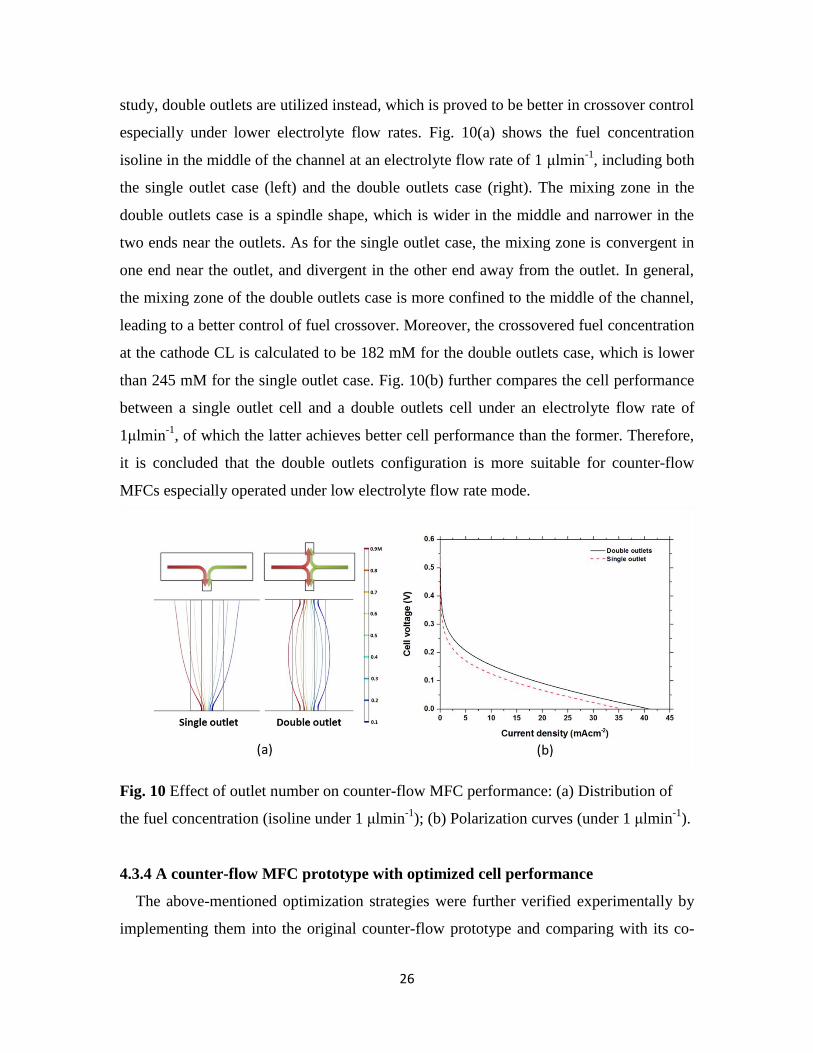
4.3.3 Effect of outlet design
In conventional counter-flow MFCs, a “T” shape channel with two inlets and single
outlet is commonly employed [22, 24]. As for the counter-flow prototype in the present
26
study, double outlets are utilized instead, which is proved to be better in crossover control
especially under lower electrolyte flow rates. Fig. 10(a) shows the fuel concentration
isoline in the middle of the channel at an electrolyte flow rate of 1 μlmin-1
, including both
the single outlet case (left) and the double outlets case (right). The mixing zone in the
double outlets case is a spindle shape, which is wider in the middle and narrower in the
two ends near the outlets. As for the single outlet case, the mixing zone is convergent in
one end near the outlet, and divergent in the other end away from the outlet. In general,
the mixing zone of the double outlets case is more confined to the middle of the channel,
leading to a better control of fuel crossover. Moreover, the crossovered fuel concentration
at the cathode CL is calculated to be 182 mM for the double outlets case, which is lower
than 245 mM for the single outlet case. Fig. 10(b) further compares the cell performance
between a single outlet cell and a double outlets cell under an electrolyte flow rate of
1μlmin-1
, of which the latter achieves better cell performance than the former. Therefore,
it is concluded that the double outlets configuration is more suitable for counter-flow
MFCs especially operated under low electrolyte flow rate mode.
Fig. 10 Effect of outlet number on counter-flow MFC performance: (a) Distribution of
the fuel concentration (isoline under 1 μlmin-1
); (b) Polarization curves (under 1 μlmin-1
).
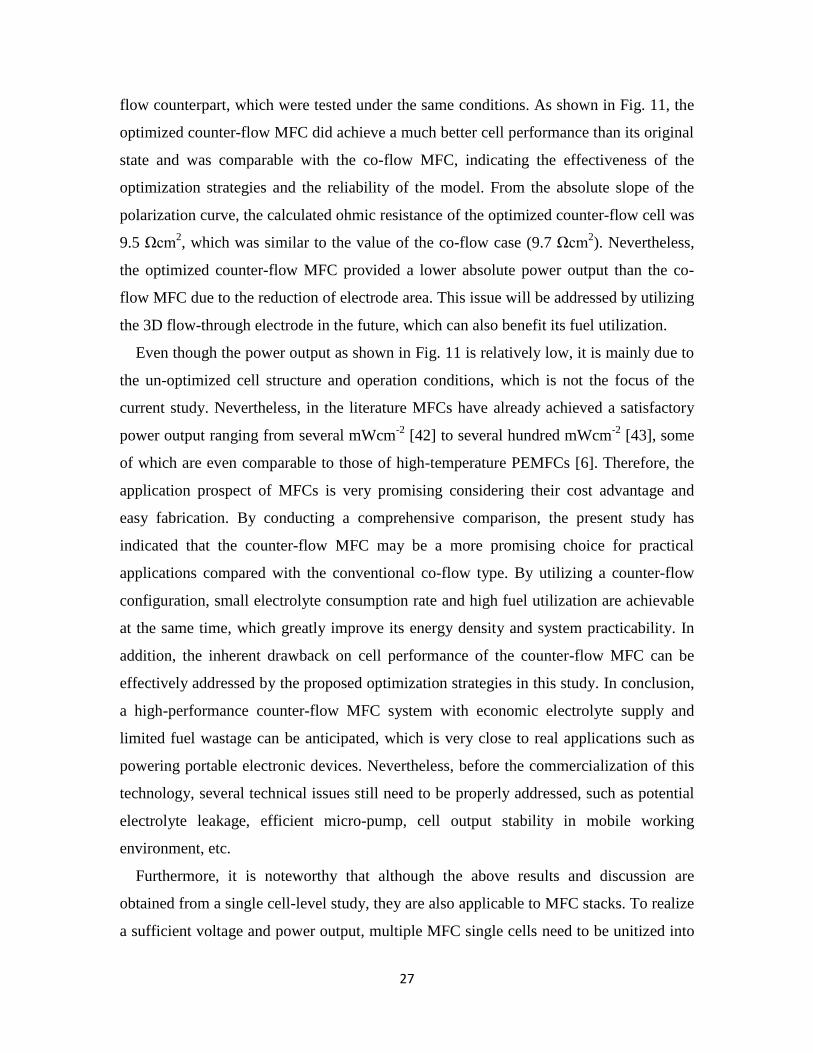
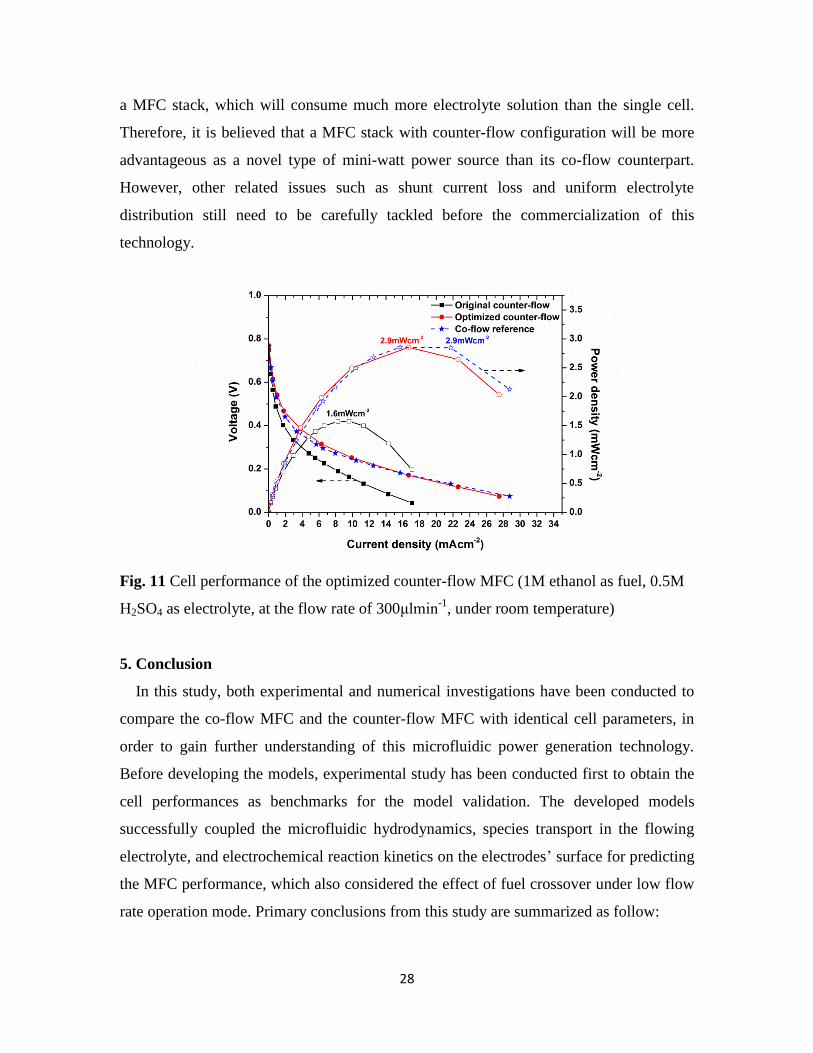
4.3.4 A counter-flow MFC prototype with optimized cell performance
The above-mentioned optimization strategies were further verified experimentally by
implementing them into the original counter-flow prototype and comparing with its co-
27
flow counterpart, which were tested under the same conditions. As shown in Fig. 11, the
optimized counter-flow MFC did achieve a much better cell performance than its original
state and was comparable with the co-flow MFC, indicating the effectiveness of the
optimization strategies and the reliability of the model. From the absolute slope of the
polarization curve, the calculated ohmic resistance of the optimized counter-flow cell was
9.5 Ωcm2, which was similar to the value of the co-flow case (9.7 Ωcm
2). Nevertheless,
the optimized counter-flow MFC provided a lower absolute power output than the co-
flow MFC due to the reduction of electrode area. This issue will be addressed by utilizing
the 3D flow-through electrode in the future, which can also benefit its fuel utilization.
Even though the power output as shown in Fig. 11 is relatively low, it is mainly due to
the un-optimized cell structure and operation conditions, which is not the focus of the
current study. Nevertheless, in the literature MFCs have already achieved a satisfactory
power output ranging from several mWcm-2
[42] to several hundred mWcm-2
[43], some
of which are even comparable to those of high-temperature PEMFCs [6]. Therefore, the
application prospect of MFCs is very promising considering their cost advantage and
easy fabrication. By conducting a comprehensive comparison, the present study has
indicated that the counter-flow MFC may be a more promising choice for practical
applications compared with the conventional co-flow type. By utilizing a counter-flow
configuration, small electrolyte consumption rate and high fuel utilization are achievable
at the same time, which greatly improve its energy density and system practicability. In
addition, the inherent drawback on cell performance of the counter-flow MFC can be
effectively addressed by the proposed optimization strategies in this study. In conclusion,
a high-performance counter-flow MFC system with economic electrolyte supply and
limited fuel wastage can be anticipated, which is very close to real applications such as
powering portable electronic devices. Nevertheless, before the commercialization of this
technology, several technical issues still need to be properly addressed, such as potential
electrolyte leakage, efficient micro-pump, cell output stability in mobile working
environment, etc.
Furthermore, it is noteworthy that although the above results and discussion are
obtained from a single cell-level study, they are also applicable to MFC stacks. To realize
a sufficient voltage and power output, multiple MFC single cells need to be unitized into
28
a MFC stack, which will consume much more electrolyte solution than the single cell.
Therefore, it is believed that a MFC stack with counter-flow configuration will be more
advantageous as a novel type of mini-watt power source than its co-flow counterpart.
However, other related issues such as shunt current loss and uniform electrolyte
distribution still need to be carefully tackled before the commercialization of this
technology.
Fig. 11 Cell performance of the optimized counter-flow MFC (1M ethanol as fuel, 0.5M
H2SO4 as electrolyte, at the flow rate of 300μlmin-1
, under room temperature)
5. Conclusion
In this study, both experimental and numerical investigations have been conducted to
compare the co-flow MFC and the counter-flow MFC with identical cell parameters, in
order to gain further understanding of this microfluidic power generation technology.
Before developing the models, experimental study has been conducted first to obtain the
cell performances as benchmarks for the model validation. The developed models
successfully coupled the microfluidic hydrodynamics, species transport in the flowing
electrolyte, and electrochemical reaction kinetics on the electrodes’ surface for predicting
the MFC performance, which also considered the effect of fuel crossover under low flow
rate operation mode. Primary conclusions from this study are summarized as follow:
29
The counter-flow MFC is found to suffer an inherent disadvantage on its power
output ability, whose peak power density is only half of that of the co-flow MFC.
This is mainly attributed to the uneven ionic resistance across its electrode surface.
Therefore, shorter and wider electrodes (that is, smaller aspect ratio) are more
suitable for the counter-flow cell rather than longer and narrower electrodes (that
is, higher aspect ratio).
The counter-flow MFC achieves a much higher tolerance to extremely low flow
rates than the co-flow MFC. When the concentration of crossovered fuel at
cathode surface is stipulated to be less than 10 mM, the counter-flow cell can
utilize a 15 times lower electrolyte flow rate and obtain a 6 times higher fuel
utilization. This superiority in fuel utilization and energy density makes the
counter-flow cell more competitive for practical applications, which is attributed
to its special flow configuration in which the diffusive fuel crossover is impeded
by the convective electrolyte flow.
The inferior cell performance of the counter-flow cell can be optimized by
employing narrower electrode distance, smaller electrode area close to the flow
interface, and double outlets. With these strategies, the optimized counter-flow
prototype achieves the same level power output with its co-flow counterpart. To
further improve its power output, the 3D flow-through electrodes should be
adopted to better utilize the effective zone inside the counter-flow MFC.
Acknowledgement
This project is supported by a funding of the Hong Kong Research Grant Council GRF
#714313.

30
References
[1] Ferrigno R, Stroock AD, Clark TD, Mayer M, Whitesides GM. Membraneless vanadium redox fuel cell using laminar flow. Journal of the American Chemical Society. 2002;124:12930-1. [2] Choban ER, Markoski LJ, Stoltzfus J, Moore JS, Kenis PJ. Microfluidic fuel cells that lack a PEM. Power Sources Proceedings2002. p. 317-20. [3] Kjeang E, Djilali N, Sinton D. Microfluidic fuel cells: A review. Journal of Power Sources. 2009;186:353-69. [4] Shaegh SAM, Nguyen N-T, Chan SH. A review on membraneless laminar flow-based fuel cells. International Journal of Hydrogen Energy. 2011;36:5675-94. [5] Kjeang E, Proctor BT, Brolo AG, Harrington DA, Djilali N, Sinton D. High-performance microfluidic vanadium redox fuel cell. Electrochimica Acta. 2007;52:4942-6. [6] Lu X, Xuan J, Leung DY, Zou H, Li J, Wang H, et al. A switchable pH-differential unitized regenerative fuel cell with high performance. Journal of Power Sources. 2016;314:76-84. [7] Hollinger AS, Maloney RJ, Jayashree RS, Natarajan D, Markoski LJ, Kenis PJA. Nanoporous separator and low fuel concentration to minimize crossover in direct methanol laminar flow fuel cells. Journal of Power Sources. 2010;195:3523-8. [8] Jayashree RS, Yoon SK, Brushett FR, Lopez-Montesinos PO, Natarajan D, Markoski LJ, et al. On the performance of membraneless laminar flow-based fuel cells. Journal of Power Sources. 2010;195:3569-78. [9] Ibrahim OA, Goulet M-A, Kjeang E. In-situ characterization of symmetric dual-pass architecture of microfluidic co-laminar flow cells. Electrochimica Acta. 2016;187:277-85. [10] Gurrola M, Ortiz-Ortega E, Farias-Zuñiga C, Chávez-Ramírez A, Ledesma-García J, Arriaga L. Evaluation and coupling of a membraneless nanofluidic device for low-power applications. Journal of Power Sources. 2016;307:244-50. [11] López-Rico C, Galindo-de-la-Rosa J, Ledesma-García J, Arriaga L, Guerra-Balcázar M, Arjona N. Effect of pH in a Pd-based ethanol membraneless air breathing nanofluidic fuel cell with flow-through electrodes. Journal of Physics: Conference Series: IOP Publishing; 2015. p. 012056. [12] Bazylak A, Sinton D, Djilali N. Improved fuel utilization in microfluidic fuel cells: A computational study. Journal of Power Sources. 2005;143:57-66. [13] Chang M-H, Chen F, Fang N-S. Analysis of membraneless fuel cell using laminar flow in a Y-shaped microchannel. Journal of Power Sources. 2006;159:810-6. [14] Phirani J, Basu S. Analyses of fuel utilization in microfluidic fuel cell. Journal of Power Sources. 2008;175:261-5. [15] Lee J, Lim KG, Palmore GTR, Tripathi A. Optimization of microfluidic fuel cells using transport principles. Analytical chemistry. 2007;79:7301-7. [16] Ahmed DH, Park HB, Sung HJ. Optimum geometrical design for improved fuel utilization in membraneless micro fuel cell. Journal of Power Sources. 2008;185:143-52. [17] Xuan J, Leung MKH, Leung DYC, Ni M, Wang H. Hydrodynamic focusing in microfluidic membraneless fuel cells: Breaking the trade-off between fuel utilization and current density. International Journal of Hydrogen Energy. 2011;36:11075-84. [18] Khabbazi AE, Richards A, Hoorfar M. Numerical study of the effect of the channel and electrode geometry on the performance of microfluidic fuel cells. Journal of Power Sources. 2010;195:8141-51. [19] Zhang B, Ye D-d, Sui P-C, Djilali N, Zhu X. Computational modeling of air-breathing microfluidic fuel cells with flow-over and flow-through anodes. Journal of Power Sources. 2014;259:15-24.
31
[20] García-Cuevas RA, Cervantes I, Arriaga LG, Diaz-Diaz IA. Toward geometrical design improvement of membraneless fuel cells: Numerical study. International Journal of Hydrogen Energy. 2013;38:14791-800. [21] Xuan J, Leung DY, Leung MK, Wang H, Ni M. Chaotic flow-based fuel cell built on counter-flow microfluidic network: Predicting the over-limiting current behavior. Journal of Power Sources. 2011;196:9391-7. [22] Xu H, Zhang H, Wang H, Leung DY, Zhang L, Cao J, et al. Counter-flow formic acid microfluidic fuel cell with high fuel utilization exceeding 90%. Applied Energy. 2015;160:930-6. [23] Krishnamurthy D, Johansson EO, Lee JW, Kjeang E. Computational modeling of microfluidic fuel cells with flow-through porous electrodes. Journal of Power Sources. 2011;196:10019-31. [24] Li L, Zheng K, Ni M, Leung MK, Xuan J. Partial modification of flow-through porous electrodes in microfluidic fuel cell. Energy. 2015;88:563-71. [25] Li L, Fan W, Xuan J, Leung MK. Dimensionless parametric sensitivity analysis of microfluidic fuel cell with flow-through porous electrodes. Electrochimica Acta. 2016;187:636-45. [26] Shaegh SAM, Nguyen N-T, Chan SH. An air-breathing microfluidic formic acid fuel cell with a porous planar anode: experimental and numerical investigations. Journal of Micromechanics and Microengineering. 2010;20:105008. [27] Chen F, Chang M-H, Lin M-K. Analysis of membraneless formic acid microfuel cell using a planar microchannel. Electrochimica acta. 2007;52:2506-14. [28] Zhang H, Xuan J, Xu H, Leung MKH, Leung DYC, Zhang L, et al. Enabling high-concentrated fuel operation of fuel cells with microfluidic principles: A feasibility study. Applied Energy. 2013;112:1131-7. [29] Liu X, Vlugt TJ, Bardow A. Predictive Darken equation for Maxwell-Stefan diffusivities in multicomponent mixtures. Industrial & Engineering Chemistry Research. 2011;50:10350-8. [30] Wilke C, Chang P. Correlation of diffusion coefficients in dilute solutions. AIChE Journal. 1955;1:264-70. [31] Xuan J, Leung MKH, Leung DYC, Wang H. Laminar flow-based fuel cell working under critical conditions: The effect of parasitic current. Applied Energy. 2012;90:87-93. [32] Meyer M, Melke J, Gerteisen D. Modelling and simulation of a direct ethanol fuel cell considering multistep electrochemical reactions, transport processes and mixed potentials. Electrochimica Acta. 2011;56:4299-307. [33] Zhang H, Leung MKH, Xuan J, Xu H, Zhang L, Leung DYC, et al. Energy and exergy analysis of microfluidic fuel cell. International Journal of Hydrogen Energy. 2013;38:6526-36. [34] Suresh N, Jayanti S. Cross-over and performance modeling of liquid-feed polymer electrolyte membrane direct ethanol fuel cells. international journal of hydrogen energy. 2011;36:14648-58. [35] Ponmani K, Nayeemunisa S, Kiruthika S, Muthukumaran B. Electrochemical characterization of platinum-based anode catalysts for membraneless fuel cells. Ionics. 2015:1-11. [36] Armenta-González A, Carrera-Cerritos R, Moreno-Zuria A, Álvarez-Contreras L, Ledesma-García J, Cuevas-Muñiz F, et al. An improved ethanol microfluidic fuel cell based on a PdAg/MWCNT catalyst synthesized by the reverse micelles method. Fuel. 2016;167:240-7. [37] Wang Y, Leung DY, Xuan J, Wang H. A vapor feed methanol microfluidic fuel cell with high fuel and energy efficiency. Applied Energy. 2015;147:456-65. [38] Brushett FR, Jayashree RS, Zhou W-P, Kenis PJA. Investigation of fuel and media flexible laminar flow-based fuel cells. Electrochimica Acta. 2009;54:7099-105. [39] Kjeang E, Brolo AG, Harrington DA, Djilali N, Sinton D. Hydrogen peroxide as an oxidant for microfluidic fuel cells. Journal of the Electrochemical Society. 2007;154:B1220-B6.

32
[40] Kjeang E, Michel R, Harrington DA, Djilali N, Sinton D. A Microfluidic Fuel Cell with Flow-Through Porous Electrodes. Journal of the American Chemical Society. 2008;130:4000-6. [41] Arjona N, Goulet M-A, Guerra-Balcázar M, Ledesma-Garcia J, Kjeang E, Arriaga L. Direct formic acid microfluidic fuel cell with Pd nanocubes supported on flow-through microporous electrodes. ECS Electrochemistry Letters. 2015;4:F24-F8. [42] Choban ER, Waszczuk P, Kenis PJ. Characterization of limiting factors in laminar flow-based membraneless microfuel cells. Electrochemical and Solid-State Letters. 2005;8:A348-A52. [43] Brushett FR, Naughton MS, Ng JWD, Yin L, Kenis PJ. Analysis of Pt/C electrode performance in a flowing-electrolyte alkaline fuel cell. international journal of hydrogen energy. 2012;37:2559-70.