midas NFX 2013: Towards a New Generation of Mechanical FEA Solution
Journal of Engineering Science and Technology Review 11 (5) (2018) 193 - 201
Research Article
Numerical Analysis of Diaphragm Fatigue of Reinforced Concrete Simply Supported T-beams
Chunli Zhang1, Peng Duan1,*, Binshuang Zheng2 and Mingzhen Li3
1Chongqing Jianzhu College, Chongqing 400072, China 2Northeast Forestry University, Haerbin 150040, China
3Department of Civil Engineering, Cleveland state university, Cleveland, OH 44115, United States
Received 4 October 2018; Accepted 28 November 2018
___________________________________________________________________________________________ Abstract
Diaphragms are important components of reinforced concrete ribbed beam bridges. Thus, diaphragm fatigue damage can seriously threaten the safety of in-service reinforced concrete ribbed beam bridges. In order to explore the fatigue performance of reinforced concrete beams and determine the internal relations between diaphragm fatigue life and fatigue load stress level, an entity analysis model of reinforced concrete simply supported T-beams was presented in this study. The spatial entity model was established by using the finite element software Midas/FEA. The correlation was analyzed on the basis of fatigue stress level, spacing–span ratio, width–height ratio, and fatigue performance of the beam diaphragms. The reliability of the calculation results was verified by using the traditional fatigue analytical methods of S-N curve and Miner linear cumulative damage theory and the methods for Goodman and Gerber correction. Results demonstrate that the fatigue life of the model beam increases and the damage degree decreases when the spacing–span ratio decreases and the width–height ratio increases. The model is economically reasonable when the diaphragm spacing–span ratio and the width–height ratio are 3.58 and 0.17, respectively. The study can provide references for further improving the anti-fatigue design of reinforced concrete diaphragm beams.
Keywords: Simply supported T-beam, Finite element, Diaphragm spacing–span ratio, Fatigue performance, Stress level ____________________________________________________________________________________________
1. Introduction Medium- and short-span reinforced concrete ribbed beam bridges have simple structures, can be easily constructed, and are economically efficient; thus, they have occupied an important position in bridge design and construction [1]. However, the resistance performance of bridge materials, such as concrete and steel, has gradually been degraded due to the increase of traffic volume and the subsequent extended service time needed to improve the load levels of these bridges. Consequently, local members of reinforced concrete ribbed beam bridges suffer from fatigue damage in different degrees, which seriously threaten the safety of in-service bridges [2]. Given that neither fatigue design nor fatigue life forecast is stipulated in detail in the existing design and evaluation standards of highway-reinforced concrete bridges in China [3], the evaluation of fatigue performance of in-service bridges mainly draws lessons from foreign specifications, such as AASHTO and BS5400 [4]. Nevertheless, these specifications are inapplicable to the bridge construction in China in many cases because of the large differences in vehicle loads, materials, construction methods, and construction environments.
Scholars have conducted studies on the fatigue performance of reinforced concrete members and the overall performance of reinforced concrete bridges [5-8]. However, they have mostly focused on the theoretical analysis of the
correlation between the two parameters and failed to integrate theory with practice. Therefore, investigating the fatigue performance of local members (diaphragms) of reinforced concrete ribbed beam bridges is necessary to provide reference for further improving the research on fatigue performance of these bridge members and reducing bridge security incidents caused by fatigue damage.
Here, the finite element software Midas/FEA is adopted for spatial entity modeling. The impact factors on the fatigue performance of beam diaphragms are analyzed by using the traditional fatigue analytical methods of S-N curve and Miner linear cumulative damage theory. The findings are aimed at providing a theoretical basis for further improving the anti-fatigue design of reinforced concrete diaphragm beams. 2. State of the art Studies on the fatigue performance of bridges have been conducted by scholars. Park [9] evaluated the fatigue performance of steel box beam bridges by using the nominal stress method and the hot-spot stress method and comparatively analyzed the differences between the evaluation and modeling methods for fatigue life prediction. However, the initial welding defect was not considered. On the basis of Miner theory and Corten–Dolan damage theory, Zhu [10] established a bridge bearing capacity–rigidity degradation correlation model, but the load spectrum application area was limited. Farreras-Alcover [11-12] constructed a fatigue reliability model of orthotropic bridge
JOURNAL OF Engineering Science and Technology Review
www.jestr.org
Jestr
______________ *E-mail address: [email protected] ISSN: 1791-2377 © 2018 Eastern Macedonia and Thrace Institute of Technology. All rights reserved. doi:10.25103/jestr.115.25
Chunli Zhang, Peng Duan, Binshuang Zheng and Mingzhen Li/Journal of Engineering Science and Technology Review 11 (5) (2018) 193 – 201
194
decks by conducting ambient temperature, traffic, and strain monitoring and derived S-N curves applicable to strain monitoring. Yan [13] comprehensively analyzed the fatigue performance decay characteristics of different reinforced concrete bridge decks through numerical simulation and attributed concrete fatigue facture to residual strain accumulation; however, the impacts of durability factors on fatigue analysis were not considered. Frangopol [14-15] proposed a fatigue reliability evaluation method by taking into account other relevant impact factors, and the prediction results were consistent with in-situ monitoring results. Spathelf [16] studied the fatigue performance of reinforced concrete slabs under clear bending conditions and described the characteristics of internal force redistribution after a single-steel failure based on direct strain measurement results; however, fatigue analysis was limited under the influence of steel corrosion. Rodrigues [17] presented a fatigue–safety assessment method for reinforced concrete bridges and established a simulation model for traffic load and bridge structure responses, but load dispersion was insufficiently analyzed even if the model considered important uncertainty sources.
Diaphragm damage, which is common in practical engineering, significantly reduces the overall bearing capacity of bridges. To address this problem, scholars have conducted in-depth studies on the impact of diaphragms on the overall mechanical performance of bridges. Lu [18] obtained reasonable diaphragm layout schemes for bridges with different spans by taking into account the impact of fatigue loads. Zhao et al. [19-20] found that the diaphragm thickness and spacing of steel bridges were strongly correlated with the fatigue stress amplitude of local members, but the impact of spacing–span ratio on fatigue stress amplitude was not discussed. Eamon [21] confirmed the role of diaphragms in reducing the transverse distribution coefficient and improving the bearing capacity of bridges, but the fatigue performance of diaphragms was not analyzed. Chen [22] found that metal diaphragms played an important role in the restoration of pre-stressed concrete bridges; however, the results were not proven by experiments. Zhang [23] argued that diaphragms can improve the reliability of the main beam under unfavorable conditions, but the fatigue damage of diaphragms was not discussed. Cui [24] summarized the fatigue performance of orthotropic steel decks with different typologies of diaphragm gaps without analyzing the impacts of diaphragm width–height ratio on fatigue mechanisms.
In summary, studies on the fatigue damage mechanisms and the impacts of diaphragms on the overall mechanical performance of bridges have been conducted. However, a number of questions have been raised about the fatigue damage characteristics of diaphragms, especially the impacts of different diaphragm structures and fatigue factors on the fatigue life of reinforced concrete bridges. In this study, a fatigue analysis model is established by using the finite element model Midas/FEA to explore the impacts of diaphragms on bridge fatigue performance with different load stress levels. Bridge fatigue performance and cumulative damage variations are explored by adjusting diaphragm spacing–span ratio and width–height ratio under the premise of constant fatigue stress levels, from which economic and reasonable diaphragm design schemes can be obtained. The research results have certain reference value in terms of improving the anti-fatigue design of reinforced concrete diaphragm beams.
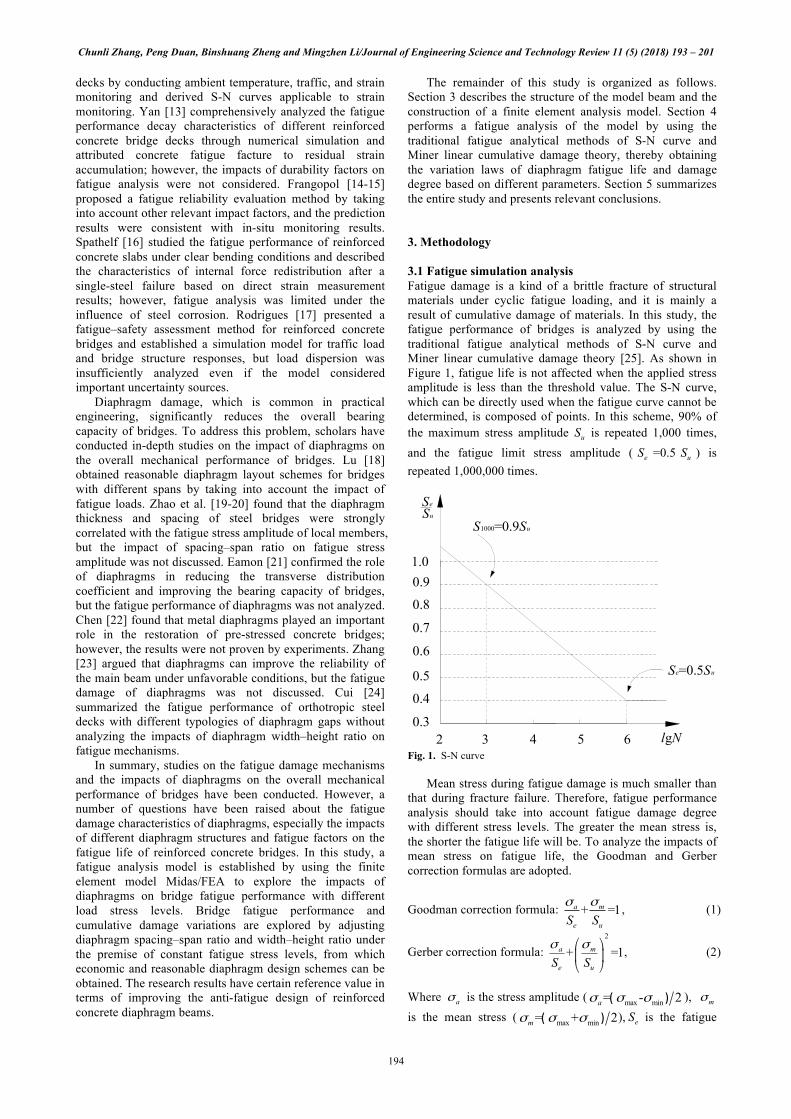
The remainder of this study is organized as follows. Section 3 describes the structure of the model beam and the construction of a finite element analysis model. Section 4 performs a fatigue analysis of the model by using the traditional fatigue analytical methods of S-N curve and Miner linear cumulative damage theory, thereby obtaining the variation laws of diaphragm fatigue life and damage degree based on different parameters. Section 5 summarizes the entire study and presents relevant conclusions. 3. Methodology 3.1 Fatigue simulation analysis Fatigue damage is a kind of a brittle fracture of structural materials under cyclic fatigue loading, and it is mainly a result of cumulative damage of materials. In this study, the fatigue performance of bridges is analyzed by using the traditional fatigue analytical methods of S-N curve and Miner linear cumulative damage theory [25]. As shown in Figure 1, fatigue life is not affected when the applied stress amplitude is less than the threshold value. The S-N curve, which can be directly used when the fatigue curve cannot be determined, is composed of points. In this scheme, 90% of the maximum stress amplitude uS is repeated 1,000 times, and the fatigue limit stress amplitude ( eS =0.5 uS ) is repeated 1,000,000 times.
0.4
0.3
0.5
0.6
0.7
0.8
0.91.0
32 4 5 6
Se
lgN
SuS1000=0.9Su
Se=0.5Su
Fig. 1. S-N curve
Mean stress during fatigue damage is much smaller than that during fracture failure. Therefore, fatigue performance analysis should take into account fatigue damage degree with different stress levels. The greater the mean stress is, the shorter the fatigue life will be. To analyze the impacts of mean stress on fatigue life, the Goodman and Gerber correction formulas are adopted.
Goodman correction formula: + =1a m
e uS Sσ σ , (1)
Gerber correction formula: 2
+ =1a m
e uS Sσ σ⎛ ⎞
⎜ ⎟⎝ ⎠
, (2)
Where aσ is the stress amplitude ( max min= - 2aσ σ σ( ) ), mσ is the mean stress ( max min= + 2mσ σ σ( ) ), eS is the fatigue

Chunli Zhang, Peng Duan, Binshuang Zheng and Mingzhen Li/Journal of Engineering Science and Technology Review 11 (5) (2018) 193 – 201
195
limit stress amplitude, and uS is the maximum stress amplitude.
Fig. 2. Fatigue life correction curves
Fatigue stress levels tend to be complicated and variable in practical engineering. In general, applied stress with variable amplitudes is expected to be equivalent to multiple constant–amplitude stresses when the rain-flow counting method [26] is used (i.e., the method proposed by Japanese scholars Matsuishi and Endo are based theoretically on fatigue damage equivalent principles). The rain-flow counting method holds that the generated fatigue damage is constant given the same load size and direction and that the sequence of applied loads does not affect the damage degree in this particular case. The basic principles of the rain-flow counting method are shown in Figure 3. This method depicts the relations between cyclic load and time, which correspond to stress–strain response under cyclic loading (Figure 4). Moreover, the rain-flow counting method accords with crack propagation laws and can therefore provide a theoretical basis for fatigue life prediction. When the number of cyclic loading is counted by using the rain-flow counting method, the variable–amplitude stress is converted into constant–amplitude stresses. In addition, the damage degree can be solved on the basis of Miner linear cumulative damage theory.
Strain1
32
2'
5
4
6
5'7
8
9 8' 10
Full recycle2-3-2'5-6-5'8-9-8'
Half recycle1-2-44-5-77-8-10
Fig. 3. Basic principles of rain-flow counting
The fatigue life analytical methods mainly include the stress-life method and the strain-life method. In general, fatigue life and damage degree are calculated by using the stress-life method. According to survey analysis, fatigue cracks are mainly attributed to material properties, local stress concentrations, and stress amplitude uncertainties. The fatigue life analysis of bridges can provide data support to fatigue damage prediction.
Stress
Strain
42
8
6
5
9
1 3
7
10
Fig. 4. Stress–strain diagram 3.2 Finite element modeling On the basis of the design drawings, a spatial finite element model with two beams is constructed, as shown in Figure 5. The span length is 16 m. C40 concrete and ordinary steel materials are represented by 3D solid elements and 1D beam elements, respectively. We adopt the isotropic elastic constitutive model for the concrete and steel materials during static analysis, and we use the anisotropic elastic–plastic constitutive model during fatigue simulation analysis.
The fatigue performance of bridge structures is investigated by using the traditional fatigue analytical methods of S-N curve and Miner linear cumulative damage theory. Given that the finite element modeling is based on automatic hexahedral mesh generation, the steel materials are represented by automatic mesh lines. Both the concrete solid elements and the steel elements are 0.05 meters long. In addition, the steel and concrete solids are automatically coupled during mesh generation. The mid-span section of the medium diaphragm is selected as the most unfavorable loading position, and the ultimate load is applied to this section in the form of concentrated force. We adopt the isotropic elastic constitutive model for the concrete and steel materials during static analysis, and we use the anisotropic elastic–plastic constitutive model during fatigue simulation analysis. The fatigue simulation analysis mainly consists of four parts: establishment of 3D model, linear static analysis, stress fatigue analysis, and post-extraction data processing.
3.3 Fatigue numerical simulation The fatigue analysis of the model beam is conducted under constant stress amplitude fatigue loading, during which the Goodman and Gerber correction methods are considered. We adopt the anisotropic elastic–plastic constitutive model for the concrete materials and use the reinforced double-broken line model for the steel materials. A member is
Chunli Zhang, Peng Duan, Binshuang Zheng and Mingzhen Li/Journal of Engineering Science and Technology Review 11 (5) (2018) 193 – 201
196
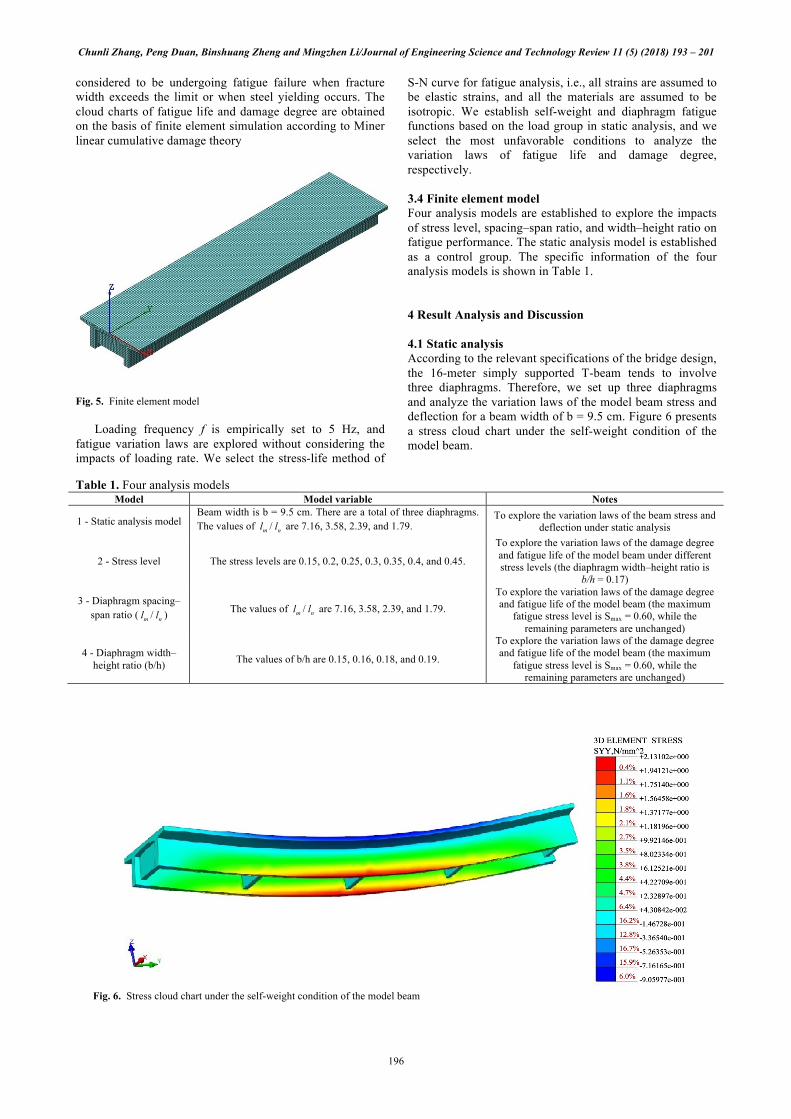
considered to be undergoing fatigue failure when fracture width exceeds the limit or when steel yielding occurs. The cloud charts of fatigue life and damage degree are obtained on the basis of finite element simulation according to Miner linear cumulative damage theory
Fig. 5. Finite element model Loading frequency f is empirically set to 5 Hz, and
fatigue variation laws are explored without considering the impacts of loading rate. We select the stress-life method of
S-N curve for fatigue analysis, i.e., all strains are assumed to be elastic strains, and all the materials are assumed to be isotropic. We establish self-weight and diaphragm fatigue functions based on the load group in static analysis, and we select the most unfavorable conditions to analyze the variation laws of fatigue life and damage degree, respectively.
3.4 Finite element model Four analysis models are established to explore the impacts of stress level, spacing–span ratio, and width–height ratio on fatigue performance. The static analysis model is established as a control group. The specific information of the four analysis models is shown in Table 1. 4 Result Analysis and Discussion 4.1 Static analysis According to the relevant specifications of the bridge design, the 16-meter simply supported T-beam tends to involve three diaphragms. Therefore, we set up three diaphragms and analyze the variation laws of the model beam stress and deflection for a beam width of b = 9.5 cm. Figure 6 presents a stress cloud chart under the self-weight condition of the model beam.
Table 1. Four analysis models
Model Model variable Notes
1 - Static analysis model Beam width is b = 9.5 cm. There are a total of three diaphragms. The values of ml / nl are 7.16, 3.58, 2.39, and 1.79.
To explore the variation laws of the beam stress and deflection under static analysis
2 - Stress level The stress levels are 0.15, 0.2, 0.25, 0.3, 0.35, 0.4, and 0.45.
To explore the variation laws of the damage degree and fatigue life of the model beam under different stress levels (the diaphragm width–height ratio is
b/h = 0.17)
3 - Diaphragm spacing–span ratio ( ml / nl ) The values of ml / nl are 7.16, 3.58, 2.39, and 1.79.
To explore the variation laws of the damage degree and fatigue life of the model beam (the maximum
fatigue stress level is Smax = 0.60, while the remaining parameters are unchanged)
4 - Diaphragm width–height ratio (b/h) The values of b/h are 0.15, 0.16, 0.18, and 0.19.
To explore the variation laws of the damage degree and fatigue life of the model beam (the maximum
fatigue stress level is Smax = 0.60, while the remaining parameters are unchanged)
Fig. 6. Stress cloud chart under the self-weight condition of the model beam

Chunli Zhang, Peng Duan, Binshuang Zheng and Mingzhen Li/Journal of Engineering Science and Technology Review 11 (5) (2018) 193 – 201
197
As shown in Figure 6, the maximum deformation of the model beam under self-weight condition is 0.91 mm in the mid-span section, accounting for approximately 9.8% of the model. Compared with the single T-beam, the model beam has smaller deflection under this self-weight condition. This finding indicates that diaphragms can significantly enhance the rigidity of T-beams and reduce the main beam deflection.
The main beam deflection decreases with the increase in transverse rigidity in the presence of two beams. The maximum combined stress of the model beam under self-weight condition occurs at the lower edge of the mid-span section of the main beams, and the maximum stress value is 2.13MPa< 26.8=ckf MPa, which meets design requirements. In other words, the finite element model is rational and applicable to fatigue numerical simulation. 4.2 Fatigue performance analysis (1) Impacts of stress level on bridge fatigue performance
Figure 7 shows a fatigue life cloud chart of the model beam in the case of maxS = 0.25. Figures 8 and 9 illustrate the fatigue life curves and the damage degree curves for different stress levels, respectively. As shown in Figure 7, the maximum and minimum fatigue life values of the model beam at maxS =0.25 are 1.111 × 710 and 6.945× 610 , respectively. Given that the ultimate load in the mid-span diaphragm is transmitted to the main beams on both sides in uniform distribution, the small fatigue life values mostly represent the lower edges of the beam rib near the mid-span section of the two main beams.
When ml / nl is unchanged, the fatigue life of the model beam decreases with the increase in stress level maxS , which indicates that the fatigue problem is more prominent when the stress level is greater. The fatigue life at maxS = 0.80 is only 1/12 of the value at maxS = 0.15. If fatigue life exceeds
5× 710 /times when maxS ≦0.25, then the fatigue design cannot be implemented. Fatigue life decreases steadily in the range of 0.25≦ maxS ≦0.6, and it decreases significantly outside this range. In particular, fatigue life is shorter than the minimum design life (2× 710 /times) when maxS >0.6. For these reasons, conducting fatigue tests at maxS ≦0.60 is recommended.
Fig. 7. Fatigue life cloud chart of the model beam at maxS =0.25
0
2
4
6
8
10
12
14
16
0.1 0.15 0.2 0.25 0.3 0.35 0.4 0.45 0.5 0.55 0.6 0.65 0.7 0.75 0.8
Fatig
ue li
fe p
er ti
me
(N^6
)
Stress level Smax
lm/ln=1.79lm/ln=2.39lm/ln=3.58lm/ln=7.16Smax=0.25Smax=0.60
Smax=0.25Smax=0.60
Fig. 8. Bridge fatigue life curves with different stress levels
5
10
15
20
25
30
35
40
45
50
0.2 0.3 0.4 0.5 0.6 0.7 0.8 0.9
Prop
ortio
n of
fatig
ue d
amag
e de
gree
(%
)
Stress level Smax
lm/ln=7.16
lm/ln=3.58
lm/ln=2.39
lm/ln=1.79
Smax=0.60
Smax=0.60
Fig. 9. Bridge damage degree curves with different stress levels
When maxS is unchanged, the fatigue life of the model
beam increases with the increase in spacing–span ratio ml / nl . Therefore, appropriately reducing spacing–span ratio to improve the overall fatigue performance of bridges is feasible.
(2) Impacts of diaphragm spacing–span ratio on bridge fatigue performance
Table 2 lists the fatigue life and damage degree relative to different spacing–span ratios. Figure 10 and Figure 11 illustrate the fatigue life change curve and the damage degree change curve at ml / nl = 3.58, respectively.
1.90
2.00
2.10
2.20
2.30
2.40
2.50
2.60
0 1 2 3 4 5 6 7 8
Fatig
ue li
fe p
er ti
me
(N/1
0^6)
Spacing-span ratio lm/ln
lm/ln=3.58
Fig. 10. Fatigue life change curve
Chunli Zhang, Peng Duan, Binshuang Zheng and Mingzhen Li/Journal of Engineering Science and Technology Review 11 (5) (2018) 193 – 201
198
20.0
22.0
24.0
26.0
28.0
30.0
32.0
34.0
36.0
0 1 2 3 4 5 6 7 8
Prop
ortio
n of
fatig
ue d
amag
e de
gree
(%)
Spacing-span ratio lm/ln
lm/ln=3.58
Fig. 11. Damage degree change curve
As shown in Figures 10 and 11 and Table 2, fatigue life gradually decreases with the increase in spacing–span ratio when the damage degree is unchanged. Damage degree reaches its maximum value at ml / nl = 7.16, and large-range damages can be observed on the beam flange and the web in accordance with the data in the stress cloud charts. Fatigue life at ml / nl =3.58 is 6.3% longer than that at ml / nl = 7.16 given the same fatigue damage degree.
Fatigue life is longer when ml / nl ≦ 3.58, which indicates that fatigue life can be substantially extended (i.e., 17.8% longer) by increasing the number of diaphragms. The fatigue curve changes slightly when ml / nl > 3.58, which indicates diaphragms can remarkably enhance the rigidity and anti-fatigue performance of bridges. The finding further implies significant improvements to the service life of reinforced concrete simply supported beam bridges under heavy loading.
The mutation points in Figures 10 and 11 appear at ml / nl = 3.58 (i.e., with only one diaphragm). Compared with beams without diaphragms, the beams with a diaphragm have longer fatigue life. Although the fatigue damage degree can be reduced by increasing the number of diaphragms, the self-weight phenomenon may occur and cost may increase. Therefore, ml / nl = 3.58 is considered as the most economical spacing–span ratio for the diaphragm.
Table 2. Summary of diaphragm fatigue life and damage degree with different spacing–span ratios
Spacing– span ratio ml / nl
No.
7.16 3.58 2.39 1.79
Fatigue life ( 610N × /times)
Damage degree
(%)
Fatigue life ( 610N × /times)
Damage degree
(%)
Fatigue life ( 610N × /times)
Damage degree
(%)
Fatigue life ( 610N × /times)
Damage degree
(%) 1 0–4.02 100–87.5 0–4.27 100–87.5 0–4.59 100–87.5 0–5.03 100–87.5 2 4.02–8.04 87.5–75 4.27–8.54 87.5–75 4.59–9.18 87.5–75 5.03–10.07 87.5–75 3 8.04–12.07 75–62.5 8.54–12.8 75–62.5 9.18–13.78 75–62.5 10.07–15.1 75–62.5 4 12.07–16.09 62.5–50 12.8–17.1 62.5–50 13.78–18.37 62.5–50 15.1–20.14 62.5–50 5 16.09–20.11 50–37.5 17.1–21.37 50–37.5 18.37–22.96 50–37.5 20.14–25.17 50–37.5 6 20.11–24.13 37.5–25 21.37–25.64 37.5–25 22.96–27.55 37.5–25 25.17–30.2 37.5–25 7 24.13–26.14 25–12.5 25.64–29.62 25–12.5 27.55–31.82 25–12.5 30.2–34.88 25–12.5 8 26.14–32.18 12.5–0 29.62–34.19 12.5–0 31.82–36.74 12.5–0 34.88–40.27 12.5–0
(3) Impacts of diaphragm width–height ratio on bridge
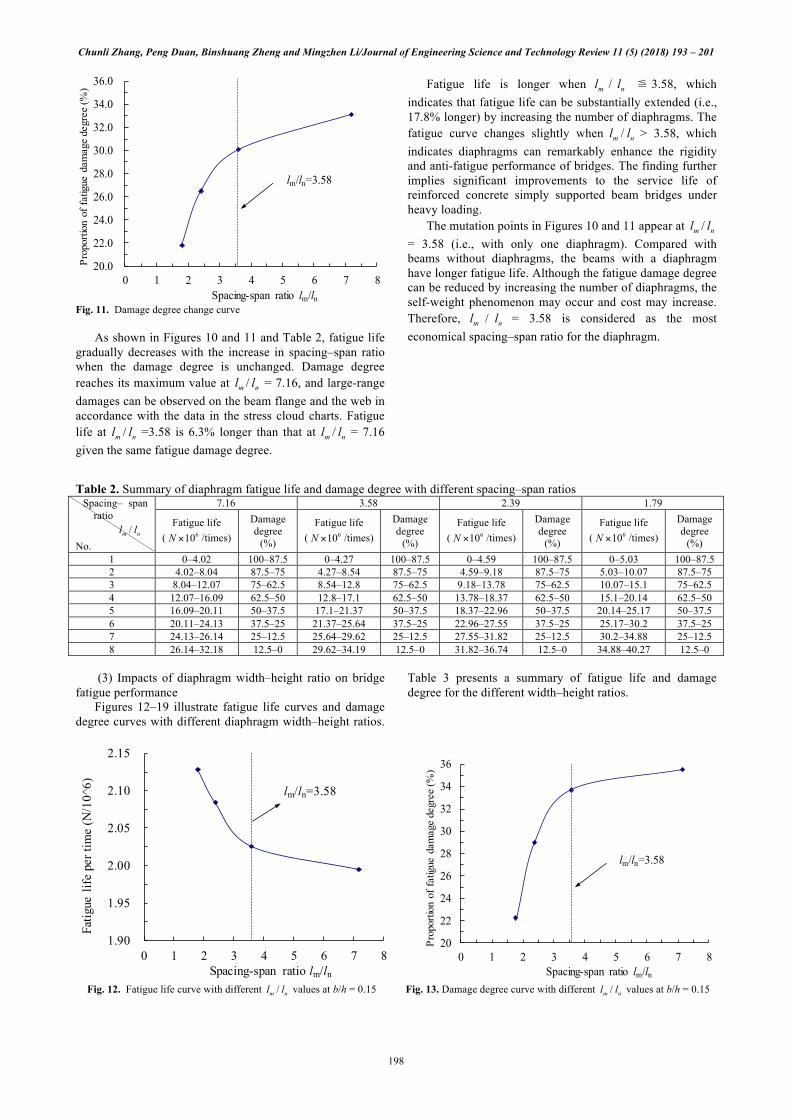
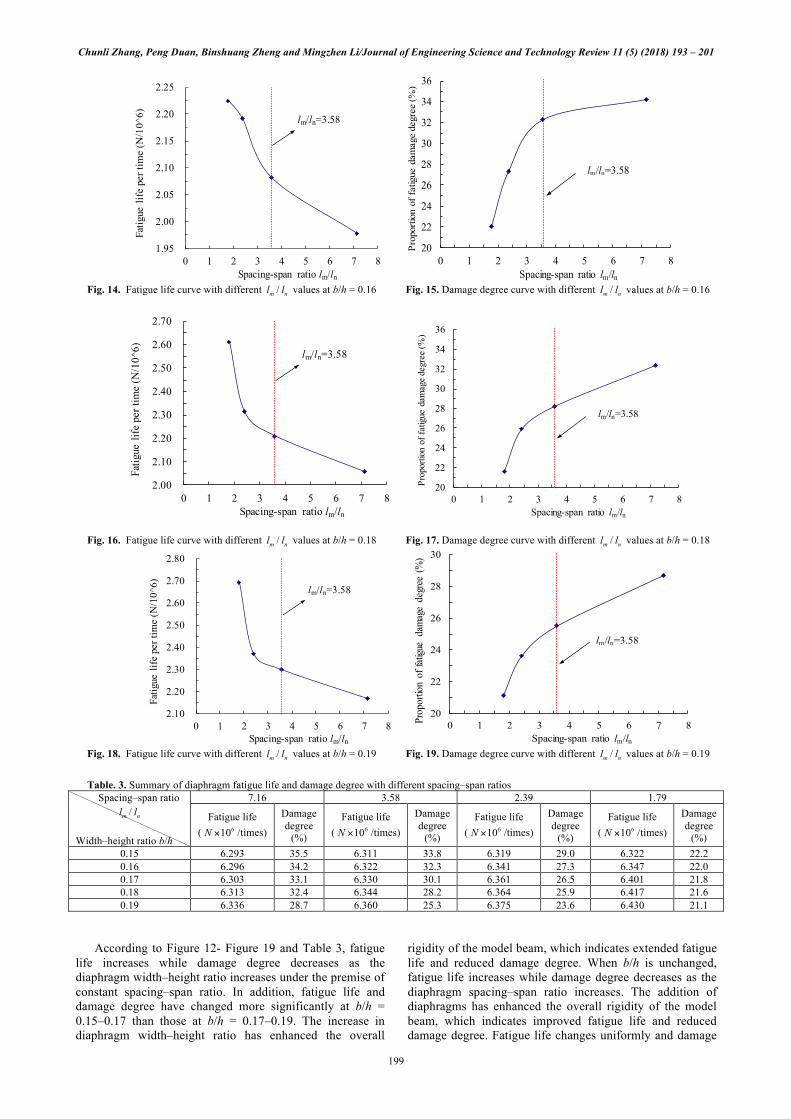
fatigue performance Figures 12–19 illustrate fatigue life curves and damage
degree curves with different diaphragm width–height ratios.
Table 3 presents a summary of fatigue life and damage degree for the different width–height ratios.
1.90
1.95
2.00
2.05
2.10
2.15
0 1 2 3 4 5 6 7 8
Fatig
ue li
fe p
er ti
me
(N/1
0^6)
Spacing-span ratio lm/ln
lm/ln=3.58
20
22
24
26
28
30
32
34
36
0 1 2 3 4 5 6 7 8
Prop
ortio
n of
fatig
ue d
amag
e de
gree
(%)
Spacing-span ratio lm/ln
lm/ln=3.58
Fig. 12. Fatigue life curve with different ml / nl values at b/h = 0.15 Fig. 13. Damage degree curve with different ml / nl values at b/h = 0.15
Chunli Zhang, Peng Duan, Binshuang Zheng and Mingzhen Li/Journal of Engineering Science and Technology Review 11 (5) (2018) 193 – 201
199
1.95
2.00
2.05
2.10
2.15
2.20
2.25
0 1 2 3 4 5 6 7 8
Fatig
ue l
ife
per t
ime
(N/1
0^6)
Spacing-span ratio lm/ln
lm/ln=3.58
20
22
24
26
28
30
32
34
36
0 1 2 3 4 5 6 7 8
Prop
ortio
n of
fatig
ue d
amag
e de
gree
(%)
Spacing-span ratio lm/ln
lm/ln=3.58
Fig. 14. Fatigue life curve with different ml / nl values at b/h = 0.16 Fig. 15. Damage degree curve with different ml / nl values at b/h = 0.16
2.00
2.10
2.20
2.30
2.40
2.50
2.60
2.70
0 1 2 3 4 5 6 7 8
Fatig
ue li
fe p
er ti
me
(N/1
0^6)
Spacing-span ratio lm/ln
lm/ln=3.58
20
22
24
26
28
30
32
34
36
0 1 2 3 4 5 6 7 8
Prop
ortio
n of
fatig
ue d
amag
e de
gree
(%)
Spacing-span ratio lm/ln
lm/ln=3.58
Fig. 16. Fatigue life curve with different ml / nl values at b/h = 0.18 Fig. 17. Damage degree curve with different ml / nl values at b/h = 0.18
2.10
2.20
2.30
2.40
2.50
2.60
2.70
2.80
0 1 2 3 4 5 6 7 8
Fatig
ue li
fe p
er ti
me
(N/1
0^6)
Spacing-span ratio lm/ln
lm/ln=3.58
20
22
24
26
28
30
0 1 2 3 4 5 6 7 8Prop
ortio
n of
fatig
ue d
amag
e de
gree
(%)
Spacing-span ratio lm/ln
lm/ln=3.58
Fig. 18. Fatigue life curve with different ml / nl values at b/h = 0.19 Fig. 19. Damage degree curve with different ml / nl values at b/h = 0.19 Table. 3. Summary of diaphragm fatigue life and damage degree with different spacing–span ratios
Spacing–span ratio ml / nl
Width–height ratio b/h
7.16 3.58 2.39 1.79
Fatigue life ( 610N × /times)
Damage degree
(%)
Fatigue life ( 610N × /times)
Damage degree
(%)
Fatigue life ( 610N × /times)
Damage degree
(%)
Fatigue life ( 610N × /times)
Damage degree
(%) 0.15 6.293 35.5 6.311 33.8 6.319 29.0 6.322 22.2 0.16 6.296 34.2 6.322 32.3 6.341 27.3 6.347 22.0 0.17 6.303 33.1 6.330 30.1 6.361 26.5 6.401 21.8 0.18 6.313 32.4 6.344 28.2 6.364 25.9 6.417 21.6 0.19 6.336 28.7 6.360 25.3 6.375 23.6 6.430 21.1
According to Figure 12- Figure 19 and Table 3, fatigue life increases while damage degree decreases as the diaphragm width–height ratio increases under the premise of constant spacing–span ratio. In addition, fatigue life and damage degree have changed more significantly at b/h = 0.15–0.17 than those at b/h = 0.17–0.19. The increase in diaphragm width–height ratio has enhanced the overall
rigidity of the model beam, which indicates extended fatigue life and reduced damage degree. When b/h is unchanged, fatigue life increases while damage degree decreases as the diaphragm spacing–span ratio increases. The addition of diaphragms has enhanced the overall rigidity of the model beam, which indicates improved fatigue life and reduced damage degree. Fatigue life changes uniformly and damage
Chunli Zhang, Peng Duan, Binshuang Zheng and Mingzhen Li/Journal of Engineering Science and Technology Review 11 (5) (2018) 193 – 201
200
degree decreases the most at ml / nl = 3.58 (i.e., with only one diaphragm). When b/h increases from 0.15 to 0.19, the damage degree decreases by 8.5% and the relative decrease degree reaches 25.1%. Fatigue damage degree decreases significantly at b/h = 0.17, while fatigue life changes proportionally in accordance with the damage degree. Damage degree changes more slowly at ml / nl ≠ 3.58 than that at ml / nl = 3.58.
Figure 20 and Figure 21 illustrate the curve fitting results of fatigue life and damage degree at b/h = 0.17, respectively. In particular, Figure 20 presents the correlation function curve with spacing–span ratio and fatigue life as the x-axis and y-axis respectively.
The expression is 2=0.0061 0.0719 +6.5055y x x− , and the correlation coefficient approaches 1.0 . Therefore, fatigue performance can be steadily improved by appropriately increasing the number of diaphragms at b/h = 0.17 (i.e., average width is 9.5 cm). Meanwhile, Figure 21 presents the correlation function curve with spacing–span ratio and damage degree as the x-axis and y-axis, respectively. The expression is 2=-0.7167 +8.412 +9.5767y x x , and the correlation coefficient approaches 1, which indicate that diaphragm width can uniformly affect the fatigue damage of the model beam.
In summary, steady fatigue performance can be obtained at b/h = 0.17 when the diaphragm width–height ratio is considered. Both fatigue life and damage degree have changed steadily in this case, but fatigue life is most uniformly affected at this width–height ratio. In consideration of the economic efficiency and stability of bridges, an investigation on the fatigue performance of bridges at b/h = 0.17 is therefore recommended.
y = 0.0061x2 - 0.0719x + 6.5055
R2 = 0.983
6.26
6.28
6.30
6.32
6.34
6.36
6.38
6.40
6.42
0 1 2 3 4 5 6 7 8
Fatig
ue lif
e pe
r tim
e (lg
N)
Spacing-span ratio lm/ln
Fatigue life curveRegression analysis
Fig. 20. Polynomial regression analysis of fatigue life
y = -0.7167x2 + 8.4124x + 9.5767R2 = 0.9819
20.0
22.0
24.0
26.0
28.0
30.0
32.0
34.0
36.0
0 1 2 3 4 5 6 7 8
Prop
ortio
n of
dam
age
degr
ee(%
)
Spacing-span ratio lm/ln
Damage degree curveRegression analysis
Fig. 21. Regression analysis of damage degree at b/h=0.17
5. Conclusions A 3D spatial model was established in the present study by using the finite element software Midas/FEA to analyze the stress characteristics of diaphragms and the impacts of diaphragms on the fatigue performance of reinforced concrete simply supported T-beam bridges. The model was used to explore the impacts of stress levels, spacing–span ratios, and width–height ratios on fatigue life and damage degree. The internal relations between diaphragm fatigue life and fatigue load stress level were also determined by using the model. The following conclusions can be drawn from this study:
(1) Fatigue life is significantly and positively correlated with diaphragm width–height ratio. In other words, the fatigue life of the beam extends as the diaphragm width–height ratio gradually increases. The greater the diaphragm width–height ratio is, the longer the fatigue life will be.
(2) Diaphragm width–height ratio is significantly but negatively correlated with damage degree. In other words, damage degree decreases with the increase in diaphragm width–height ratio. The overall fatigue performance of the model beam can be significantly improved by appropriately increasing the diaphragm width–height ratio.
(3) The model is economically reasonable when the diaphragm spacing–span ratio and the width–height ratio are 3.58 and 0.17, respectively.
This study focuses on investigating the impacts of diaphragms on the fatigue performance of medium- and short-span reinforced concrete ribbed beam bridges. Moreover, the study explores the impacts of diaphragms on the overall fatigue performance of bridges relative to different structural forms and stress levels, and it presents the reasonable fatigue load stress level and diaphragm layout and width. Given the lack of fatigue load test data in the present work, fatigue load tests shall be conducted on the model beam in the future to comprehensively study the variation laws of diaphragm fatigue life and damage degree.
Acknowledgements This work was supported by the Construction Science and Technology Plan Project of Chongqing (Construction and Scientific 2018 Project No. 1-5-3) and the Science and Technology Research Project of Chongqing Municipal Education Commission (KJ1604101). This is an Open Access article distributed under the terms of the Creative Commons Attribution License

Chunli Zhang, Peng Duan, Binshuang Zheng and Mingzhen Li/Journal of Engineering Science and Technology Review 11 (5) (2018) 193 – 201
201
_____________________________
References 1. Zhu H, Yu Z, Sun J., “Experimental research on fatigue behavior of
reinforced concrete T-beam”. Journal of Highway and Transportation Research and Development, (12) 2013, pp. 53-58.
2. Wang Q, Wei J, Liu X, Xu G., “Equivalent static analysis method for fatigue cumulative damage process of reinforced concrete beam”. Journal of Central South University (Science and Technology), (01), 2016, pp. 247-253.
3. Li S., “Fatigue load model and fatigue behavior of medium & short span concrete bridges”. Master thesis of Zhejiang University, China, 2015, pp.12-17.
4. Rahul B., “Fatigue analysis of concrete structures - introduction to fatigue of concrete”. Saarbrucken: VDM Verlag Dr. Muller, Germany, 2010, pp.12-14.
5. Yu Z, Qin X, Liu J, Peng H., “Recent developments on chloride ion permeability in concrete subjected to fatigue loading”. Journal of China & Foreign Highway, 37(02), 2017, pp. 281-288.
6. Liang J, Nie X, Masud M, et al., “A study on the simulation method for fatigue damage behavior of reinforced concrete structures”. Engineering Structures, 150, 2017, pp. 25-38.
7. Zhong M., “Study of accumulated damage characteristics of RC shear-bending member under low cyclic fatigue loading”. Journal of Highway and Transportation Research and Development, (04), 2016, pp. 80-87.
8. Tong L, Liu B, Xian Q, et al., “Experimental study on fatigue behavior of Steel Reinforced Concrete (SRC) beams”. Engineering Structures, 123, 2016, pp. 247-262.
9. Park J Y, Kim H K., “Fatigue life assessment for a composite box girder bridge”. International Journal of Steel Structures, 14(4), 2014, pp. 843-853.
10. Zhu H., “Method and experimental research on highway reinforced concrete simply-supported girder bridge’s fatigue residual service life forecast”. Doctoral Dissertation of Central South University, China, 2011, pp.47-52.
11. Farreras-Alcover I, Chryssanthopoulos M K, Andersen J E., “Data-based models for fatigue reliability of orthotropic steel bridge decks based on temperature, traffic and strain monitoring”. International Journal of Fatigue, 95, 2017, pp. 104-119.
12. Farreras-Alcover I, Chryssanthopoulos M K, Andersen J E., “Regression models for structural health monitoring of welded bridge joints based on temperature, traffic and strain measurements”. Structural Health Monitoring, 14(6), 2015, pp. 648-662.
13. Yan G., “Study on fatigue numerical analysis method of reinforced concrete bridge slab”. Master thesis of Tianjin University, China, 2010, pp.34-40.
14. Liu M, Frangopol D M, Kwon K., “Fatigue reliability assessment of retrofitted steel bridges integrating monitored data”. Structural Safety, 32(1), 2010, pp. 77-89.
15. Mondoro A, Soliman M, Frangopol D M., “Prediction of structural response of naval vessels based on available structural health monitoring data”. Ocean Engineering, 125, 2016, pp. 295-307.
16. Spathelf C A, Vogel T., “Fatigue performance of orthogonally reinforced concrete slabs: Experimental investigation”. Engineering Structures, 168, 2018, pp. 69-81.
17. Rodrigues J F S, Casas J R, Almeida P A O., “Fatigue-safety assessment of reinforced concrete (RC) bridges: application to the Brazilian highway network”. Structure & Infrastructure Engineering, 9(6), 2013, pp. 601-616.
18. Lv Y, Liu Y., “On analysis of effect of diaphragm on multi-main-beam structure behavior subjected to force”. Journal of Lanzhou Jiaotong University, (01), 2004, pp. 38-42.
19. Zhao W, Zheng J., “Influences of diaphragm thickness and space on fatigue stress amplitude of steel bridge decks”. Steel Construction, (04), 2015, pp. 5-9.
20. Zhao W, Zheng J., “Study of effects of unfitness defect on stress concentration and fatigue performance in welded joints of steel bridge”. Steel Construction, 30(02), 2015, pp. 57-60.
21. Eamon C. D., Nowak A. S.., “Effects of edge-stiffening elements and diaphragms on bridge resistance and load distribution”. American Society of Civil Engineers, 7(5), 2002, pp. 258-266.
22. Y. F. Chen., “Use of steel diaphragms in prestressed concrete bridges”. In: Proceedings of PCI Convention and National Bridge Conference, Washington DC, USA: Precast Prestressed Concrete Institute, 2010, pp. 449-469.
23. Zhang L., “Effects of the diaphragm on mechanical behavior of the simply supported fabricated reinforced concrete T-girder bridge”. Master thesis of Tsinghua University, China, 2015, pp.38-40.
24. Cui H., “Research on fatigue behavior of orthotropic steel deck with different typologies of diaphragm gap”. Construction Technology, (01), 2016, pp. 119-123.
25. Li X, Tan Q, Xiao L., “Experimental study of fatigue behavior of steel and concrete composite beams”. Bridge Construction, 47(06), 2017, pp. 12-17.
26. Niu D, Miao Y., “Experimental study on fatigue performance of corroded highway bridges based on vehicle loading”. China Civil Engineering Journal, 51(03), 2018, pp. 1-10.


![INTERAZIONE TERRENO STRUTTURA GTS NX Interoperabilità ......Interoperabilità completa di MIDAS GTS NX con MIDAS GEN/CIVIL e MIDAS FEA . 2 ... [MIDAS/Gen] Design Query Tools V ew](https://static.fdocuments.net/doc/165x107/5ea9d82b430290276b378860/interazione-terreno-struttura-gts-nx-interoperabilit-interoperabilit.jpg)