NUMBERS, FACTS AND TRENDS SHAPING THE …...RECOMMENDED CITATION: Pew Research Center, December...
27
DECEMBER 18, 2013 FOR FURTHER INFORMATION ON THIS REPORT: Alan Cooperman, Director of Religion Research Gregory Smith, Director of U.S. Religion Surveys Besheer Mohamed, Research Associate Erin O’Connell, Associate Director, Communications, Religion & Public Life Project 202.419.4562 www.pewresearch.org/religion RECOMMENDED CITATION: Pew Research Center, December 2013, “Celebrating Christmas and the Holidays, Then and Now” NUMBERS, FACTS AND TRENDS SHAPING THE WORLD
Transcript of NUMBERS, FACTS AND TRENDS SHAPING THE …...RECOMMENDED CITATION: Pew Research Center, December...
DECEMBER 18, 2013
FOR FURTHER INFORMATION
ON THIS REPORT:
Alan Cooperman, Director of Religion Research
Gregory Smith, Director of U.S. Religion Surveys
Besheer Mohamed, Research Associate
Erin O’Connell, Associate Director,
Communications, Religion & Public Life Project
202.419.4562
www.pewresearch.org/religion
RECOMMENDED CITATION: Pew Research Center, December 2013, “Celebrating Christmas and the Holidays, Then and Now”
NUMBERS, FACTS AND TRENDS SHAPING THE WORLD
1
PEW RESEARCH CENTER
www.pewresearch.org/religion
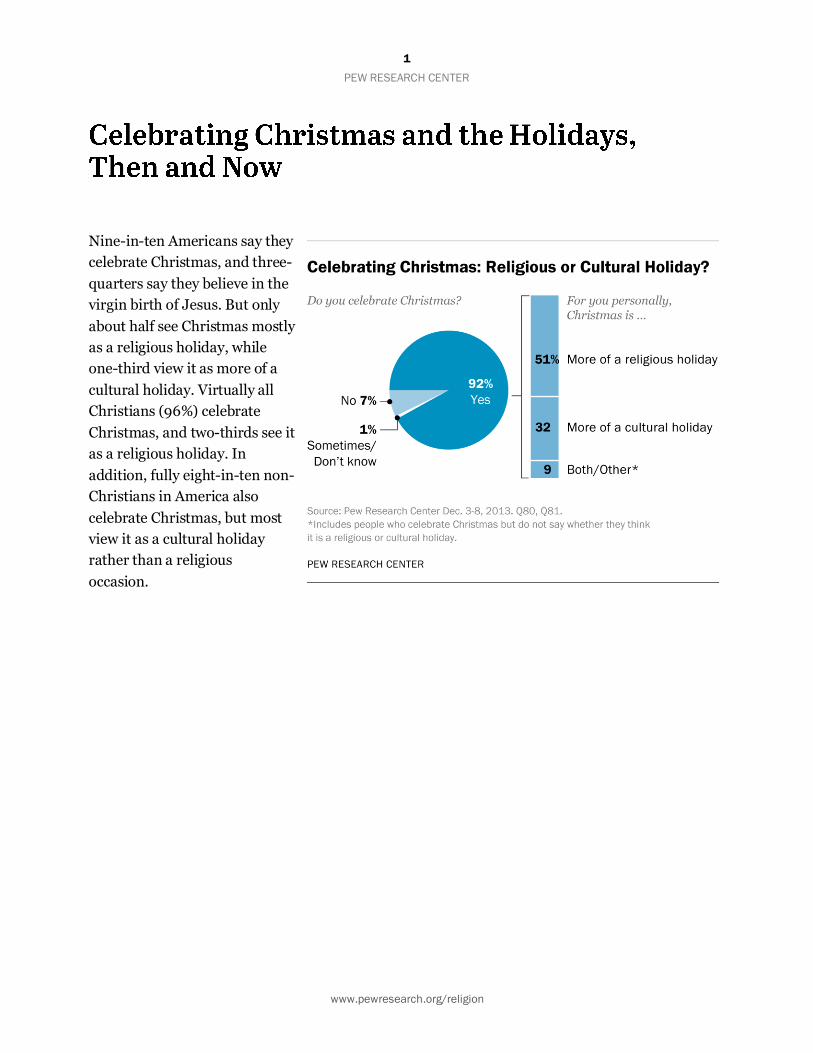
Nine-in-ten Americans say they
celebrate Christmas, and three-
quarters say they believe in the
virgin birth of Jesus. But only
about half see Christmas mostly
as a religious holiday, while
one-third view it as more of a
cultural holiday. Virtually all
Christians (96%) celebrate
Christmas, and two-thirds see it
as a religious holiday. In
addition, fully eight-in-ten non-
Christians in America also
celebrate Christmas, but most
view it as a cultural holiday
rather than a religious
occasion.

2
PEW RESEARCH CENTER
www.pewresearch.org/religion
The way Americans celebrate
Christmas present is rooted in
Christmases past. Fully 86% of
U.S. adults say they intend to
gather with family and friends
on Christmas this year, and an
identical number say they plan
to buy gifts for friends and
family. Roughly nine-in-ten
adults say these activities
typically were part of their
holiday celebrations when they
were growing up.
But fewer Americans say they
will send Christmas or holiday
cards this year than say their
families typically did this when
they were children. The share
of people who plan to go
caroling this year also is lower
than the share who say they
typically did so as children.
And while about seven-in-ten
Americans say they typically
attended Christmas Eve or
Christmas Day religious
services when they were
children, 54% say they plan to
attend Christmas services this
year.

3
PEW RESEARCH CENTER
www.pewresearch.org/religion
There are significant generational differences
in the way Americans plan to celebrate
Christmas this year, with younger adults less
likely than older adults to incorporate religious
elements into their holiday celebrations.
Adults under age 30 are far less likely than
older Americans to say they see Christmas as
more of a religious than a cultural holiday.
They are also less likely to attend Christmas
religious services and to believe in the virgin
birth. This is consistent with other research
showing that younger Americans are helping to
drive the growth of the religiously unaffiliated
population within the U.S. But the new survey
also shows that even among Christians, young people are more likely than older adults to view
Christmas as more of a cultural than a religious holiday.
Religion Less Central to Young People’s
Observance of Christmas
Celebrate Christmas as
religious holiday
Plan to attend Christmas religious services
Believe in virgin birth
% % %
Ages 18-29 39 46 66
30-49 50 57 76
50-64 55 55 76
65+ 66 60 76
Source: Pew Research Center Dec. 3-8, 2013. Q80-81, Q85b, Q88.
PEW RESEARCH CENTER

4
PEW RESEARCH CENTER
www.pewresearch.org/religion
These are among the key
findings of a new Pew Research
Center survey conducted Dec.
3-8, 2013, among a
representative sample of 2,001
adults nationwide. The survey
– which explores Americans’
Christmas plans, childhood
traditions, and likes and
dislikes about the holiday
season – also finds that most
Americans say gathering with
family and friends is what they
most look forward to about
Christmas and the holidays.
When asked what they like the
least about the holidays, many
express frustration with the
commercialization of the
season; one-third say they
dislike the materialism of the
holidays, one-fifth dislike the
expenses associated with the
season, and one-tenth dislike
holiday shopping and the
crowded malls and stores.
One-fifth of Americans say they are the parent or guardian of a child in their household who
believes in Santa Claus, and 69% of this group says they will pretend that Santa visits their home
this Christmas Eve. But Kris Kringle’s visits will not be restricted only to houses where children
retain their belief in the “right jolly old elf”; even among adults who say there are no children
residing in their household, 21% will pretend that Santa visits their home this year.
Other highlights from the survey include:
Among the religiously unaffiliated, 87% say they celebrate Christmas, including 68% who view
Christmas as more of a cultural holiday and 10% who see it as more of a religious holiday.

5
PEW RESEARCH CENTER
www.pewresearch.org/religion
Roughly eight-in-ten Americans (79%) say they plan to put up a Christmas tree this year. By
comparison, 92% say they typically put up a Christmas tree when they were children.
Nearly six-in-ten Americans say they plan to give homemade gifts this holiday season, such as
baked goods or crafts. There is a big gender gap on this question; two-thirds of women (65%)
plan to give homemade gifts, compared with 51% of men.
Those who celebrate Christmas as more of a religious event are much more apt than those who
view it as a cultural occasion to say they will attend religious services this Christmas (73% vs.
30%) and to believe in the virgin birth (91% vs. 50%). But on other measures, the differences in
the ways the two groups will mark the holidays are much smaller. Roughly nine-in-ten in both
groups will gather with family and friends and buy gifts this Christmas, and identical shares of
each group will pretend to get a visit from Santa Claus on Christmas Eve (33% each).

6
PEW RESEARCH CENTER
www.pewresearch.org/religion
Half of Americans (51%) say
they see Christmas as a
religious holiday, while 32%
say that, for them, personally,
it is more of a cultural holiday.
A few (9%) give other
responses, such as saying it is
both a religious and a cultural
holiday or saying it is neither a
religious nor a cultural
holiday, while 7% say they do
not celebrate Christmas, and
1% say they sometimes
celebrate Christmas or decline
to answer the question.
Eight-in-ten white evangelical
Protestants (82%) see
Christmas as a religious
holiday. Smaller majorities of
white Catholics (66%), black
Protestants (60%) and white
mainline Protestants (56%)
see Christmas as more of a
religious than a cultural
holiday, as do about half of
Hispanic Catholics (51%).1
Among the religiously
unaffiliated, two-thirds celebrate Christmas as more of a cultural than a religious holiday.
More women (57%) than men (46%) see Christmas as a religious rather than a cultural event. And
there is a striking generational component to views on this question. Fully two-thirds of Americans
age 65 and older see Christmas as a religious holiday, as do most Americans ages 50-64 (55%) and
1 In Mexico and several other Latin American countries, the feast of the Epiphany (Jan. 6) rather than Christmas Day is the traditional
day for large celebrations and exchanging gifts. Hispanic respondents may have been indicating in their answers to this question that
the large-scale celebration centered on Christmas Day is more characteristic of U.S. culture than of Latin American culture.
Is Christmas More a Religious or Cultural Holiday?
Celebrate Christmas and see it as… Don’t
celebrate
Sometimescelebrate/
DK/Ref Religious Cultural Other*
% % % % %
Total 51 32 9 7 1=100
Men 46 36 9 9 1=100
Women 57 29 8 5 1=100
White 54 31 9 5 1=100
Black 50 28 9 12 1=100
Hispanic 46 37 7 8 3=100
18-29 39 44 8 8 1=100
30-49 50 36 7 7 1=100
50-64 55 26 11 7 1=100
65+ 66 19 9 5 1=100
Protestant 67 20 8 5 *=100
White evangelical 82 9 7 2 0=100
White mainline 56 31 11 2 0=100
Black Protestant 60 21 8 11 1=100
Catholic 59 26 11 2 2=100
White Catholic 66 21 12 * 1=100
Hispanic Catholic 51 35 8 3 4=100
Unaffiliated 10 68 9 11 3=100
Source: Pew Research Center Dec. 3-8, 2013. Q80, Q81. Figures may not sum to 100% due
to rounding.
*Includes people who celebrate Christmas but do not say whether they think it is a religious
or cultural holiday.
PEW RESEARCH CENTER

7
PEW RESEARCH CENTER
www.pewresearch.org/religion
half of those in their 30s and 40s (50%). By contrast, 39% of adults under 30 say Christmas is
more of a religious holiday, while 44% say for them, personally, Christmas is more of a cultural
occasion.

8
PEW RESEARCH CENTER
www.pewresearch.org/religion
Slightly more than half of the public (54%) says they plan to
attend religious services on Christmas Eve or Christmas Day this
year. By comparison, about one-third of the public (36%) says
that they attend religious services in a typical week.
Three-quarters (73%) of people who say Christmas is more of a
religious holiday plan to attend religious services either on
Christmas Eve or Christmas Day. Far fewer people who say they
see Christmas as more of a cultural holiday or who do not
celebrate Christmas at all say they will be in the pews this
Christmas (30% and 24%, respectively).
Women are somewhat more likely than men to say they will
attend Christmas services this year (58% vs. 50%), and parents
who are currently raising minor children in their household say
they will attend Christmas services at higher rates than non-
parents (59% vs. 51%). A majority of adults age 30 and older say
they plan to attend religious services this Christmas, compared
with 46% of adults under 30.
Among religious groups, three-quarters of Catholics (76%) and
seven-in-ten white evangelical Protestants (71%) plan to attend
Christmas religious services this year, as do two-thirds of black
Protestants (65%). About half of white mainline Protestants say
they will attend Christmas services. Among U.S. adults who are
unaffiliated with a religion, just 16% say they intend to go to
religious services this Christmas.
Roughly seven-in-ten Americans say they typically attended
Christmas religious services when they were growing up. Younger
adults are less likely than older adults to have grown up doing
this. Roughly three-quarters of adults age 50 and older say they
grew up attending Christmas services, compared with two-thirds
of those in their 30s and 40s and 62% of those under age 30.
Attendance at Christmas
Religious Services
Plan to attend
this year
Typically attended as a child
% %
Total 54 69
Men 50 67
Women 58 70
White 53 70
Black 58 74
Hispanic 65 73
18-29 46 62
30-49 57 67
50-64 55 73
65+ 60 76
Parent/Guardian 59 67
Not parent/guardian 51 70
Protestant 62 71
White evangelical 71 72
White mainline 47 69
Black Protestant 65 76
Catholic 76 89
White Catholic 82 95
Hispanic Catholic 70 78
Unaffiliated 16 50
See Christmas as …
Religious holiday 73 79
Cultural holiday 30 57
Don’t celebrate 24 43
Source: Pew Research Center Dec. 3-8,
2013. Q85b and Q87b.
PEW RESEARCH CENTER

9
PEW RESEARCH CENTER
www.pewresearch.org/religion
Roughly three-quarters of adults (73%) say they
believe Jesus was born of a virgin. About one-
in-five (19%) say they do not believe this, and
7% say they don’t know or decline to answer the
question.
The vast majority of white evangelical
Protestants (97%), black Protestants (94%) and
white Catholics (88%) believe in the virgin birth
of Jesus, as do 81% of Hispanic Catholics.
Fewer white mainline Protestants (70%) believe
this. Among the religiously unaffiliated, 32%
believe that Jesus was born to a virgin.
About nine-in-ten adults (91%) who see
Christmas as a religious holiday say they believe
Jesus was born of a virgin. However, even
among those who celebrate Christmas as a
cultural holiday and those who do not celebrate
Christmas, roughly half say they believe in the
virgin birth.
Belief That Jesus was Born of a Virgin
Believe Do not believe
Don’t know
% % %
Total 73 19 7=100
Men 69 22 9=100
Women 78 17 5=100
White 71 21 7=100
Black 90 7 4=100
Hispanic 78 17 4=100
18-29 66 27 7=100
30-49 76 18 6=100
50-64 76 16 8=100
65+ 76 17 7=100
Protestant 87 9 4=100
White evangelical 97 1 2=100
White mainline 70 21 9=100
Black Protestant 94 4 2=100
Catholic 86 10 4=100
White Catholic 88 7 6=100
Hispanic Catholic 81 17 2=100
Unaffiliated 32 53 15=100
See Christmas as …
Religious holiday 91 6 3=100
Cultural holiday 50 39 11=100
Don’t celebrate 51 41 8=100
Source: Pew Research Center Dec. 3-8, 2013. Q88. Figures may not
sum to 100% due to rounding.
PEW RESEARCH CENTER
10
PEW RESEARCH CENTER
www.pewresearch.org/religion
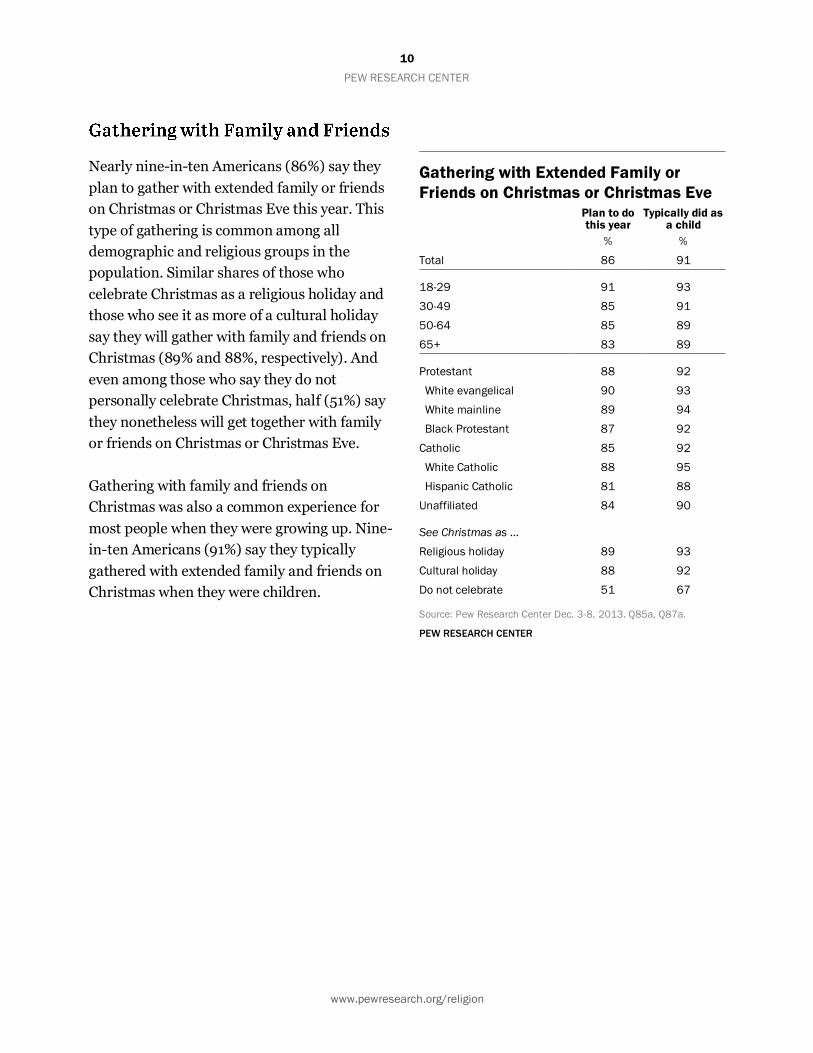
Nearly nine-in-ten Americans (86%) say they
plan to gather with extended family or friends
on Christmas or Christmas Eve this year. This
type of gathering is common among all
demographic and religious groups in the
population. Similar shares of those who
celebrate Christmas as a religious holiday and
those who see it as more of a cultural holiday
say they will gather with family and friends on
Christmas (89% and 88%, respectively). And
even among those who say they do not
personally celebrate Christmas, half (51%) say
they nonetheless will get together with family
or friends on Christmas or Christmas Eve.
Gathering with family and friends on
Christmas was also a common experience for
most people when they were growing up. Nine-
in-ten Americans (91%) say they typically
gathered with extended family and friends on
Christmas when they were children.
Gathering with Extended Family or
Friends on Christmas or Christmas Eve
Plan to do this year
Typically did as a child
% %
Total 86 91
18-29 91 93
30-49 85 91
50-64 85 89
65+ 83 89
Protestant 88 92
White evangelical 90 93
White mainline 89 94
Black Protestant 87 92
Catholic 85 92
White Catholic 88 95
Hispanic Catholic 81 88
Unaffiliated 84 90
See Christmas as …
Religious holiday 89 93
Cultural holiday 88 92
Do not celebrate 51 67
Source: Pew Research Center Dec. 3-8, 2013. Q85a, Q87a.
PEW RESEARCH CENTER

11
PEW RESEARCH CENTER
www.pewresearch.org/religion
Fully 86% of Americans say they plan to buy
gifts for friends and family over the Christmas
or holiday season this year. This includes large
majorities of people in all large U.S. religious
groups as well as those without any religious
affiliation.
Buying gifts is less common among Americans
whose annual household income falls below
$30,000. Roughly three-quarters of those
earning less than $30,000 plan to buy gifts this
year, compared with roughly nine-in-ten or
more of those in higher income brackets.
Nine-in-ten Americans (89%) say buying gifts
was also typically part of how they marked the
holidays as they were growing up.
Buying Gifts for Friends or Family
Plan to do this year
Typically did as a child
% %
Total 86 89
White 90 93
Black 79 90
Hispanic 77 72
18-29 91 93
30-49 88 89
50-64 85 89
65+ 78 87
Current family income
$100,000 or more 94 94
$75,000-$99,999 96 94
$50,000-$74,999 93 92
$30,000-$49,999 88 91
Less than $30,000 78 84
Protestant 87 90
White evangelical 90 91
White mainline 92 94
Black Protestant 79 91
Catholic 84 88
White Catholic 88 97
Hispanic Catholic 78 72
Unaffiliated 89 91
See Christmas as …
Religious holiday 88 91
Cultural holiday 91 91
Do not celebrate 54 73
Source: Pew Research Center Dec. 3-8, 2013. Q84c, Q86c.
PEW RESEARCH CENTER

12
PEW RESEARCH CENTER
www.pewresearch.org/religion
Roughly six-in-ten Americans say they plan to
give homemade items, such as baked goods or
crafts, as gifts this holiday season. Far more
women than men say they plan to give
homemade gifts this year (65% vs. 51%).
Making homemade gifts is also more common
among whites (62%) and Hispanics (54%) than
among blacks (41%), and it is more common
among parents of minor children than among
those who are not currently raising children in
their households (64% vs. 55%).
Similar numbers of high-income earners and
those with lower household incomes say they
plan to give homemade gifts this year (61%
among those earning $100,000 or more, 59%
among those earning less than $30,000).
Two-thirds of Americans say they typically
made homemade Christmas and holiday gifts
when they were growing up.
Giving Homemade Gifts
Plan to do this year
Typically did as a child
% %
Total 58 66
Men 51 63
Women 65 69
White 62 69
Black 41 62
Hispanic 54 59
Current family income
$100,000 or more 61 65
$75,000-$99,999 58 60
$50,000-$74,999 58 66
$30,000-$49,999 59 69
Less than $30,000 59 67
Parent/Guardian 64 66
Not parent/guardian 55 66
Protestant 58 69
White evangelical 67 71
White mainline 60 69
Black Protestant 40 65
Catholic 59 69
White Catholic 61 74
Hispanic Catholic 56 61
Unaffiliated 55 58
See Christmas as …
Religious holiday 64 71
Cultural holiday 56 63
Do not celebrate 28 42
Source: Pew Research Center Dec. 3-8, 2013. Q84a, Q86a.
PEW RESEARCH CENTER

13
PEW RESEARCH CENTER
www.pewresearch.org/religion
One-in-five adults say they are
the parent or guardian of a
child in their household who
currently believes in Santa
Claus. An additional 14% of
Americans are parents or
guardians of at least one child
under the age of 18 but say
their children do not believe in
Santa Claus. (About two-thirds
of Americans are not the
parents or guardians of any
children in their household.)
Nearly six-in-ten Hispanics
say they are parenting minor
children in their homes,
including 38% who have
children who believe in Santa
Claus. By comparison, fewer
blacks and whites say they
currently have Santa-believing
children (21% and 15%,
respectively), in part because
blacks and whites are less
likely than Hispanics to have
minor children in the home.
Being the parent or guardian
of a child who believes in
Santa Claus is most common
among Americans ages 30-49. Nearly two-thirds of respondents in this age group (63%) say they
are parents, including 38% who have a child who believes in Santa Claus. Compared with those in
their 30s and 40s, both younger adults and those 50 and older are less likely to be parenting
children and to have children who believe in Santa.
Currently Parenting a Child Who Believes
in Santa Claus?
Parent or guardian of minor child
Have child who believes
in Santa
Do not have child who believes in
Santa
Not parent or guardian of minor child
% % % %
Total 33 19 14 67=100
White 28 15 13 72=100
Black 36 21 15 64=100
Hispanic 56 38 19 44=100
18-29 26 17 8 74=100
30-49 63 38 25 37=100
50-64 21 8 13 79=100
65+ 5 2 3 95=100
Married 45 24 21 55=100
Not married 21 13 8 79=100
Protestant 32 16 16 68=100
White evangelical 30 13 17 70=100
White mainline 28 18 10 72=100
Black Protestant 38 22 16 62=100
Catholic 37 24 13 63=100
White Catholic 23 12 11 77=100
Hispanic Catholic 62 47 15 38=100
Unaffiliated 31 18 12 69=100
Source: Pew Research Center Dec. 3-8, 2013. PARENT, SANTA. Figures may not sum to
100% due to rounding. The “Do not have child who believes in Santa” column includes
those who are unsure or say they don’t know if their children believe in Santa. The “Not
parent or guardian of minor child” column includes those who decline to say whether they
have a child in their home.
PEW RESEARCH CENTER

14
PEW RESEARCH CENTER
www.pewresearch.org/religion
Among those who have a child who believes in
Santa Claus, seven-in-ten (69%) say they plan
to pretend that Santa visits their house on
Christmas Eve this year. But even among U.S.
adults without a child who believes in Santa,
sizable numbers plan on receiving a visit from
Old St. Nick. Roughly one-in-five parents
whose children do not believe in Santa (18%)
say they will pretend to get a visit from Santa
this year, as do 22% of those who are not the
parents or guardians of minor children in their
household.
Nearly three-quarters of Americans say they
typically received Christmas Eve visits from
Santa as children. This includes big majorities
of those age 65 and older (who were raised in
the 1940s, 1950s and earlier) as well as those
who grew up several decades later in the 1980s
and 1990s.
Pretending Santa Claus Will Visit
on Christmas Eve
Plan to do this
year
Typically did as a
child
% %
Total 31 72
White 31 78
Black 20 67
Hispanic 45 65
18-29 30 70
30-49 39 75
50-64 27 72
65+ 23 72
Parent/Guardian 49 72
Have child who believes in Santa 69 76
Do not have child who believes in Santa 18 63
Not parent/guardian 22 73
Protestant 28 75
White evangelical 30 77
White mainline 31 81
Black Protestant 17 71
Catholic 40 75
White Catholic 32 81
Hispanic Catholic 53 68
Unaffiliated 30 69
See Christmas as …
Religious holiday 33 77
Cultural holiday 33 71
Do not celebrate 11 46
Source: Pew Research Center Dec. 3-8, 2013. Q85c, Q87c.
PEW RESEARCH CENTER

15
PEW RESEARCH CENTER
www.pewresearch.org/religion
Eight-in-ten Americans (79%)
say they plan to put up a
Christmas tree this year, and
two-thirds (65%) say they
intend to send Christmas or
holiday cards. Far fewer (16%)
say they plan to go caroling
this year.
Putting up a Christmas tree is
a common practice across a
variety of demographic and
religious groups. Even among
those who are not affiliated
with any religion, 73% say they
plan to have a Christmas tree
this year. And a recent Pew
Research survey found that
32% of Jews say they had a
Christmas tree in their house
last year.
Erecting a Christmas tree is,
however, somewhat more
common among high-income
earners (86% among those
earning $75,000 or more)
than among those with lower
household incomes (75%
among those earning less than
$30,000). More whites (81%)
and Hispanics (82%) than
blacks (65%) say they intend
to put up a tree. Fully 90% of
parents of minor children say
Holiday Activities: Caroling, Cards
and Christmas Trees
% who plan to do each of the following this year
Put up
Christmas tree Send Christmas or
holiday cards Go
caroling
% % %
Total 79 65 16
White 81 68 15
Black 65 64 14
Hispanic 82 55 --^
18-29 82 59 16
30-49 82 63 18
50-64 77 68 15
65+ 73 73 15
Current family income
$100,000 or more 86 68 15
$75,000-$99,999 86 68 14
$50,000-$74,999 79 70 13
$30,000-$49,999 77 64 15
Less than $30,000 75 62 19
Parent/Guardian 90 68 19
Not parent/guardian 73 64 15
Protestant 81 68 17
White evangelical 87 72 22
White mainline 84 70 11
Black Protestant 66 67 15
Catholic 84 68 19
White Catholic 84 76 13
Hispanic Catholic 89 55 --^
Unaffiliated 73 57 8
See Christmas as …
Religious holiday 85 72 20
Cultural holiday 82 60 12
Do not celebrate 16 31 7
Source: Pew Research Center Dec. 3-8, 2013. Q84b,d,e.
^In the Spanish translation, respondents were asked about singing Christmas carols more
generally, making the results for Hispanic respondents not directly comparable with those
interviewed entirely in English.
PEW RESEARCH CENTER

16
PEW RESEARCH CENTER
www.pewresearch.org/religion
they plan to put up a tree, compared with 73% of those who are not parents or guardians of
children in their home.
Sending Christmas or holiday cards is more common among adults age 50 and older than among
younger adults. Nearly three-quarters of adults age 65 and older (73%) say they intend to send
Christmas cards this year, as do 68% of those ages 50-64. By comparison, 59% of adults under age
30 say they plan to send cards this year.

17
PEW RESEARCH CENTER
www.pewresearch.org/religion
Upwards of nine-in-ten U.S. adults say they
typically had a Christmas tree in their home
when they were growing up, and 81% say they
or their family sent out Christmas or holiday
cards. Compared with blacks and whites, fewer
Hispanics say their family typically had a
Christmas tree (79%) or sent holiday cards
(56%) when they were children.
Roughly one-third of Americans say they
usually went caroling when they were children.
Adults age 30 and older are more likely to
remember caroling as a typical part of their
holiday celebrations than adults under 30.
Christmases Past: Caroling, Cards
and Christmas Trees During Childhood
% who typically did each of the following as children
Put up Christmas
tree
Send Christmas or holiday cards
Go caroling
% % %
Total 92 81 36
White 96 87 37
Black 90 81 31
Hispanic 79 56 --^
18-29 90 72 25
30-49 93 81 40
50-64 91 87 38
65+ 93 86 43
Protestant 95 84 38
White evangelical 97 86 46
White mainline 97 87 36
Black Protestant 93 83 33
Catholic 89 79 44
White Catholic 98 94 37
Hispanic Catholic 75 53 --^
Unaffiliated 95 81 23
Source: Pew Research Center Dec. 3-8, 2013. Q86b,d,e.
^In the Spanish translation, respondents were asked about singing
Christmas carols more generally, making the results for Hispanic
respondents not directly comparable with those interviewed entirely
in English.
PEW RESEARCH CENTER

18
PEW RESEARCH CENTER
www.pewresearch.org/religion
When asked to describe, in their own words, what they most look
forward to about Christmas and the holiday season, seven-in-ten
Americans (69%), including large majorities across a variety of
religious groups, cite spending time with family and friends.
Smaller numbers say they look forward to the religious elements
of Christmas (11%), to people being happy and joyful (7%), to the
Christmas spirit (4%), to Christmas music, decorations and
entertainment (4%) and to exchanging gifts (4%). Roughly one-
in-twenty Americans (4%) say there is nothing about Christmas
or the holidays they look forward to, except perhaps the end of
the season.
Christmas and the
Holidays: What Do You
Most Look Forward To?
%
Time with family/friends 69
Religious reflection/Church 11
People are happy, joyful 7
Christmas spirit/Joy/Love/Peace 4
Music/Decorations/TV/Movies 4
Giving or exchanging gifts 4
Vacation/Time to rest 3
Acts of generosity, kindness 3
Food/Drinks/Cooking/Eating 2
Winter weather/Snow 1
Shopping/Good deals 1
Other 4
Nothing/End of Christmas 4
Don’t know/Refused 2
Sample size 977
Source: Pew Research Center Dec. 3-8,
2013. Q82F1. Figures do not sum to 100%
because multiple responses were
permitted.
PEW RESEARCH CENTER

19
PEW RESEARCH CENTER
www.pewresearch.org/religion
When asked what they like least about Christmas and the
holidays, fully one-third of Americans cite the commercialization
of the season, while 22% say they dislike the heavy expenses
associated with the holidays, and 10% say they dislike holiday
shopping and crowds. Smaller numbers lament the de-emphasis
of the religious elements of the season (6%), inclement weather
(3%), seasonal music and/or garish decorations (3%) and the
hectic pace of the holidays (3%). Roughly one-in-five say there is
nothing they dislike about the holidays, other than that they
often seem to be over too fast (6%).
Christmas and the
Holidays: What Do You
Like the Least?
%
Commercialism/Materialism 33
Money/Too expensive 22
Shopping/Crowds/Crowded stores 10
Removal of religion, Christ 6
Winter weather/snow 3
Music/Decorations – too early 3
Hectic pace/Being busy 3
People are in bad mood 2
Travel/Traffic 2
Have to go to church 2
Inability to see family/friends 2
Food/Gaining weight 1
Remembering loss 1
Other 5
Nothing/It’s over too fast 6
Don’t know/Refused 8
Sample size 977
Source: Pew Research Center Dec. 3-8,
2013. Q83F1. Figures do not sum to 100%
because multiple responses were
permitted.
PEW RESEARCH CENTER

20
PEW RESEARCH CENTER
www.pewresearch.org/religion
About the Survey
The analysis for this report is based on telephone interviews conducted Dec. 3-8, 2013, among a
national sample of 2,001 adults, 18 years of age or older, living in all 50 U.S. states and the District
of Columbia (1,000 respondents were interviewed on a landline telephone, and 1,001 were
interviewed on a cellphone, including 523 who had no landline telephone). The survey was
conducted by interviewers at Princeton Data Source under the direction of Princeton Survey
Research Associates International. A combination of landline and cellphone random digit dial
samples were used; both samples were provided by Survey Sampling International. Interviews
were conducted in English and Spanish. Respondents in the landline sample were selected by
randomly asking for the youngest adult male or female who is now at home. Interviews in the cell
sample were conducted with the person who answered the phone, if that person was an adult 18
years of age or older. For detailed information about survey methodology, see http://people-
press.org/methodology/.
The combined landline and cellphone sample are weighted using an iterative technique that
matches gender, age, education, race, Hispanic origin and nativity and region to parameters from
the 2011 U.S. Census Bureau’s American Community Survey and population density to parameters
from the Decennial Census. The sample also is weighted to match current patterns of telephone
status and relative usage of landlines and cellphones (for those with both), based on extrapolations
from the 2012 National Health Interview Survey. The weighting procedure also accounts for the
fact that respondents with both landlines and cellphones have a greater probability of being
included in the combined sample and adjusts for household size among respondents with a
landline phone. Sampling errors and statistical tests of significance take into account the effect of
weighting.

21
PEW RESEARCH CENTER
www.pewresearch.org/religion
The following table shows the unweighted sample sizes and the error attributable to sampling that
would be expected at the 95% level of confidence for different groups in the survey:
Group
Unweighted sample size
Plus or minus…
Total sample 2,001 2.6 percentage points
Men 968 3.7 percentage points
Women 1,033 3.5 percentage points
White 1,481 3.0 percentage points
Black 191 8.3 percentage points
Hispanic 192 8.2 percentage points
Age 18-29 289 6.7 percentage points
30-49 513 5.0 percentage points
50-64 609 4.6 percentage points
65+ 550 4.9 percentage points
Current family income
$100,000 or more 355 6.1 percentage points
$75,000-$99,999 215 7.8 percentage points
$50,000-$74,999 269 7.0 percentage points
$30,000-$49,999 362 6.0 percentage points
Less than $30,000 545 4.9 percentage points
Parent/Guardian 540 4.9 percentage points
Not parent/guardian 1,458 3.0 percentage points
Protestant 1,068 3.5 percentage points
White evangelical 466 5.3 percentage points
White mainline 349 6.1 percentage points
Black Protestant 147 9.4 percentage points
Catholic 429 5.5 percentage points
White Catholic 283 6.8 percentage points
Hispanic Catholic 109 10.9 percentage points
Unaffiliated 346 6.1 percentage points
See Christmas as…
Religious holiday 1,103 3.4 percentage points
Cultural holiday 573 4.8 percentage points
Don’t celebrate 128 10.1 percentage points
Sample sizes and sampling errors for other subgroups are available upon request. In addition to
sampling error, one should bear in mind that question wording and practical difficulties in
conducting surveys can introduce error or bias into the findings of opinion polls.
© Pew Research Center, 2013

22
PEW RESEARCH CENTER
www.pewresearch.org
PEW RESEARCH CENTER FOR THE PEOPLE & THE PRESS DECEMBER 2013 POLITICAL SURVEY
FINAL TOPLINE December 3-8, 2013
N=2,001 QUESTIONS 1-79 PREVIOUSLY RELEASED OR HELD FOR FUTURE RELEASE ASK ALL: On another subject …
Q.80 Do you celebrate Christmas, or not? Dec 3-8 2013 92 Yes 7 No 1 Sometimes (VOL.) * Don't know/Refused (VOL.)
TREND FOR COMPARISON: Do you celebrate Christmas?
(VOL.) Yes No DK/Ref Gallup/USA Today: December, 2010 95 4 * Gallup/USA Today: December, 2008 93 7 0 Gallup/CNN/USA Today: December, 2005 96 4 * Gallup: December, 2003 95 5 0 Gallup: December, 2000 96 4 * Gallup/CNN/USA Today: December, 1994 96 4 * READ TO ALL: [IF R CELEBRATES CHRISTMAS OR DECLINED TO SAY (Q.80=1,3,9), READ: I have a few more
questions about Christmas and the holiday season; IF R DOES NOT CELEBRATE CHRISTMAS (Q.80=2), READ: Even though you don’t personally celebrate Christmas, I have a few questions about Christmas and the holiday season in general]. ASK IF CELEBRATES CHRISTMAS OR DECLINED TO SAY (Q80=1, 3, 9): Q.81 For you personally, is Christmas [INSERT; RANDOMIZE]? BASED ON TOTAL: Dec 3-8 2013 52 More of a religious holiday
33 More of a cultural holiday 7 Both of these (VOL.) 1 Other/none of these (VOL.) 0 Do not celebrate Christmas (VOL.) 1 Don't know/Refused (VOL.) 7 Does not celebrate Christmas (Q.80=2)

23
PEW RESEARCH CENTER
www.pewresearch.org
RANDOMIZE Q.82F1 AND Q.83F1 ASK FORM 1 ONLY [N=977]: Q.82F1 What do you most look forward to about Christmas or the holiday season? [OPEN END; RECORD
VERBATIM RESPONSE; RECORD UP TO THREE MENTIONS IN ORDER MENTIONED BUT DO NOT PROBE FOR ADDITIONAL]
Dec 3-8 2013 69 Spending time with family/friends 11 Church/Religious reflection
7 People are in a good mood/Children 4 Christmas spirit/Joy/Love/Peace 4 Gifts/Receiving gifts/Exchanging gifts/Buying gifts 4 Nothing/The end of Christmas/Christmas being over 3 Vacation/Rest 3 Giving/Acts of kindness/Generosity 2 Music/Decorations/Movies/TV Shows 2 Food/Drinks/Cooking/Eating 1 Shopping/Holiday deals 1 Snow/Winter weather/Winter 4 Other 2 Don’t know/Refused
RANDOMIZE Q.82F1 AND Q.83F1 ASK FORM 1 ONLY [N=977]: Q.83F1 What do you like the least about Christmas or the holiday season? [OPEN END; RECORD
VERBATIM RESPONSE; RECORD UP TO THREE MENTIONS IN ORDER MENTIONED BUT DO NOT PROBE FOR ADDITIONAL]
Dec 3-8 2013 33 Commercials/Materialism/Consumerism/Greed 22 Expectation of buying gifts/Money/Cost
10 Shopping/Crowds/Crowded stores/Black Friday 6 Lack of religious reflection/Removing Christ 6 Nothing/It’s over too fast 3 Snow/Winter weather/Winter 3 Music/Decorations/Decorations too early/Season starts too early 3 Hectic pace/Being busy 2 People/People that are in a bad mood 2 Travel/Traffic 2 Having to go to church/Too religious/Controversy about religion 2 Inability to spend time with family/friends 1 Food/Gaining weight/too much food 1 Remembering loss
5 Other 8 Don’t know/Refused

24
PEW RESEARCH CENTER
www.pewresearch.org
ASK ALL: Q.84 Please tell me whether or not you plan to do each of the following this year over Christmas or the
holiday season. Do you plan to [INSERT ITEM; RANDOMIZE, A SHOULD ALWAYS PRECEDE C, THOUGH IT NEED NOT IMMEDIATELY PRECEDE C] over Christmas or the holiday season this year, or not? And do you plan to [INSERT NEXT ITEM], or not? How about [NEXT ITEM]? [READ AS NECESSARY: Do you plan to do this over Christmas or the holiday season this year, or not?]
(VOL.) Yes1 No DK/Ref a. Give homemade gifts, such as baked goods or crafts
Dec 3-8, 2013 58 41 1 b. Put up a Christmas tree Dec 3-8, 2013 79 20 1 TREND FOR COMPARISON: Do you, or does your family, do each of the following as part of its celebration of Christmas, or not? How about put up a Christmas tree? USA Today/Gallup: December, 20102 88 12 * c. Buy gifts for friends or family Dec 3-8, 2013 86 13 1
d. Go caroling Dec 3-8, 2013 16 82 2 e. Send Christmas or holiday cards Dec 3-8, 2013 65 34 1 ASK ALL: Now, thinking specifically about what you’ll be doing on Christmas Eve and Christmas day… Q.85 Do you plan to [INSERT ITEM, RANDOMIZE] on Christmas Eve or Christmas day this year, or
not? And do you plan to [INSERT NEXT ITEM] on Christmas Eve or Christmas day this year, or
not? How about [NEXT ITEM]? [REPEAT AS NECESSARY: Do you plan to do this on Christmas Eve or Christmas day this year, or not?]
(VOL.) Plan to do this, but (VOL.) Yes No on a different day DK/Ref a. Attend a gathering with extended family or friends Dec 3-8, 2013 86 12 * 1 b. Attend religious services Dec 3-8, 2013 54 43 1 3 TREND FOR COMPARISON:
Do you, or does your family, do each of the following as part of its celebration of Christmas, or not? How about attend religious services on Christmas Eve or Christmas Day USA Today/Gallup: December, 20103 62 39 -- * c. Pretend Santa Claus visits your home Dec 3-8, 2013 31 68 * 1
1 Includes those who volunteer that they have already done this. 2 Those who answered in a previous question that they did not celebrate Christmas were not asked this question and
recorded as “no.” 3 Those who answered in a previous question that they did not celebrate Christmas were not asked this question and
recorded as “no.” “Plan to do this, but on a different day” was not a volunteered option.

25
PEW RESEARCH CENTER
www.pewresearch.org
ASK ALL: Now, thinking about your childhood… Q.86 When you were growing up, did you or your family typically [INSERT ITEM; READ IN SAME
ORDER AS Q84] over Christmas or the holiday season, or not? And when you were growing up, did you or your family typically [INSERT NEXT ITEM] over Christmas or the holiday season, or not? How about [NEXT ITEM]? [READ AS NECESSARY: When you were growing up, did you or your family typically do this over Christmas or the holiday season, or not?]
(VOL.) Yes No DK/Ref
a. Give homemade gifts, such as baked goods or crafts Dec 3-8, 2013 66 33 1 b. Put up a Christmas tree Dec 3-8, 2013 92 8 * c. Buy gifts for friends or family Dec 3-8, 2013 89 10 1 d. Go caroling Dec 3-8, 2013 36 63 1
e. Send Christmas or holiday cards Dec 3-8, 2013 81 18 1 ASK ALL: And thinking specifically about Christmas Eve and Christmas Day… Q.87 When you were growing up, did you typically [INSERT ITEM; READ IN SAME ORDER AS Q85]
on Christmas Eve or Christmas Day, or not? And when you were growing up, did you typically [INSERT NEXT ITEM] on Christmas Eve or Christmas Day, or not? How about [NEXT ITEM]? [REPEAT AS NECESSARY: When you were growing up did you typically do this on Christmas Eve or Christmas day, or not?]
(VOL.) Did this, but on (VOL.) Yes No a different day DK/Ref a. Attend a gathering with extended family or friends Dec 3-8, 2013 91 9 * * b. Attend religious services Dec 3-8, 2013 69 30 1 1 c. Pretend Santa Claus visited your home Dec 3-8, 2013 72 27 * 1
ASK ALL: Q.88 Do you believe that Jesus Christ was born to a virgin, or don’t you believe this? Dec 3-8 2013 73 Believe 19 Don’t believe 7 Don’t know/Refused (VOL.) NO QUESTIONS 89-93

26
PEW RESEARCH CENTER
www.pewresearch.org
ASK ALL: PARENT Are you the parent or guardian of any children under 18 now living in your household? ASK IF R IS A PARENT (PARENT=1) [N=540]: SANTA As far as you know, do any of these children currently believe in Santa Claus? BASED ON TOTAL: Dec 3-8 2013 19 Parent, has child who believes in Santa
13 Parent, no children believe in Santa 1 Parent, not sure if child believes in Santa (VOL.) * Parent, don’t know/refused if child believes in Santa (VOL.) 67 Not a parent or guardian of any children under 18 now living in household (PARENT=2, 9) ASK ALL: RELIG What is your present religion, if any? Are you Protestant, Roman Catholic, Mormon, Orthodox such
as Greek or Russian Orthodox, Jewish, Muslim, Buddhist, Hindu, atheist, agnostic, something else, or nothing in particular? {QID:relig}
[INTERVIEWER: IF R VOLUNTEERS “nothing in particular, none, no religion, etc.” BEFORE
REACHING END OF LIST, PROMPT WITH: And would you say that’s atheist, agnostic, or just nothing in particular?]
Dec 3-8 2013 Protestant (Baptist, Methodist, Non-denominational, Lutheran, Presbyterian, 39 Pentecostal, Episcopalian, Reformed, Church of Christ, Jehovah’s Witness, etc.) 23 Roman Catholic (Catholic) 1 Mormon (Church of Jesus Christ of Latter-day Saints/LDS) 1 Orthodox (Greek, Russian, or some other orthodox church) 1 Jewish (Judaism)
1 Muslim (Islam) 1 Buddhist 1 Hindu 2 Atheist (do not believe in God) 3 Agnostic (not sure if there is a God) 1 Something else 14 Nothing in particular 12 Christian (VOL.) * Unitarian (Universalist) (VOL.) 1 Don't Know/Refused (VOL.)