Number Plane 5 Graphs and Coordinate Geometry · 1/10/2012 · Number Plane 5 Graphs and Coordinate...
38
5 Number Plane Graphs and Coordinate Geometry 133 Now this is my kind of parabola! Chapter Contents 5:01 The parabola PAS5·1·2, PAS5·2·4, PAS5·3·4 Investigation: The graphs of parabolas 5:02 Parabolas of the form y = ax 2 + bx + c PAS5·3·4 Fun Spot: Why didn’t the bald man need his keys? 5:03 The hyperbola: PAS5·2·4 5:04 Exponential graphs: y = a x PAS5·3·4 Fun Spot: The tower of Hanoi 5:05 The circle PAS5·3·4 5:06 Curves of the form y = ax 3 + d PAS5·3·4 Fun Spot: What is HIJKLMNO? 5:07 Miscellaneous graphs PAS5·2·4, PAS5·3·4 5:08 Using coordinate geometry to solve problems PAS5·3·4 Maths Terms, Diagnostic Test, Revision Assignment, Working Mathematically y k x - = Learning Outcomes PAS5·1·2 Determines the midpoint, length and gradient of an interval joining two points on the number plane and graphs linear and simple non-linear relationships from equations. PAS5·2·4 Draws and interprets graphs including simple parabolas and hyperbolas. PAS5·3·4 Draws and interprets a variety of graphs including parabolas, cubics, exponentials and circles and applies coordinate geometry techniques to solve problems. Working Mathematically Stages 5·3·1–5 1 Questioning, 2 Applying Strategies, 3 Communicating, 4 Reasoning, 5 Reflecting
Transcript of Number Plane 5 Graphs and Coordinate Geometry · 1/10/2012 · Number Plane 5 Graphs and Coordinate...
5Number PlaneGraphs andCoordinate Geometry
133
Now this is
my kind of
parabola!
Chapter Contents5:01 The parabola PAS5·1·2, PAS5·2·4, PAS5·3·4Investigation: The graphs of parabolas5:02 Parabolas of the form y = ax2 + bx + c PAS5·3·4Fun Spot: Why didn’t the bald man need his keys?5:03 The hyperbola: PAS5·2·4
5:04 Exponential graphs: y = ax PAS5·3·4Fun Spot: The tower of Hanoi
5:05 The circle PAS5·3·45:06 Curves of the form y = ax3 + d PAS5·3·4Fun Spot: What is HIJKLMNO?5:07 Miscellaneous graphs PAS5·2·4, PAS5·3·45:08 Using coordinate geometry
to solve problems PAS5·3·4Maths Terms, Diagnostic Test, Revision Assignment, Working Mathematically
y kx--=
Learning OutcomesPAS5·1·2 Determines the midpoint, length and gradient of an interval joining two points on the number
plane and graphs linear and simple non-linear relationships from equations.PAS5·2·4 Draws and interprets graphs including simple parabolas and hyperbolas.PAS5·3·4 Draws and interprets a variety of graphs including parabolas, cubics, exponentials and circles
and applies coordinate geometry techniques to solve problems.
Working Mathematically Stages 5·3·1–51 Questioning, 2 Applying Strategies, 3 Communicating, 4 Reasoning, 5 Reflecting
134 New Signpost Mathematics
Enhanced 10 5.1–5.3
5:01
The Parabola Outcomes
PAS5·1·2, PAS5·2·4, PAS5·3·4
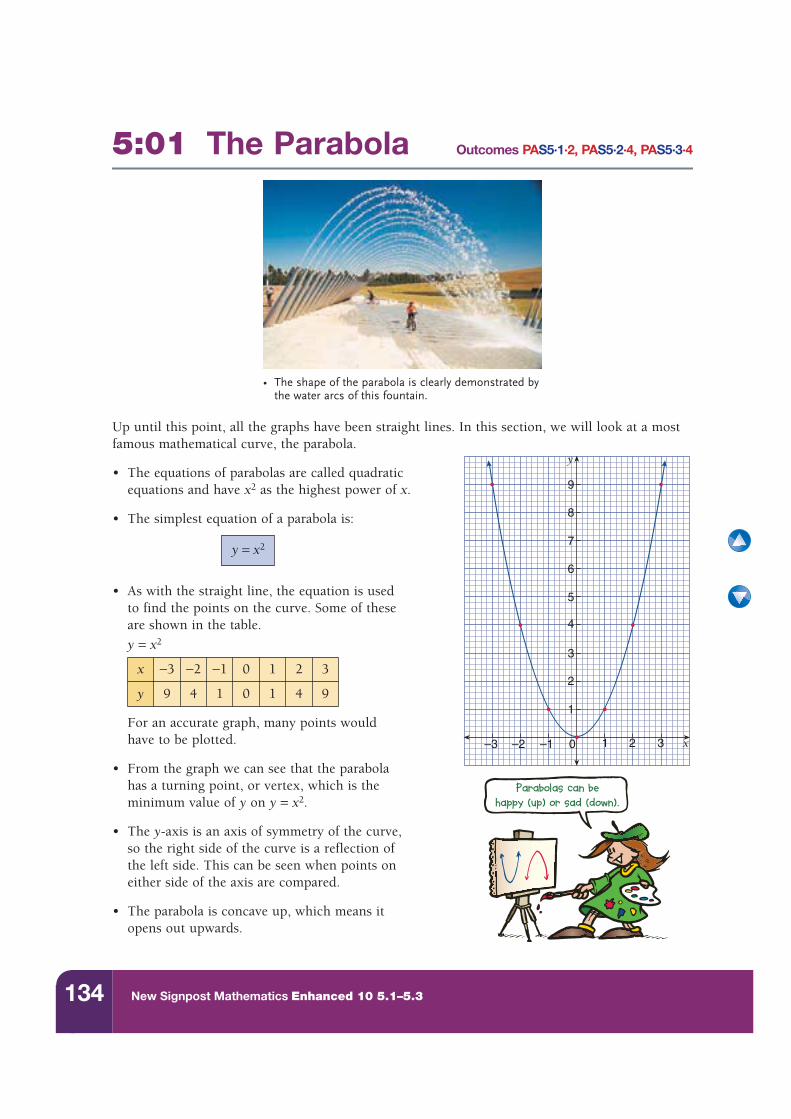
Up until this point, all the graphs have been straight lines. In this section, we will look at a most famous mathematical curve, the parabola.
• The equations of parabolas are called quadraticequations and have x2 as the highest power of x.
• The simplest equation of a parabola is:
• As with the straight line, the equation is usedto find the points on the curve. Some of theseare shown in the table.
y = x2
For an accurate graph, many points wouldhave to be plotted.
• From the graph we can see that the parabolahas a turning point, or vertex, which is the minimum value of y on y = x2.
• The y-axis is an axis of symmetry of the curve,so the right side of the curve is a reflection ofthe left side. This can be seen when points oneither side of the axis are compared.
• The parabola is concave up, which means itopens out upwards.
x −3 −2 −1 0 1 2 3
y 9 4 1 0 1 4 9
• The shape of the parabola is clearly demonstrated by the water arcs of this fountain.
9
8
7
6
5
4
3
2
1
0–1–2–3 1 2 3 x
y
Parabolas can be
happy (up) or sad (down).
y = x2
135Chapter 5
Number Plane Graphs and Coordinate Geometry
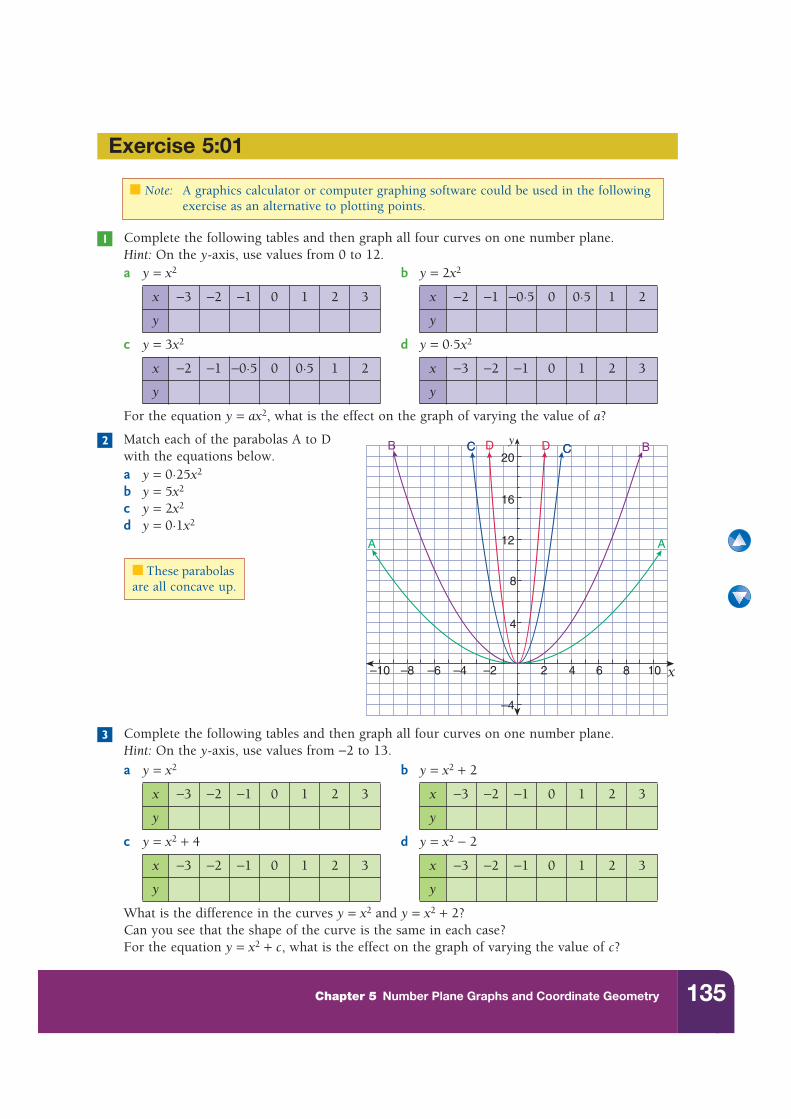
Complete the following tables and then graph all four curves on one number plane.Hint: On the y-axis, use values from 0 to 12.a y = x2 b y = 2x2
c y = 3x2 d y = 0·5x2
For the equation y = ax2, what is the effect on the graph of varying the value of a?
Match each of the parabolas A to D with the equations below.a y = 0·25x2
b y = 5x2
c y = 2x2
d y = 0·1x2
Complete the following tables and then graph all four curves on one number plane.Hint: On the y-axis, use values from −2 to 13.
a y = x2 b y = x2 + 2
c y = x2 + 4 d y = x2 − 2
What is the difference in the curves y = x2 and y = x2 + 2?Can you see that the shape of the curve is the same in each case?For the equation y = x2 + c, what is the effect on the graph of varying the value of c?
x −3 −2 −1 0 1 2 3 x −2 −1 −0·5 0 0·5 1 2
y y
x −2 −1 −0·5 0 0·5 1 2 x −3 −2 −1 0 1 2 3
y y
x −3 −2 −1 0 1 2 3 x −3 −2 −1 0 1 2 3
y y
x −3 −2 −1 0 1 2 3 x −3 −2 −1 0 1 2 3
y y
Exercise 5:01
■ Note: A graphics calculator or computer graphing software could be used in the following exercise as an alternative to plotting points.
1
y
–4
16
4
8
12
20
–2–4–6–8–10 2 4 6 8 10 x
A A
B BCC CCD D2
■ These parabolas are all concave up.
3
136 New Signpost Mathematics Enhanced 10 5.1–5.3
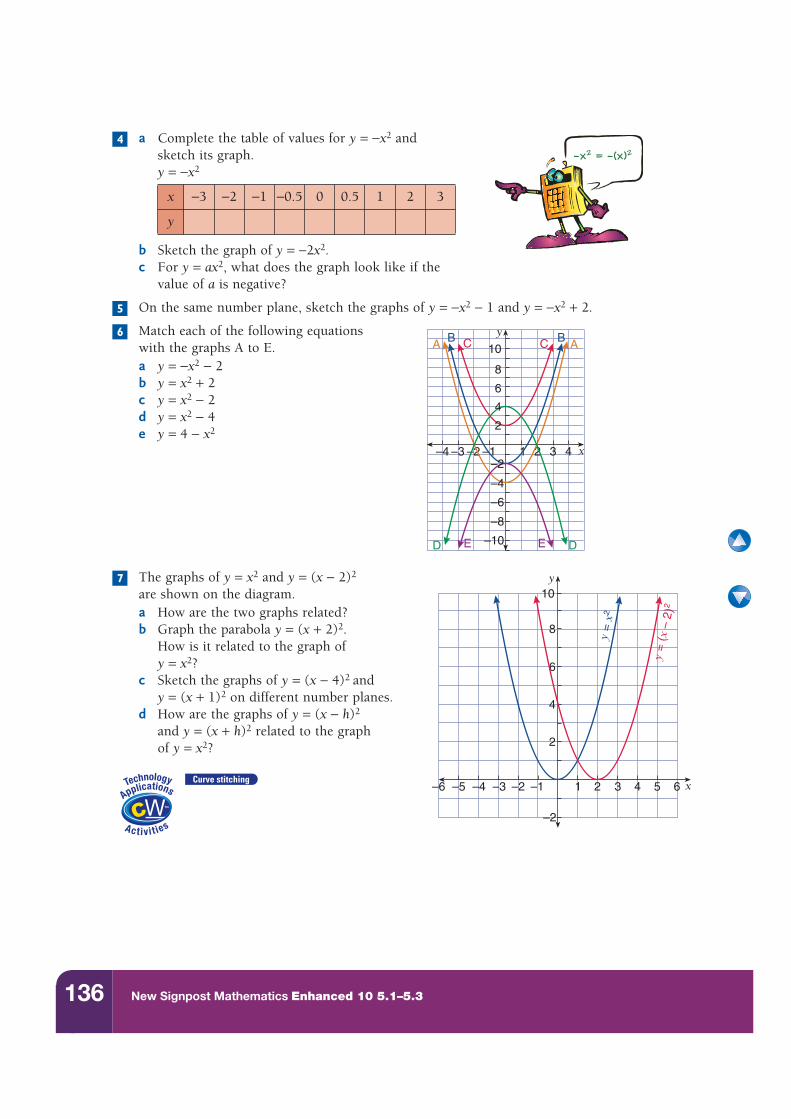
a Complete the table of values for y = −x2 and sketch its graph.y = −x2
b Sketch the graph of y = −2x2.c For y = ax2, what does the graph look like if the
value of a is negative?
On the same number plane, sketch the graphs of y = −x2 − 1 and y = −x2 + 2.
Match each of the following equations with the graphs A to E.a y = −x2 − 2b y = x2 + 2c y = x2 − 2d y = x2 − 4e y = 4 − x2
The graphs of y = x2 and y = (x − 2)2 are shown on the diagram.a How are the two graphs related?b Graph the parabola y = (x + 2)2.
How is it related to the graph ofy = x2?
c Sketch the graphs of y = (x − 4)2 and y = (x + 1)2 on different number planes.
d How are the graphs of y = (x − h)2
and y = (x + h)2 related to the graphof y = x2?
x −3 −2 −1 −0.5 0 0.5 1 2 3
y
–x2 = –(x)24
5
–1–2 1 2 3 x
y
4–3–4
6
4
2
8
10
–2
–6
–8
–10
–4
B BA AC C
D DE E
6
8
–1–2–3–4–5–6 1 2 3 4 5 6 x
y
–2
2
10
4
6
y =
x2
y =
(x –
2)2
7
Curve stitching
137Chapter 5 Number Plane Graphs and Coordinate Geometry
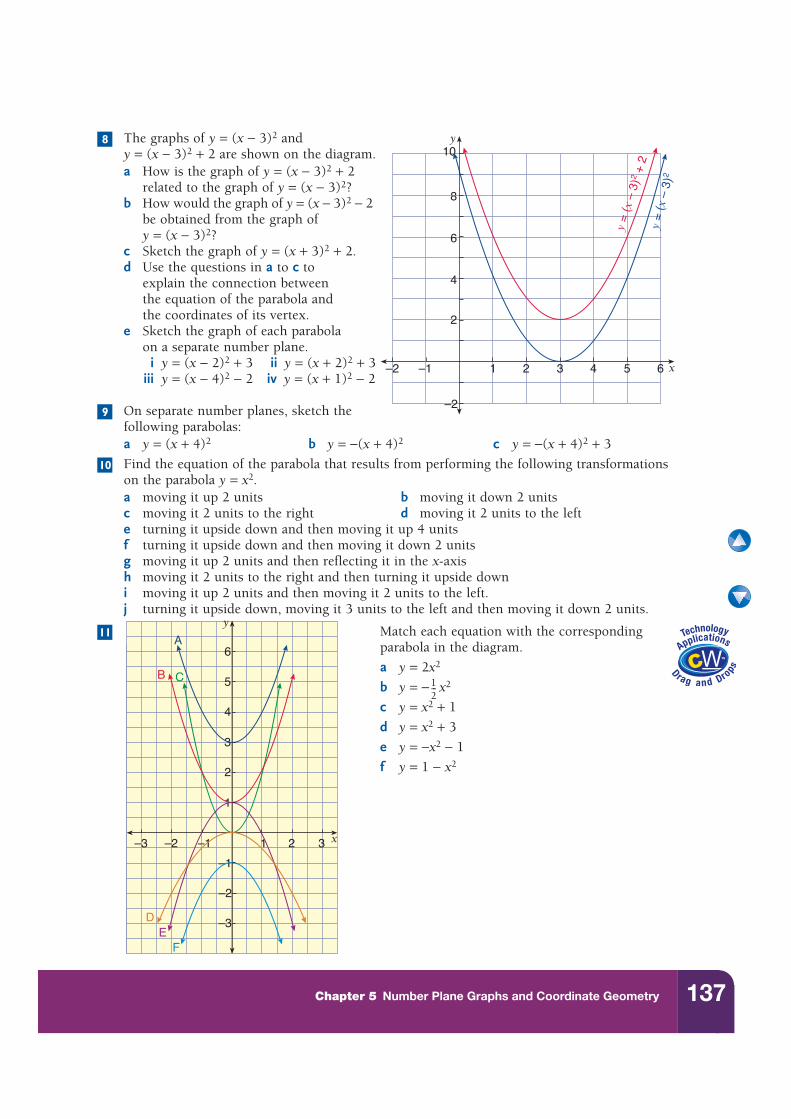
The graphs of y = (x − 3)2 and y = (x − 3)2 + 2 are shown on the diagram.a How is the graph of y = (x − 3)2 + 2
related to the graph of y = (x − 3)2?b How would the graph of y = (x − 3)2 − 2
be obtained from the graph ofy = (x − 3)2?
c Sketch the graph of y = (x + 3)2 + 2.d Use the questions in a to c to
explain the connection betweenthe equation of the parabola andthe coordinates of its vertex.
e Sketch the graph of each parabolaon a separate number plane.
i y = (x − 2)2 + 3 ii y = (x + 2)2 + 3iii y = (x − 4)2 − 2 iv y = (x + 1)2 − 2
On separate number planes, sketch the following parabolas:a y = (x + 4)2 b y = −(x + 4)2 c y = −(x + 4)2 + 3
Find the equation of the parabola that results from performing the following transformations on the parabola y = x2.a moving it up 2 units b moving it down 2 unitsc moving it 2 units to the right d moving it 2 units to the lefte turning it upside down and then moving it up 4 unitsf turning it upside down and then moving it down 2 unitsg moving it up 2 units and then reflecting it in the x-axish moving it 2 units to the right and then turning it upside downi moving it up 2 units and then moving it 2 units to the left.j turning it upside down, moving it 3 units to the left and then moving it down 2 units.
Match each equation with the correspondingparabola in the diagram.
a y = 2x2
b y = − x2
c y = x2 + 1
d y = x2 + 3
e y = −x2 − 1
f y = 1 − x2
8
–1–2 1 2 3 4 5 6 x
y
–2
2
10
4
6
y =
(x –
3)2
y =
(x –
3)2
+ 2
8
9
10
11
1
2
3
–1
–2
–3
–1 1
y
x
A
B C
DE
F
2 3–2–3
4
5
6
12---
138 New Signpost Mathematics Enhanced 10 5.1–5.3
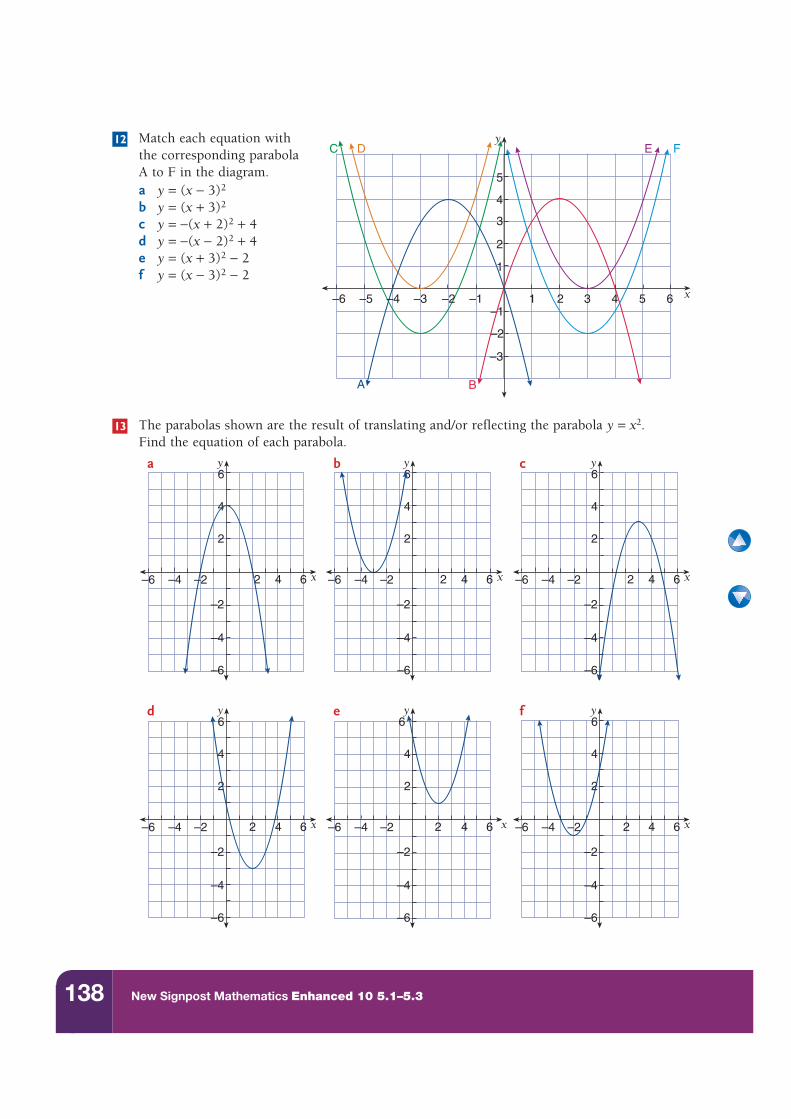
Match each equation withthe corresponding parabolaA to F in the diagram.a y = (x − 3)2
b y = (x + 3)2
c y = −(x + 2)2 + 4d y = −(x − 2)2 + 4e y = (x + 3)2 − 2f y = (x − 3)2 − 2
The parabolas shown are the result of translating and/or reflecting the parabola y = x2. Find the equation of each parabola.
1
2
3
–1
–2
–3
–1 1
y
x
A B
E F
2 3 4 5 6–2–3–4–5–6
4
5
C D12
13
6
4
2
–2
–4
–6
–2–4–6 2 4 6 x
ya6
4
2
–2
–4
–6
–2–4–6 2 4 6 x
yb6
4
2
–2
–4
–6
–2–4–6 2 4 6 x
yc
6
4
2
–2
–4
–6
–2–4–6 2 4 6 x
yd6
4
2
–2
–4
–6
–2–4–6 2 4 6 x
ye6
4
2
–2
–4
–6
–2–4–6 2 4 6 x
yf
139Chapter 5 Number Plane Graphs and Coordinate Geometry
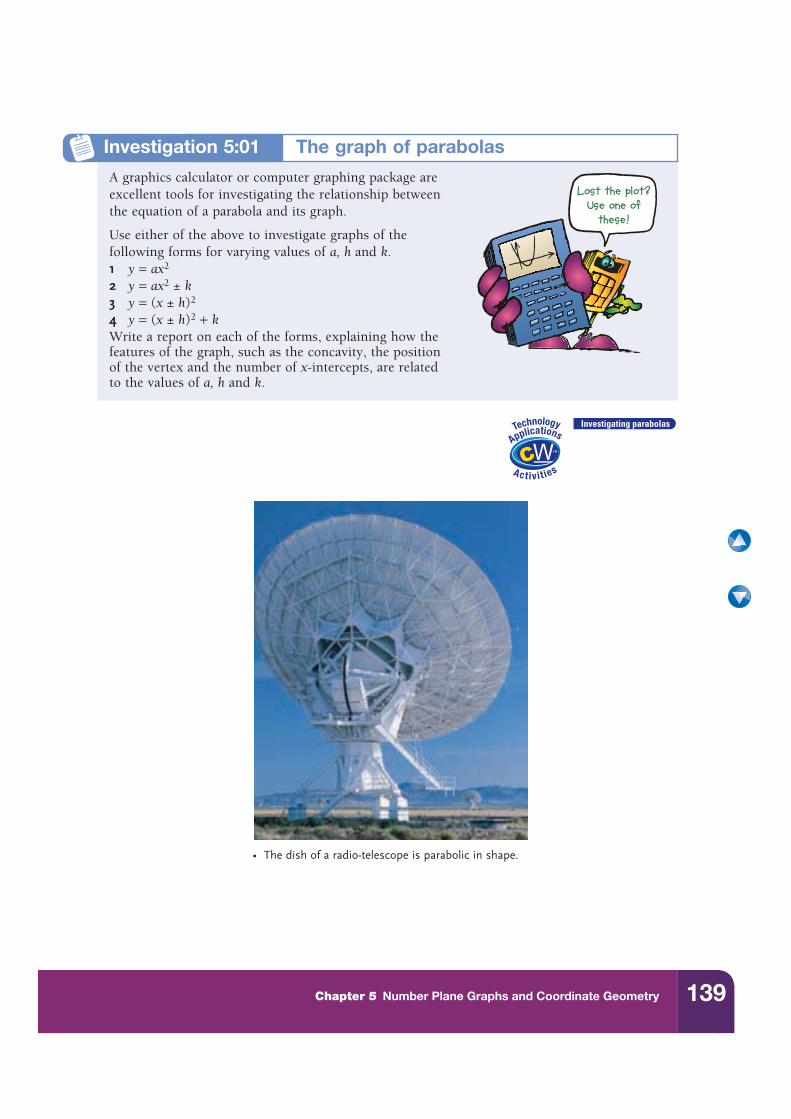
A graphics calculator or computer graphing package are excellent tools for investigating the relationship betweenthe equation of a parabola and its graph.
Use either of the above to investigate graphs of thefollowing forms for varying values of a, h and k.1 y = ax2
2 y = ax2 ± k3 y = (x ± h)2
4 y = (x ± h)2 + kWrite a report on each of the forms, explaining how the features of the graph, such as the concavity, the position of the vertex and the number of x-intercepts, are related to the values of a, h and k.
Lost the plot?
Use one of
these!
Investigation 5:01 The graph of parabolas
Investigating parabolas
• The dish of a radio-telescope is parabolic in shape.
140 New Signpost Mathematics Enhanced 10 5.1–5.3
5:02 Parabolas of the Form Outcome PAS5·3·4
y = ax2 + bx + cIn the last section, we saw that all parabolas have the same basic shape.• They are all concave up or concave down with a single vertex or turning point.• They are symmetrical about an axis of symmetry.
We looked at the connection between the parabola’s shape and its equation and at what numbersin the equation influenced the steepness, the concavity and the position of the graph on the number plane.
In this section, we look at how to sketch the parabola when its equation is given in the formy = ax2 + bx + c. We will also look at how to find features of the parabola, such as the x- and y-intercepts, the axis of symmetry, the vertex and the maximum or minimum value of y.
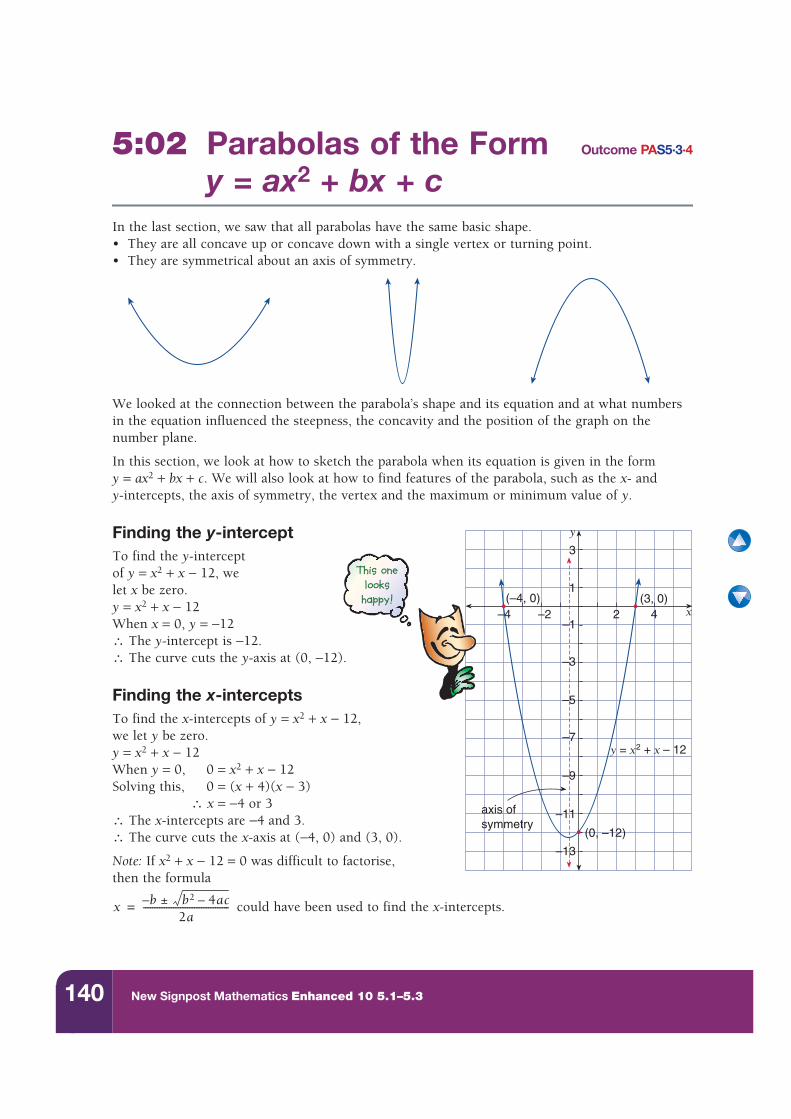
Finding the y-interceptTo find the y-interceptof y = x2 + x − 12, we let x be zero.y = x2 + x − 12When x = 0, y = −12∴ The y-intercept is −12.∴ The curve cuts the y-axis at (0, −12).
Finding the x-interceptsTo find the x-intercepts of y = x2 + x − 12,we let y be zero.y = x2 + x − 12When y = 0, 0 = x2 + x − 12Solving this, 0 = (x + 4)(x − 3)
∴ x = −4 or 3∴ The x-intercepts are −4 and 3.∴ The curve cuts the x-axis at (−4, 0) and (3, 0).
Note: If x2 + x − 12 = 0 was difficult to factorise,then the formula
could have been used to find the x-intercepts.
y
–4 –2 2 4 x(–4, 0) (3, 0)
(0, –12)
y = x2 + x – 12
axis ofsymmetry
1
3
–1
–9
–11
–3
–5
–7
–13
This one
looks
happy!
x b– ± b2 4ac–2a
-------------------------------------=
141Chapter 5 Number Plane Graphs and Coordinate Geometry
Finding the axis of symmetrySince the parabola y = x2 + x − 12 has a verticalaxis of symmetry, the axis of symmetry will cutthe x-axis half-way between (−4, 0) and (3, 0),which are the two x-intercepts. The axis of
symmetry will have the equation ,
ie x = − is the axis of symmetry.
For the parabola y = x2 + x − 12,a = 1, b = 1, c = −12.∴ The axis of symmetry is
x =
ie x = −
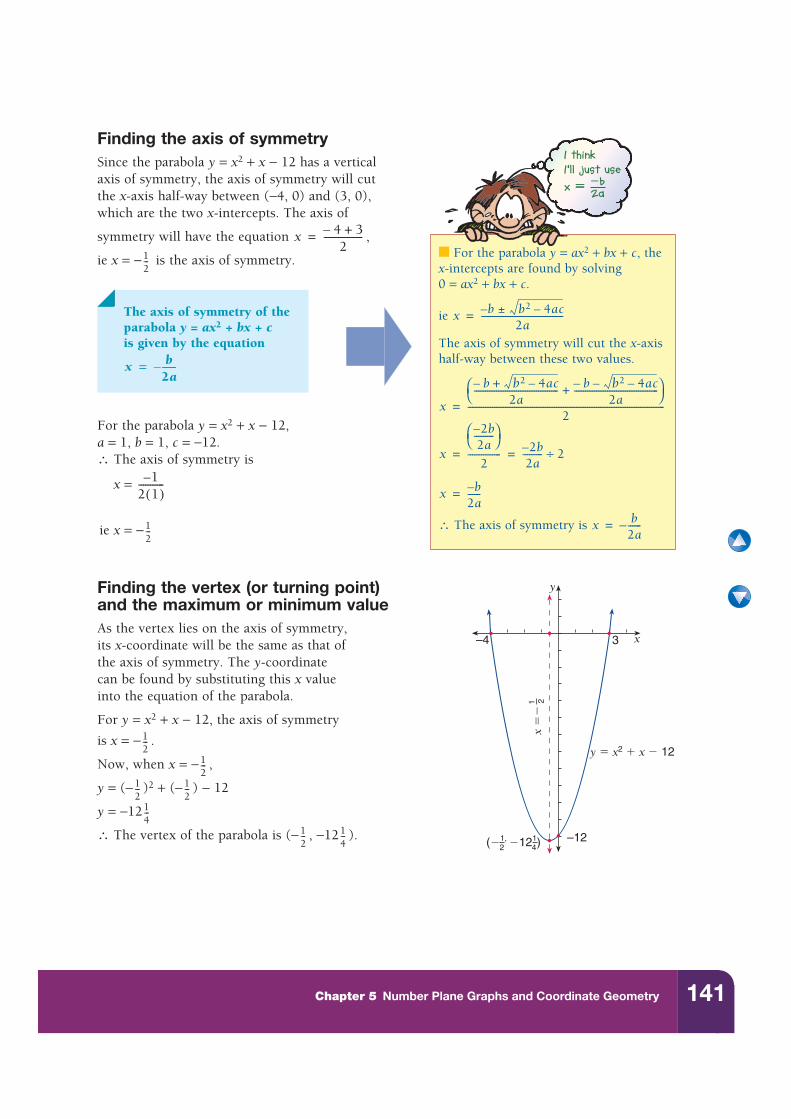
Finding the vertex (or turning point)and the maximum or minimum valueAs the vertex lies on the axis of symmetry,its x-coordinate will be the same as that ofthe axis of symmetry. The y-coordinatecan be found by substituting this x valueinto the equation of the parabola.
For y = x2 + x − 12, the axis of symmetry
is x = − .
Now, when x = − ,
y = (− )2 + (− ) − 12
y = −12
∴ The vertex of the parabola is (− , −12 ).
■ For the parabola y = ax2 + bx + c, thex-intercepts are found by solving0 = ax2 + bx + c.
ie
The axis of symmetry will cut the x-axis half-way between these two values.
∴ The axis of symmetry is
x b– ± b2 4ac–2a
-------------------------------------=
x
b– b2 4ac–+2a
-------------------------------------- b– b2 4ac––2a
--------------------------------------+⎝ ⎠⎛ ⎞
2-----------------------------------------------------------------------------------------=
x
2b–2a
---------⎝ ⎠⎛ ⎞
2--------------- 2b–
2a--------- 2÷= =
x b–2a------=
x b2a------–=
I think
I‘ll just use
x �� �b
2a
x 4– 3+2
-----------------=12---
The axis of symmetry of theparabola y = ax2 + bx + cis given by the equation
x b2a------–=
1–2 1( )-----------
12---
y
–4 3 x
–12
y � x2 � x � 12
x ��
1 2
(�1, �121)2 4
12---
12---
12--- 1
2---
14---
12--- 1
4---
142 New Signpost Mathematics Enhanced 10 5.1–5.3
The minimum or maximum value of y will occur at the vertex. The parabola will have:• a minimum value of y if the parabola is concave up (when the coefficient of x2 is positive,
eg y = 2x2)• a maximum value of y if the parabola is concave down (when the coefficient of x2 is negative,
eg y = −2x2)
Hence, on the parabola y = x2 + x − 12, the minimum value of y is −12 when x = − .
The method of completing the square can also be used to find the minimum or maximum value and the vertex as shown below.
y = x2 + x − 12
y = (x2 + x + ) − − 12
y = (x + )2 − 12
As (x + )2 is always greater than or equal to 0, the minimum value of y will be −12 when
x = − and the vertex is the point (− , −12 ).
Worked examplesFor each equation, find:
a the y-intercept b the x-intercept
c the axis of symmetry d the vertex (turning point)
Use these results to sketch each graph.
1 y = x2 + 2x − 3 2 y = 2x2 + 4x + 3 3 y = 4x − x2
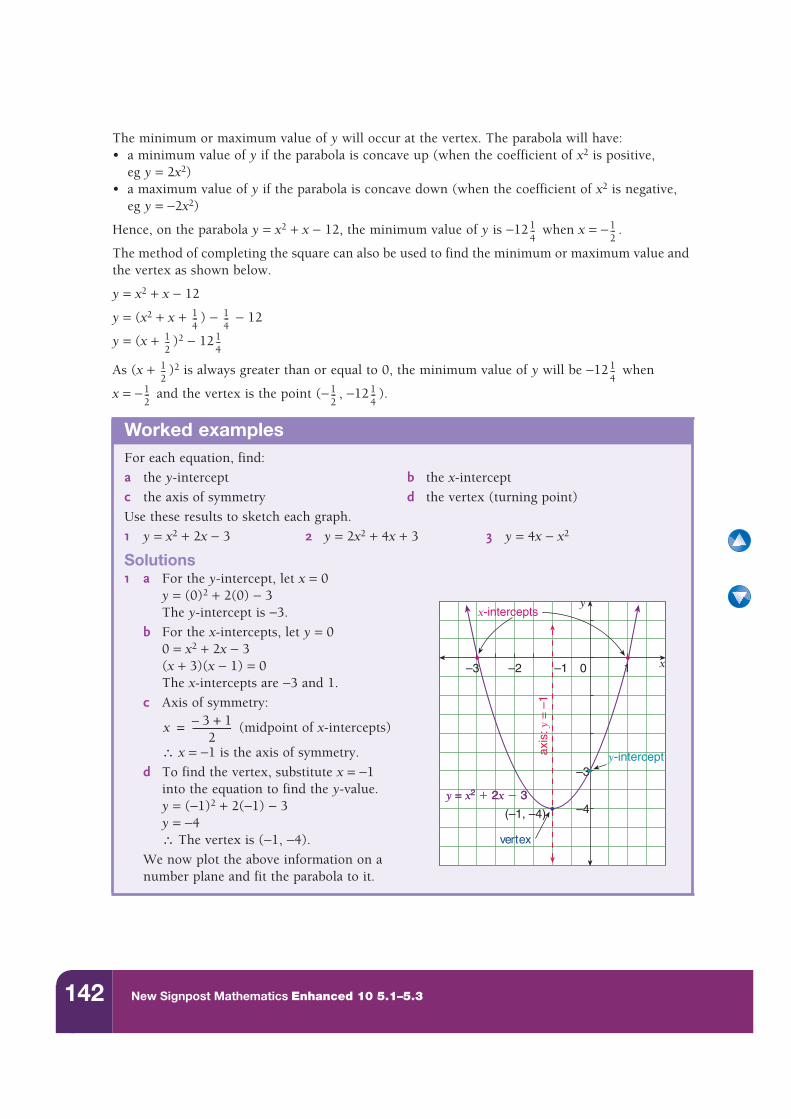
Solutions1 a For the y-intercept, let x = 0
y = (0)2 + 2(0) − 3The y-intercept is −3.
b For the x-intercepts, let y = 00 = x2 + 2x − 3(x + 3)(x − 1) = 0The x-intercepts are −3 and 1.
c Axis of symmetry:
(midpoint of x-intercepts)
∴ x = −1 is the axis of symmetry.
d To find the vertex, substitute x = −1into the equation to find the y-value.y = (−1)2 + 2(−1) − 3y = −4∴ The vertex is (−1, −4).
We now plot the above information on anumber plane and fit the parabola to it.
14--- 1
2---
14--- 1
4---
12--- 1
4---
12--- 1
4---
12--- 1
2--- 1
4---
y
–2 –1 1 x
(–1, –4) –4
–3
–3
vertex
x-intercepts
y-interceptaxis
: y =
–1
0
y = x2 � 2x � 3y = x2 � 2x � 3
x 3– 1+2
-----------------=
143Chapter 5 Number Plane Graphs and Coordinate Geometry
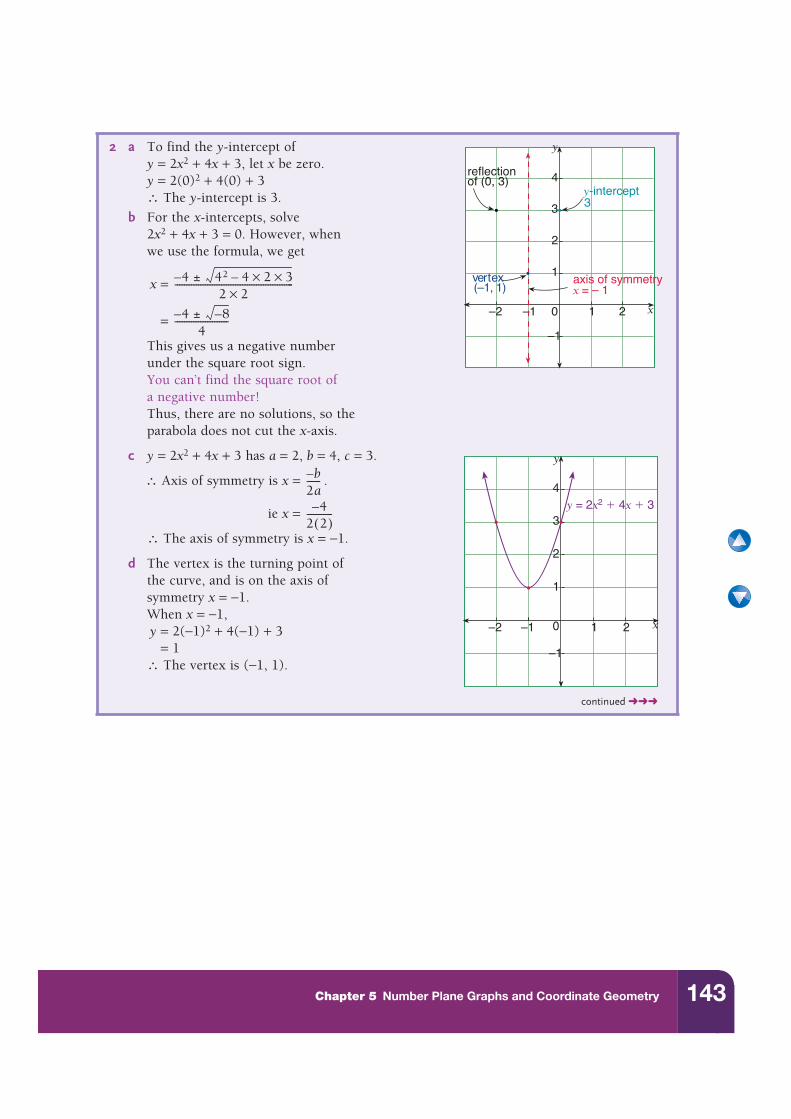
2 a To find the y-intercept ofy = 2x2 + 4x + 3, let x be zero.y = 2(0)2 + 4(0) + 3∴ The y-intercept is 3.
b For the x-intercepts, solve2x2 + 4x + 3 = 0. However, whenwe use the formula, we get
x =
=
This gives us a negative numberunder the square root sign.You can’t find the square root ofa negative number!Thus, there are no solutions, so theparabola does not cut the x-axis.
c y = 2x2 + 4x + 3 has a = 2, b = 4, c = 3.
∴ Axis of symmetry is x = .
ie x =
∴ The axis of symmetry is x = −1.
d The vertex is the turning point ofthe curve, and is on the axis ofsymmetry x = −1.When x = −1,y = 2(−1)2 + 4(−1) + 3
= 1∴ The vertex is (−1, 1).
y
–1 2 x
4
–2 0
3
2
1
1
–1
3
reflectionof (0, 3)
(–1, 1)vertex
y-intercept
axis of symmetryx = – 1
y
–1 2 x
4
–2 0
3
2
1
1
–1
y = 2x2 � 4x � 3
4– ± 42 4 2 3××–2 2×
---------------------------------------------------
4– ± 8–4
-----------------------
b–2a------
4–2 2( )-----------
continued ➜➜➜
144 New Signpost Mathematics Enhanced 10 5.1–5.3
For each of the graphs, find: ai the y-interceptii the x-interceptsiii the equation of the axis of
symmetryiv the coordinates of the vertex
b c
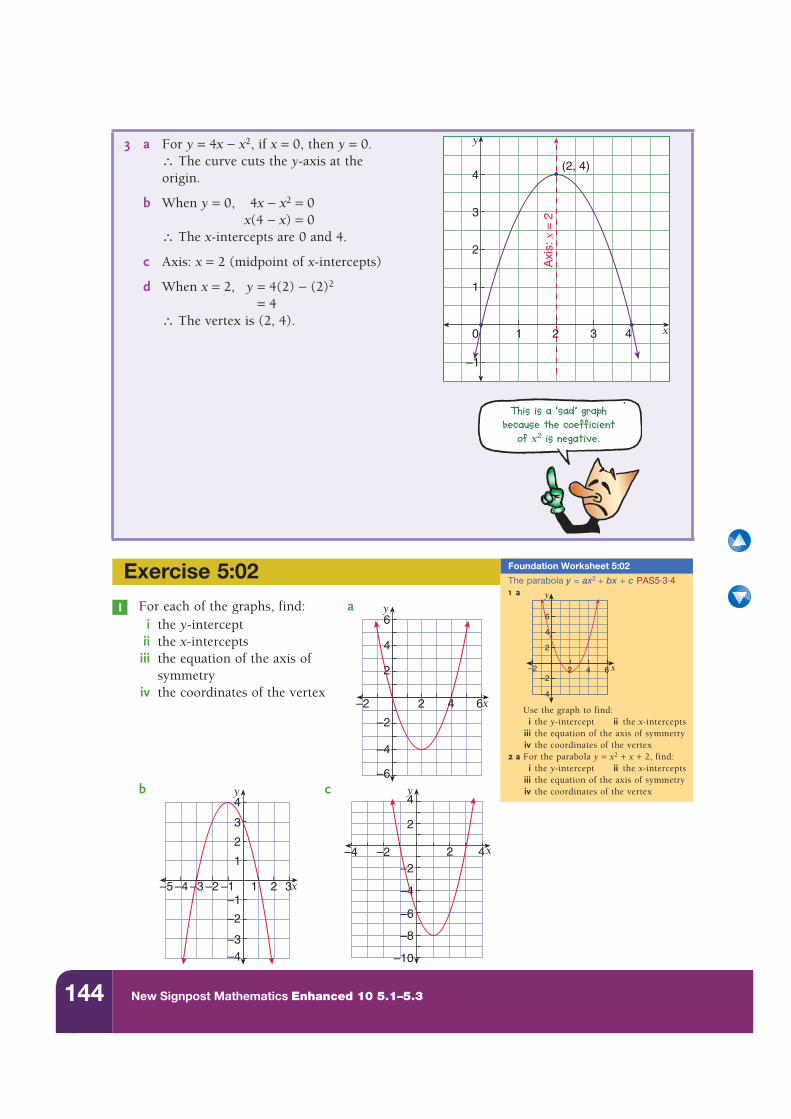
3 a For y = 4x − x2, if x = 0, then y = 0.∴ The curve cuts the y-axis at the origin.
b When y = 0, 4x − x2 = 0x(4 − x) = 0
∴ The x-intercepts are 0 and 4.
c Axis: x = 2 (midpoint of x-intercepts)
d When x = 2, y = 4(2) − (2)2
= 4∴ The vertex is (2, 4).
This is a ‘sad’ graph
because the coefficient
of x2 is negative.
y
x
4
3
2
1
–1
0 1 2 3 4
(2, 4)
Axi
s: x
= 2
Exercise 5:02 The parabola y = ax2 + bx + c PAS5·3·41 a
Use the graph to find:i the y-intercept ii the x-intercepts
iii the equation of the axis of symmetryiv the coordinates of the vertex
2 a For the parabola y = x2 + x + 2, find:i the y-intercept ii the x-intercepts
iii the equation of the axis of symmetryiv the coordinates of the vertex
y
x–2–2
–4
2
2
4
6
4 6
Foundation Worksheet 5:02
1
–2
2
4
6
–4
–6
y
x–2 4 62
3
2
4y
x–5 –4 –3 –2 –1 1 2 3
–2
–1
1
–3–4
–2
2
4
–4
–6
–8
–10
y
x–4 –2 42
145Chapter 5 Number Plane Graphs and Coordinate Geometry
Find the y-intercepts of the following parabolas.a y = x2 − 6x + 5 b y = 2x2 − 8 c y = (x − 2)(x + 3)
Find the x-intercepts of the following parabolas.a y = x2 − 2x − 8 b y = 3x2 + 10x − 8 c y = (x − 3)(4x + 7)
Find the equation of the axis of symmetry and the coordinates of the vertex of the following parabolas.a y = (x − 3)(x − 5) b y = 3(x − 2)(x + 6) c y = − (x + 4)(2 − x)
d y = x2 − 6x + 7 e y = 3x2 − 9x + 14 f y = 4 − 3x − x2
Find the minimum value of y on the following parabolas.a y = x2 − 6x − 2 b y = 4x2 − 4x + 6 c y = 9x2 − 30x + 18
Find the maximum value of y on the following parabolas.a y = 1 − 2x − x2 b y = −4x2 + 20x − 27 c y = 7 − 12x − 9x2
For the parabola y = x2 + 2x − 8, find:a the y-interceptb the x-interceptsc the axis of symmetryd the vertexe hence, sketch its graph
Repeat the steps in question 7 to graph the following equations, showing all the relevant features.a y = x2 − 6x + 5 b y = x2 − 6xc y = 2x2 − 8x − 10 d y = −x2 + 4x − 3e y = −x2 + 6x − 9 f y = 2x2 + 4x + 2g y = x2 − 3x − 4 h y = 2x2 − 3x − 2i y = −2x2 − 3x − 1
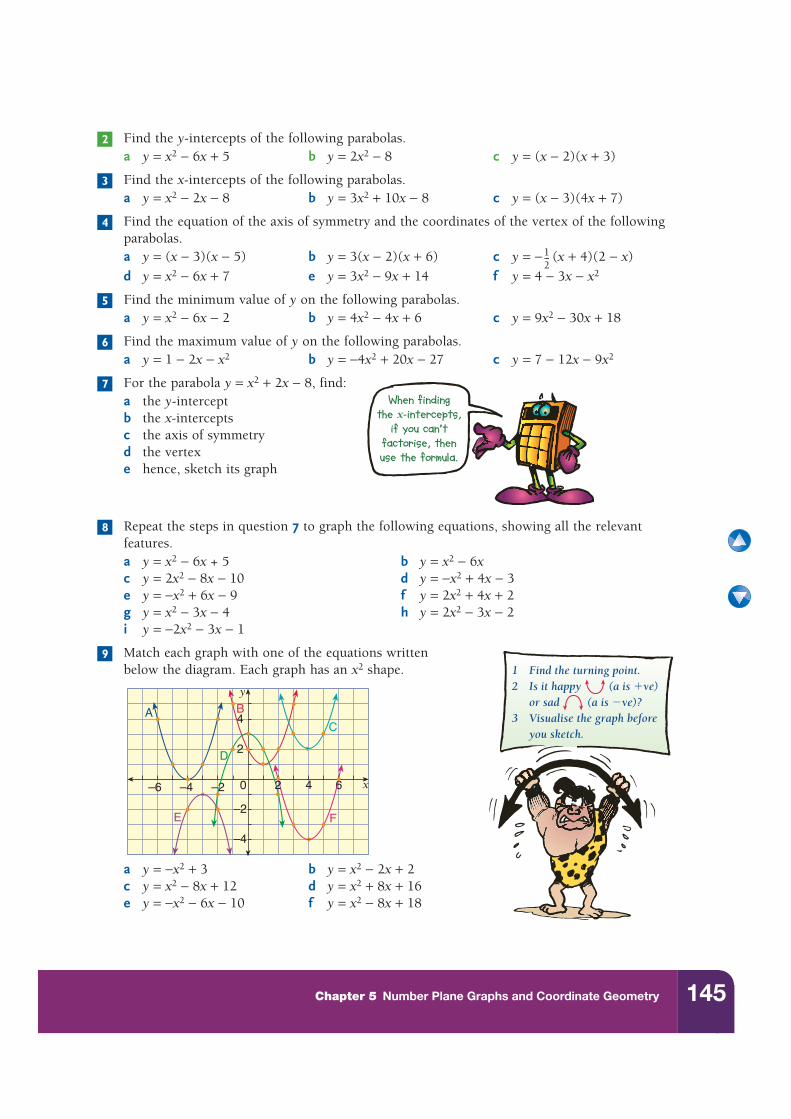
Match each graph with one of the equations writtenbelow the diagram. Each graph has an x2 shape.
a y = −x2 + 3 b y = x2 − 2x + 2c y = x2 − 8x + 12 d y = x2 + 8x + 16e y = −x2 − 6x − 10 f y = x2 − 8x + 18
2
3
4
12---
5
6
When finding
the x-intercepts,if you can’t
factorise, then
use the formula.
7
8
1 Find the turning point.2 Is it happy (a is �ve) or sad (a is �ve)?3 Visualise the graph before you sketch.
9
y
x
2
–2
–2
4
–4 0 4–6 6
–4
A B
C
FE
D
2
146 New Signpost Mathematics Enhanced 10 5.1–5.3
Sketch each set of three parabolas on the same number plane.a i y = x2 − 4 ii y = x2 − 4x iii y = x2 − 4x + 4b i y = 9 − x2 ii y = 9x − x2 iii y = 10 + 9x − x2
c i y = (x − 3)(x + 5) ii y = 2(x − 3)(x + 5) iii y = (3 − x)(5 + x)d i y = x2 − 2x − 8 ii y = 2x2 − 4x − 16 iii y = 8 + 2x − x2
Sketch the graph of each quadratic relationship, showing all relevant features.a y = 2x2 − 8 b y = 16 − x2 c y = (x + 2)(x − 6)d y = x2 + 4x + 3 e y = x2 − 8x + 7 f y = x2 − 5xg y = (3 − x)(7 + x) h y = 24 − 2x − x2 i y = 4x2 + 16x + 7j y = 2x2 + 9x − 5 k y = 4x2 − 36x + 56 l y = 2x2 − 5x − 7
a Sketch the graphs of y = x2 + 3x and y = 2x2 + 6x. Compare the two graphs and describe the difference between them.
b Sketch the graphs of y = (x − 3)(x + 2) and y = 3(x − 3)(x + 2). Compare the two graphs and describe the difference between them.
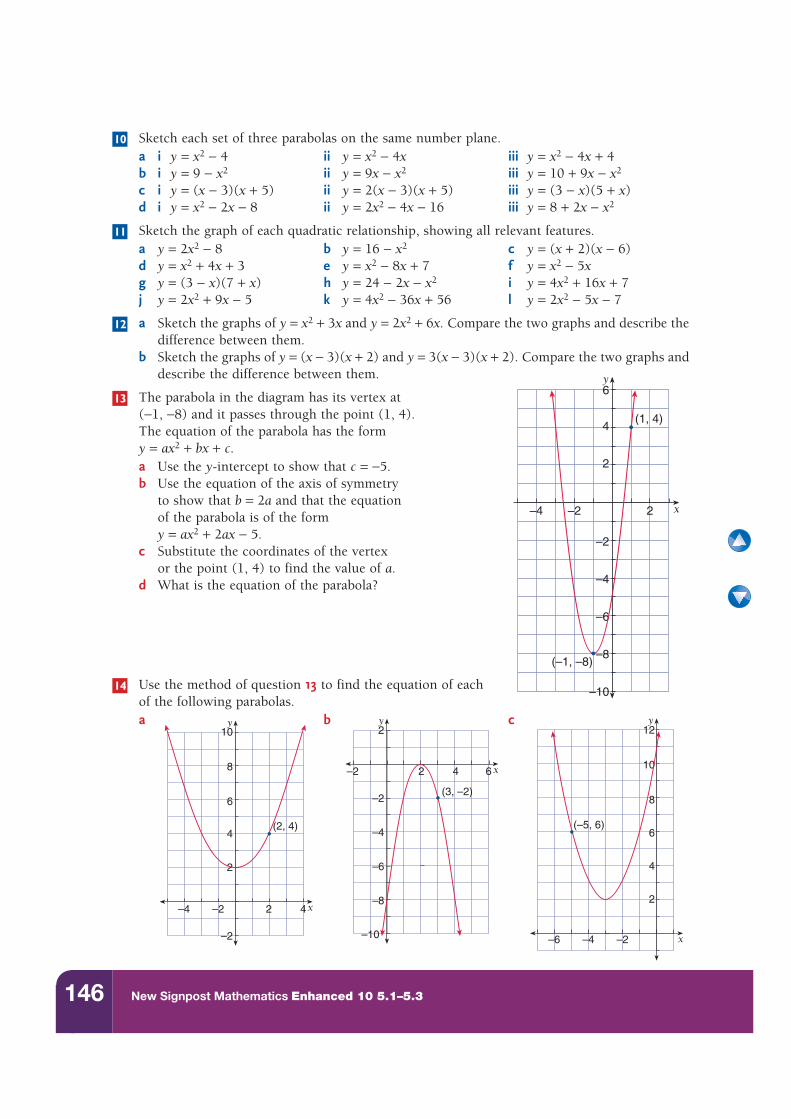
The parabola in the diagram has its vertex at(−1, −8) and it passes through the point (1, 4).The equation of the parabola has the formy = ax2 + bx + c.a Use the y-intercept to show that c = −5.b Use the equation of the axis of symmetry
to show that b = 2a and that the equationof the parabola is of the formy = ax2 + 2ax − 5.
c Substitute the coordinates of the vertexor the point (1, 4) to find the value of a.
d What is the equation of the parabola?
Use the method of question 13 to find the equation of eachof the following parabolas.a b c
10
11
12
x
y
2
4
6
–2
–4
–6
–8
–10
–2 2–4
(1, 4)
(–1, –8)
13
14
x
y
2
4
6
8
10
–2
–2 2 4–4
(2, 4)
x
y2
–2
–4
–6
–8
–10
–2 2 4 6
(3, –2)
x
y
2
4
6
8
10
12
–2–4–6
(–5, 6)
147Chapter 5 Number Plane Graphs and Coordinate Geometry
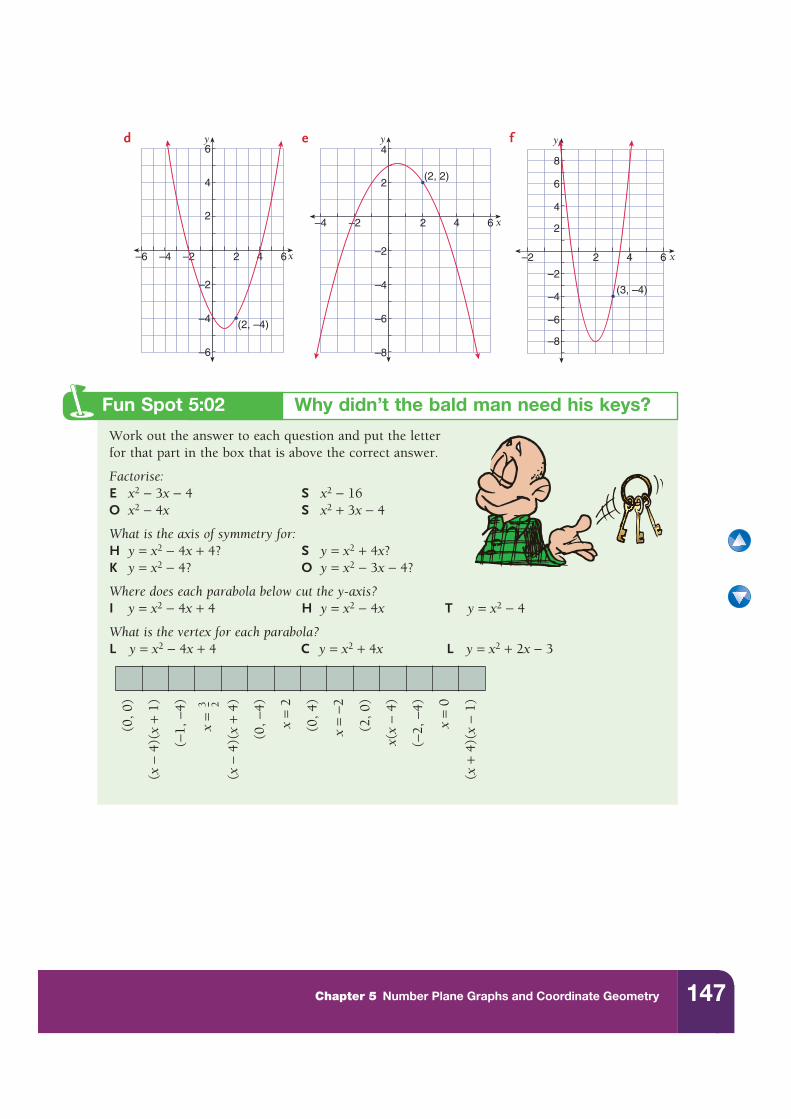
d e f
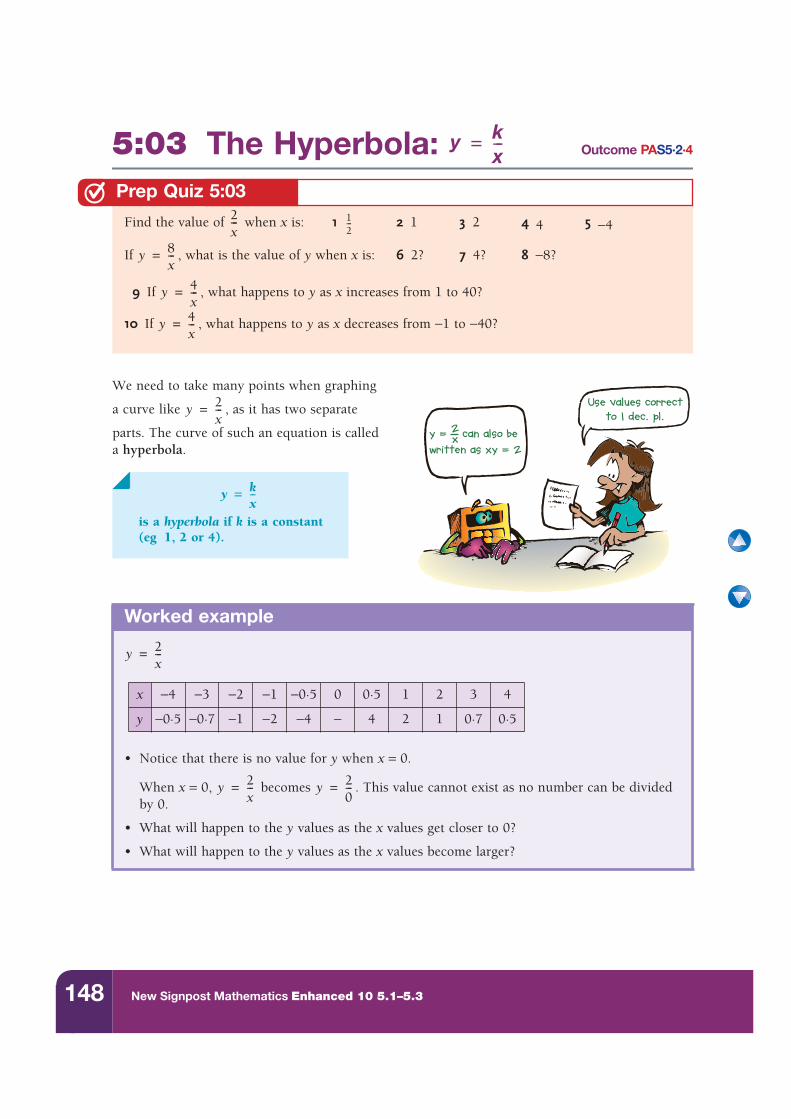
Work out the answer to each question and put the letter for that part in the box that is above the correct answer.
Factorise:E x2 − 3x − 4 S x2 − 16O x2 − 4x S x2 + 3x − 4
What is the axis of symmetry for:H y = x2 − 4x + 4? S y = x2 + 4x?K y = x2 − 4? O y = x2 − 3x − 4?
Where does each parabola below cut the y-axis?I y = x2 − 4x + 4 H y = x2 − 4x T y = x2 − 4
What is the vertex for each parabola?L y = x2 − 4x + 4 C y = x2 + 4x L y = x2 + 2x − 3
x
y
2
4
642
6
–2
–2
–4
–4
–6
–6
(2, –4)
x
y
2
4
642–2
–2
–4
–4
–6
–8
(2, 2)
x
y
2
4
6
8
642–2
–2
–4
–6
–8
(3, –4)
Fun Spot 5:02 Why didn’t the bald man need his keys?
(0,
0)
(x −
4)(
x +
1)
(−1,
−4)
x =
(x −
4)(
x +
4)
(0,
−4)
x =
2
(0,
4)
x =
−2
(2,
0)
x(x
− 4)
(−2,
−4)
x =
0
(x +
4)(
x −
1)3 2---
148 New Signpost Mathematics Enhanced 10 5.1–5.3
5:03 The Hyperbola: Outcome PAS5·2·4
We need to take many points when graphing
a curve like , as it has two separate
parts. The curve of such an equation is calleda hyperbola.
Find the value of when x is: 1 2 1 3 2 4 4 5 −4
If , what is the value of y when x is: 6 2? 7 4? 8 −8?
9 If , what happens to y as x increases from 1 to 40?
10 If , what happens to y as x decreases from −1 to −40?
Worked example
• Notice that there is no value for y when x = 0.
When x = 0, becomes . This value cannot exist as no number can be divided by 0.
• What will happen to the y values as the x values get closer to 0?
• What will happen to the y values as the x values become larger?
y kx---=
Prep Quiz 5:032x--- 1
2---
y 8x---=
y 4x---=
y 4x---=
y = 2x can also be
written as xy = 2
Use values correct
to 1 dec. pl.y 2
x---=
is a hyperbola if k is a constant(eg 1, 2 or 4).
y kx--=
y 2x---=
x −4 −3 −2 −1 −0·5 0 0·5 1 2 3 4
y −0·5 −0·7 −1 −2 −4 − 4 2 1 0·7 0·5
y 2x---= y 2
0---=
149Chapter 5 Number Plane Graphs and Coordinate Geometry
Use your calculator to complete the tables below, giving values for y correct to two decimal places.
a b
c d
Complete the table below for .
Use a sheet of graph paper to graph the curve ,using your table. Use values −8 to 8 on both axes.
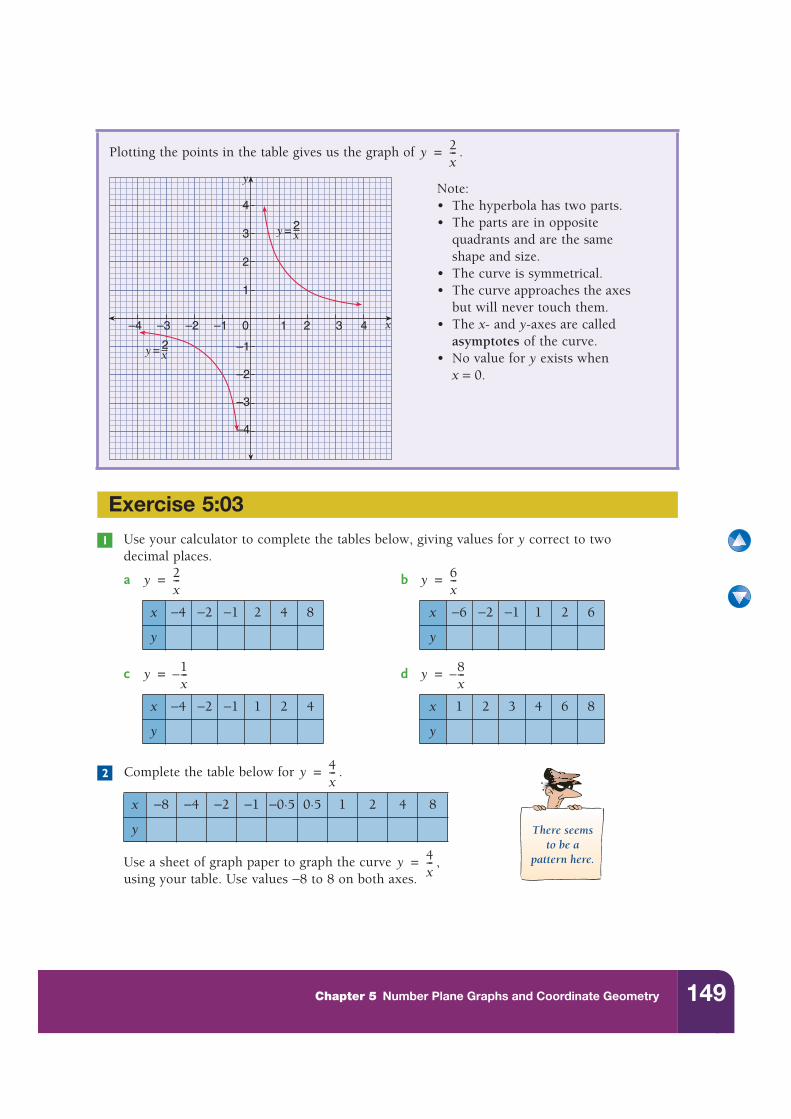
Plotting the points in the table gives us the graph of .
x −4 −2 −1 2 4 8 x −6 −2 −1 1 2 6
y y
x −4 −2 −1 1 2 4 x 1 2 3 4 6 8
y y
x −8 −4 −2 −1 −0·5 0·5 1 2 4 8
y
y 2x---=
y
x–4 –3 –2 –1 0 1 2 3 4
1
2
3
4
–1
–2
–3
–4
y = 2x
y = 2x
Note:• The hyperbola has two parts.• The parts are in opposite
quadrants and are the same shape and size.
• The curve is symmetrical.• The curve approaches the axes
but will never touch them.• The x- and y-axes are called
asymptotes of the curve.• No value for y exists when
x = 0.
Exercise 5:03
1
y 2x---= y 6
x---=
y 1x---–= y 8
x---–=
There seemsto be a
pattern here.
2 y 4x---=
y 4x---=
150 New Signpost Mathematics Enhanced 10 5.1–5.3
Graph the curve by first completing the table below.
What does a negative value of k do to the graph?
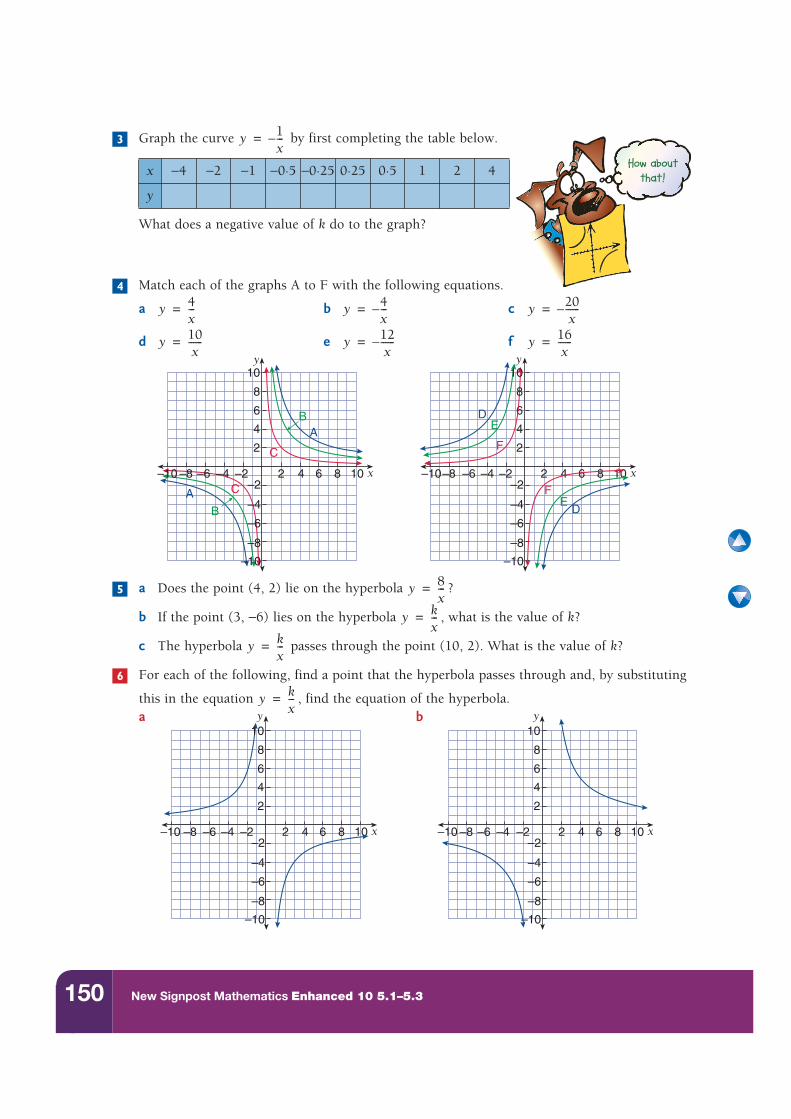
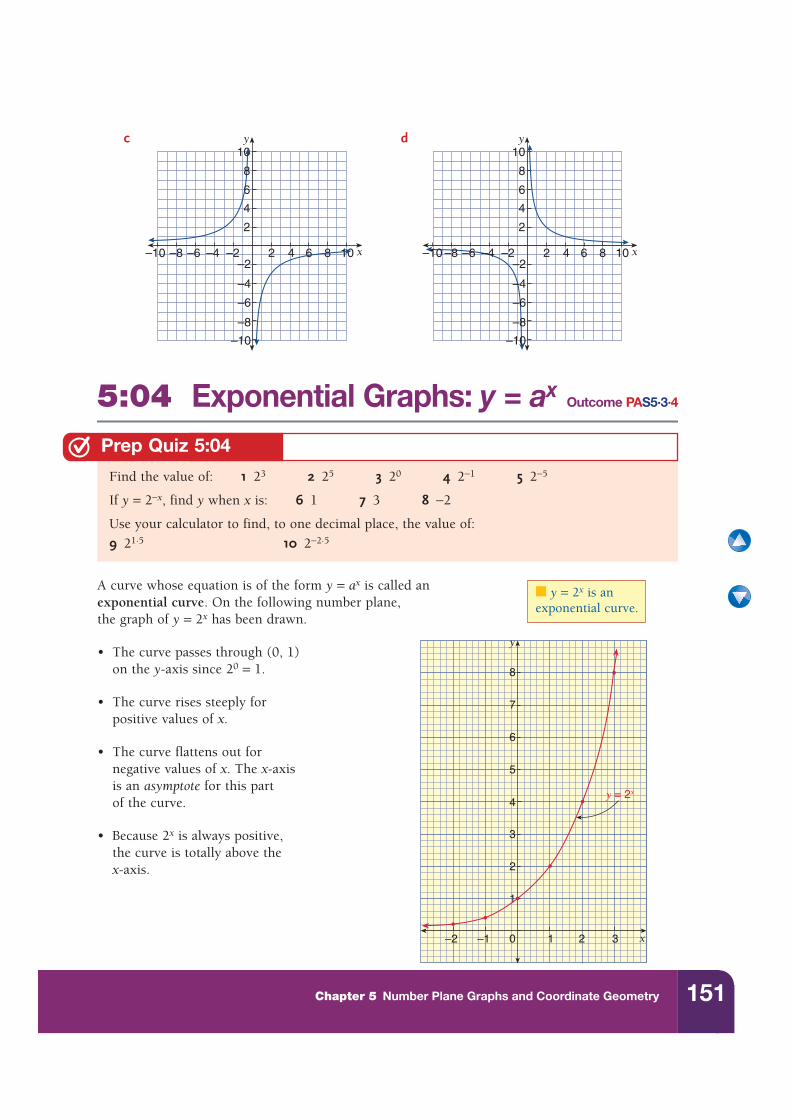
Match each of the graphs A to F with the following equations.
a b c
d e f
a Does the point (4, 2) lie on the hyperbola ?
b If the point (3, −6) lies on the hyperbola , what is the value of k?
c The hyperbola passes through the point (10, 2). What is the value of k?
For each of the following, find a point that the hyperbola passes through and, by substituting
this in the equation , find the equation of the hyperbola.a b
x −4 −2 −1 −0·5 −0·25 0·25 0·5 1 2 4
y
How about
that!
3 y 1x---–=
4
y 4x---= y 4
x---–= y 20
x------–=
y 10x
------= y 12x
------–= y 16x
------=
6
4
2
2 4 6 8 10 x
y
A
A
B
B
C
C
8
10
–2
–6
–8
–10
–2–4–6–8–10
–4
6
4
2
2 4 6 8 10 x
y
D
D
E
E
F
F
8
10
–2
–6
–8
–10
–2–4–6–8–10
–4
5 y 8x---=
y kx---=
y kx---=
6
y kx---=
6
4
2
2 4 6 8 10 x
y
8
10
–2
–6
–8
–10
–2–4–6–8–10
–4
6
4
2
2 4 6 8 10 x
y
8
10
–2
–6
–8
–10
–2–4–6–8–10
–4
151Chapter 5 Number Plane Graphs and Coordinate Geometry
c d
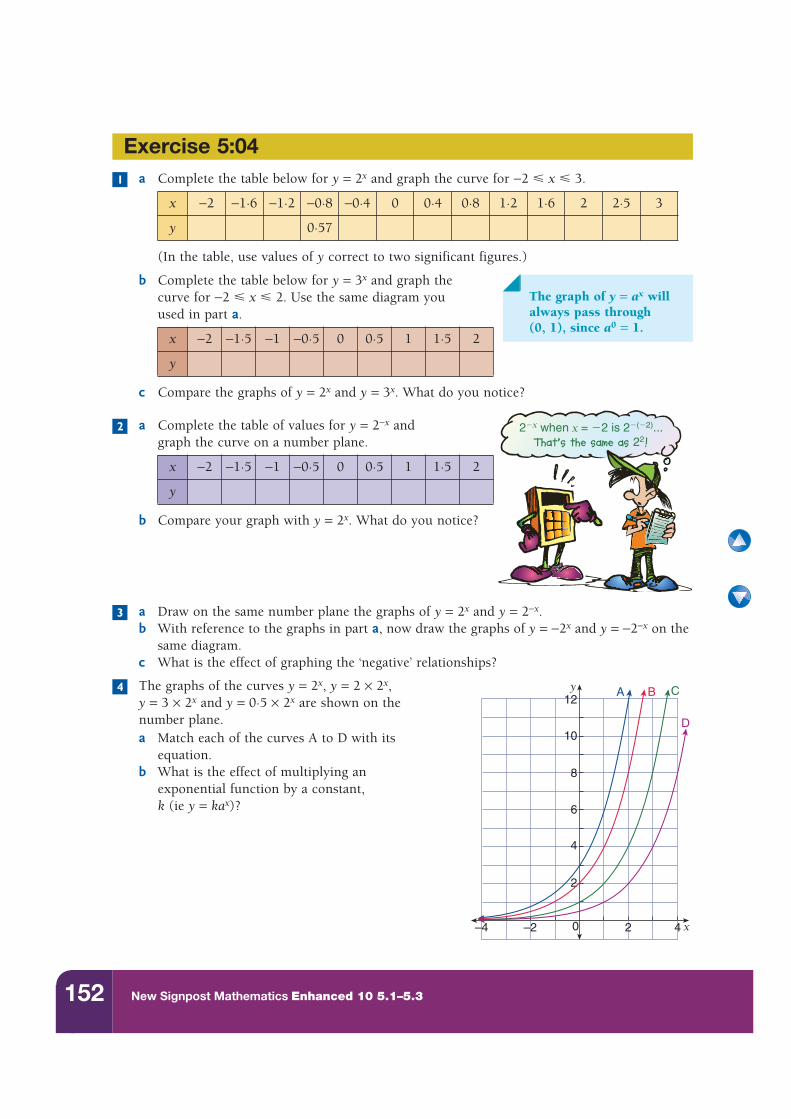
5:04 Exponential Graphs: y = ax Outcome PAS5·3·4
A curve whose equation is of the form y = ax is called anexponential curve. On the following number plane,the graph of y = 2x has been drawn.
• The curve passes through (0, 1)on the y-axis since 20 = 1.
• The curve rises steeply forpositive values of x.
• The curve flattens out fornegative values of x. The x-axisis an asymptote for this partof the curve.
• Because 2x is always positive,the curve is totally above thex-axis.
Find the value of: 1 23 2 25 3 20 4 2−1 5 2−5
If y = 2−x, find y when x is: 6 1 7 3 8 −2
Use your calculator to find, to one decimal place, the value of:
9 21·5 10 2−2·5
6
4
2
2 4 6 8 10 x
y
8
10
–2
–6
–8
–10
–2–4–6–8–10
–4
6
4
2
2 4 6 8 10 x
y
8
10
–2
–6
–8
–10
–2–4–6–8–10
–4
Prep Quiz 5:04
■ y = 2x is an exponential curve.
8
7
6
5
3
2
1
0 1–1–2 3 x2
4
y
y = 2x
152 New Signpost Mathematics Enhanced 10 5.1–5.3
a Complete the table below for y = 2x and graph the curve for −2 � x � 3.
(In the table, use values of y correct to two significant figures.)
b Complete the table below for y = 3x and graph the curve for −2 � x � 2. Use the same diagram you used in part a.
c Compare the graphs of y = 2x and y = 3x. What do you notice?
a Complete the table of values for y = 2−x andgraph the curve on a number plane.
b Compare your graph with y = 2x. What do you notice?
a Draw on the same number plane the graphs of y = 2x and y = 2−x.b With reference to the graphs in part a, now draw the graphs of y = −2x and y = −2−x on the
same diagram.c What is the effect of graphing the ‘negative’ relationships?
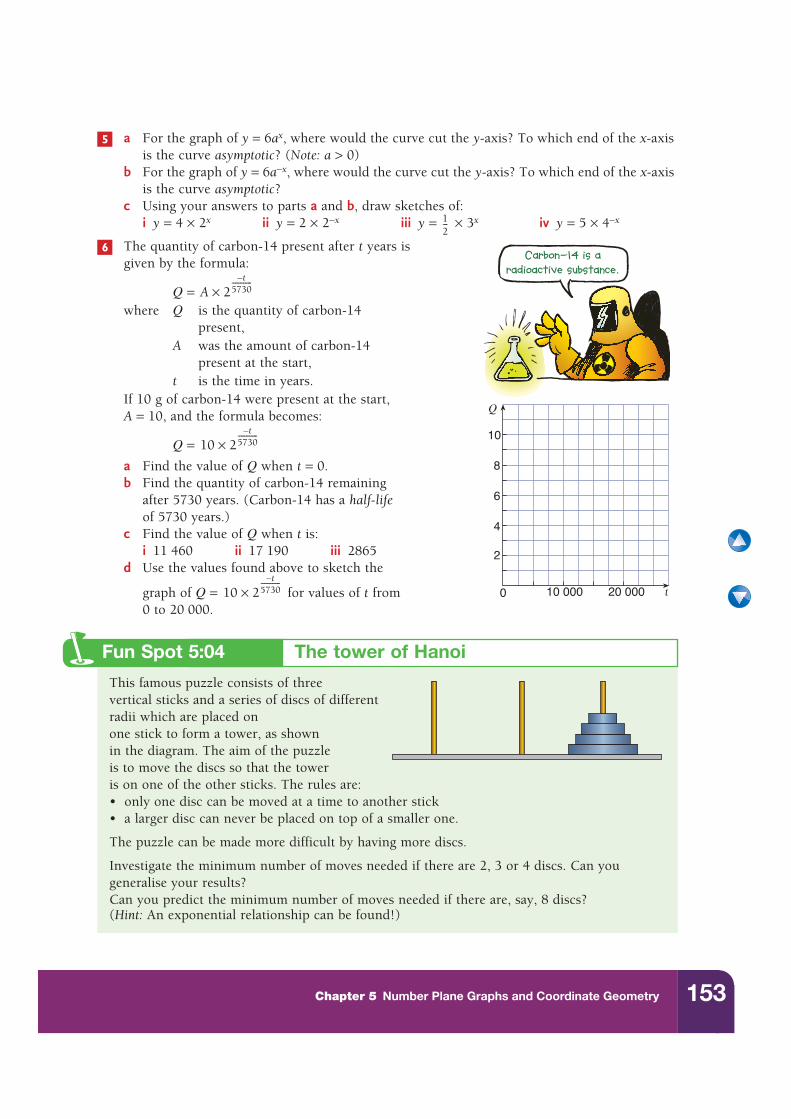
The graphs of the curves y = 2x, y = 2 × 2x, y = 3 × 2x and y = 0·5 × 2x are shown on thenumber plane.a Match each of the curves A to D with its
equation.b What is the effect of multiplying an
exponential function by a constant,k (ie y = kax)?
x −2 −1·6 −1·2 −0·8 −0·4 0 0·4 0·8 1·2 1·6 2 2·5 3
y 0·57
x −2 −1·5 −1 −0·5 0 0·5 1 1·5 2
y
x −2 −1·5 −1 −0·5 0 0·5 1 1·5 2
y
Exercise 5:041
The graph of y = ax will always pass through (0, 1), since a0 = 1.
2�x when x = �2 is 2�(�2)...That’s the same as 22!
2
3
2
0–2–4 2 4 x
y
4
6
8
10
12A B C
D
4
153Chapter 5 Number Plane Graphs and Coordinate Geometry
a For the graph of y = 6ax, where would the curve cut the y-axis? To which end of the x-axis is the curve asymptotic? (Note: a > 0)
b For the graph of y = 6a−x, where would the curve cut the y-axis? To which end of the x-axis is the curve asymptotic?
c Using your answers to parts a and b, draw sketches of:i y = 4 × 2x ii y = 2 × 2−x iii y = × 3x iv y = 5 × 4−x
The quantity of carbon-14 present after t years isgiven by the formula:
Q = where Q is the quantity of carbon-14
present,A was the amount of carbon-14
present at the start,t is the time in years.
If 10 g of carbon-14 were present at the start,A = 10, and the formula becomes:
Q =
a Find the value of Q when t = 0.b Find the quantity of carbon-14 remaining
after 5730 years. (Carbon-14 has a half-lifeof 5730 years.)
c Find the value of Q when t is:i 11 460 ii 17 190 iii 2865
d Use the values found above to sketch the
graph of Q = for values of t from0 to 20 000.
This famous puzzle consists of three vertical sticks and a series of discs of different radii which are placed on one stick to form a tower, as shown in the diagram. The aim of the puzzle is to move the discs so that the tower is on one of the other sticks. The rules are:• only one disc can be moved at a time to another stick• a larger disc can never be placed on top of a smaller one.
The puzzle can be made more difficult by having more discs.
Investigate the minimum number of moves needed if there are 2, 3 or 4 discs. Can you generalise your results?Can you predict the minimum number of moves needed if there are, say, 8 discs?(Hint: An exponential relationship can be found!)
5
12---
Carbon-14 is a
radioactive substance.
0
Q
t
2
4
6
8
10
10 000 20 000
6
A 2t–
5730------------
×
10 2t–
5730------------
×
10 2t–
5730------------
×
Fun Spot 5:04 The tower of Hanoi
154 New Signpost Mathematics Enhanced 10 5.1–5.3
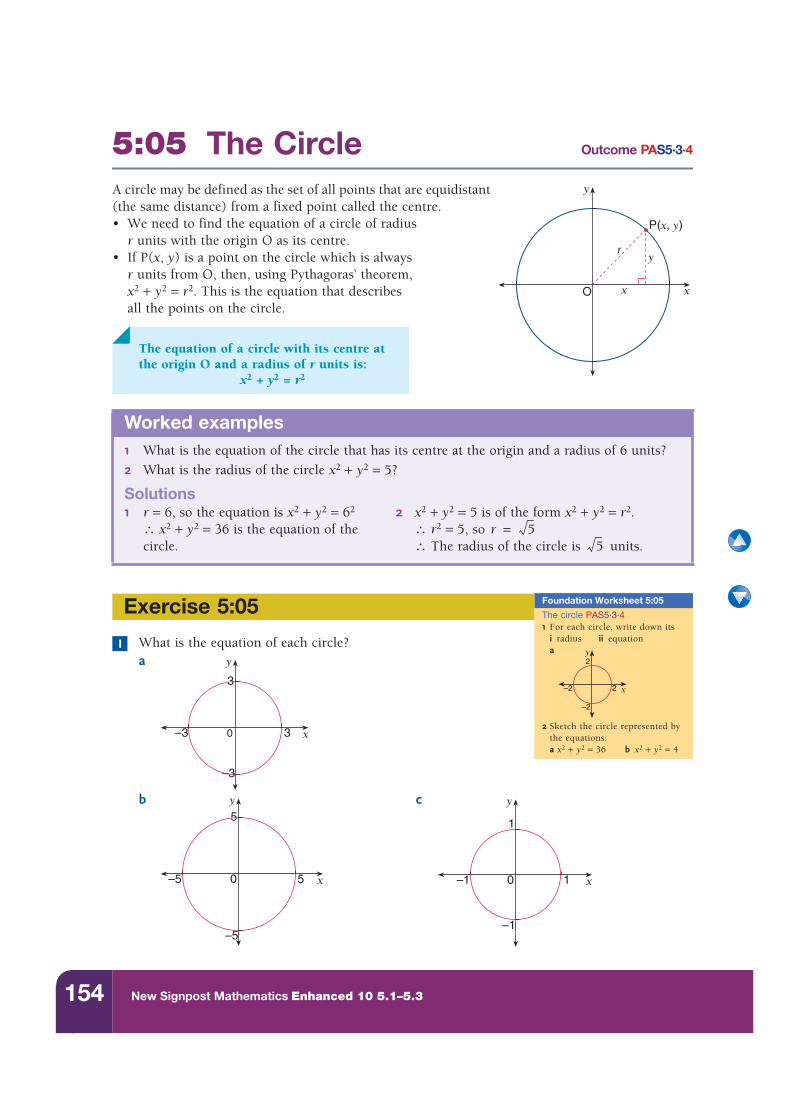
5:05 The Circle Outcome PAS5·3·4
A circle may be defined as the set of all points that are equidistant (the same distance) from a fixed point called the centre.• We need to find the equation of a circle of radius
r units with the origin O as its centre.• If P(x, y) is a point on the circle which is always
r units from O, then, using Pythagoras’ theorem,x2 + y2 = r2. This is the equation that describesall the points on the circle.
What is the equation of each circle?a
b c
Worked examples1 What is the equation of the circle that has its centre at the origin and a radius of 6 units?
2 What is the radius of the circle x2 + y2 = 5?
Solutions1 r = 6, so the equation is x2 + y2 = 62 2 x2 + y2 = 5 is of the form x2 + y2 = r2.
∴ x2 + y2 = 36 is the equation of the ∴ r2 = 5, so circle. ∴ The radius of the circle is units.
y
xO x
ry
P(x, y)
The equation of a circle with its centre atthe origin O and a radius of r units is:
x2 + y2 = r2
r 5=5
Exercise 5:05 The circle PAS5·3·41 For each circle, write down its
i radius ii equationa
2 Sketch the circle represented by the equations:a x2 + y2 = 36 b x2 + y2 = 4
x
y2
2
–2
–2
Foundation Worksheet 5:05
1y
x–3 3
3
–3
0
y
x–5 5
5
–5
0
y
x–1 1
1
–1
0
155Chapter 5 Number Plane Graphs and Coordinate Geometry
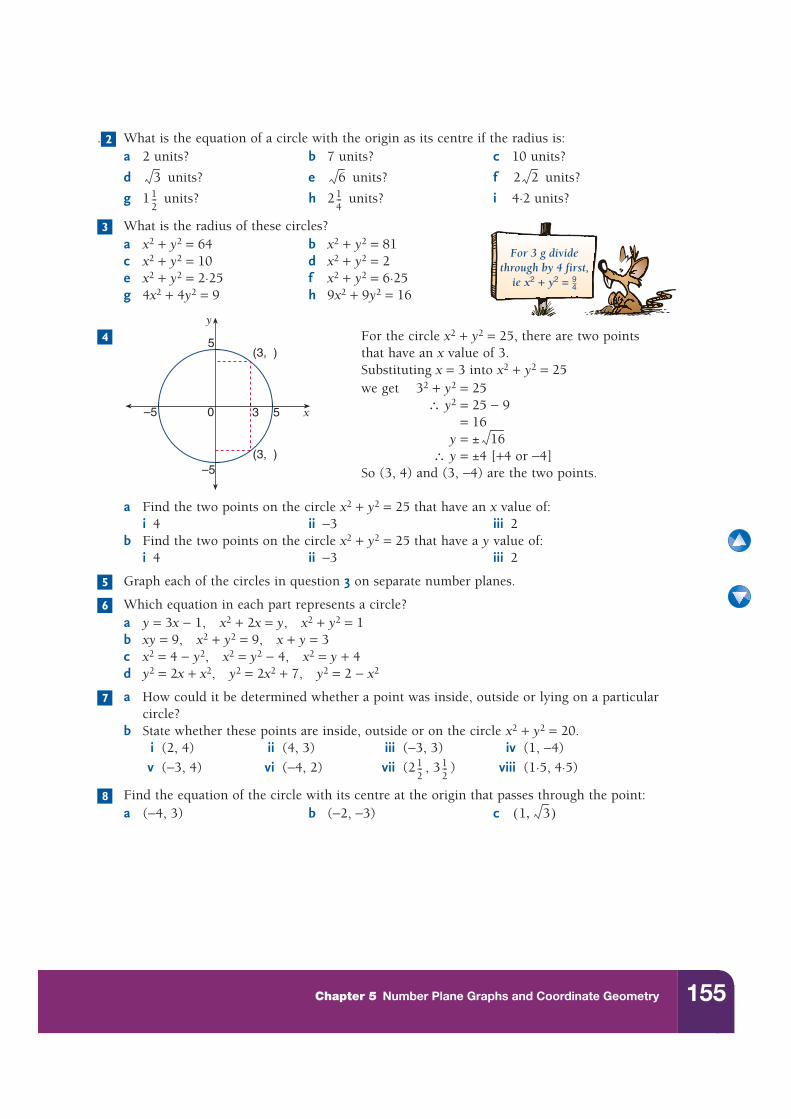
. What is the equation of a circle with the origin as its centre if the radius is:a 2 units? b 7 units? c 10 units?
d units? e units? f units?
g 1 units? h 2 units? i 4·2 units?
What is the radius of these circles?a x2 + y2 = 64 b x2 + y2 = 81c x2 + y2 = 10 d x2 + y2 = 2e x2 + y2 = 2·25 f x2 + y2 = 6·25g 4x2 + 4y2 = 9 h 9x2 + 9y2 = 16
For the circle x2 + y2 = 25, there are two pointsthat have an x value of 3.Substituting x = 3 into x2 + y2 = 25we get 32 + y2 = 25
∴ y2 = 25 − 9= 16
y = ±∴ y = ±4 [+4 or −4]
So (3, 4) and (3, −4) are the two points.
a Find the two points on the circle x2 + y2 = 25 that have an x value of:i 4 ii −3 iii 2
b Find the two points on the circle x2 + y2 = 25 that have a y value of:i 4 ii −3 iii 2
Graph each of the circles in question 3 on separate number planes.
Which equation in each part represents a circle?a y = 3x − 1, x2 + 2x = y, x2 + y2 = 1b xy = 9, x2 + y2 = 9, x + y = 3c x2 = 4 − y2, x2 = y2 − 4, x2 = y + 4d y2 = 2x + x2, y2 = 2x2 + 7, y2 = 2 − x2
a How could it be determined whether a point was inside, outside or lying on a particular circle?
b State whether these points are inside, outside or on the circle x2 + y2 = 20.i (2, 4) ii (4, 3) iii (−3, 3) iv (1, −4)
v (−3, 4) vi (−4, 2) vii (2 , 3 ) viii (1·5, 4·5)
Find the equation of the circle with its centre at the origin that passes through the point:a (−4, 3) b (−2, −3) c
2
3 6 2 212--- 1
4---
For 3 g dividethrough by 4 first,
ie x2 + y2 = 94
3
4
y
x–5 5
5
–5
0 3
(3, )
(3, )16
5
6
7
12--- 1
2---
81 3,( )
156 New Signpost Mathematics Enhanced 10 5.1–5.3
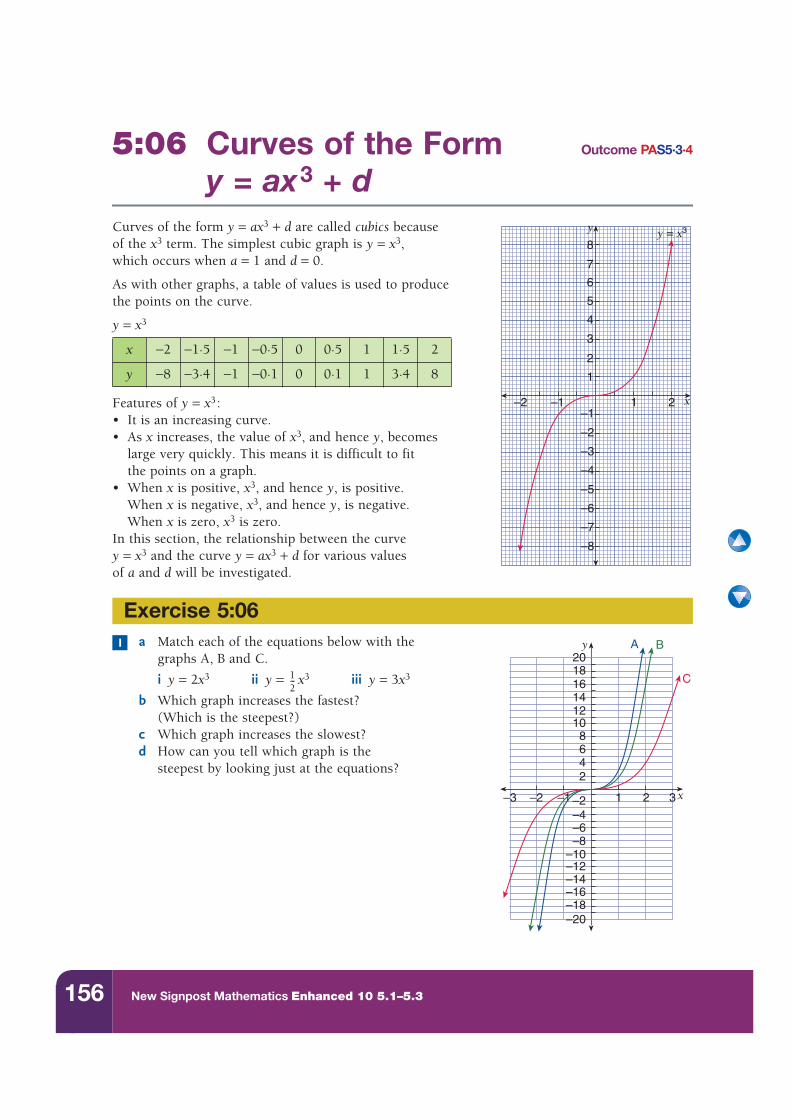
5:06 Curves of the Form Outcome PAS5·3·4
y = ax3 + dCurves of the form y = ax3 + d are called cubics because of the x3 term. The simplest cubic graph is y = x3, which occurs when a = 1 and d = 0.
As with other graphs, a table of values is used to produce the points on the curve.
y = x3
Features of y = x3:• It is an increasing curve.• As x increases, the value of x3, and hence y, becomes
large very quickly. This means it is difficult to fitthe points on a graph.
• When x is positive, x3, and hence y, is positive.When x is negative, x3, and hence y, is negative.When x is zero, x3 is zero.
In this section, the relationship between the curvey = x3 and the curve y = ax3 + d for various values of a and d will be investigated.
a Match each of the equations below with thegraphs A, B and C.
i y = 2x3 ii y = x3 iii y = 3x3
b Which graph increases the fastest? (Which is the steepest?)
c Which graph increases the slowest?d How can you tell which graph is the
steepest by looking just at the equations?
x −2 −1·5 −1 −0·5 0 0·5 1 1·5 2
y −8 −3·4 −1 −0·1 0 0·1 1 3·4 8
y
8
7
6
5
4
3
2
1
–1
–2
–3
–4
–5
–6
–7
–8
–1–2 1 2 x
y = x3
Exercise 5:06
x
y
–1–2–3 1 2 3
642
–2
–6–8
–10–12–14–16–18–20
–4
8101214161820
A B
C
1
12---
157Chapter 5 Number Plane Graphs and Coordinate Geometry
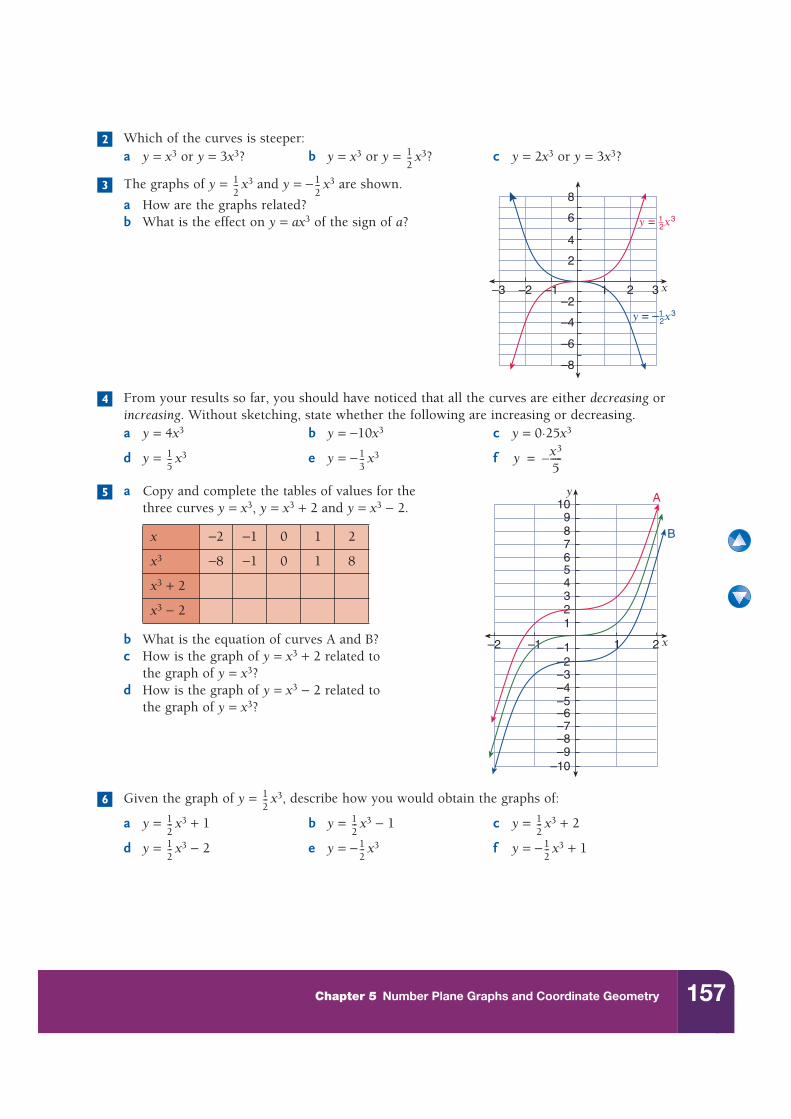
Which of the curves is steeper:a y = x3 or y = 3x3? b y = x3 or y = x3? c y = 2x3 or y = 3x3?
The graphs of y = x3 and y = − x3 are shown.
a How are the graphs related?b What is the effect on y = ax3 of the sign of a?
From your results so far, you should have noticed that all the curves are either decreasing or increasing. Without sketching, state whether the following are increasing or decreasing.a y = 4x3 b y = −10x3 c y = 0·25x3
d y = x3 e y = − x3 f
a Copy and complete the tables of values for thethree curves y = x3, y = x3 + 2 and y = x3 − 2.
b What is the equation of curves A and B?c How is the graph of y = x3 + 2 related to
the graph of y = x3?d How is the graph of y = x3 − 2 related to
the graph of y = x3?
Given the graph of y = x3, describe how you would obtain the graphs of:
a y = x3 + 1 b y = x3 − 1 c y = x3 + 2
d y = x3 − 2 e y = − x3 f y = − x3 + 1
x −2 −1 0 1 2
x3 −8 −1 0 1 8
x3 + 2
x3 − 2
212---
x–1–2–3 1 32
2
–4
–6
–8
–2
4
6
8
y = 12x3
y = –12x3
3 12--- 1
2---
4
15--- 1
3--- y x3
5-----–=
x
y
–1–2 1 2
321
–1
–3–4–5–6–7–8–9
–10
–2
456789
10 A
B
5
6 12---
12--- 1
2--- 1
2---
12--- 1
2--- 1
2---
158 New Signpost Mathematics Enhanced 10 5.1–5.3
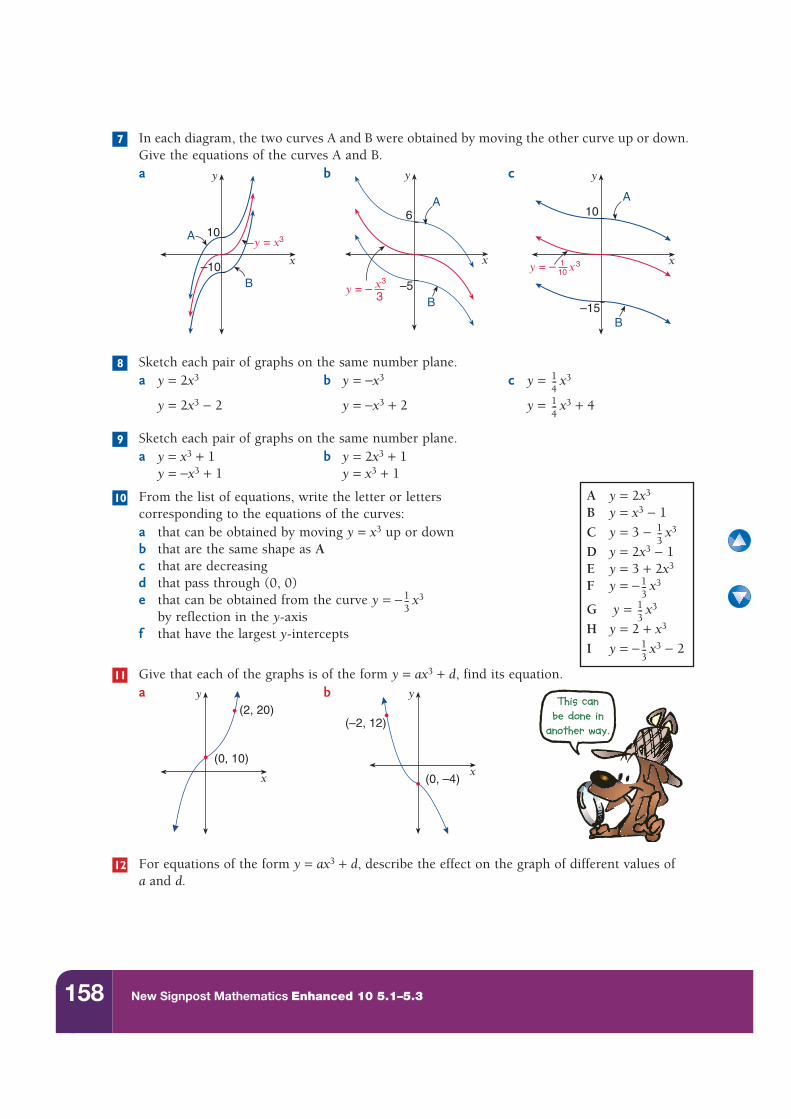
In each diagram, the two curves A and B were obtained by moving the other curve up or down. Give the equations of the curves A and B.a b c
Sketch each pair of graphs on the same number plane.a y = 2x3 b y = −x3 c y = x3
y = 2x3 − 2 y = −x3 + 2 y = x3 + 4
Sketch each pair of graphs on the same number plane.a y = x3 + 1 b y = 2x3 + 1
y = −x3 + 1 y = x3 + 1
From the list of equations, write the letter or letters corresponding to the equations of the curves:a that can be obtained by moving y = x3 up or downb that are the same shape as Ac that are decreasingd that pass through (0, 0)e that can be obtained from the curve y = − x3
by reflection in the y-axisf that have the largest y-intercepts
Give that each of the graphs is of the form y = ax3 + d, find its equation.a b
For equations of the form y = ax3 + d, describe the effect on the graph of different values ofa and d.
7
10
–10
y = x3
y
x
A
B
6
–5y = – x3
y
x
A
B3
10
–15
y = – x3
y
x
A
B
110
814---
14---
9
10 A y = 2x3
B y = x3 − 1
C y = 3 − x3
D y = 2x3 − 1E y = 3 + 2x3
F y = − x3
G y = x3
H y = 2 + x3
I y = − x3 − 2
13---
13---
13---
13---
13---
11
y
x
(0, 10)
(2, 20)y
x(0, –4)
(–2, 12)
This can
be done in
another way.
12
159Chapter 5 Number Plane Graphs and Coordinate Geometry
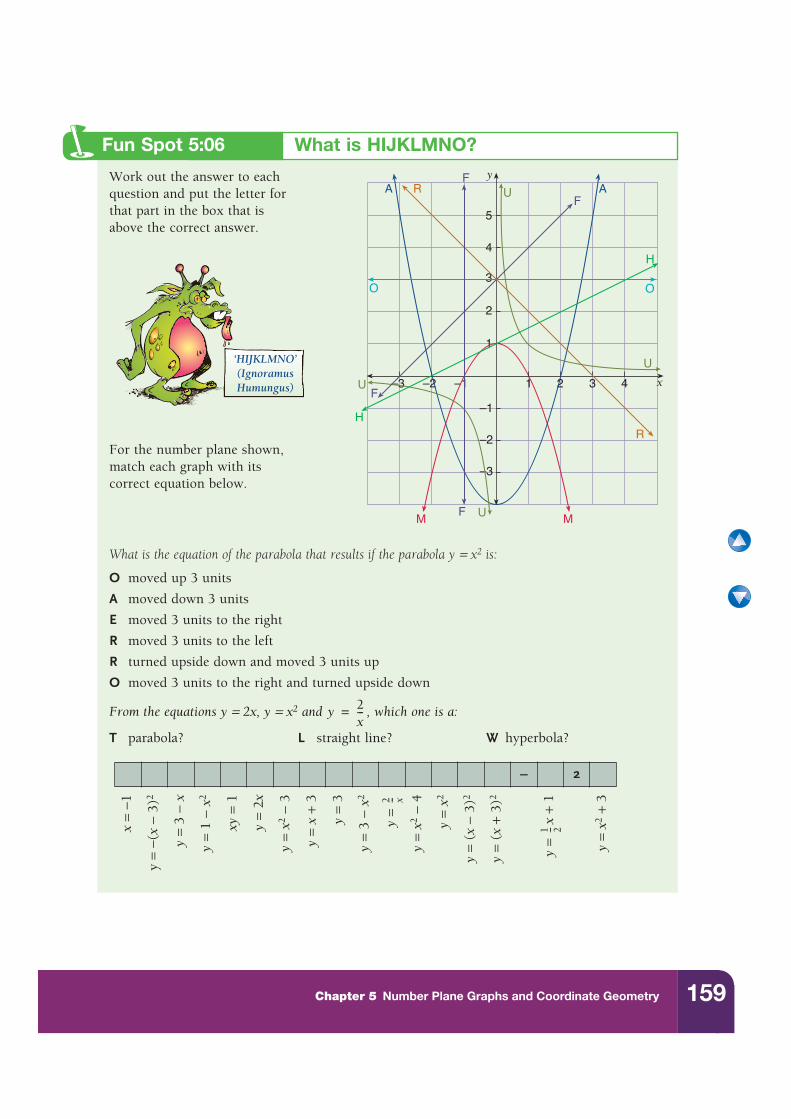
Work out the answer to each question and put the letter for that part in the box that isabove the correct answer.
For the number plane shown, match each graph with its correct equation below.
What is the equation of the parabola that results if the parabola y = x2 is:
O moved up 3 units
A moved down 3 units
E moved 3 units to the right
R moved 3 units to the left
R turned upside down and moved 3 units up
O moved 3 units to the right and turned upside down
From the equations y = 2x, y = x2 and , which one is a:
T parabola? L straight line? W hyperbola?
y
4
3
2
1
x
–1
–2
–3
–1–2–3 1 2 3 4
H
H
O O
F
F
R
R
A A
U
UM M
U
UF
F
5
Fun Spot 5:06 What is HIJKLMNO?
‘HIJKLMNO’(IgnoramusHumungus)
y 2x---=
– 2
x =
−1
y =
−(x
− 3)
2
y =
3 −
x
y =
1 −
x2
xy =
1
y =
2x
y =
x2 −
3
y =
x +
3
y =
3
y =
3 −
x2
y =
y =
x2 −
4
y =
x2
y =
(x −
3)2
y =
(x +
3)2
y =
x +
1
y =
x2 +
32 x---
1 2---
160 New Signpost Mathematics Enhanced 10 5.1–5.3
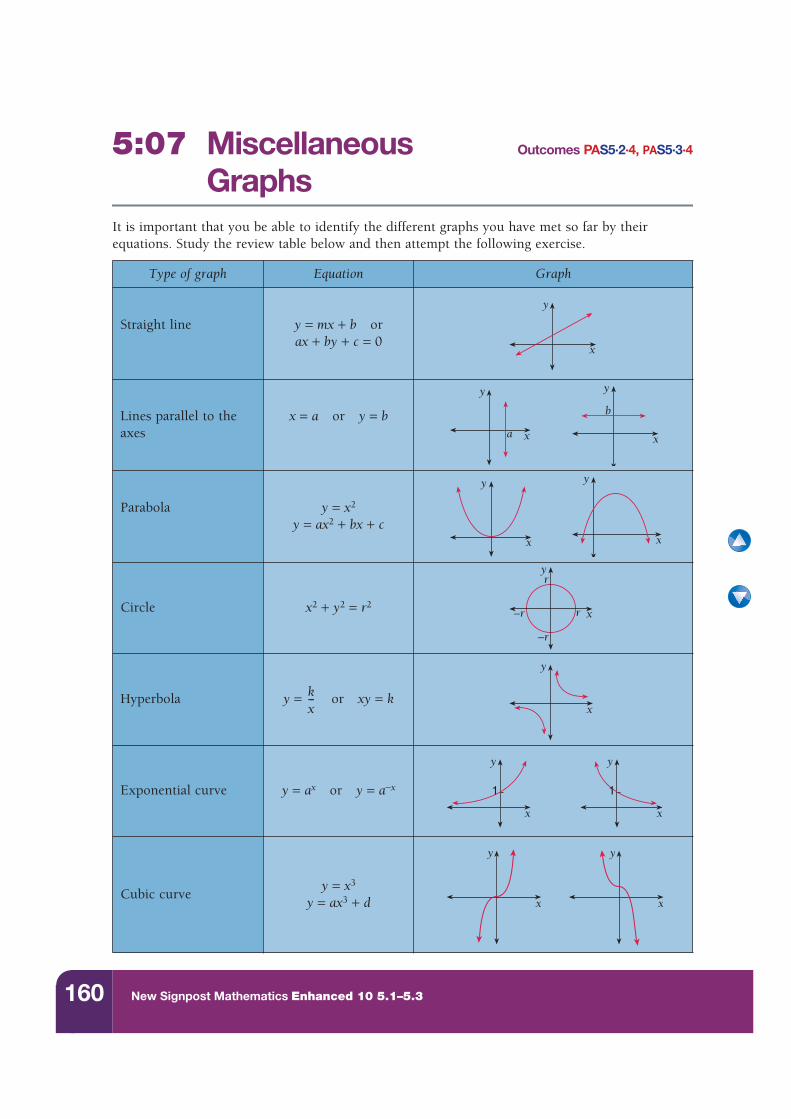
5:07 Miscellaneous Outcomes PAS5·2·4, PAS5·3·4
GraphsIt is important that you be able to identify the different graphs you have met so far by their equations. Study the review table below and then attempt the following exercise.
Type of graph Equation Graph
Straight line y = mx + b orax + by + c = 0
Lines parallel to the axes
x = a or y = b
Parabola y = x2
y = ax2 + bx + c
Circle x2 + y2 = r2
Hyperbola y = or xy = k
Exponential curve y = ax or y = a−x
Cubic curvey = x3
y = ax3 + d
x
y
x
y
a
y
x
b
y
x
y
x
y
x
r
–r r
–r
kx---
y
x
x
y
1
x
y
1
x
y
x
y
161Chapter 5 Number Plane Graphs and Coordinate Geometry
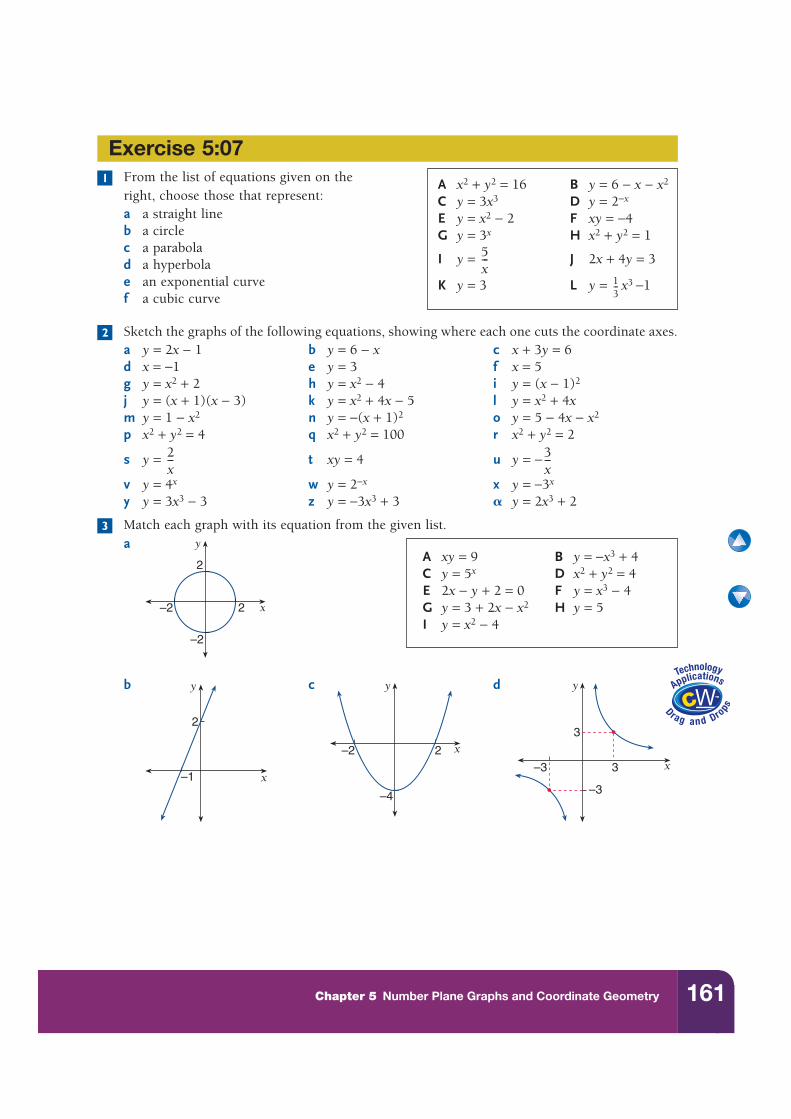
From the list of equations given on theright, choose those that represent:a a straight lineb a circlec a parabolad a hyperbolae an exponential curvef a cubic curve
Sketch the graphs of the following equations, showing where each one cuts the coordinate axes.a y = 2x − 1 b y = 6 − x c x + 3y = 6d x = −1 e y = 3 f x = 5g y = x2 + 2 h y = x2 − 4 i y = (x − 1)2
j y = (x + 1)(x − 3) k y = x2 + 4x − 5 l y = x2 + 4xm y = 1 − x2 n y = −(x + 1)2 o y = 5 − 4x − x2
p x2 + y2 = 4 q x2 + y2 = 100 r x2 + y2 = 2
s y = t xy = 4 u y = −
v y = 4x w y = 2−x x y = −3x
y y = 3x3 − 3 z y = −3x3 + 3 � y = 2x3 + 2
Match each graph with its equation from the given list.a
b c d
Exercise 5:07
A x2 + y2 = 16 B y = 6 − x − x2
C y = 3x3 D y = 2−x
E y = x2 − 2 F xy = −4G y = 3x H x2 + y2 = 1
I y = J 2x + 4y = 3
K y = 3 L y = x3 −1
5x---
13---
1
2
2x--- 3
x---
3
A xy = 9 B y = −x3 + 4C y = 5x D x2 + y2 = 4E 2x − y + 2 = 0 F y = x3 − 4G y = 3 + 2x − x2 H y = 5I y = x2 − 4
x
y
2
–2
–2 2
x
y
–1
2
x
y
–2 2
–4
x
y
–3 3
–3
3
162 New Signpost Mathematics Enhanced 10 5.1–5.3
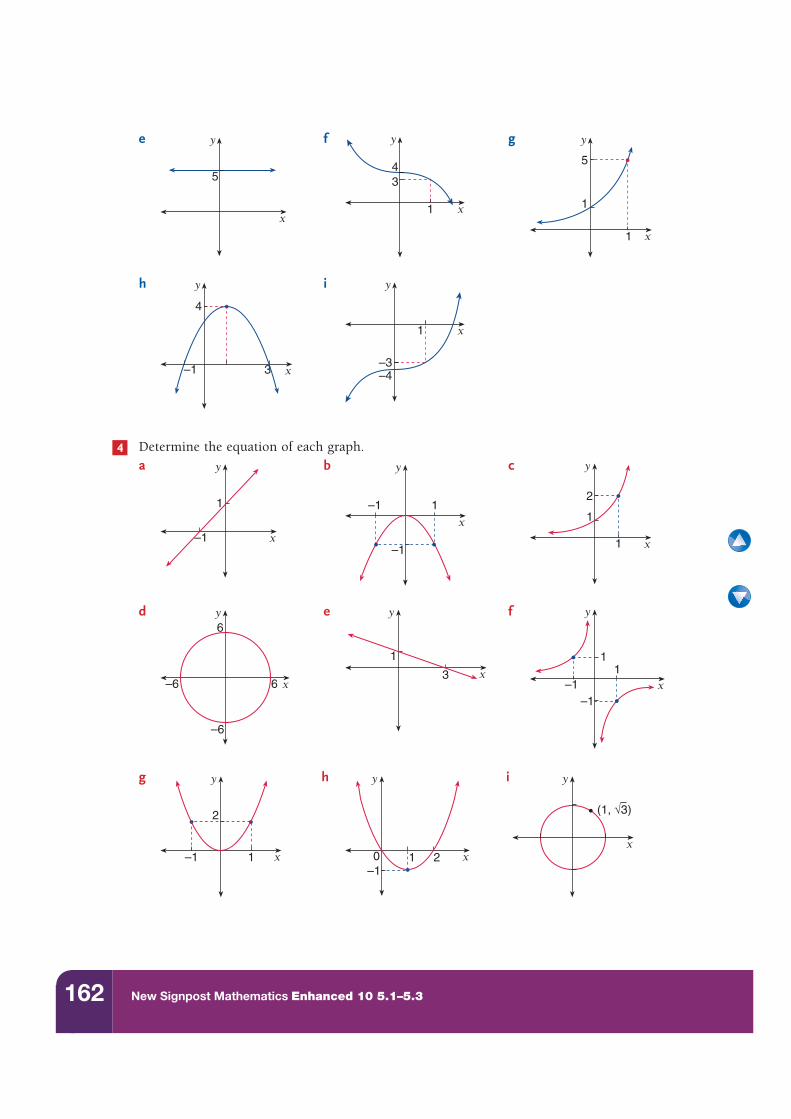
e f g
h i
Determine the equation of each graph.a b c
d e f
g h i
x
y
5
x
y
1
34
x
y
1
1
5
–1 x
y
3
4
x
y
1
–3–4
4
–1 x
y
1 –1x
y
–1
12
x
y
1
1
–6
6
x
y
6
–6
1
x
y
3
1
x
y
1
–1–1
2
x
y
1–1 x
y
1–10 2
x
y
(1, √3)
163Chapter 5 Number Plane Graphs and Coordinate Geometry
j k l
m n o
p q r
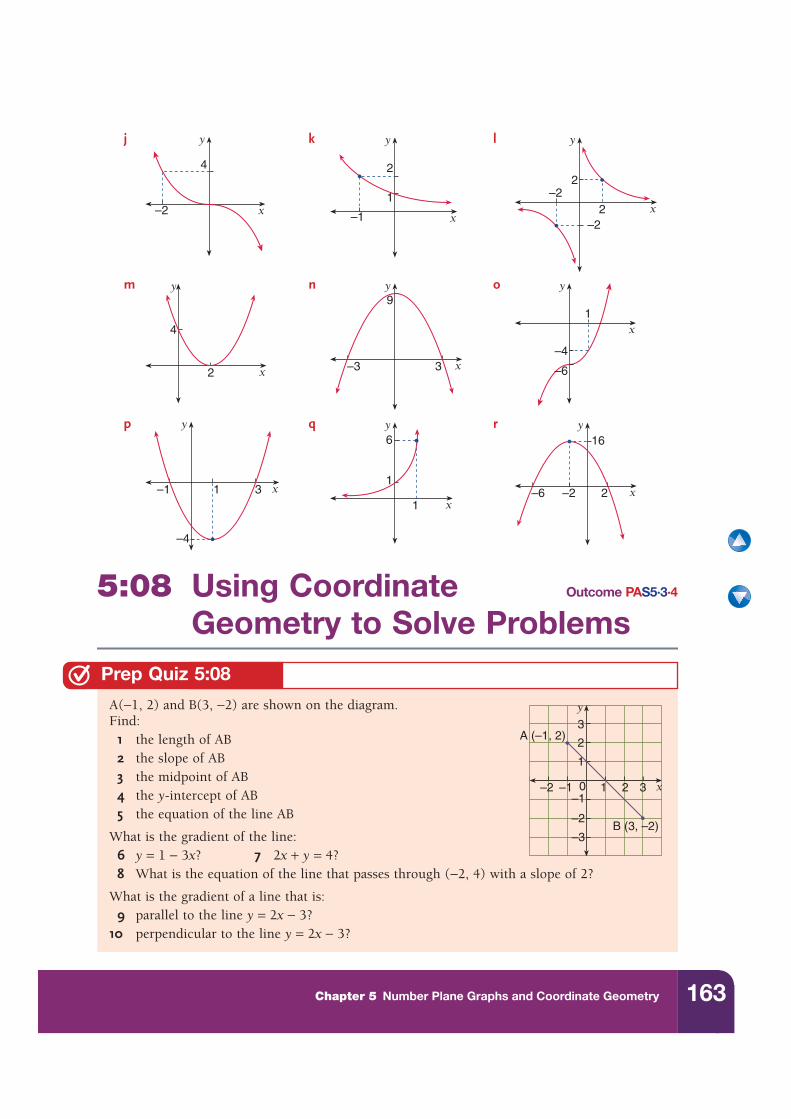
5:08 Using Coordinate Outcome PAS5·3·4
Geometry to Solve Problems
A(−1, 2) and B(3, −2) are shown on the diagram. Find:
1 the length of AB2 the slope of AB3 the midpoint of AB4 the y-intercept of AB5 the equation of the line AB
What is the gradient of the line:6 y = 1 − 3x? 7 2x + y = 4?8 What is the equation of the line that passes through (−2, 4) with a slope of 2?
What is the gradient of a line that is:9 parallel to the line y = 2x − 3?
10 perpendicular to the line y = 2x − 3?
x
y
–2
4
x
y
–1
2
1x
y
–22
–22
x
y
4
2 –3 x
y9
3
x
y
–4
1
–6
–1 x
y
–4
1 31
x
y
1
6
–6 –2 x
y16
2
3
2
1
0–1
–3
–1–2 1 2 3 x
y
–2
A (–1, 2)
B (3, –2)
Prep Quiz 5:08
164 New Signpost Mathematics Enhanced 10 5.1–5.3
In Year 9, coordinate geometry was used to investigate:• the distance between two points• the midpoint of an interval• the gradient (or slope) of an interval• the various equations of a straight line• parallel and perpendicular lines.
These results can be used to investigate the properties of triangles and quadrilaterals as well as other types of geometrical problems.
The results are reviewed in Chapter 1.
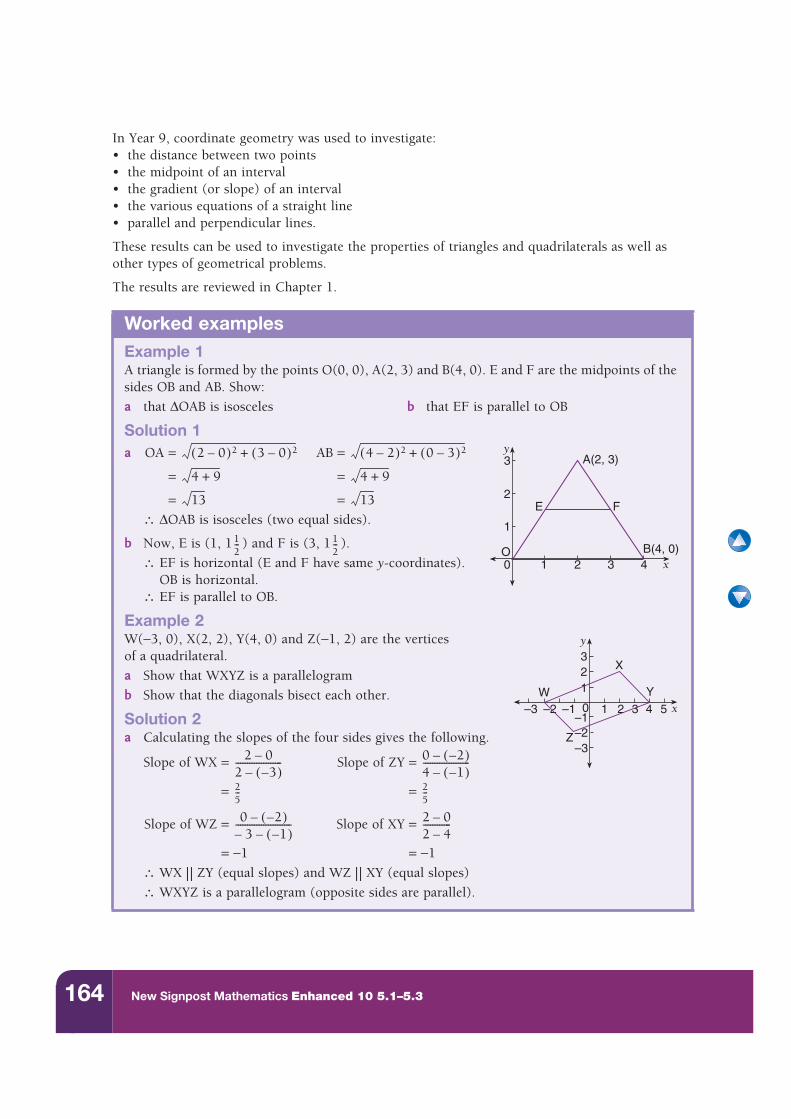
Worked examplesExample 1A triangle is formed by the points O(0, 0), A(2, 3) and B(4, 0). E and F are the midpoints of the sides OB and AB. Show:
a that ΔOAB is isosceles b that EF is parallel to OB
Solution 1a OA = AB =
= =
= =
∴ ΔOAB is isosceles (two equal sides).
b Now, E is (1, 1 ) and F is (3, 1 ).
∴ EF is horizontal (E and F have same y-coordinates).OB is horizontal.
∴ EF is parallel to OB.
Example 2W(−3, 0), X(2, 2), Y(4, 0) and Z(−1, 2) are the verticesof a quadrilateral.
a Show that WXYZ is a parallelogram
b Show that the diagonals bisect each other.
Solution 2a Calculating the slopes of the four sides gives the following.
Slope of WX = Slope of ZY =
= =
Slope of WZ = Slope of XY =
= −1 = −1
∴ WX | | ZY (equal slopes) and WZ | | XY (equal slopes)
∴ WXYZ is a parallelogram (opposite sides are parallel).
y
x
E F
B(4, 0)
A(2, 3)
0 1 2 3
1
2
3
4O
2 0–( )2 3 0–( )2+ 4 2–( )2 0 3–( )2+
4 9+ 4 9+
13 13
12--- 1
2---
321
0–1
–3
–1–2–3 1 2 4 53 x
y
–2
X
Y
Z
W
2 0–2 3–( )–-------------------- 0 2–( )–
4 1–( )–--------------------
25--- 2
5---
0 2–( )–3– 1–( )–
------------------------ 2 0–2 4–------------
165Chapter 5 Number Plane Graphs and Coordinate Geometry
a Show that the triangle formed by the pointsO(0, 0), A(3, 1) and B(1, 3) is isosceles.
b Show that the triangle formed by the points(0, 0), (1, 3) and (7, 1) is right-angled.
c Show that the triangle with vertices at(0, 0), (−2, 2) and (2, 2) is both right-angledand isosceles.
a Show that the quadrilateral with vertices at A(0, 2), B(3, 0), C(0, −2) and D(−3, 0) is a rhombus.
b A quadrilateral is formed by joining the points O(0, 0), B(1, 2), C(5, 0) and D(4, −2).Show that it is a rectangle.
c The points A(0, 2), B(2, 0), C(0, −2) and D(−2, 0) are joined to form a quadrilateral.Show that it is a square.
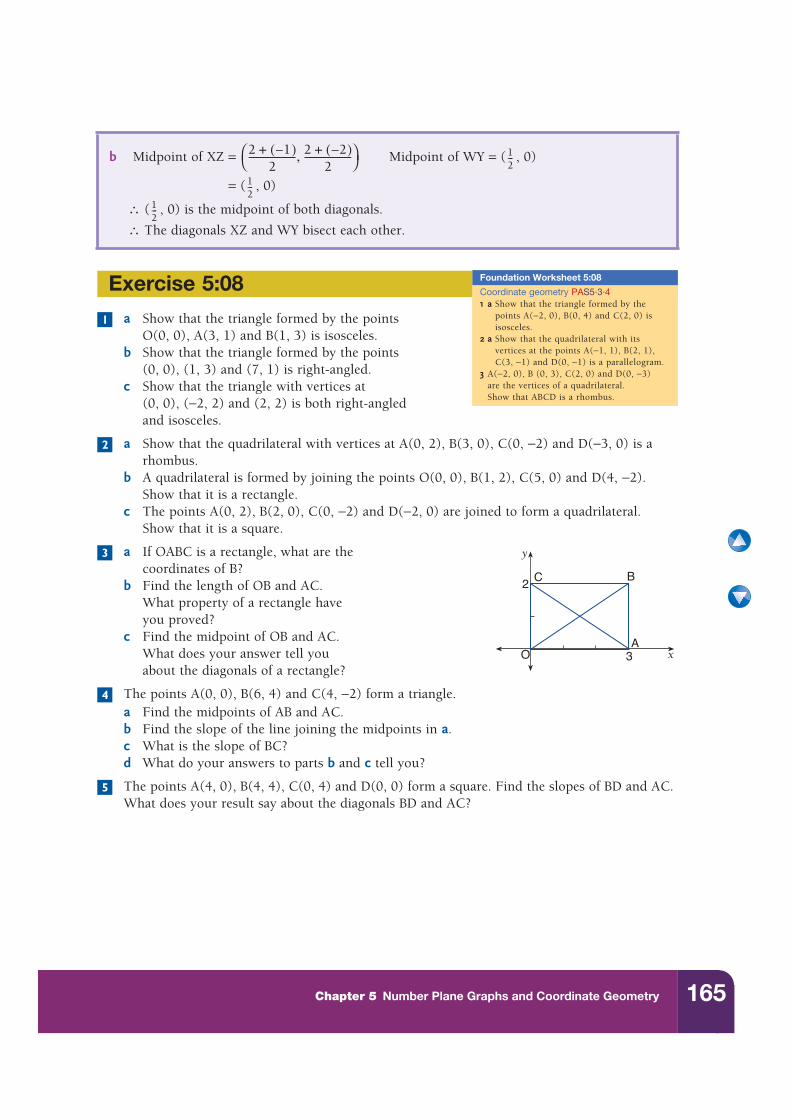
a If OABC is a rectangle, what are the coordinates of B?
b Find the length of OB and AC. What property of a rectangle have you proved?
c Find the midpoint of OB and AC. What does your answer tell you about the diagonals of a rectangle?
The points A(0, 0), B(6, 4) and C(4, −2) form a triangle.a Find the midpoints of AB and AC.b Find the slope of the line joining the midpoints in a.c What is the slope of BC?d What do your answers to parts b and c tell you?
The points A(4, 0), B(4, 4), C(0, 4) and D(0, 0) form a square. Find the slopes of BD and AC. What does your result say about the diagonals BD and AC?
b Midpoint of XZ = Midpoint of WY = ( , 0)
= ( , 0)
∴ ( , 0) is the midpoint of both diagonals.
∴ The diagonals XZ and WY bisect each other.
2 1–( )+2
-------------------- 2 2–( )+2
--------------------,⎝ ⎠⎛ ⎞ 1
2---
12---
12---
Exercise 5:08 Coordinate geometry PAS5·3·41 a Show that the triangle formed by the
points A(−2, 0), B(0, 4) and C(2, 0) is isosceles.
2 a Show that the quadrilateral with its vertices at the points A(−1, 1), B(2, 1), C(3, −1) and D(0, −1) is a parallelogram.
3 A(−2, 0), B (0, 3), C(2, 0) and D(0, −3) are the vertices of a quadrilateral.Show that ABCD is a rhombus.
Foundation Worksheet 5:08
1
2
y
x
C B
O
2
3A
3
4
5
166 New Signpost Mathematics Enhanced 10 5.1–5.3
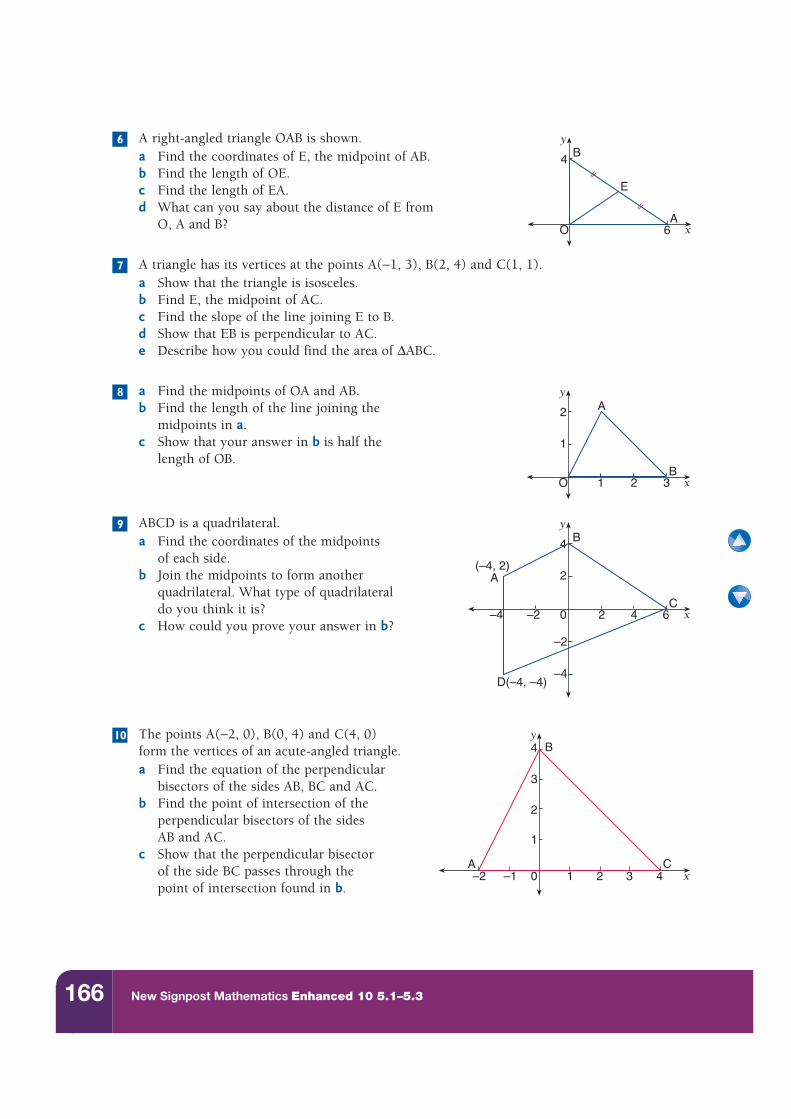
A right-angled triangle OAB is shown.a Find the coordinates of E, the midpoint of AB.b Find the length of OE.c Find the length of EA.d What can you say about the distance of E from
O, A and B?
A triangle has its vertices at the points A(−1, 3), B(2, 4) and C(1, 1).a Show that the triangle is isosceles.b Find E, the midpoint of AC.c Find the slope of the line joining E to B.d Show that EB is perpendicular to AC.e Describe how you could find the area of ΔABC.
a Find the midpoints of OA and AB.b Find the length of the line joining the
midpoints in a.c Show that your answer in b is half the
length of OB.
ABCD is a quadrilateral.a Find the coordinates of the midpoints
of each side.b Join the midpoints to form another
quadrilateral. What type of quadrilateraldo you think it is?
c How could you prove your answer in b?
The points A(−2, 0), B(0, 4) and C(4, 0)form the vertices of an acute-angled triangle.a Find the equation of the perpendicular
bisectors of the sides AB, BC and AC.b Find the point of intersection of the
perpendicular bisectors of the sidesAB and AC.
c Show that the perpendicular bisectorof the side BC passes through the point of intersection found in b.
y
x
B
E
O
4
A6
6
7
y
x
A
O
2
B2 31
1
8
y
x
B
0
4
C4 62
2
D(–4, –4)
(–4, 2)A
–2–4
–2
–4
9
y
x
B
0
4
C3 41 2
2
1
3
A–1–2
10
167Chapter 5 Number Plane Graphs and Coordinate Geometry
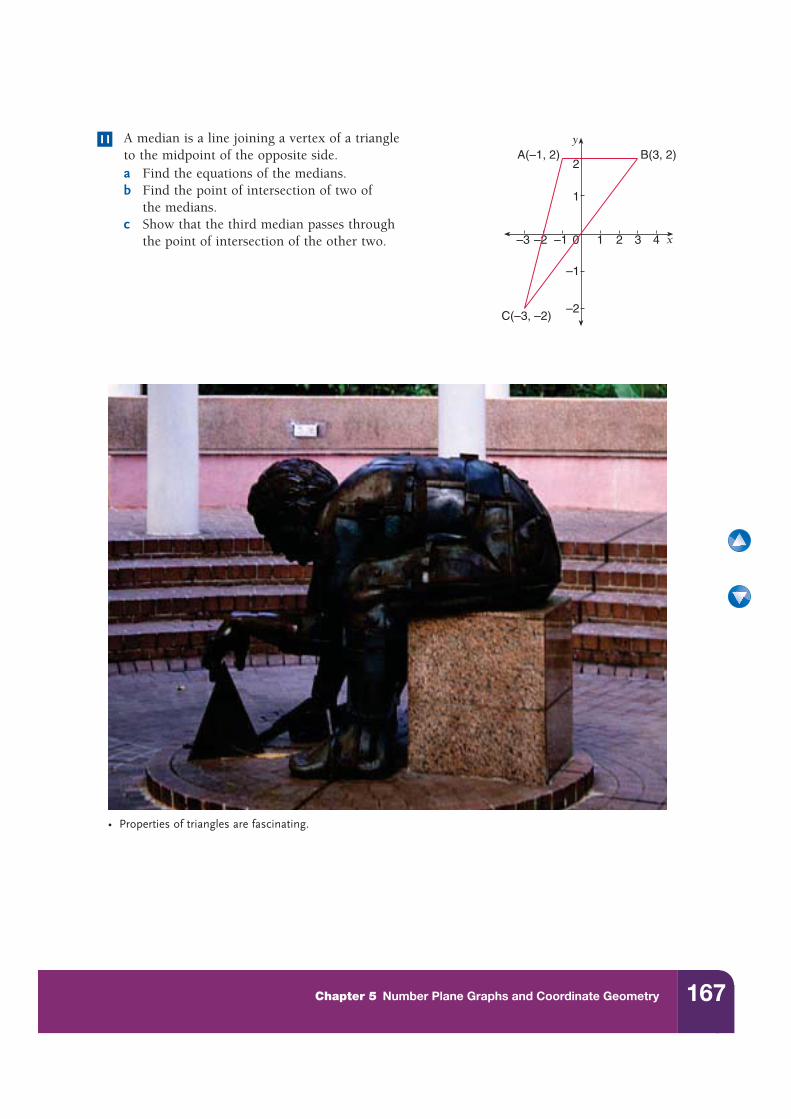
A median is a line joining a vertex of a triangleto the midpoint of the opposite side.a Find the equations of the medians.b Find the point of intersection of two of
the medians.c Show that the third median passes through
the point of intersection of the other two.
y
x0
C(–3, –2)
3 41 2–1–2–3
2
1
–1
–2
B(3, 2)A(–1, 2)11
• Properties of triangles are fascinating.
168 New Signpost Mathematics Enhanced 10 5.1–5.3
circle• The equation of a circle in the number
plane with its centre at the origin is:x2 + y2 = r2
where r is the radius.
cubic curve• A curve that contains an x3 term as its
highest power. In this chapter, the curve’s equation is of the form:y = ax3 + d
exponential curve• A curve with an equation of the form
y = ax, where a > 0.
equation• An algebraic statement that expresses the
relationship between the x- and y-coordinates of every point (x, y) on the curve.
graph (of a curve)• The line that results when the points that
satisfy a curve’s equation are plotted on a number plane.
hyperbola• A curve with the equation where k is
a constant.
• It has two asymptotes (the x-axis and y-axis), which are lines that the curve approaches but never reaches.
parabola
A curve with the equation y = ax2 + bx + c.
• The line of symmetry of the parabola is its axis of symmetry. The equation of the axis
of symmetry is .
• Parabolas can be concave up or concave down.
• The highest (or lowest) value of y on the parabola is the maximum (or minimum) value.
• The point where the parabola turns around is its vertex (or turning point).
x- and y-intercept(s)• The point(s) where a curve crosses the
x- or y-axis.
1 2 3 Literacy in Maths Maths terms 5
y
x
y
x
y
x
y
x
y kx---=
y
x
y
x
y
x
y
x
x b2a------–=
Maths terms 5
169Chapter 5 Number Plane Graphs and Coordinate Geometry
• These questions reflect the important skills introduced in this chapter. • Errors made will indicate an area of weakness. • Each weakness should be treated by going back to the section listed.These questions can be used to assess all or parts of outcomes PAS5·1·2, PAS5·2·4 and PAS5·3·4.
Diagnostic Test 5 Number Plane Graphs and Coordinate Geometry
1 On the same number plane, sketch the graphs of:a y = x2 b y = x2 − 4 c y = x2 + 2
2 On the same number plane, sketch the graph of:
a y = 2x2 b y = x2 c y = −x2
3 Sketch the graphs of:a y = (x − 1)2 b y = (x + 3)2 c y = (x − 2)2 + 1
4 Find the y-intercept of the parabolas:a y = (x − 1)(x + 3) b y = x2 − 6xc y = 8 − 2x − x2 d y = 4x2 + 8x − 5
5 Find the x-intercepts for each of the parabolas in question 4.
6 Find the equation of the axis of symmetry for each of the parabolas in question 4.
7 Find the vertex of each of the parabolas in question 4.
8 Sketch each of the parabolas in question 4. Also state the maximum or minimum value for each quadratic expression.
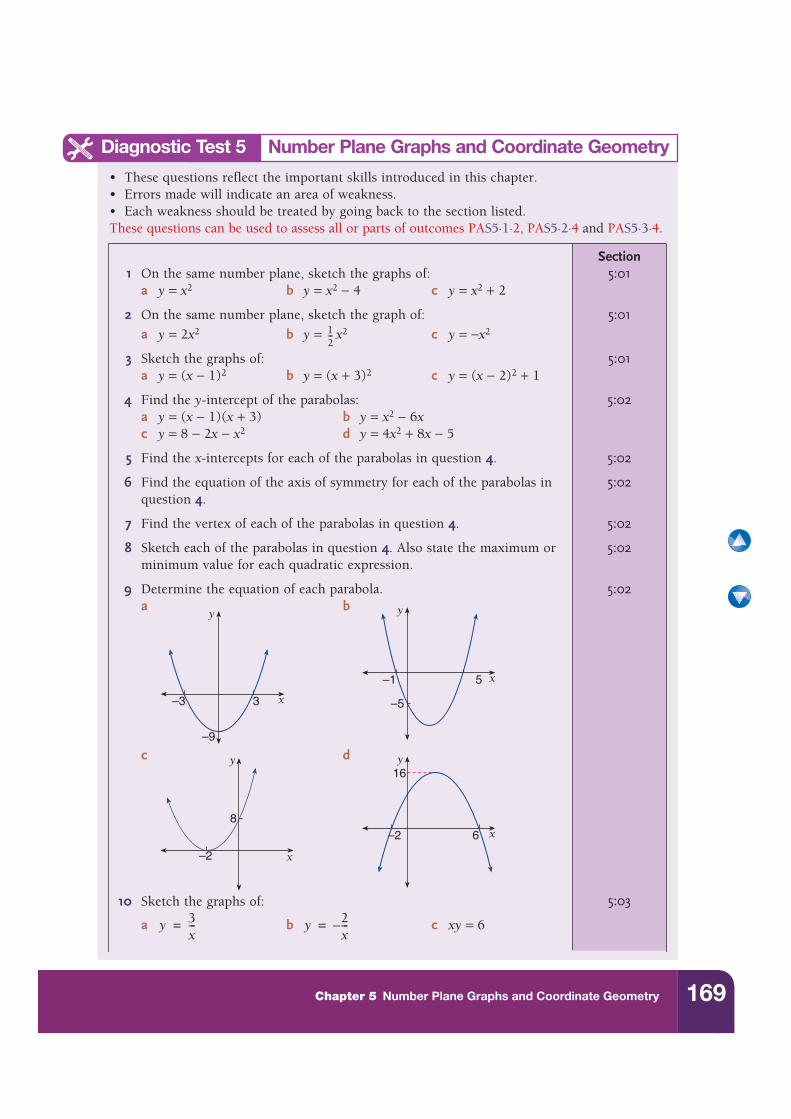
9 Determine the equation of each parabola.a b
c d
10 Sketch the graphs of:
a b c xy = 6
Section5:01
5:01
5:01
5:02
5:02
5:02
5:02
5:02
5:02
5:03
12---
x
y
–3 3
–9
x
y
–1 5
–5
–2 x
y
8x
y
–2 6
16
y 3x---= y 2
x---–=
170 New Signpost Mathematics Enhanced 10 5.1–5.3
11 Sketch, on the same number plane, the graphs of:
a y = 2x b y = 3x c y = 2−x
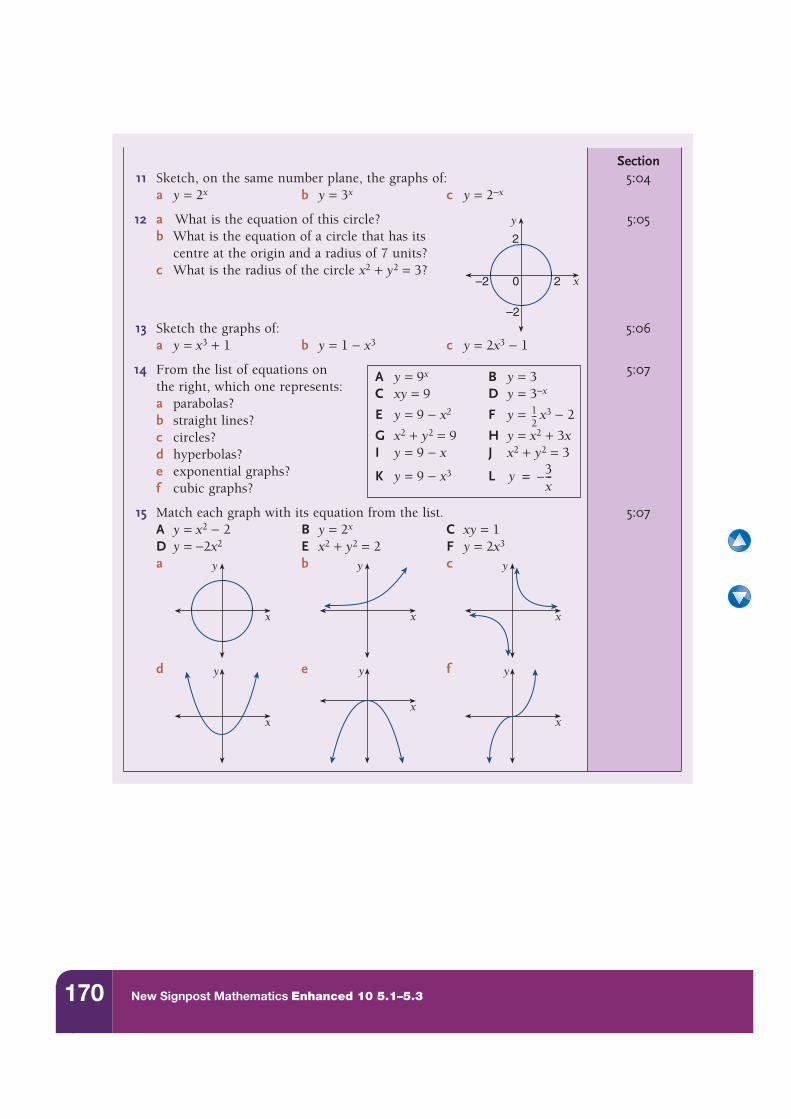
12 a What is the equation of this circle?b What is the equation of a circle that has its
centre at the origin and a radius of 7 units?c What is the radius of the circle x2 + y2 = 3?
13 Sketch the graphs of:a y = x3 + 1 b y = 1 − x3 c y = 2x3 − 1
14 From the list of equations on the right, which one represents:a parabolas?b straight lines?c circles?d hyperbolas?e exponential graphs?f cubic graphs?
15 Match each graph with its equation from the list.A y = x2 − 2 B y = 2x C xy = 1D y = −2x2 E x2 + y2 = 2 F y = 2x3
a b c
d e f
Section5:04
5:05
5:06
5:07
5:07
x
y
2
–2
–2 0 2
A y = 9x B y = 3C xy = 9 D y = 3−x
E y = 9 − x2 F y = x3 − 2
G x2 + y2 = 9 H y = x2 + 3xI y = 9 − x J x2 + y2 = 3
K y = 9 − x3 L
12---
y 3x---–=
x
y
x
y
x
y
x
y
x
y
x
y