nuer - DBS nuer 24 SECTOR II Singapore’s Industrial Spark The Changing Face of Singapore’s...
40
DBS Group Research • June 2016 DBS Asian Insights 24 number SECTOR BRIEFING Singapore’s Industrial Spark The Changing Face of Singapore’s Industrial Real Estate
Transcript of nuer - DBS nuer 24 SECTOR II Singapore’s Industrial Spark The Changing Face of Singapore’s...
DBS Group Research • June 2016DBS Asian Insights24n
um
ber
SECTOR BRIEFING
Singapore’s Industrial Spark
The Changing Face of Singapore’s Industrial Real Estate
DBS Asian Insights SECTOR BRIEFING 2402
Singapore’s Industrial Spark The Changing Face of Singapore’s Industrial Real Estate
Production and additional research by:Asian Insights Office • DBS Group Research
go.dbs.com/research @dbsinsights [email protected]
Chien Yen Goh Editor-in-ChiefJean Chua Managing EditorGeraldine Tan EditorMartin Tacchi Art Director
Derek Tan Weixiang
Equity Analyst DBS Group Research
Rachel Tan
Equity Analyst DBS Group Research
Singapore Research Team
DBS Asian Insights SECTOR BRIEFING 24
03
0506
3436
22
28
Executive Summary
A New Path for Singapore Manufacturing
Outlook of Manufacturing Sector by Clusters
The New Manufacturing Firm: “Factory-less” Goods Production
Outlook for Industrial Space Players in the Industry The Outlook
Business Parks – Building Blocks of the New Economy
Business Parks of the Future Competition to Intensify with Tight
Supply
Urban Renewals to Refresh Factory Space
Urban Renewal of Industrial Real Estate An Urban Renewal of Industrial Space New Clusters of Focus
Warehouse Segment to Face Risks
Appendix
DBS Asian Insights SECTOR BRIEFING 2404
Executive Summary The current slowdown in Singapore’s manufacturing sector is both a cyclical and structural one. Singapore’s manufacturers are struggling to maintain their market share as competition continues to heat up, while domestic cost pressure from ongoing restructuring efforts erodes their profit margins and pricing ability.
Beyond external headwinds and global uncertainties, we believe that industrial landlords can continue to play a part, as Singapore needs to chart a new roadmap for the manufacturing sector in the long term. The manufacturing sector, as with most other sectors of the economy, will continue to undergo transformation with the ongoing domestic restructuring efforts. Through this period, higher operating costs and regional competition will continue to weigh on growth.
We project that demand for industrial space will remain weak as businesses close or consolidate, amid a surge in new supply completions. As such, net absorption is expected to remain negative at 395,000 square metres (sqm) to 776,000 sqm, resulting in vacancies spiking to in excess of 10% in 2016 to 2019. Industrial landlords are likely to turn on the defensive as they face the twin headwinds of both increased competition from new industrial space and business consolidations.
Looking ahead, the industries expected to drive Singapore’s new innovation economy will be different from that of the old. The Singapore government has placed a focus on growing the info-communication, chemicals, biomedical and precision engineering sectors. In addition, we see new businesses in digital technologies, such as automation, additive technologies, and artificial intelligence, as new opportunities for Singapore to capture. The push toward “factory-less” goods production, which involves moving upstream in the manufacturing process, e.g. into product design and research and development (R&D), will also represent a new growth opportunity for Singapore.
We believe that this will result in more demand for specialised facilities, which will be mainly build-to-suit (BTS) in nature; we remain positive on the growth in demand for business parks and hi-tech industrial space, as specifications will remain attractive for users. Data centres could also be a new area of growth given Singapore’s Smart Nation initiative, which will drive up demand for data.
In our view, the multi-user and single-user factory space will face the brunt of the ongoing restructuring efforts and landlords should consider upgrading their properties to higher specifications in order to remain competitive and stand out among the competition.
In the warehouse space, landlords can consider attracting demand by upgrading their warehouses in order to meet the changing demands of end-users. Apart from typical end-users in the third-party logistics (3PLs) space, we believe that new and emerging demand drivers will come from the food & beverage industry (F&B), fast moving consumer goods, and e-commerce players, which will drive growth in the medium term.
DBS Asian Insights SECTOR BRIEFING 24
05
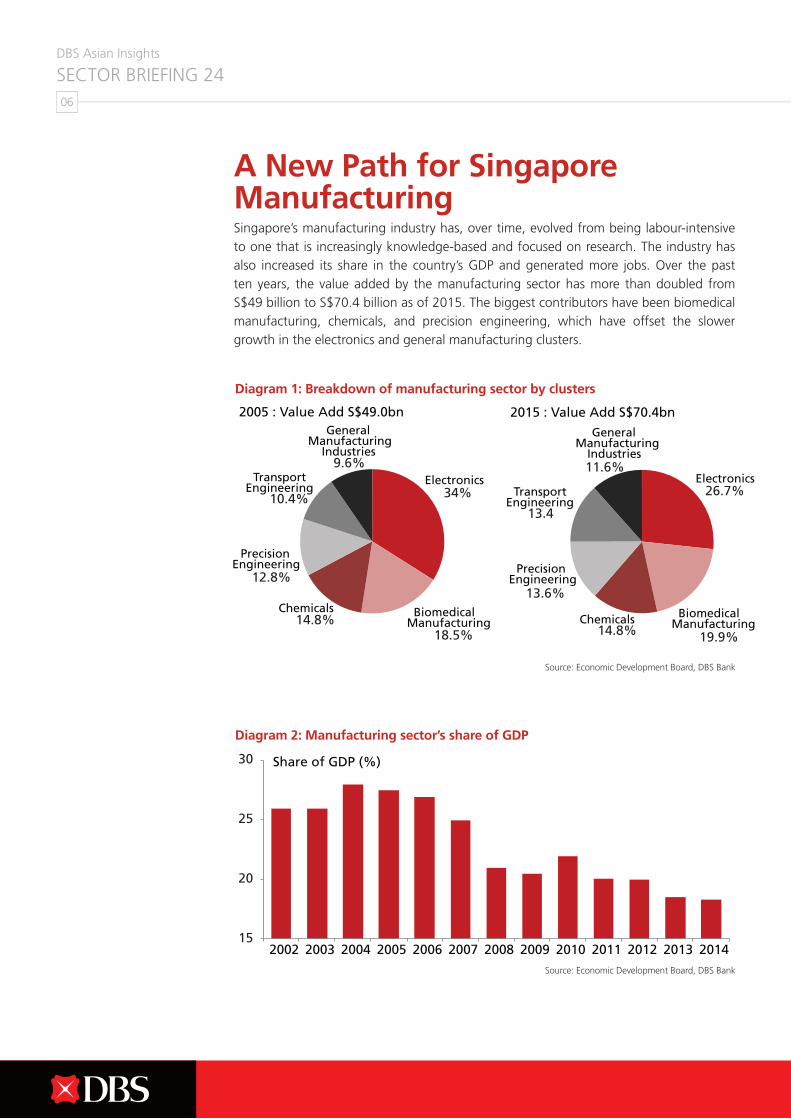
A New Path for Singapore Manufacturing Singapore’s manufacturing industry has, over time, evolved from being labour-intensive to one that is increasingly knowledge-based and focused on research. The industry has also increased its share in the country’s GDP and generated more jobs. Over the past ten years, the value added by the manufacturing sector has more than doubled from S$49 billion to S$70.4 billion as of 2015. The biggest contributors have been biomedical manufacturing, chemicals, and precision engineering, which have offset the slower growth in the electronics and general manufacturing clusters.
DBS Asian Insights SECTOR BRIEFING 2406
Diagram 1: Breakdown of manufacturing sector by clusters
Diagram 2: Manufacturing sector’s share of GDP
Source: Economic Development Board, DBS Bank
Source: Economic Development Board, DBS Bank
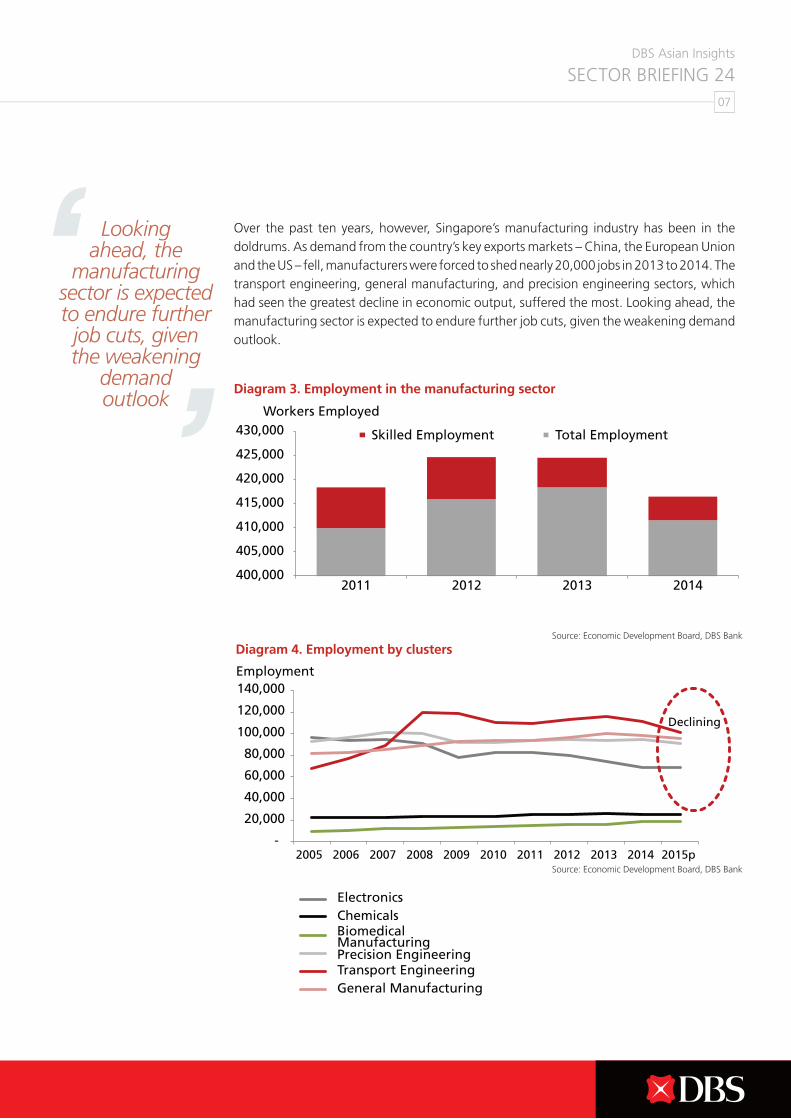
Over the past ten years, however, Singapore’s manufacturing industry has been in the doldrums. As demand from the country’s key exports markets – China, the European Union and the US – fell, manufacturers were forced to shed nearly 20,000 jobs in 2013 to 2014. The transport engineering, general manufacturing, and precision engineering sectors, which had seen the greatest decline in economic output, suffered the most. Looking ahead, the manufacturing sector is expected to endure further job cuts, given the weakening demand outlook.
DBS Asian Insights SECTOR BRIEFING 24
07
Diagram 3. Employment in the manufacturing sector
Diagram 4. Employment by clustersSource: Economic Development Board, DBS Bank
Source: Economic Development Board, DBS Bank
Looking ahead, the
manufacturing sector is expected to endure further
job cuts, given the weakening
demand outlook
DBS Asian Insights SECTOR BRIEFING 2408
Outlook of Manufacturing Sector by Clusters
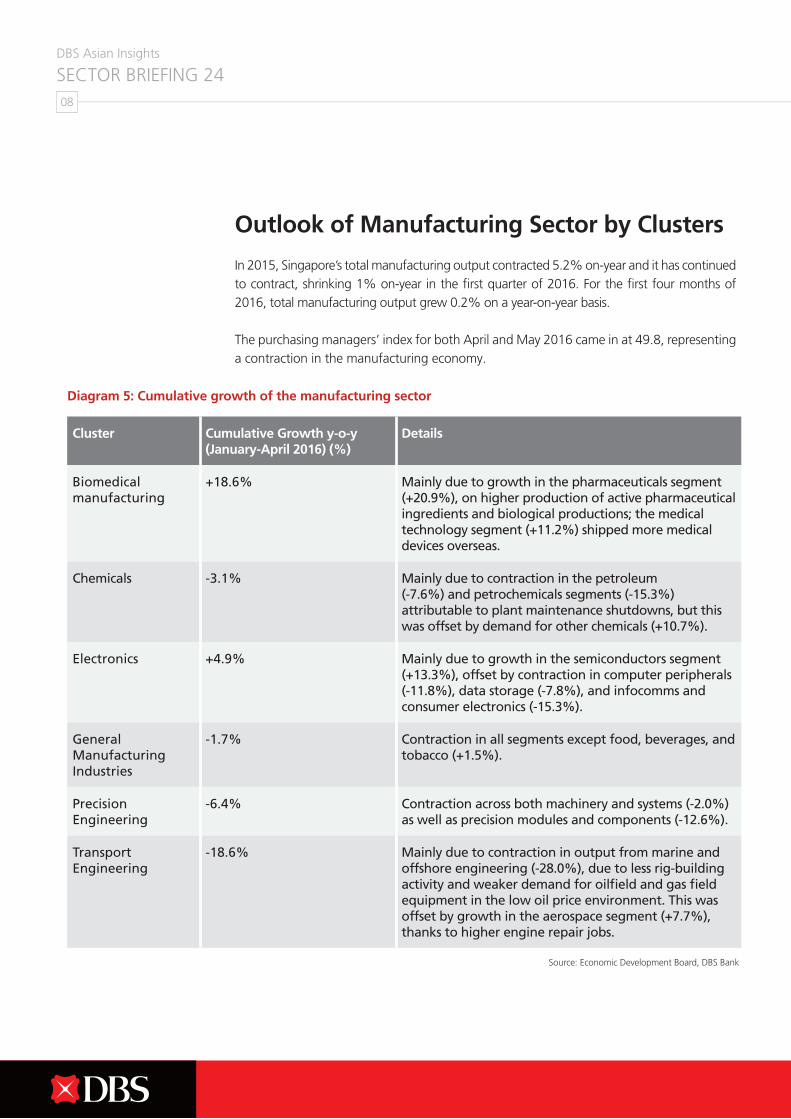
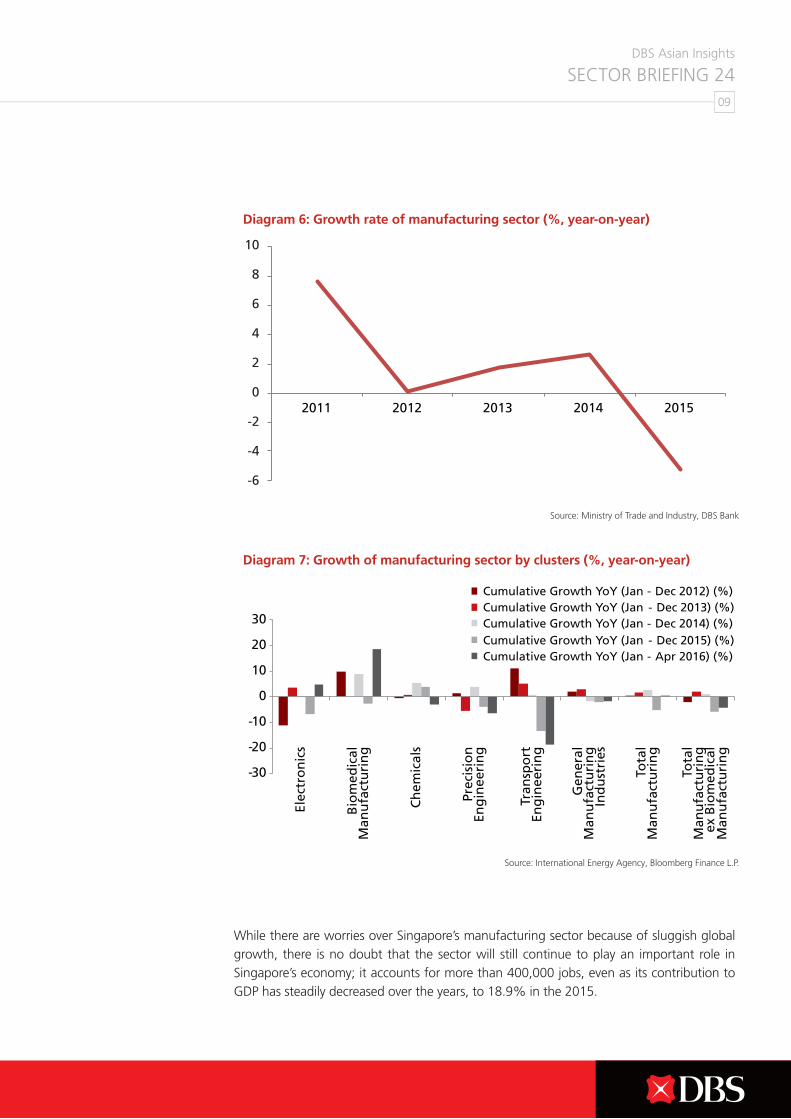
In 2015, Singapore’s total manufacturing output contracted 5.2% on-year and it has continued to contract, shrinking 1% on-year in the first quarter of 2016. For the first four months of 2016, total manufacturing output grew 0.2% on a year-on-year basis.
The purchasing managers’ index for both April and May 2016 came in at 49.8, representing a contraction in the manufacturing economy.
Diagram 5: Cumulative growth of the manufacturing sector
Source: Economic Development Board, DBS Bank
Cluster Cumulative Growth y-o-y (January-April 2016) (%)
Details
Biomedical manufacturing
+18.6% Mainly due to growth in the pharmaceuticals segment (+20.9%), on higher production of active pharmaceutical ingredients and biological productions; the medical technology segment (+11.2%) shipped more medical devices overseas.
Chemicals -3.1% Mainly due to contraction in the petroleum (-7.6%) and petrochemicals segments (-15.3%) attributable to plant maintenance shutdowns, but this was offset by demand for other chemicals (+10.7%).
Electronics +4.9% Mainly due to growth in the semiconductors segment (+13.3%), offset by contraction in computer peripherals (-11.8%), data storage (-7.8%), and infocomms and consumer electronics (-15.3%).
General Manufacturing Industries
-1.7% Contraction in all segments except food, beverages, and tobacco (+1.5%).
Precision Engineering
-6.4% Contraction across both machinery and systems (-2.0%) as well as precision modules and components (-12.6%).
Transport Engineering
-18.6% Mainly due to contraction in output from marine and offshore engineering (-28.0%), due to less rig-building activity and weaker demand for oilfield and gas field equipment in the low oil price environment. This was offset by growth in the aerospace segment (+7.7%), thanks to higher engine repair jobs.
DBS Asian Insights SECTOR BRIEFING 24
09
While there are worries over Singapore’s manufacturing sector because of sluggish global growth, there is no doubt that the sector will still continue to play an important role in Singapore’s economy; it accounts for more than 400,000 jobs, even as its contribution to GDP has steadily decreased over the years, to 18.9% in the 2015.
Source: Ministry of Trade and Industry, DBS Bank
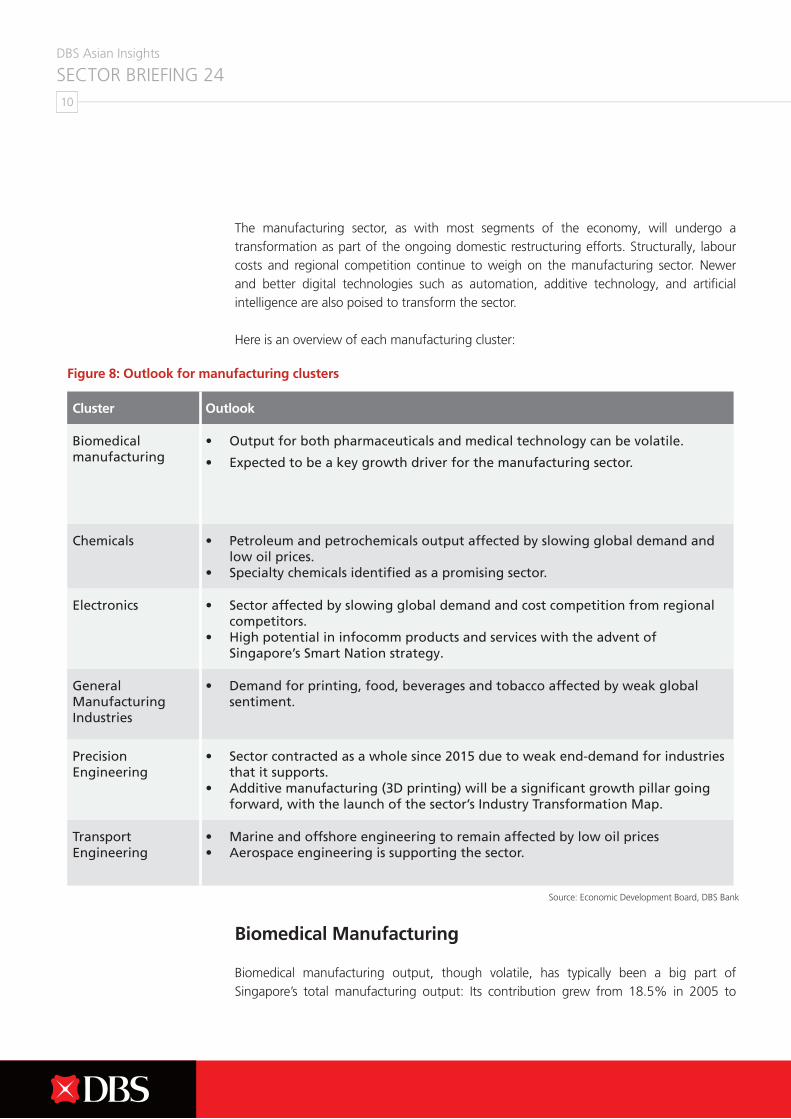
Source: International Energy Agency, Bloomberg Finance L.P.
Diagram 6: Growth rate of manufacturing sector (%, year-on-year)
Diagram 7: Growth of manufacturing sector by clusters (%, year-on-year)
DBS Asian Insights SECTOR BRIEFING 2410
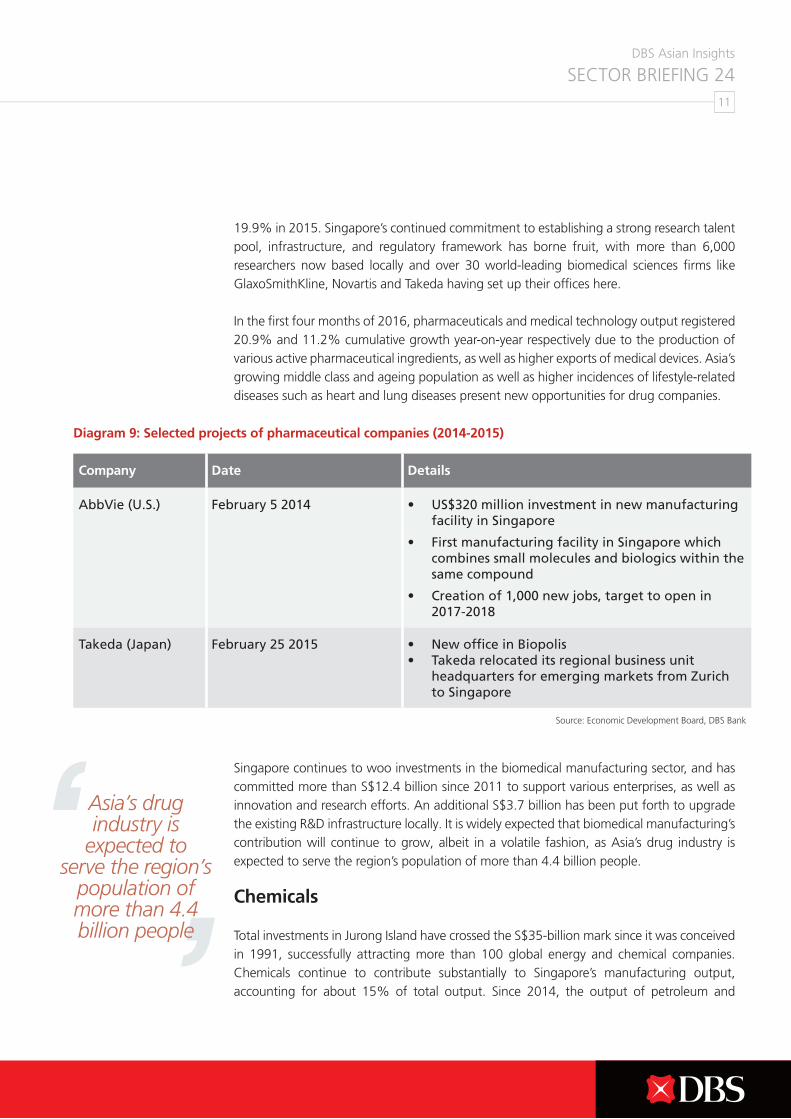
The manufacturing sector, as with most segments of the economy, will undergo a transformation as part of the ongoing domestic restructuring efforts. Structurally, labour costs and regional competition continue to weigh on the manufacturing sector. Newer and better digital technologies such as automation, additive technology, and artificial intelligence are also poised to transform the sector.
Here is an overview of each manufacturing cluster:
Biomedical Manufacturing
Biomedical manufacturing output, though volatile, has typically been a big part of Singapore’s total manufacturing output: Its contribution grew from 18.5% in 2005 to
Figure 8: Outlook for manufacturing clusters
Cluster Outlook
Biomedical manufacturing
• Output for both pharmaceuticals and medical technology can be volatile.
• Expected to be a key growth driver for the manufacturing sector.
Chemicals • Petroleum and petrochemicals output affected by slowing global demand and low oil prices.
• Specialty chemicals identified as a promising sector.
Electronics • Sector affected by slowing global demand and cost competition from regional competitors.
• High potential in infocomm products and services with the advent of Singapore’s Smart Nation strategy.
General Manufacturing Industries
• Demand for printing, food, beverages and tobacco affected by weak global sentiment.
Precision Engineering
• Sector contracted as a whole since 2015 due to weak end-demand for industries that it supports.
• Additive manufacturing (3D printing) will be a significant growth pillar going forward, with the launch of the sector’s Industry Transformation Map.
Transport Engineering
• Marine and offshore engineering to remain affected by low oil prices• Aerospace engineering is supporting the sector.
Source: Economic Development Board, DBS Bank
DBS Asian Insights SECTOR BRIEFING 24
11
19.9% in 2015. Singapore’s continued commitment to establishing a strong research talent pool, infrastructure, and regulatory framework has borne fruit, with more than 6,000 researchers now based locally and over 30 world-leading biomedical sciences firms like GlaxoSmithKline, Novartis and Takeda having set up their offices here.
In the first four months of 2016, pharmaceuticals and medical technology output registered 20.9% and 11.2% cumulative growth year-on-year respectively due to the production of various active pharmaceutical ingredients, as well as higher exports of medical devices. Asia’s growing middle class and ageing population as well as higher incidences of lifestyle-related diseases such as heart and lung diseases present new opportunities for drug companies.
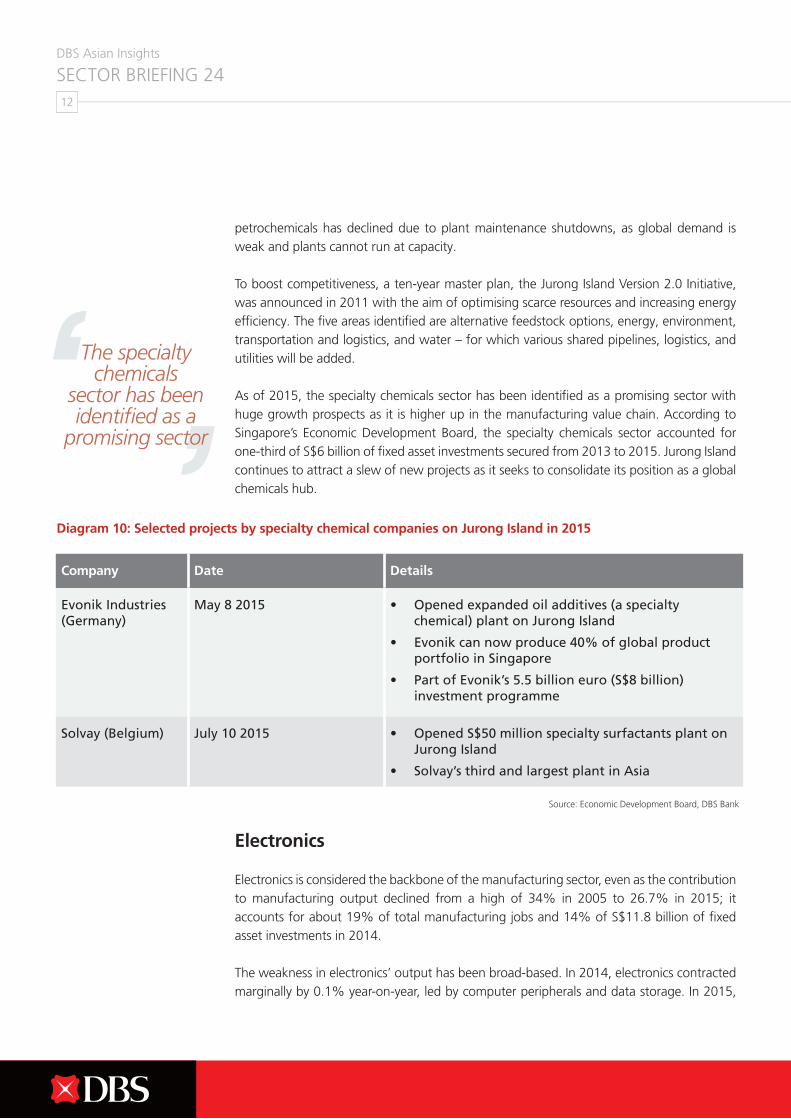
Singapore continues to woo investments in the biomedical manufacturing sector, and has committed more than S$12.4 billion since 2011 to support various enterprises, as well as innovation and research efforts. An additional S$3.7 billion has been put forth to upgrade the existing R&D infrastructure locally. It is widely expected that biomedical manufacturing’s contribution will continue to grow, albeit in a volatile fashion, as Asia’s drug industry is expected to serve the region’s population of more than 4.4 billion people.
Chemicals
Total investments in Jurong Island have crossed the S$35-billion mark since it was conceived in 1991, successfully attracting more than 100 global energy and chemical companies. Chemicals continue to contribute substantially to Singapore’s manufacturing output, accounting for about 15% of total output. Since 2014, the output of petroleum and
Source: Economic Development Board, DBS Bank
Diagram 9: Selected projects of pharmaceutical companies (2014-2015)
Company Date Details
AbbVie (U.S.) February 5 2014 • US$320 million investment in new manufacturing facility in Singapore
• First manufacturing facility in Singapore which combines small molecules and biologics within the same compound
• Creation of 1,000 new jobs, target to open in 2017-2018
Takeda (Japan) February 25 2015 • New office in Biopolis• Takeda relocated its regional business unit
headquarters for emerging markets from Zurich to Singapore
Asia’s drug industry is
expected to serve the region’s
population of more than 4.4 billion people
DBS Asian Insights SECTOR BRIEFING 2412
petrochemicals has declined due to plant maintenance shutdowns, as global demand is weak and plants cannot run at capacity.
To boost competitiveness, a ten-year master plan, the Jurong Island Version 2.0 Initiative, was announced in 2011 with the aim of optimising scarce resources and increasing energy efficiency. The five areas identified are alternative feedstock options, energy, environment, transportation and logistics, and water – for which various shared pipelines, logistics, and utilities will be added.
As of 2015, the specialty chemicals sector has been identified as a promising sector with huge growth prospects as it is higher up in the manufacturing value chain. According to Singapore’s Economic Development Board, the specialty chemicals sector accounted for one-third of S$6 billion of fixed asset investments secured from 2013 to 2015. Jurong Island continues to attract a slew of new projects as it seeks to consolidate its position as a global chemicals hub.
Electronics
Electronics is considered the backbone of the manufacturing sector, even as the contribution to manufacturing output declined from a high of 34% in 2005 to 26.7% in 2015; it accounts for about 19% of total manufacturing jobs and 14% of S$11.8 billion of fixed asset investments in 2014.
The weakness in electronics’ output has been broad-based. In 2014, electronics contracted marginally by 0.1% year-on-year, led by computer peripherals and data storage. In 2015,
Company Date Details
Evonik Industries (Germany)
May 8 2015 • Opened expanded oil additives (a specialty chemical) plant on Jurong Island
• Evonik can now produce 40% of global product portfolio in Singapore
• Part of Evonik’s 5.5 billion euro (S$8 billion) investment programme
Solvay (Belgium) July 10 2015 • Opened S$50 million specialty surfactants plant on Jurong Island
• Solvay’s third and largest plant in Asia
Diagram 10: Selected projects by specialty chemical companies on Jurong Island in 2015
Source: Economic Development Board, DBS Bank
The specialty chemicals
sector has been identified as a
promising sector
DBS Asian Insights SECTOR BRIEFING 24
13
electronics contracted 6.8%, led by semiconductors, computer peripherals, as well as infocomms and consumer electronics. In the first four months of 2016, although electronics’ output expanded 4.9%, computer peripherals, data storage, and infocomms and consumer electronics shrank 11.8%, 7.8%, and 15.3%, respectively.
The poor performance of the electronics segment is largely due to weak demand in the global semiconductor sector. In addition, data storage and computer peripherals’ demand has also been affected by weak end-demand of PC and mobile devices’.
In addition, due to cost issues, companies like Seagate have chosen to move the production of their lower-end components, like disk drives, to neighbouring Malaysia and Thailand.
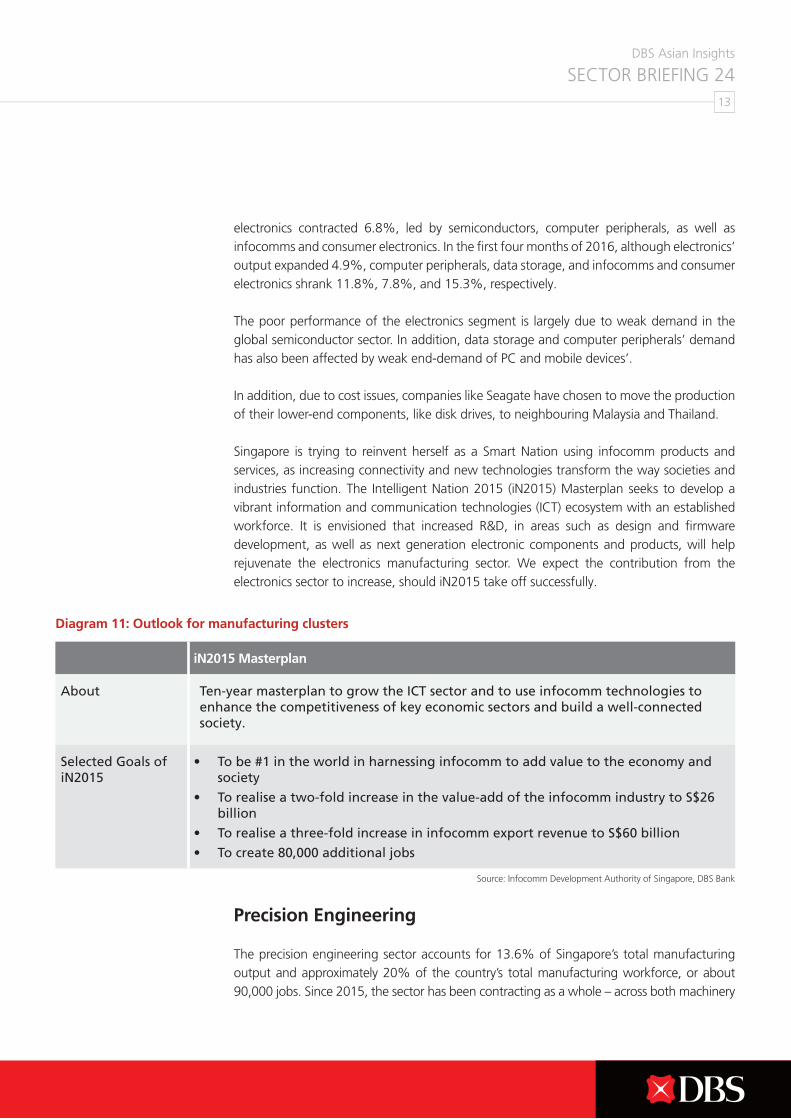
Singapore is trying to reinvent herself as a Smart Nation using infocomm products and services, as increasing connectivity and new technologies transform the way societies and industries function. The Intelligent Nation 2015 (iN2015) Masterplan seeks to develop a vibrant information and communication technologies (ICT) ecosystem with an established workforce. It is envisioned that increased R&D, in areas such as design and firmware development, as well as next generation electronic components and products, will help rejuvenate the electronics manufacturing sector. We expect the contribution from the electronics sector to increase, should iN2015 take off successfully.
Precision Engineering
The precision engineering sector accounts for 13.6% of Singapore’s total manufacturing output and approximately 20% of the country’s total manufacturing workforce, or about 90,000 jobs. Since 2015, the sector has been contracting as a whole – across both machinery
Source: Infocomm Development Authority of Singapore, DBS Bank
Diagram 11: Outlook for manufacturing clusters
iN2015 Masterplan
About Ten-year masterplan to grow the ICT sector and to use infocomm technologies to enhance the competitiveness of key economic sectors and build a well-connected society.
Selected Goals of iN2015
• To be #1 in the world in harnessing infocomm to add value to the economy and society
• To realise a two-fold increase in the value-add of the infocomm industry to S$26 billion
• To realise a three-fold increase in infocomm export revenue to S$60 billion
• To create 80,000 additional jobs
DBS Asian Insights SECTOR BRIEFING 2414
and systems, as well as precision modules and components. Broadly, precision engineering suppliers support key industries like oil and gas, medical technology, electronics, as well as aerospace, and hence demand for precision engineering is highly contingent on end-demand.
Complex equipment and precision components are the growth pillars for precision engineering. On the R&D front, new industry-enabling verticals, namely optics and laser, additive manufacturing (3D printing), and advanced robotics, are being utilised to innovate and create complex equipment and technologies.
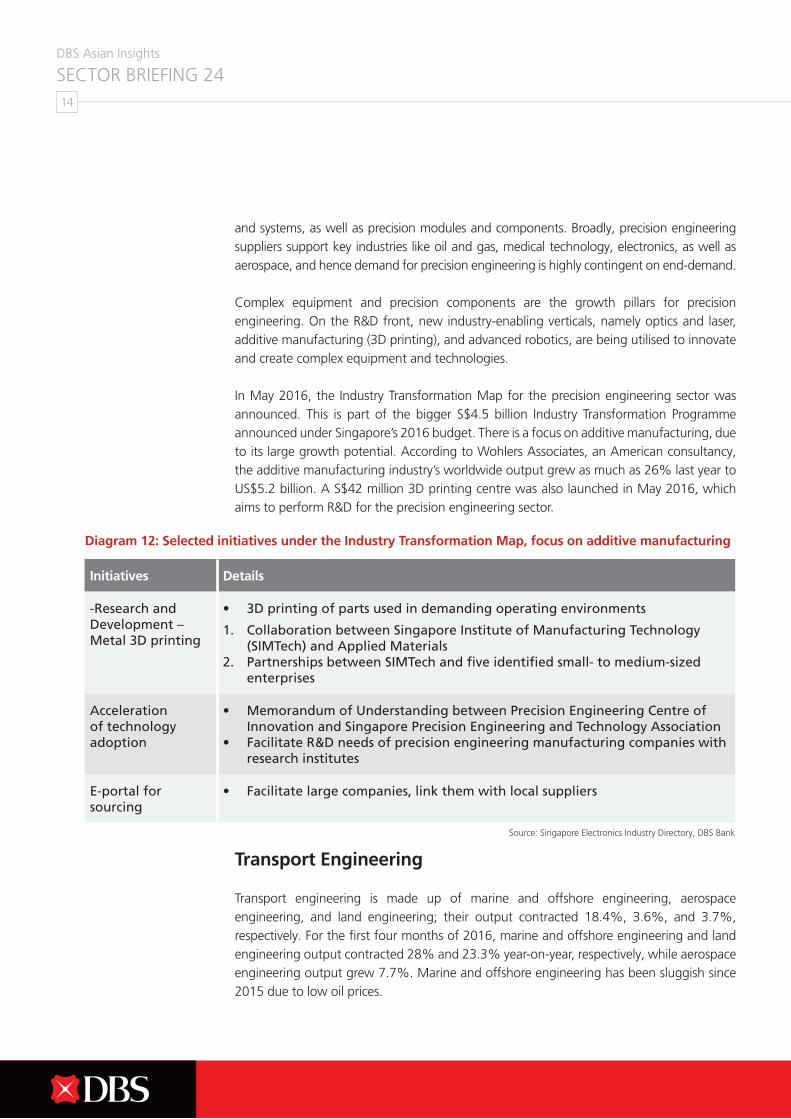
In May 2016, the Industry Transformation Map for the precision engineering sector was announced. This is part of the bigger S$4.5 billion Industry Transformation Programme announced under Singapore’s 2016 budget. There is a focus on additive manufacturing, due to its large growth potential. According to Wohlers Associates, an American consultancy, the additive manufacturing industry’s worldwide output grew as much as 26% last year to US$5.2 billion. A S$42 million 3D printing centre was also launched in May 2016, which aims to perform R&D for the precision engineering sector.
Transport Engineering
Transport engineering is made up of marine and offshore engineering, aerospace engineering, and land engineering; their output contracted 18.4%, 3.6%, and 3.7%, respectively. For the first four months of 2016, marine and offshore engineering and land engineering output contracted 28% and 23.3% year-on-year, respectively, while aerospace engineering output grew 7.7%. Marine and offshore engineering has been sluggish since 2015 due to low oil prices.
Diagram 12: Selected initiatives under the Industry Transformation Map, focus on additive manufacturing
Initiatives Details
-Research and Development – Metal 3D printing
• 3D printing of parts used in demanding operating environments
1. Collaboration between Singapore Institute of Manufacturing Technology (SIMTech) and Applied Materials
2. Partnerships between SIMTech and five identified small- to medium-sized enterprises
Acceleration of technology adoption
• Memorandum of Understanding between Precision Engineering Centre of Innovation and Singapore Precision Engineering and Technology Association
• Facilitate R&D needs of precision engineering manufacturing companies with research institutes
E-portal for sourcing
• Facilitate large companies, link them with local suppliers
Source: Singapore Electronics Industry Directory, DBS Bank
DBS Asian Insights SECTOR BRIEFING 24
15
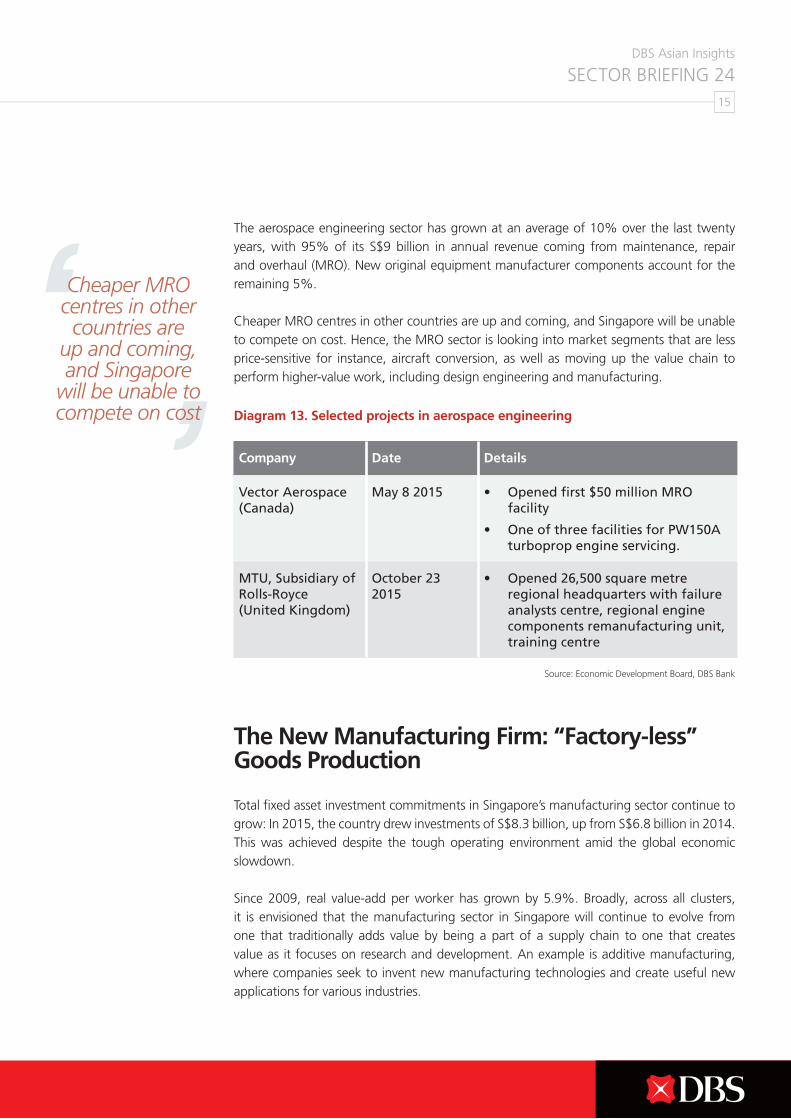
The aerospace engineering sector has grown at an average of 10% over the last twenty years, with 95% of its S$9 billion in annual revenue coming from maintenance, repair and overhaul (MRO). New original equipment manufacturer components account for the remaining 5%.
Cheaper MRO centres in other countries are up and coming, and Singapore will be unable to compete on cost. Hence, the MRO sector is looking into market segments that are less price-sensitive for instance, aircraft conversion, as well as moving up the value chain to perform higher-value work, including design engineering and manufacturing.
The New Manufacturing Firm: “Factory-less” Goods Production
Total fixed asset investment commitments in Singapore’s manufacturing sector continue to grow: In 2015, the country drew investments of S$8.3 billion, up from S$6.8 billion in 2014. This was achieved despite the tough operating environment amid the global economic slowdown.
Since 2009, real value-add per worker has grown by 5.9%. Broadly, across all clusters, it is envisioned that the manufacturing sector in Singapore will continue to evolve from one that traditionally adds value by being a part of a supply chain to one that creates value as it focuses on research and development. An example is additive manufacturing, where companies seek to invent new manufacturing technologies and create useful new applications for various industries.
Initiatives Details
-Research and Development – Metal 3D printing
• 3D printing of parts used in demanding operating environments
1. Collaboration between Singapore Institute of Manufacturing Technology (SIMTech) and Applied Materials
2. Partnerships between SIMTech and five identified small- to medium-sized enterprises
Acceleration of technology adoption
• Memorandum of Understanding between Precision Engineering Centre of Innovation and Singapore Precision Engineering and Technology Association
• Facilitate R&D needs of precision engineering manufacturing companies with research institutes
E-portal for sourcing
• Facilitate large companies, link them with local suppliers
Source: Economic Development Board, DBS Bank
Company Date Details
Vector Aerospace(Canada)
May 8 2015 • Opened first $50 million MRO facility
• One of three facilities for PW150A turboprop engine servicing.
MTU, Subsidiary of Rolls-Royce(United Kingdom)
October 23 2015
• Opened 26,500 square metre regional headquarters with failure analysts centre, regional engine components remanufacturing unit, training centre
Diagram 13. Selected projects in aerospace engineering
Cheaper MRO centres in other countries are
up and coming, and Singapore
will be unable to compete on cost
DBS Asian Insights SECTOR BRIEFING 2416
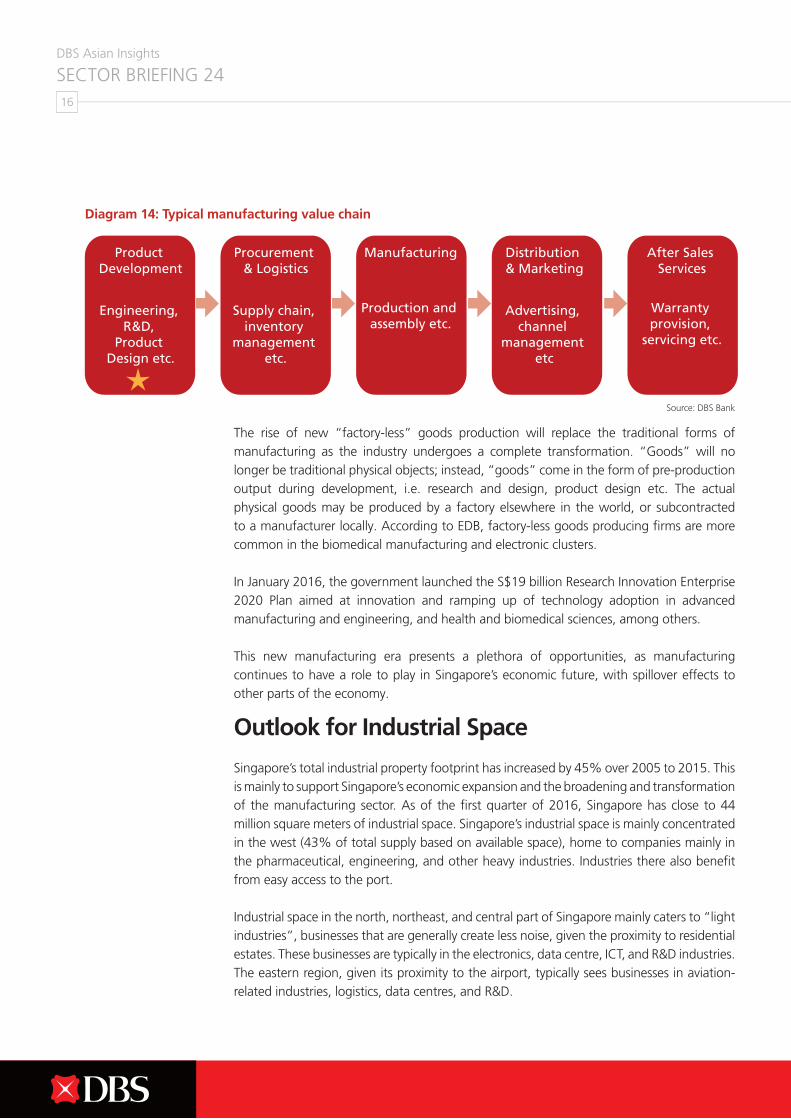
The rise of new “factory-less” goods production will replace the traditional forms of manufacturing as the industry undergoes a complete transformation. “Goods” will no longer be traditional physical objects; instead, “goods” come in the form of pre-production output during development, i.e. research and design, product design etc. The actual physical goods may be produced by a factory elsewhere in the world, or subcontracted to a manufacturer locally. According to EDB, factory-less goods producing firms are more common in the biomedical manufacturing and electronic clusters.
In January 2016, the government launched the S$19 billion Research Innovation Enterprise 2020 Plan aimed at innovation and ramping up of technology adoption in advanced manufacturing and engineering, and health and biomedical sciences, among others.
This new manufacturing era presents a plethora of opportunities, as manufacturing continues to have a role to play in Singapore’s economic future, with spillover effects to other parts of the economy.
Outlook for Industrial Space
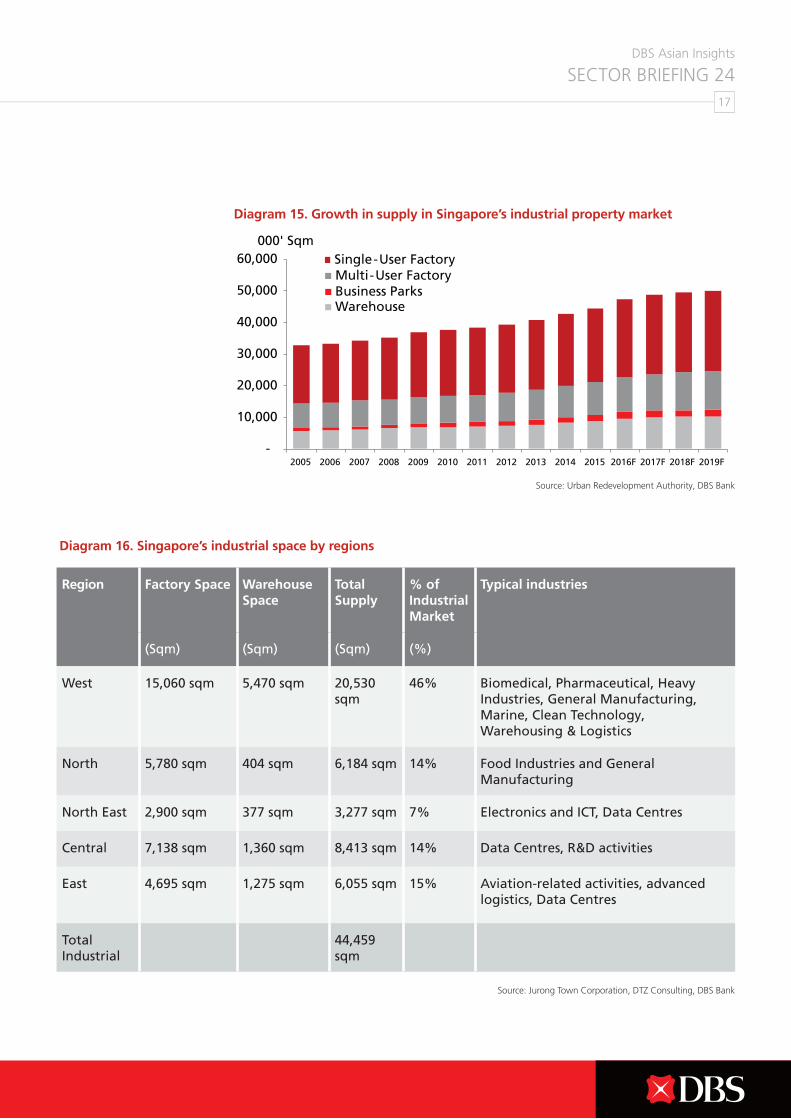
Singapore’s total industrial property footprint has increased by 45% over 2005 to 2015. This is mainly to support Singapore’s economic expansion and the broadening and transformation of the manufacturing sector. As of the first quarter of 2016, Singapore has close to 44 million square meters of industrial space. Singapore’s industrial space is mainly concentrated in the west (43% of total supply based on available space), home to companies mainly in the pharmaceutical, engineering, and other heavy industries. Industries there also benefit from easy access to the port.
Industrial space in the north, northeast, and central part of Singapore mainly caters to “light industries”, businesses that are generally create less noise, given the proximity to residential estates. These businesses are typically in the electronics, data centre, ICT, and R&D industries. The eastern region, given its proximity to the airport, typically sees businesses in aviation-related industries, logistics, data centres, and R&D.
Diagram 14: Typical manufacturing value chain
Source: DBS Bank
DBS Asian Insights SECTOR BRIEFING 24
17
Diagram 16. Singapore’s industrial space by regions
Diagram 15. Growth in supply in Singapore’s industrial property market
Source: Urban Redevelopment Authority, DBS Bank
Source: Jurong Town Corporation, DTZ Consulting, DBS Bank
Region Factory Space Warehouse Space
Total Supply
% of Industrial Market
Typical industries
(Sqm) (Sqm) (Sqm) (%)
West 15,060 sqm 5,470 sqm 20,530 sqm
46% Biomedical, Pharmaceutical, Heavy Industries, General Manufacturing, Marine, Clean Technology, Warehousing & Logistics
North 5,780 sqm 404 sqm 6,184 sqm 14% Food Industries and General Manufacturing
North East 2,900 sqm 377 sqm 3,277 sqm 7% Electronics and ICT, Data Centres
Central 7,138 sqm 1,360 sqm 8,413 sqm 14% Data Centres, R&D activities
East 4,695 sqm 1,275 sqm 6,055 sqm 15% Aviation-related activities, advanced logistics, Data Centres
Total Industrial
44,459 sqm
DBS Asian Insights SECTOR BRIEFING 2418
Players in the Industry
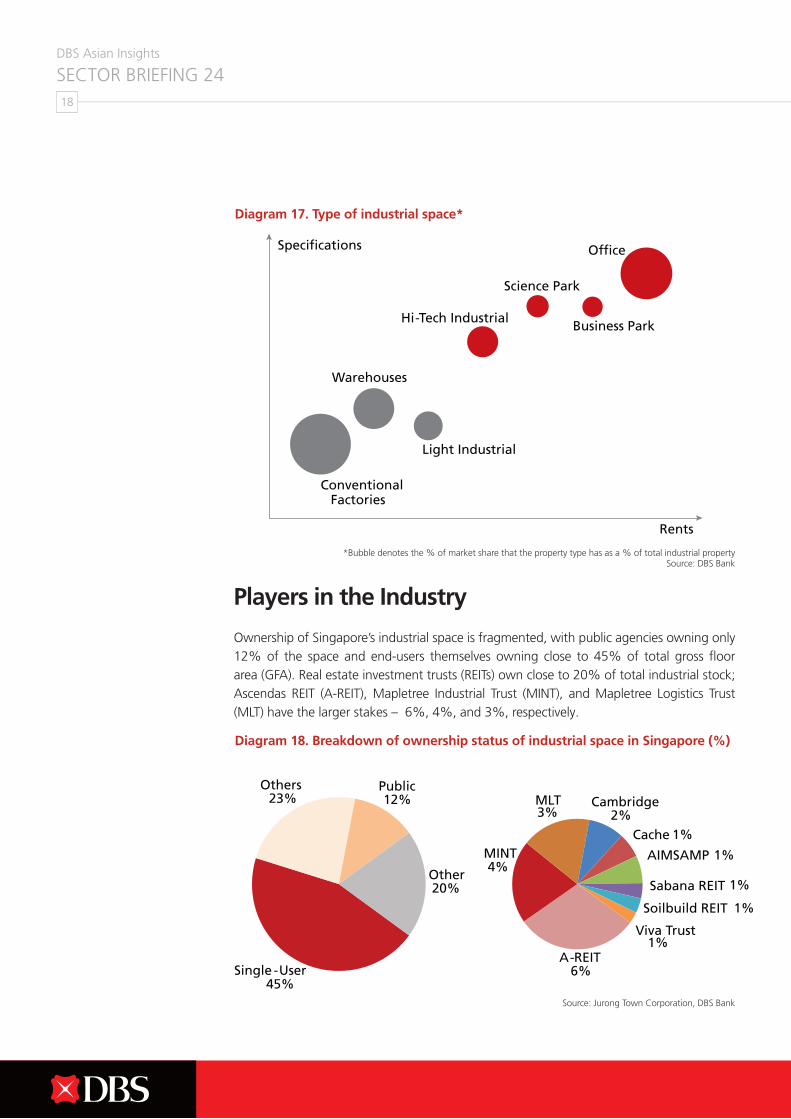
Ownership of Singapore’s industrial space is fragmented, with public agencies owning only 12% of the space and end-users themselves owning close to 45% of total gross floor area (GFA). Real estate investment trusts (REITs) own close to 20% of total industrial stock; Ascendas REIT (A-REIT), Mapletree Industrial Trust (MINT), and Mapletree Logistics Trust (MLT) have the larger stakes – 6%, 4%, and 3%, respectively.
Diagram 17. Type of industrial space*
Diagram 18. Breakdown of ownership status of industrial space in Singapore (%)
*Bubble denotes the % of market share that the property type has as a % of total industrial propertySource: DBS Bank
Source: Jurong Town Corporation, DBS Bank
DBS Asian Insights SECTOR BRIEFING 24
19
Diagram 17. Type of industrial space*
Diagram 18. Breakdown of ownership status of industrial space in Singapore (%)
Source: Various companies’ websites, DBS Bank
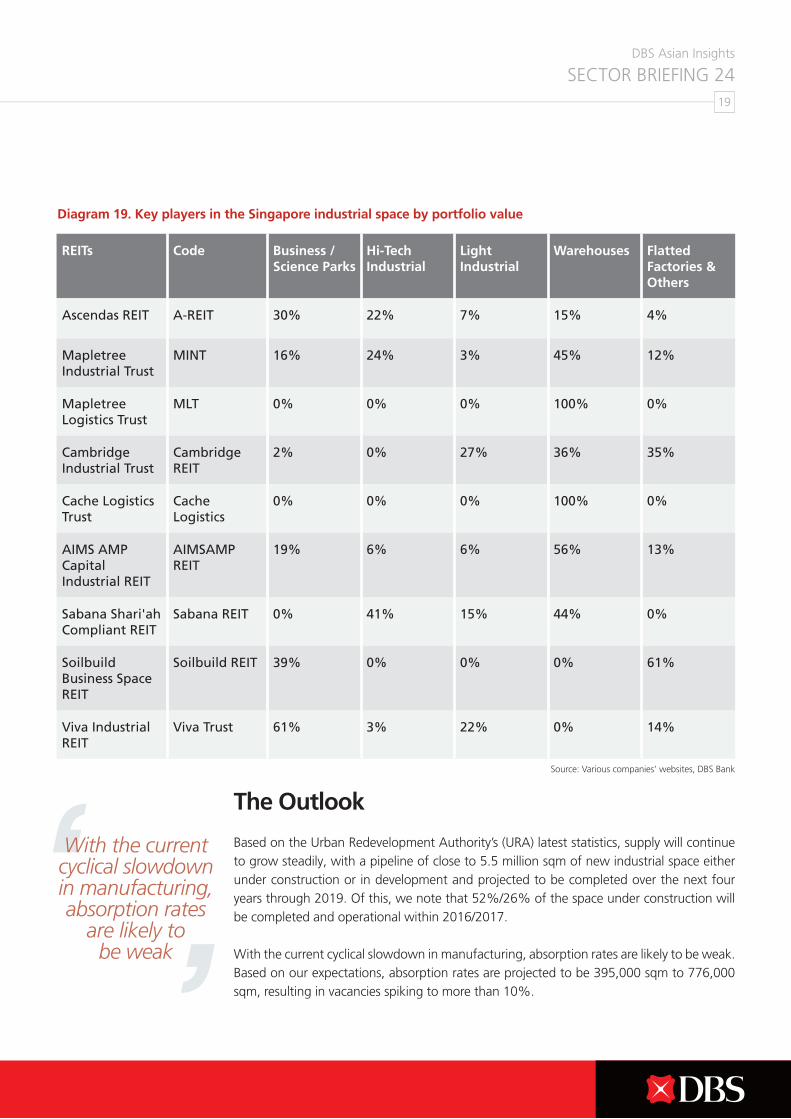
REITs Code Business / Science Parks
Hi-Tech Industrial
Light Industrial
Warehouses Flatted Factories & Others
Ascendas REIT A-REIT 30% 22% 7% 15% 4%
Mapletree Industrial Trust
MINT 16% 24% 3% 45% 12%
Mapletree Logistics Trust
MLT 0% 0% 0% 100% 0%
Cambridge Industrial Trust
Cambridge REIT
2% 0% 27% 36% 35%
Cache Logistics Trust
Cache Logistics
0% 0% 0% 100% 0%
AIMS AMP Capital Industrial REIT
AIMSAMP REIT
19% 6% 6% 56% 13%
Sabana Shari'ah Compliant REIT
Sabana REIT 0% 41% 15% 44% 0%
Soilbuild Business Space REIT
Soilbuild REIT 39% 0% 0% 0% 61%
Viva Industrial REIT
Viva Trust 61% 3% 22% 0% 14%
Diagram 19. Key players in the Singapore industrial space by portfolio value
The Outlook
Based on the Urban Redevelopment Authority’s (URA) latest statistics, supply will continue to grow steadily, with a pipeline of close to 5.5 million sqm of new industrial space either under construction or in development and projected to be completed over the next four years through 2019. Of this, we note that 52%/26% of the space under construction will be completed and operational within 2016/2017.
With the current cyclical slowdown in manufacturing, absorption rates are likely to be weak. Based on our expectations, absorption rates are projected to be 395,000 sqm to 776,000 sqm, resulting in vacancies spiking to more than 10%.
With the current cyclical slowdown in manufacturing, absorption rates
are likely to be weak
DBS Asian Insights SECTOR BRIEFING 2420
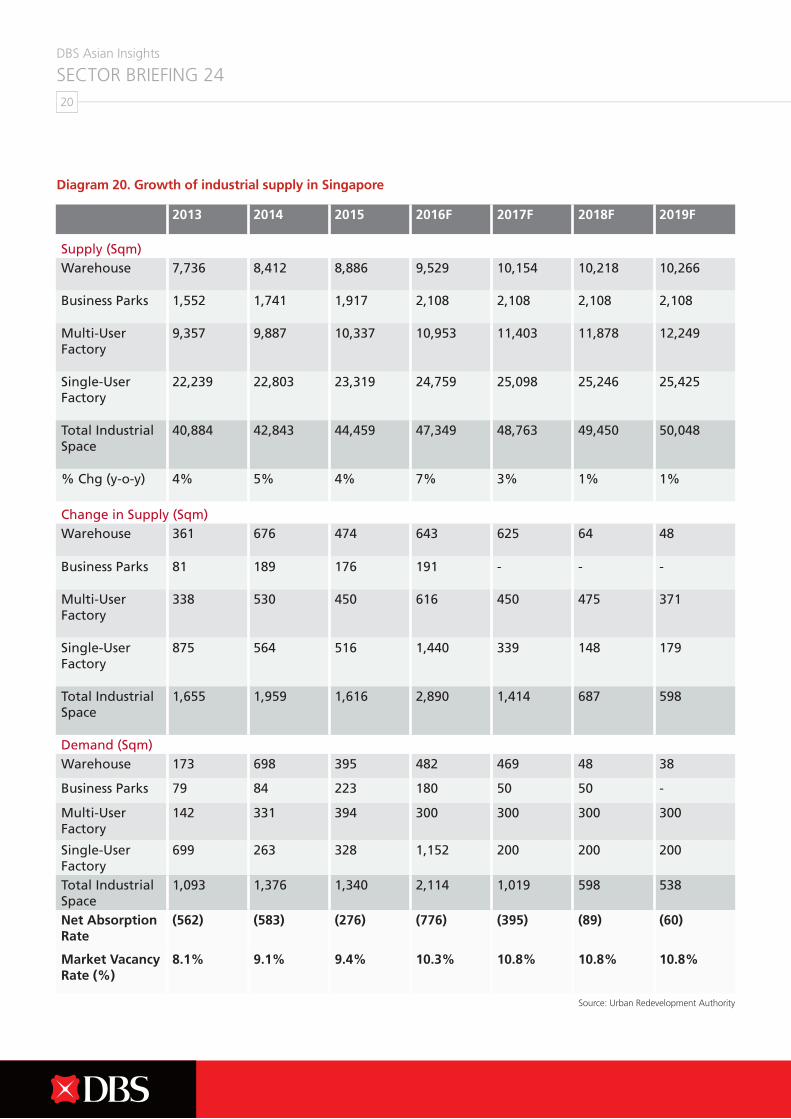
2013 2014 2015 2016F 2017F 2018F 2019F
Supply (Sqm)Warehouse 7,736 8,412 8,886 9,529 10,154 10,218 10,266
Business Parks 1,552 1,741 1,917 2,108 2,108 2,108 2,108
Multi-User Factory
9,357 9,887 10,337 10,953 11,403 11,878 12,249
Single-User Factory
22,239 22,803 23,319 24,759 25,098 25,246 25,425
Total Industrial Space
40,884 42,843 44,459 47,349 48,763 49,450 50,048
% Chg (y-o-y) 4% 5% 4% 7% 3% 1% 1%
Change in Supply (Sqm)Warehouse 361 676 474 643 625 64 48
Business Parks 81 189 176 191 - - -
Multi-User Factory
338 530 450 616 450 475 371
Single-User Factory
875 564 516 1,440 339 148 179
Total Industrial Space
1,655 1,959 1,616 2,890 1,414 687 598
Demand (Sqm)Warehouse 173 698 395 482 469 48 38
Business Parks 79 84 223 180 50 50 -
Multi-User Factory
142 331 394 300 300 300 300
Single-User Factory
699 263 328 1,152 200 200 200
Total Industrial Space
1,093 1,376 1,340 2,114 1,019 598 538
Net Absorption Rate
(562) (583) (276) (776) (395) (89) (60)
Market Vacancy Rate (%)
8.1% 9.1% 9.4% 10.3% 10.8% 10.8% 10.8%
Diagram 20. Growth of industrial supply in Singapore
Source: Urban Redevelopment Authority
DBS Asian Insights SECTOR BRIEFING 24
21
Beyond global economic uncertainties and the current oversupply situation in the industrial space, we believe that structural issues need to be addressed to ensure the long-term viability of Singapore’s manufacturing sector. According to our economist, Singapore’s manufacturers have been struggling with higher business costs and a labour crunch caused by restrictions on hiring foreign workers, and are thus losing to regional peers.
While businesses are clamouring for selective unwinding of some of the restructuring measures – which will be helpful in the near term – we believe that Singapore will have to take the leap and make the transition from a knowledge-based economy to an innovation-driven economy to remain competitive. According to a recent article written by our economist, Singapore should not only be looking to “promote growth in new manufacturing clusters”, it should also look at the long-term prospects of manufacturers – they need to climb the technological ladder, strengthen skill-sets, and focus on value creation via innovation.
As we chart our way past current cyclical and structural headwinds in the manufacturing sector, we believe that the face of Singapore’s industrial real estate will inevitably continue to evolve alongside Singapore’s manufacturing sector as it re-tools itself toward being innovation-driven. Given its highly educated workforce and proactive government policies, Singapore will continue to attract major multinational companies to set up their regional headquarters and/or facilities here, which will have a positive spin-off effect on supporting small- and medium-sized enterprises (SMEs).
However, we should not stop there. One of the key strategies by the government is to encourage SMEs to expand outside Singapore, where they will not be constrained by the availability of land. This can be achieved through a “hub-and-spoke” strategy: Leveraging Singapore as a home base and growing upstream activities in neighbouring countries that offer more cost advantages.
Singapore will have to
take the leap and make the transition from a knowledge-
based economy to an innovation-driven economy
to remain competitive
DBS Asian Insights SECTOR BRIEFING 2422
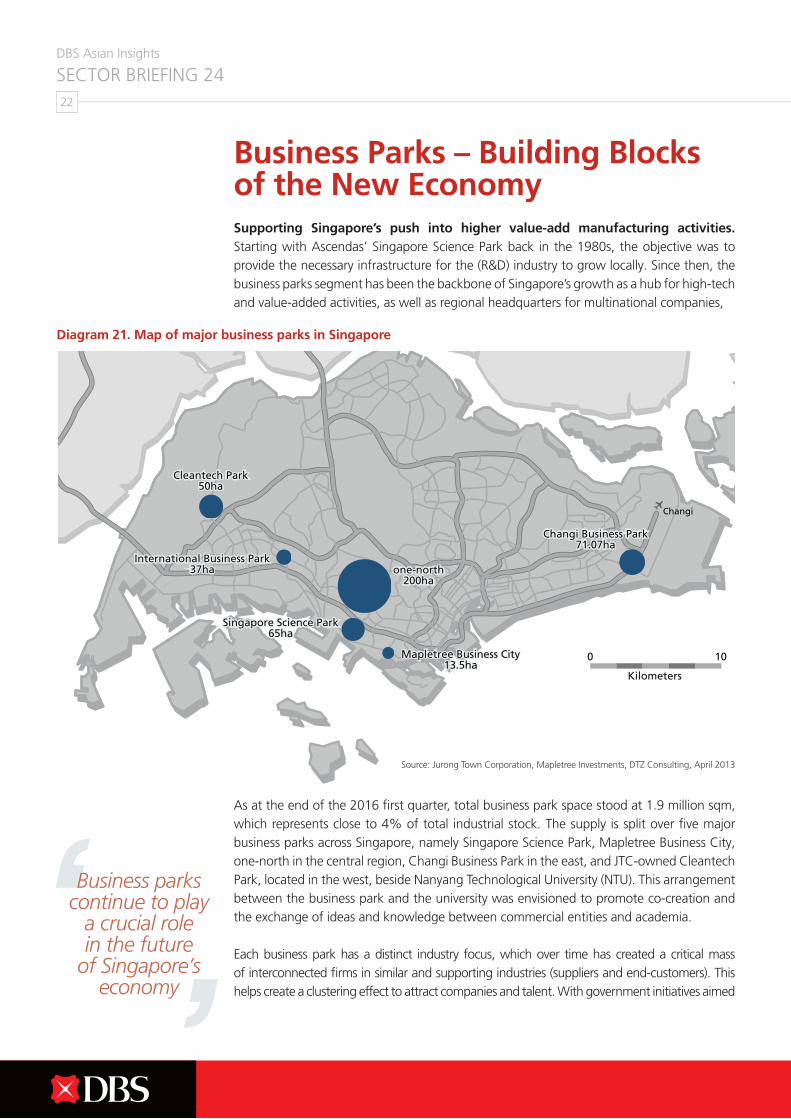
Business Parks – Building Blocks of the New EconomySupporting Singapore’s push into higher value-add manufacturing activities. Starting with Ascendas’ Singapore Science Park back in the 1980s, the objective was to provide the necessary infrastructure for the (R&D) industry to grow locally. Since then, the business parks segment has been the backbone of Singapore’s growth as a hub for high-tech and value-added activities, as well as regional headquarters for multinational companies,
As at the end of the 2016 first quarter, total business park space stood at 1.9 million sqm, which represents close to 4% of total industrial stock. The supply is split over five major business parks across Singapore, namely Singapore Science Park, Mapletree Business City, one-north in the central region, Changi Business Park in the east, and JTC-owned Cleantech Park, located in the west, beside Nanyang Technological University (NTU). This arrangement between the business park and the university was envisioned to promote co-creation and the exchange of ideas and knowledge between commercial entities and academia.
Each business park has a distinct industry focus, which over time has created a critical mass of interconnected firms in similar and supporting industries (suppliers and end-customers). This helps create a clustering effect to attract companies and talent. With government initiatives aimed
Diagram 21. Map of major business parks in Singapore
Changi
0
Kilometers
10
one-north200ha
Mapletree Business City13.5ha
Singapore Science Park65ha
International Business Park37ha
Cleantech Park50ha
Changi Business Park71.07ha
one-north200ha
Mapletree Business City13.5ha
Singapore Science Park65ha
International Business Park37ha
Cleantech Park50ha
Changi Business Park71.07ha
Source: Jurong Town Corporation, Mapletree Investments, DTZ Consulting, April 2013
Business parks continue to play
a crucial role in the future
of Singapore’s economy
DBS Asian Insights SECTOR BRIEFING 24
23
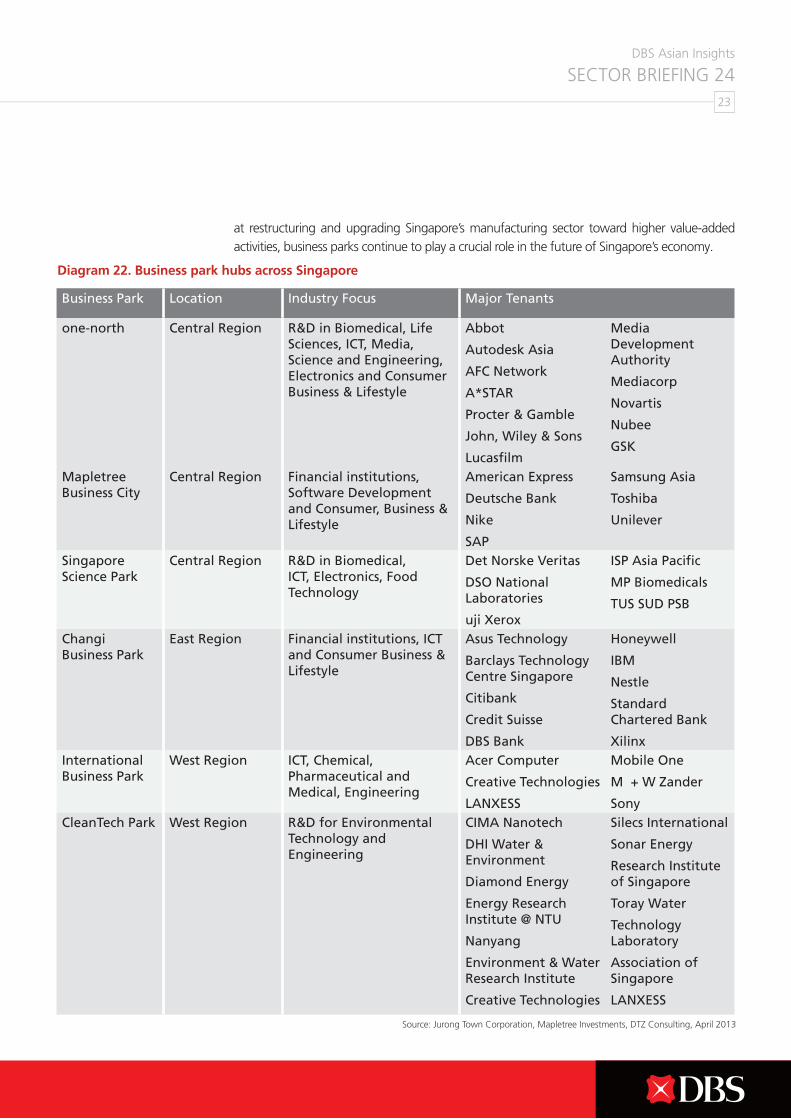
at restructuring and upgrading Singapore’s manufacturing sector toward higher value-added activities, business parks continue to play a crucial role in the future of Singapore’s economy.
Source: Jurong Town Corporation, Mapletree Investments, DTZ Consulting, April 2013
Business Park Location Industry Focus Major Tenants
one-north Central Region R&D in Biomedical, Life Sciences, ICT, Media, Science and Engineering, Electronics and Consumer Business & Lifestyle
Abbot
Autodesk Asia
AFC Network
A*STAR
Procter & Gamble
John, Wiley & Sons
Lucasfilm
Media Development Authority
Mediacorp
Novartis
Nubee
GSK
Mapletree Business City
Central Region Financial institutions, Software Development and Consumer, Business & Lifestyle
American Express
Deutsche Bank
Nike
SAP
Samsung Asia
Toshiba
Unilever
Singapore Science Park
Central Region R&D in Biomedical, ICT, Electronics, Food Technology
Det Norske Veritas
DSO National Laboratories
uji Xerox
ISP Asia Pacific
MP Biomedicals
TUS SUD PSB
Changi Business Park
East Region Financial institutions, ICT and Consumer Business & Lifestyle
Asus Technology
Barclays Technology Centre Singapore
Citibank
Credit Suisse
DBS Bank
Honeywell
IBM
Nestle
Standard Chartered Bank
XilinxInternational Business Park
West Region ICT, Chemical, Pharmaceutical and Medical, Engineering
Acer Computer
Creative Technologies
LANXESS
Mobile One
M + W Zander
SonyCleanTech Park West Region R&D for Environmental
Technology and Engineering
CIMA Nanotech
DHI Water & Environment
Diamond Energy
Energy Research Institute @ NTU
Nanyang
Environment & Water Research Institute
Creative Technologies
Silecs International
Sonar Energy
Research Institute of Singapore
Toray Water
Technology Laboratory
Association of Singapore
LANXESS
Diagram 22. Business park hubs across Singapore
DBS Asian Insights SECTOR BRIEFING 2424
Business Parks of the Future
With the government leading the way in setting the vision for the business park segment, we see existing infrastructure being built upon, intensifying use of of existing business park clusters or even new ones being brought in.
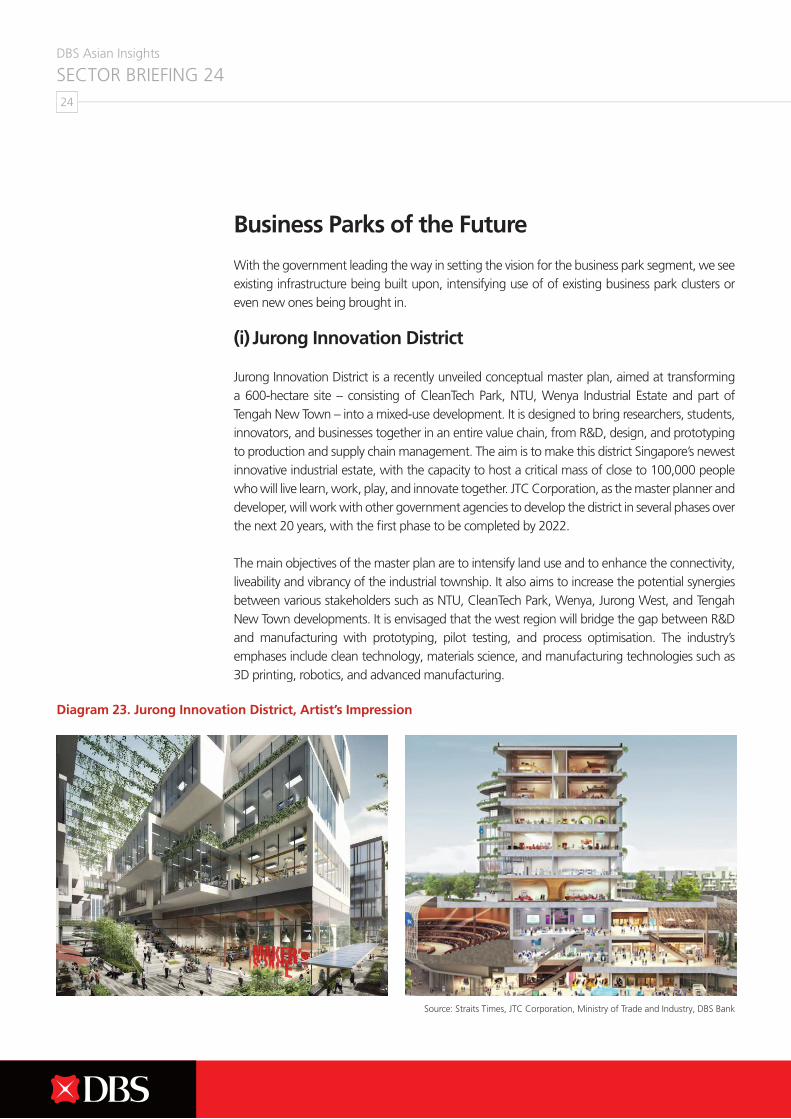
(i) Jurong Innovation District
Jurong Innovation District is a recently unveiled conceptual master plan, aimed at transforming a 600-hectare site – consisting of CleanTech Park, NTU, Wenya Industrial Estate and part of Tengah New Town – into a mixed-use development. It is designed to bring researchers, students, innovators, and businesses together in an entire value chain, from R&D, design, and prototyping to production and supply chain management. The aim is to make this district Singapore’s newest innovative industrial estate, with the capacity to host a critical mass of close to 100,000 people who will live learn, work, play, and innovate together. JTC Corporation, as the master planner and developer, will work with other government agencies to develop the district in several phases over the next 20 years, with the first phase to be completed by 2022.
The main objectives of the master plan are to intensify land use and to enhance the connectivity, liveability and vibrancy of the industrial township. It also aims to increase the potential synergies between various stakeholders such as NTU, CleanTech Park, Wenya, Jurong West, and Tengah New Town developments. It is envisaged that the west region will bridge the gap between R&D and manufacturing with prototyping, pilot testing, and process optimisation. The industry’s emphases include clean technology, materials science, and manufacturing technologies such as 3D printing, robotics, and advanced manufacturing.
Diagram 23. Jurong Innovation District, Artist’s Impression
Source: Straits Times, JTC Corporation, Ministry of Trade and Industry, DBS Bank
DBS Asian Insights SECTOR BRIEFING 24
25
(i) Entrenching existing clusters
The vision of the future is to have the business park segment build on existing infrastructure and infuse other elements of the “work-live-play” concept that the government is trying to promote.
one-north Business Park
one-north is a 200-hectare R&D hub at Buona Vista developed by JTC. The hub currently houses a vibrant community of research institutes and companies in the fields of biomedical sciences, infocomm technology, science and engineering, and media. For instance, A*STAR set up the Diagnostics Development Hub at Biopolis to accelerate local development and production of medical diagnostic devices; and Japanese drug giant Takeda Pharmaceutical Company opened its new office housing the headquarters of its emerging markets business unit, its regional R&D centre, and its vaccine business unit. Several new property projects that have been completed recently in the area include Fusionopolis Two by JTC, Galaxis at Fusionopolis by Ascendas, and BASF Learning Campus at Rochester Park, which is a hub for regional leadership development and business-related programmes.
Singapore Science Park
One of the earliest business parks built in the early stages of Singapore’s economic expansion during the 1980s, Science Park is due for redevelopment and rejuvenation. This will allow it to cater to the evolving needs of companies that are looking to set up operations there. Since 2014, we have seen some major redevelopments – largely built-to-suit solutions for companies like Avaya, Thomson Reuters, DNV, etc., which implies that the Singapore Science Park remains one of the key locations for R&D and technology companies to set up operations. We believe that the new Science Park will include supporting amenities like F&B outlets and, potentially, even accommodation to serve the mass of workers within the park. With improved accessibility thanks to the recent completion of Kent Ridge MRT Station and Circle Line, we believe that the outlook for Singapore Science Park remains bright.
Mapletree Business City
Located in the Alexandra Precinct, which is just 15 minutes away from the Central Business District, the Mapletree Business City integrated development consists of over 200,000 sqm of business park and office space. It currently houses a hotbed of firms in industries such as finance, software development, as well as consumer, business and lifestyle services. Nearby properties, which include Alexandra Technopark, HP Building and Alexandra Point, are likely to see redevelopment in the medium term.
DBS Asian Insights SECTOR BRIEFING 2426
Competition to Intensify with Tight Supply
Looking ahead, close to 50,000 sqm of space is under construction and slated to be completed in the coming years. A recently completed project is Mapletree Business City phase II (MBC II), a 120,000 sqm multi-user business park development. MBC II is off to a good start as tech giant Google has secured 25,000 sqm while medical equipment supply company Covidien has leased 5,200 sqm.
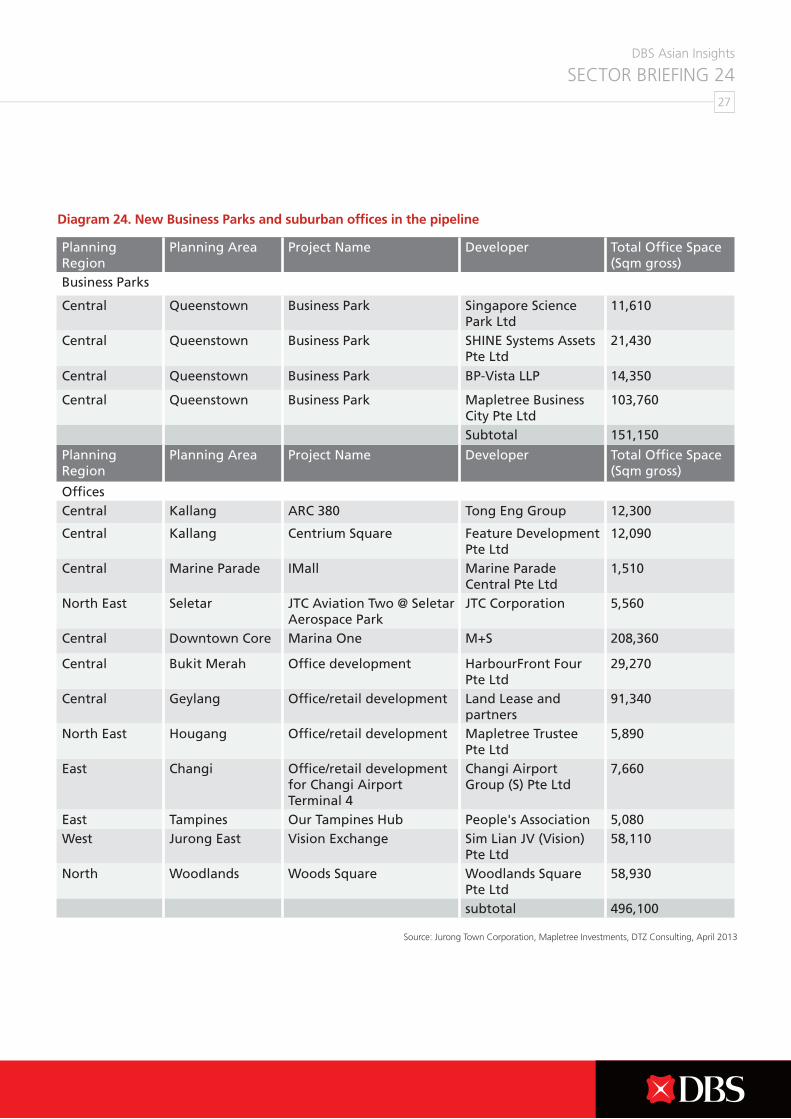
However, we believe that competition in the space is intensifying with the increase in suburban office space. The latter is concentrated in Paya Lebar, Jurong Lake District, and Woodlands, with close to 496,100 sqm that could compete for tenants who might be considering offices in de-centralised locations.
Despite falling office rents in the Central Business District over 2015, we have seen business park rents remain fairly stable. Vacancy rates have been declining steadily over the past few quarters, as completed buildings fill up about 15% of available space as at the 2016 first quarter. This is expected to have a positive impact on rents going forward.
In addition, the differential in rents between business parks (off-central and rest of island) compared to Grade-A offices remains above the historical averages of 50% and 60%, respectively. This means that firms will continue to find it economical to move operations to business parks.
Vacancy rates have been declining steadily
DBS Asian Insights SECTOR BRIEFING 24
27
Source: Jurong Town Corporation, Mapletree Investments, DTZ Consulting, April 2013
Planning Region
Planning Area Project Name Developer Total Office Space (Sqm gross)
Business Parks
Central Queenstown Business Park Singapore Science Park Ltd
11,610
Central Queenstown Business Park SHINE Systems Assets Pte Ltd
21,430
Central Queenstown Business Park BP-Vista LLP 14,350
Central Queenstown Business Park Mapletree Business City Pte Ltd
103,760
Subtotal 151,150
Planning Region
Planning Area Project Name Developer Total Office Space (Sqm gross)
OfficesCentral Kallang ARC 380 Tong Eng Group 12,300
Central Kallang Centrium Square Feature Development Pte Ltd
12,090
Central Marine Parade IMall Marine Parade Central Pte Ltd
1,510
North East Seletar JTC Aviation Two @ Seletar Aerospace Park
JTC Corporation 5,560
Central Downtown Core Marina One M+S 208,360
Central Bukit Merah Office development HarbourFront Four Pte Ltd
29,270
Central Geylang Office/retail development Land Lease and partners
91,340
North East Hougang Office/retail development Mapletree Trustee Pte Ltd
5,890
East Changi Office/retail development for Changi Airport Terminal 4
Changi Airport Group (S) Pte Ltd
7,660
East Tampines Our Tampines Hub People's Association 5,080West Jurong East Vision Exchange Sim Lian JV (Vision)
Pte Ltd58,110
North Woodlands Woods Square Woodlands Square Pte Ltd
58,930
subtotal 496,100
Diagram 24. New Business Parks and suburban offices in the pipeline
DBS Asian Insights SECTOR BRIEFING 2428
Urban Renewals to Refresh Factory Space Urban renewal of space into hi-tech factories to attract multinational corporations.
Investment in data centres: Conversion of selected properties into data centres.
Conversion and upgrading of warehouse facilities to intensify land use.
E-commerce and F&B sectors could see growing demand while transhipment volumes may decline.
Urban Renewal of Industrial Real Estate
We believe that that it is timely for industrial landlords to consider a renewal of their portfolio to tackle the challenges faced by Singapore’s manufacturing sector.
We see a structural decline due to lower demand for multi-user factories (general manufacturing).
We believe that factory space will continue to face the brunt of the current manufacturing slowdown, which, in our view, is both a cyclical and structural decline. Looking ahead, we expect to see a continued cutback in space requirements as firms undergo consolidation, especially those in the oil and gas and general manufacturing sectors. We expect this to cascade down to supporting industries as demand winds down. In the coming years, we see a structural fall in demand for the multi-user and single-user factories that cater to general manufacturing activities.
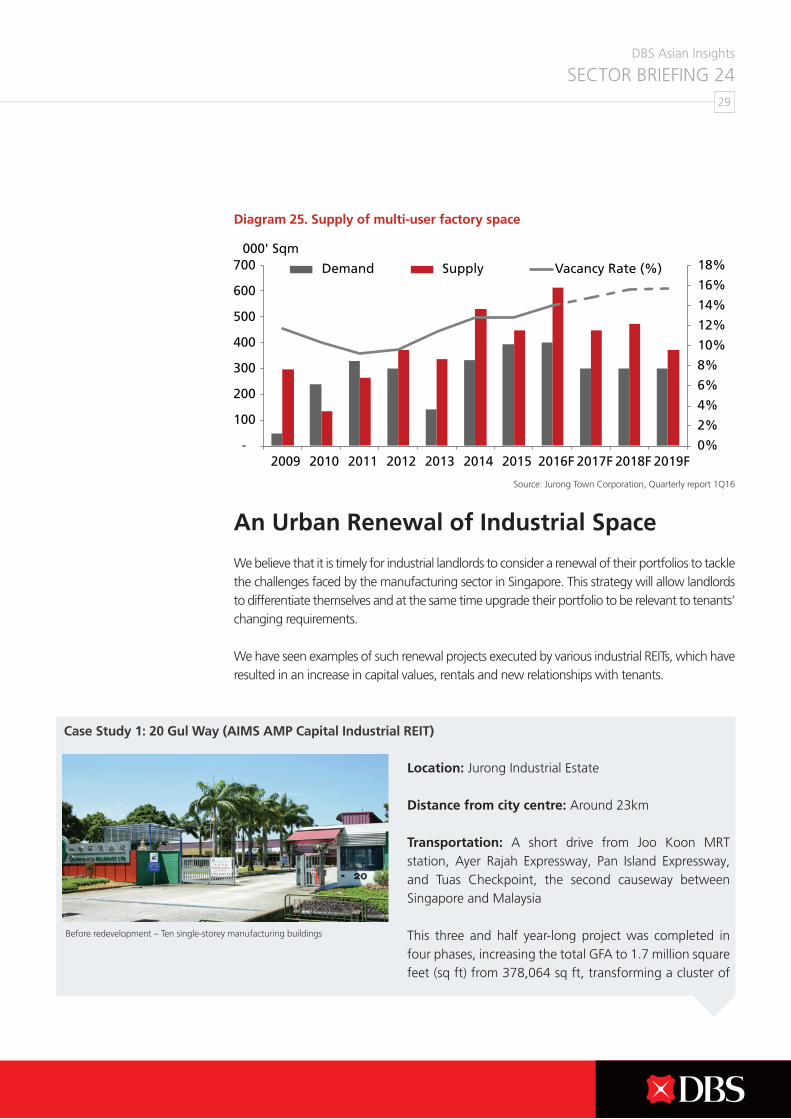
The situation is made worse with close to 1.8 million sqm of new factory space completing between 2016 and 2019, representing an 18% increase in multi-user factory space. According to the URA, close to 55% of this space under construction or planning is scheduled for completion between 2016 and 2018. This implies an annual completion rate of around 500,000 sqm. This is nearly 40% higher than the annual supply completion (of around 350,000 sqm per annum) and absorption rate (300,000 sqm per annum) observed over the past five years.
Therefore, this will likely result in high vacancy rates, to the tune of 14-15%, creating an overhang on rentals going forward.
A structural fall in demand for multi-user and single-user factories
DBS Asian Insights SECTOR BRIEFING 24
29
An Urban Renewal of Industrial Space
We believe that it is timely for industrial landlords to consider a renewal of their portfolios to tackle the challenges faced by the manufacturing sector in Singapore. This strategy will allow landlords to differentiate themselves and at the same time upgrade their portfolio to be relevant to tenants’ changing requirements.
We have seen examples of such renewal projects executed by various industrial REITs, which have resulted in an increase in capital values, rentals and new relationships with tenants.
Location: Jurong Industrial Estate
Distance from city centre: Around 23km
Transportation: A short drive from Joo Koon MRT station, Ayer Rajah Expressway, Pan Island Expressway, and Tuas Checkpoint, the second causeway between Singapore and Malaysia
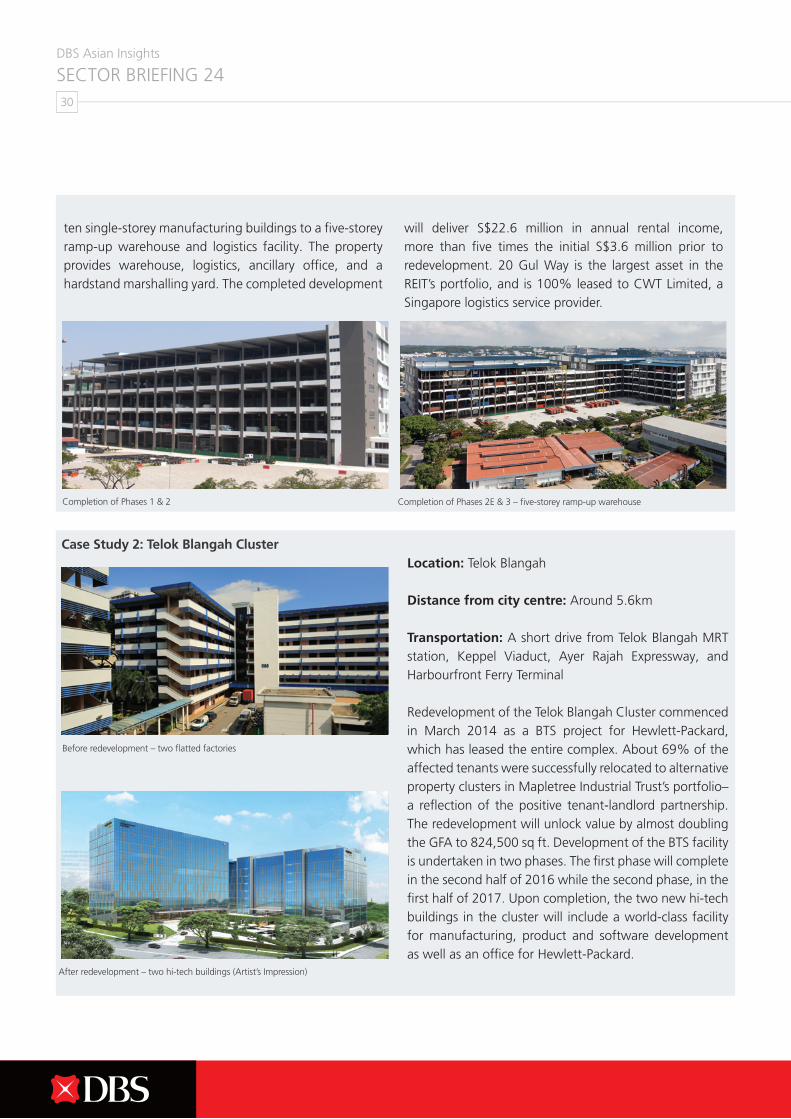
This three and half year-long project was completed in four phases, increasing the total GFA to 1.7 million square feet (sq ft) from 378,064 sq ft, transforming a cluster of
Diagram 25. Supply of multi-user factory space
Source: Jurong Town Corporation, Quarterly report 1Q16
Before redevelopment – Ten single-storey manufacturing buildings
Case Study 1: 20 Gul Way (AIMS AMP Capital Industrial REIT)
DBS Asian Insights SECTOR BRIEFING 2430
ten single-storey manufacturing buildings to a five-storey ramp-up warehouse and logistics facility. The property provides warehouse, logistics, ancillary office, and a hardstand marshalling yard. The completed development
will deliver S$22.6 million in annual rental income, more than five times the initial S$3.6 million prior to redevelopment. 20 Gul Way is the largest asset in the REIT’s portfolio, and is 100% leased to CWT Limited, a Singapore logistics service provider.
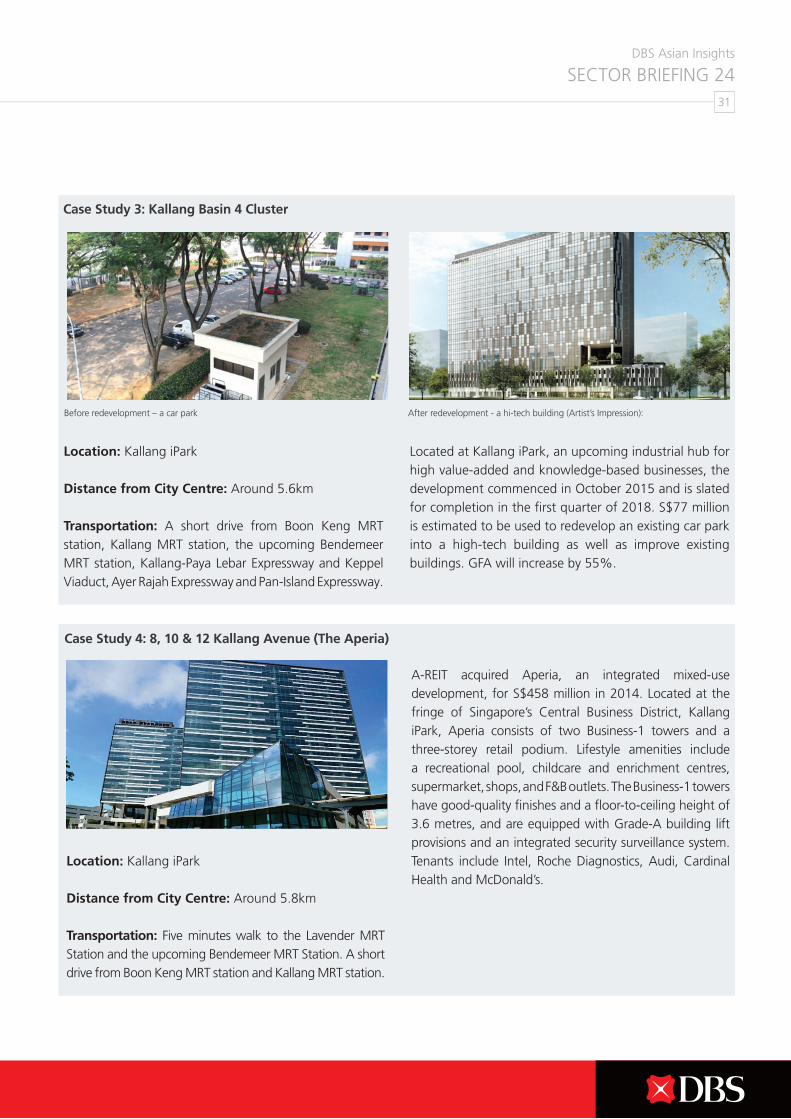
Completion of Phases 1 & 2
Before redevelopment – two flatted factories
After redevelopment – two hi-tech buildings (Artist’s Impression)
Location: Telok Blangah
Distance from city centre: Around 5.6km
Transportation: A short drive from Telok Blangah MRT station, Keppel Viaduct, Ayer Rajah Expressway, and Harbourfront Ferry Terminal
Redevelopment of the Telok Blangah Cluster commenced in March 2014 as a BTS project for Hewlett-Packard, which has leased the entire complex. About 69% of the affected tenants were successfully relocated to alternative property clusters in Mapletree Industrial Trust’s portfolio– a reflection of the positive tenant-landlord partnership. The redevelopment will unlock value by almost doubling the GFA to 824,500 sq ft. Development of the BTS facility is undertaken in two phases. The first phase will complete in the second half of 2016 while the second phase, in the first half of 2017. Upon completion, the two new hi-tech buildings in the cluster will include a world-class facility for manufacturing, product and software development as well as an office for Hewlett-Packard.
Case Study 2: Telok Blangah Cluster
Completion of Phases 2E & 3 – five-storey ramp-up warehouse
DBS Asian Insights SECTOR BRIEFING 24
31
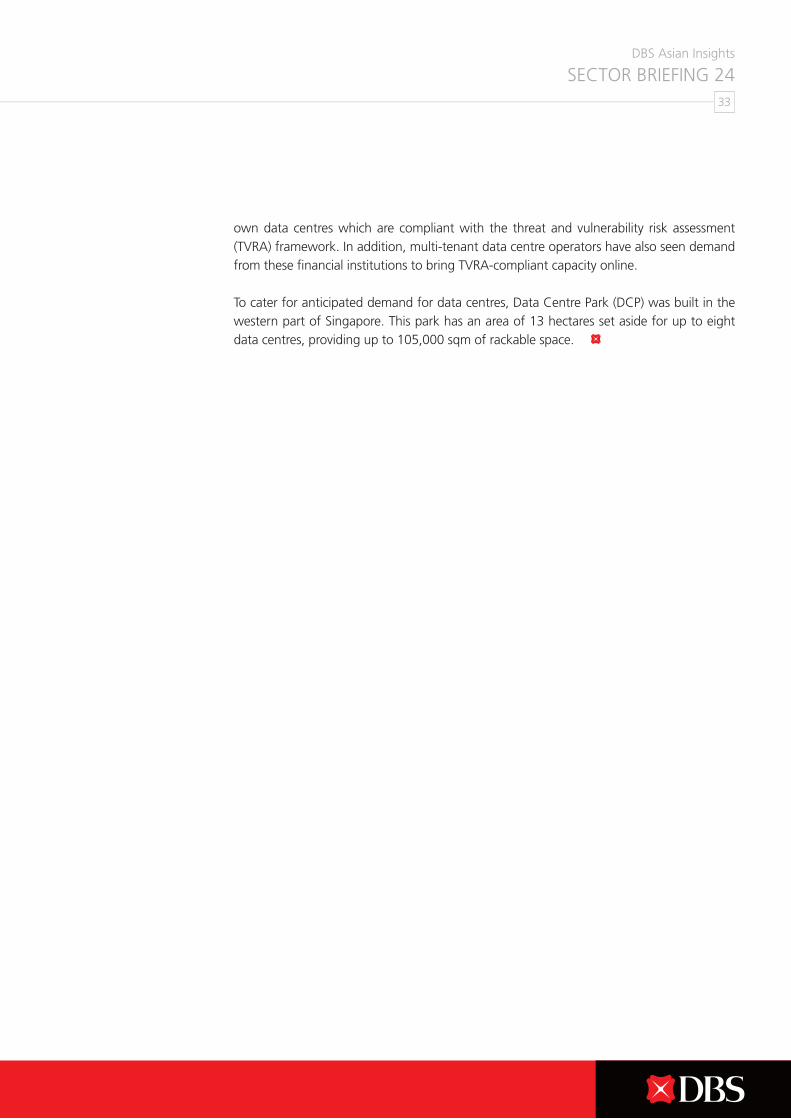
Before redevelopment – a car park After redevelopment - a hi-tech building (Artist’s Impression):
Location: Kallang iPark
Distance from City Centre: Around 5.6km
Transportation: A short drive from Boon Keng MRT station, Kallang MRT station, the upcoming Bendemeer MRT station, Kallang-Paya Lebar Expressway and Keppel Viaduct, Ayer Rajah Expressway and Pan-Island Expressway.
Located at Kallang iPark, an upcoming industrial hub for high value-added and knowledge-based businesses, the development commenced in October 2015 and is slated for completion in the first quarter of 2018. S$77 million is estimated to be used to redevelop an existing car park into a high-tech building as well as improve existing buildings. GFA will increase by 55%.
Location: Kallang iPark
Distance from City Centre: Around 5.8km
Transportation: Five minutes walk to the Lavender MRT Station and the upcoming Bendemeer MRT Station. A short drive from Boon Keng MRT station and Kallang MRT station.
A-REIT acquired Aperia, an integrated mixed-use development, for S$458 million in 2014. Located at the fringe of Singapore’s Central Business District, Kallang iPark, Aperia consists of two Business-1 towers and a three-storey retail podium. Lifestyle amenities include a recreational pool, childcare and enrichment centres, supermarket, shops, and F&B outlets. The Business-1 towers have good-quality finishes and a floor-to-ceiling height of 3.6 metres, and are equipped with Grade-A building lift provisions and an integrated security surveillance system. Tenants include Intel, Roche Diagnostics, Audi, Cardinal Health and McDonald’s.
Case Study 3: Kallang Basin 4 Cluster
Case Study 4: 8, 10 & 12 Kallang Avenue (The Aperia)

DBS Asian Insights SECTOR BRIEFING 2432
New Clusters of Focus
Seletar Aerospace Park
Seletar Aerospace Park (SAP) continues to attract major players and SMEs in the aerospace industry. Jet Aviation Asia Pacific opened its new hangar facility next to its existing hangar to serve the growing demand for large, long-range business jets in the region. Turbomeca, a subsidiary of Safran Group, will be moving from its Loyang premises to its newly expanded facility at SAP in 2016 – the new premises will house its marketing, sales and technical support teams as well as its regional training centre. Matcor, a local SME, took up a unit at JTC aeroSpace (Phase 1) to set up a new laboratory and workshop. JEP Precision Engineering, another home-grown company, will build its new facility to improve productivity. And Airbus and Singapore Airlines also took up land after signing an agreement to jointly develop a new flight training centre, Airbus Asia Training Centre.
Tuas Biomedical Park
Tuas Biomedical Park is JTC’s dedicated hub for global pharmaceutical and biotechnology companies. Many of the world’s leading biomedical sciences companies have chosen this place as a key base, such as Mead Johnson Nutrition for its new production and research campus supplying key paediatric nutritional ingredients and products to a number of fast-growing Asian markets; Abbott Nutrition for its Asia Pilot Plant to produce prototypes and formulations tailored to the preferences of Asian consumers; Amgen, an American biopharmaceutical company, for its next generation bio-manufacturing plant that produces drug substances used to treat osteoporosis and bone-related disorders in cancer patients; and Alcon, a global leader in eye care, for its new state-of-the-art manufacturing facility to produce ophthalmic pharmaceutical products to address eye conditions.
Data centres
According to Cushman & Wakefield, Singapore continues to be one of Asia’s top data centre markets with an active supply pipeline and demand from both local and international companies. This is mainly due to Singapore’s strong intellectual property rights, legal system and enforcement, connectivity and high-quality infrastructure, which help Singapore rank as a top market.
We continue to see strong demand for data centres, especially multi-tenanted data centres, driven by Singapore’s Smart Nation initiative. Financial institutions are the largest data centre customers in Singapore, according to Keppel DC REIT. This is because of the Monetary Authority of Singapore’s mandate that financial institutions must comply with the updated technology risk management guidelines, resulting in many banks building their
DBS Asian Insights SECTOR BRIEFING 24
33
own data centres which are compliant with the threat and vulnerability risk assessment (TVRA) framework. In addition, multi-tenant data centre operators have also seen demand from these financial institutions to bring TVRA-compliant capacity online.
To cater for anticipated demand for data centres, Data Centre Park (DCP) was built in the western part of Singapore. This park has an area of 13 hectares set aside for up to eight data centres, providing up to 105,000 sqm of rackable space.
DBS Asian Insights SECTOR BRIEFING 2434
Warehouse Segment to Face RisksGiven how land-scarce Singapore is, the warehouse sub-segment remains a tightly held and controlled segment of the industrial market. Over the past few years, warehouses have changed from being a largely passive property type to large-scale ramp-up warehouses, resulting in efficiency gains for users and industrial landlords, due to the intensification of land use. Warehouses are now increasingly sophisticated, and integrated better with the operations of end-users.
One of the main drivers for this change is e-commerce; distribution centres are now using more automation and robotics. This is a result of 3PLs becoming more sophisticated in how they move goods through their distribution channels.
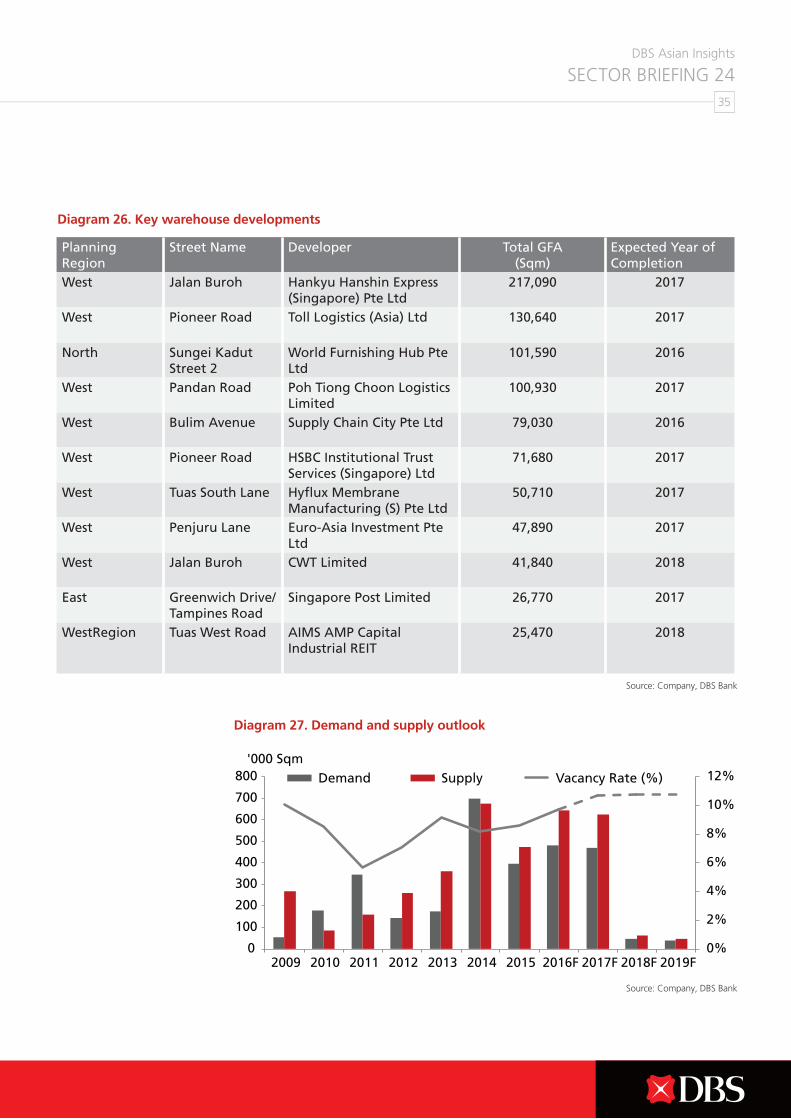
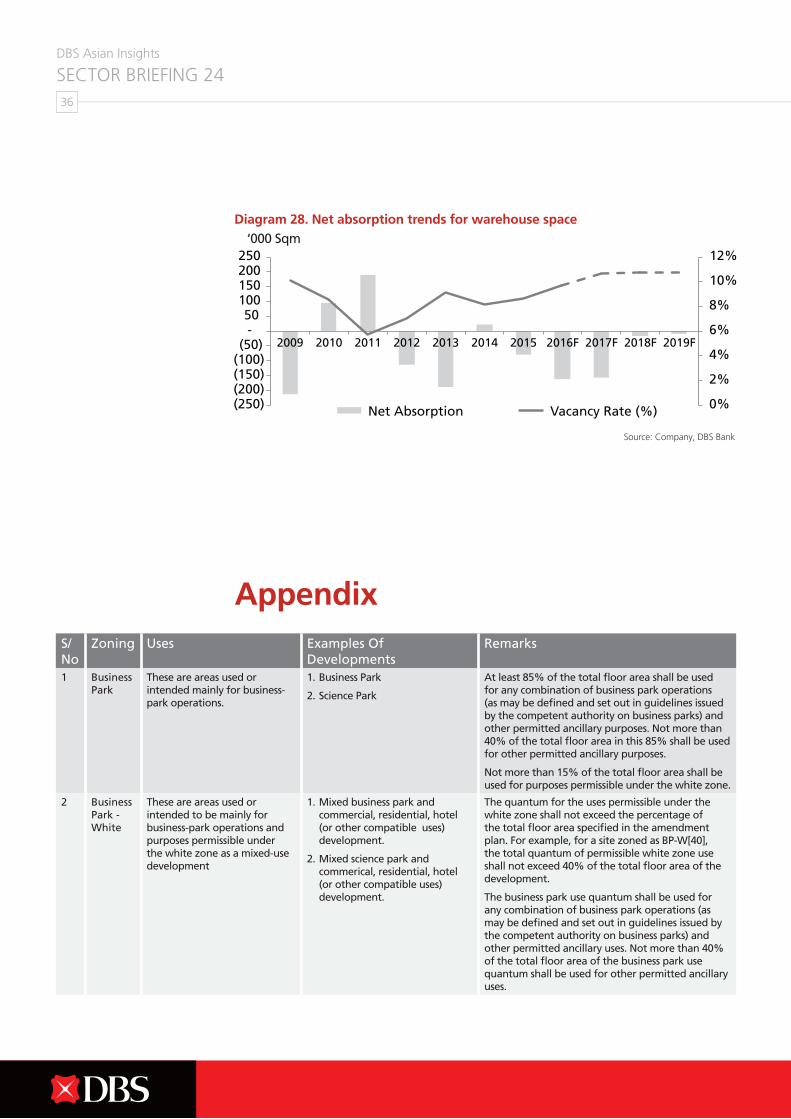
Warehouse space: Vacancy rates to hit 10%; risk in the shadow space. Close to 1.9 million sqm of space will be completed over 2016 to 2019, representing a 12% increase in warehouse space. Based on URA’s estimates, around 55% of the space under construction or planning is scheduled for completion by 2016 to 2018, implying an annual completion rate of around 500,000 sqm. This is nearly 40% higher than the annual supply completion (around 350,000 sqm per annum) and absorption (300,000 sqm per annum) observed over the past five years.
Apart from selected developments from industrial REITs and developers, which may be more speculative in nature, we found that a majority of warehouse developments are by end-users, which we believe are for expansion needs or for consolidation of space for efficiency reasons. This will mean that while new warehouse developments are likely to be mainly pre-committed, it will be at the expense of rising shadow space from the industry. This continued trend of space consolidation within the warehouse space will be the main risk to rentals.
As such, given the continued increase in supply over 2016 to 2018, we believe that occupancy rates will dip around 2 percentage points to 90% by the end of 2018, from 92% as of the 2015 second quarter. Rents are expected to dip by 5% in 2016, and 3% in 2017.
Opportunities to stay ahead of peers. When leases are due for renewal, subject to feasibility studies, we have seen landlords upgrade existing warehouses to meet the changing needs of end-users. Apart from typical end-users in the 3PLs space, we believe that new and emerging demand drivers will come from companies in F&B, fast moving consumer goods, and e-commerce, which will drive growth in the medium term.
New warehouse developments are likely to be mainly
pre-committed
DBS Asian Insights SECTOR BRIEFING 24
35
Source: Company, DBS Bank
Source: Company, DBS Bank
Planning Region
Street Name Developer Total GFA (Sqm)
Expected Year of Completion
West Jalan Buroh Hankyu Hanshin Express (Singapore) Pte Ltd
217,090 2017
West Pioneer Road Toll Logistics (Asia) Ltd 130,640 2017
North Sungei Kadut Street 2
World Furnishing Hub Pte Ltd
101,590 2016
West Pandan Road Poh Tiong Choon Logistics Limited
100,930 2017
West Bulim Avenue Supply Chain City Pte Ltd 79,030 2016
West Pioneer Road HSBC Institutional Trust Services (Singapore) Ltd
71,680 2017
West Tuas South Lane Hyflux Membrane Manufacturing (S) Pte Ltd
50,710 2017
West Penjuru Lane Euro-Asia Investment Pte Ltd
47,890 2017
West Jalan Buroh CWT Limited 41,840 2018
East Greenwich Drive/Tampines Road
Singapore Post Limited 26,770 2017
WestRegion Tuas West Road AIMS AMP Capital Industrial REIT
25,470 2018
Diagram 26. Key warehouse developments
Diagram 27. Demand and supply outlook
DBS Asian Insights SECTOR BRIEFING 2436
Source: Company, DBS Bank
Diagram 28. Net absorption trends for warehouse space
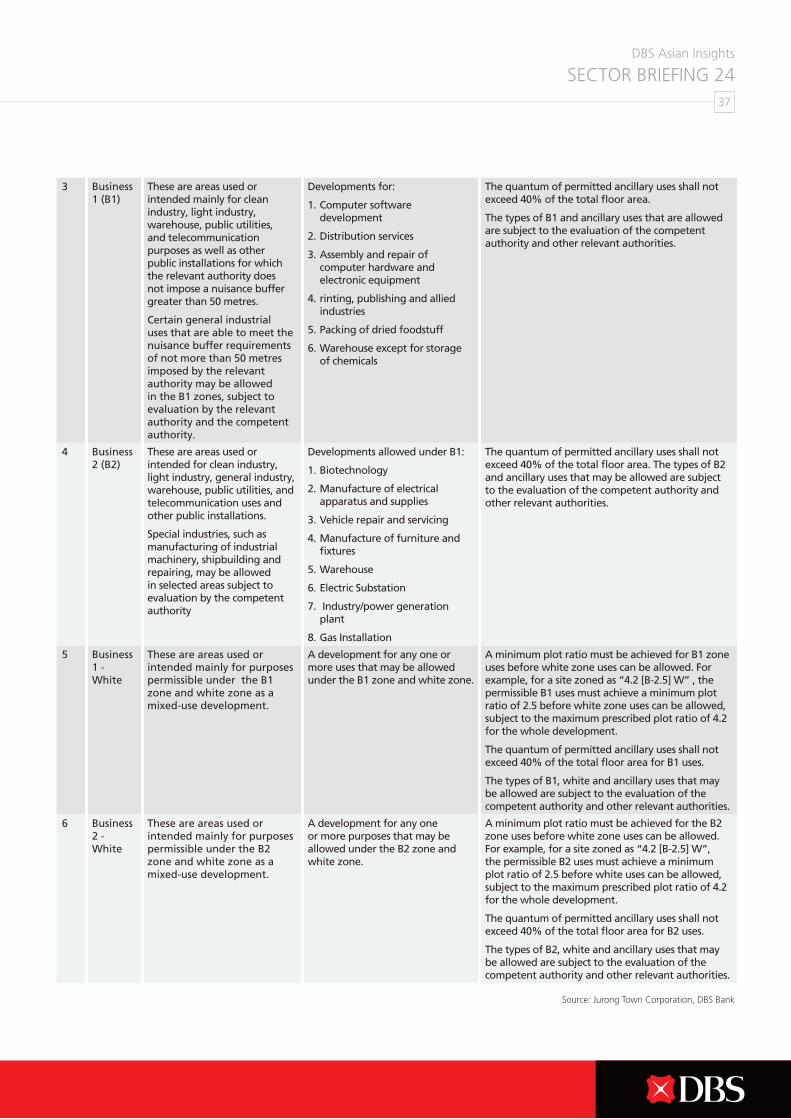
Appendix S/No
Zoning Uses Examples Of Developments
Remarks
1 Business Park
These are areas used or intended mainly for business-park operations.
1. Business Park
2. Science Park
At least 85% of the total floor area shall be used for any combination of business park operations (as may be defined and set out in guidelines issued by the competent authority on business parks) and other permitted ancillary purposes. Not more than 40% of the total floor area in this 85% shall be used for other permitted ancillary purposes.
Not more than 15% of the total floor area shall be used for purposes permissible under the white zone.
2 Business Park - White
These are areas used or intended to be mainly for business-park operations and purposes permissible under the white zone as a mixed-use development
1. Mixed business park and commercial, residential, hotel (or other compatible uses) development.
2. Mixed science park and commerical, residential, hotel (or other compatible uses) development.
The quantum for the uses permissible under the white zone shall not exceed the percentage of the total floor area specified in the amendment plan. For example, for a site zoned as BP-W[40], the total quantum of permissible white zone use shall not exceed 40% of the total floor area of the development.
The business park use quantum shall be used for any combination of business park operations (as may be defined and set out in guidelines issued by the competent authority on business parks) and other permitted ancillary uses. Not more than 40% of the total floor area of the business park use quantum shall be used for other permitted ancillary uses.
‘000 Sqm
DBS Asian Insights SECTOR BRIEFING 24
37
Source: Jurong Town Corporation, DBS Bank
Diagram 28. Net absorption trends for warehouse space
3 Business 1 (B1)
These are areas used or intended mainly for clean industry, light industry, warehouse, public utilities, and telecommunication purposes as well as other public installations for which the relevant authority does not impose a nuisance buffer greater than 50 metres.
Certain general industrial uses that are able to meet the nuisance buffer requirements of not more than 50 metres imposed by the relevant authority may be allowed in the B1 zones, subject to evaluation by the relevant authority and the competent authority.
Developments for:
1. Computer software development
2. Distribution services
3. Assembly and repair of computer hardware and electronic equipment
4. rinting, publishing and allied industries
5. Packing of dried foodstuff
6. Warehouse except for storage of chemicals
The quantum of permitted ancillary uses shall not exceed 40% of the total floor area.
The types of B1 and ancillary uses that are allowed are subject to the evaluation of the competent authority and other relevant authorities.
4 Business 2 (B2)
These are areas used or intended for clean industry, light industry, general industry, warehouse, public utilities, and telecommunication uses and other public installations.
Special industries, such as manufacturing of industrial machinery, shipbuilding and repairing, may be allowed in selected areas subject to evaluation by the competent authority
Developments allowed under B1:
1. Biotechnology
2. Manufacture of electrical apparatus and supplies
3. Vehicle repair and servicing
4. Manufacture of furniture and fixtures
5. Warehouse
6. Electric Substation
7. Industry/power generation plant
8. Gas Installation
The quantum of permitted ancillary uses shall not exceed 40% of the total floor area. The types of B2 and ancillary uses that may be allowed are subject to the evaluation of the competent authority and other relevant authorities.
5 Business 1 - White
These are areas used or intended mainly for purposes permissible under the B1 zone and white zone as a mixed-use development.
A development for any one or more uses that may be allowed under the B1 zone and white zone.
A minimum plot ratio must be achieved for B1 zone uses before white zone uses can be allowed. For example, for a site zoned as “4.2 [B-2.5] W” , the permissible B1 uses must achieve a minimum plot ratio of 2.5 before white zone uses can be allowed, subject to the maximum prescribed plot ratio of 4.2 for the whole development.
The quantum of permitted ancillary uses shall not exceed 40% of the total floor area for B1 uses.
The types of B1, white and ancillary uses that may be allowed are subject to the evaluation of the competent authority and other relevant authorities.
6 Business 2 - White
These are areas used or intended mainly for purposes permissible under the B2 zone and white zone as a mixed-use development.
A development for any one or more purposes that may be allowed under the B2 zone and white zone.
A minimum plot ratio must be achieved for the B2 zone uses before white zone uses can be allowed. For example, for a site zoned as “4.2 [B-2.5] W”, the permissible B2 uses must achieve a minimum plot ratio of 2.5 before white uses can be allowed, subject to the maximum prescribed plot ratio of 4.2 for the whole development.
The quantum of permitted ancillary uses shall not exceed 40% of the total floor area for B2 uses.
The types of B2, white and ancillary uses that may be allowed are subject to the evaluation of the competent authority and other relevant authorities.

DBS Asian Insights SECTOR BRIEFING 2438
DBS Asian Insights SECTOR BRIEFING 24
39
Disclaimers and Important Notices
The information herein is published by DBS Bank Ltd (the “Company”). It is based on information obtained from sources believed to be reliable, but the Company does not make any representation or warranty, express or implied, as to its accuracy, completeness, timeliness or correctness for any particular purpose. Opinions expressed are subject to change without notice. Any recommendation contained herein does not have regard to the specific investment objectives, financial situation and the particular needs of any specific addressee.
The information herein is published for the information of addressees only and is not to be taken in substitution for the exercise of judgement by addressees, who should obtain separate legal or financial advice. The Company, or any of its related companies or any individuals connected with the group accepts no liability for any direct, special, indirect, consequential, incidental damages or any other loss or damages of any kind arising from any use of the information herein (including any error, omission or misstatement herein, negligent or otherwise) or further communication thereof, even if the Company or any other person has been advised of the possibility thereof.
The information herein is not to be construed as an offer or a solicitation of an offer to buy or sell any securities, futures, options or other financial instruments or to provide any investment advice or services. The Company and its associates, their directors, officers and/or employees may have positions or other interests in, and may effect transactions in securities mentioned herein and may also perform or seek to perform broking, investment banking and other banking or financial services for these companies.
The information herein is not intended for distribution to, or use by, any person or entity in any jurisdiction or country where such distribution or use would be contrary to law or regulation.

www.dbs.com
Living, Breathing Asia