Nucleate pool boiling characteristics of Gewa-T finned …//hdl.handle.net/10945/19473...
113
Calhoun: The NPS Institutional Archive Theses and Dissertations Thesis Collection 1984 Nucleate pool boiling characteristics of Gewa-T finned surfaces in Freon-113. Pulido O., Ricardo J. Monterey, California. Naval Postgraduate School http://hdl.handle.net/10945/19473
Transcript of Nucleate pool boiling characteristics of Gewa-T finned …//hdl.handle.net/10945/19473...

Calhoun: The NPS Institutional Archive
Theses and Dissertations Thesis Collection
1984
Nucleate pool boiling characteristics of Gewa-T
finned surfaces in Freon-113.
Pulido O., Ricardo J.
Monterey, California. Naval Postgraduate School
http://hdl.handle.net/10945/19473


NAVAL POSTGRADUATE SCHOOL
Monterey, California
THESISNUCLEATE POOL BOILING CHARACTERISTICSOF GEWA-T FINNED SURFACES IN FREON-113
by
Ricardo J. Pulido 0.
September 1984
Thesis Advisor: P. J. Marto
Approved for public release; distribution unlimited
T224078


UNCLASSIFIEDSECURITY CLASSIFICATION OF THlb "AGE (Whan Data Entered)
REPORT DOCUMENTATION PAGE READ INSTRUCTIONSBEFORE COMPLETING FORM
1. REPORT NUMBER 12. GOVT ACCESSION NO 3. RECIPIENTS CATALOG -J UMBER
4. TITLE (and Subtitle)
Nucleate Pool Boiling Characteristicsof Gewa-T Finned Surfaces in Freon-113
5 TYPE O c REPORT & PERIOD COVERED
Master's Thesis;September 1984
6. PERFORMING ORG. REPORT NUMBER
7. AUTHORS; 8. CONTRACT OR GRANT NUMBERfaJ
Ricardo J. Pulido
9. PERFORMING ORGANIZATION NAME AND ADDRESS
Naval Postgraduate SchoolMonterey, California 93943
10. PROGRAM ELEMENT, PROJECT, TASKAREA & WORK UNIT NUMBERS
11. CONTROLLING OFFICE NAME AND ADDRESS
Naval Postgraduate SchoolMonterey, California 93943
12. REPORT DATE
September 19 8413. NUMBER OF PAGE:
10014. MONITORING AGENCY NAME 4 ADORESSf// dlllerent Irom Controlling Otllca) 15. SECURITY CLASS (ol thta report)
Unclassified
15«. DECLASSIFICATION. DOWNGRADINGSCHEDULE
16. DISTRIBUTION STATEMENT (ol this Reportj
Approved for public release; distribution unlimited.
17. DISTRIBUTION STATEMENT to! the abstract entered In Block 20, It dlllerent trocn Report)
18. SUPPLEMENTARY NOTES
19. KEY WOROS (Continue on reverse aide It neceaaary and Identify by block number)
Nucleate Pool Boiling
Gewa-T Finned Surfaces
20. ABSTRACT ('Continue on reverse aide it neceaaary and identity by block number)
Pool boiling heat-transfer measurements were made using sevenGewa-T copper tubes in R-113. The first tube (18-mm OD x0.75fins/mm x0.25 mm gap) was tested under three conditions:(a) plain, (b) with four shrouds and (c) with up to 5 wires (0.13
mm diameter) wrapped in the inter-fin trough area. Verifyingprior data, the shroud with longitudinal openings of 60° at the topand 8.5° at the bottom gave the best performance among the four
DD , JAN 73 1473 EDITION OF 1 NOV 65 IS OBSOLETE
S N 0102- LF- 014- 660! 1UNCLASSIFIED
SECURITY CLASSIFICATION OF THIS PAGE (When Data Bntarad)

UNCLASSIFIEDSECURITY CLASSIFICATION OF THIS PAGE (Whin Data Entatad)
#20 - ABSTRACT - (CONTINUED)
shrouds tested. This shroud increased the boiling heat-transfer coefficient by 253 percent (over the smooth tubecase) at a heat flux of 10,000 W/m 2
, while it showed onlya 18 percent increase at 100,000 W/m 2
. When wire wrapswere provided, in all cases, the heat- transfer coefficientwas improved at all heat fluxes. The use of three wiresgave the best performance with 341-percent increase inheat-transfer coefficient at 10,000 W/m 2 and a 130 percentincrease at 100,000 W/m2
.
The next three Fewa-T tubes had dimensions of 25 mm ODx 0.75 fins/mm with fin-tip gaps of 0.15, 0.25 and 0.35 mm,respectively. The last three Gewa-T tubes had the samedimensions except that the fin density was 1.02 fins/mm.For each of these fin densities, the 0.25 mm fin-tip gapproduced the best boiling performance at all heat fluxes.Also, for a given fin-tip gap, the boiling performanceincreased with increase in fin density. For a fin-tipgap of 0.25 mm, the lower fin-density tube produced an 80-percent increase, while the higher fin density tube produceda 103-percent increase in the boiling heat-transfercoefficient
.
S NO,02 ' LF• 0,4 • 660,. UNCLASSIFIED
SECURITY CLASSIFICATION OF THIS PAGEfWhw Data Entatad)
Approved for public release; distribution unlimited
Nucleate Pool Boiling Characteristicsof Gewa-T Finned Surfaces in Freon-113
by
Ricardo J. Pulido 0.Lieutenant, Colombian Navy
B.S., Escuela Naval Almirante Padilla, 1979
Submitted in partial fulfillment of therequirements for the degree of
MASTER OF SCIENCE IN MECHANICAL ENGINEERING
from the
NAVAL POSTGRADUATE SCHOOLSeptember 1984
J >
NAVAL P0STGRA1 ,OLMONTEREY, CALIFOR] 3
fcs»3
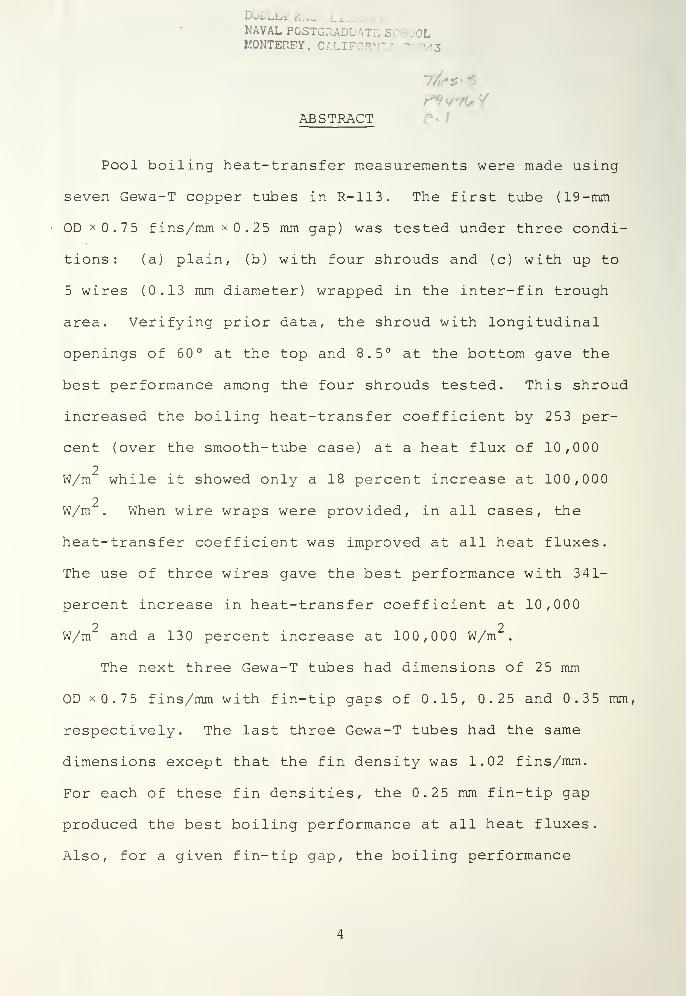
ABSTRACT
Pool boiling heat-transfer measurements were made using
seven Gewa-T copper tubes in R-113. The first tube (19-mm
OD x 0.75 fins/mm x 0.25 mm gap) was tested under three condi-
tions: (a) plain, (b) with four shrouds and (c) with up to
5 wires (0.13 mm diameter) wrapped in the inter-fin trough
area. Verifying prior data, the shroud with longitudinal
openings of 60° at the top and 8.5° at the bottom gave the
best performance among the four shrouds tested. This shroud
increased the boiling heat-transfer coefficient by 253 per-
cent (over the smooth-tube case) at a heat flux of 10,000
2W/m while it showed only a 18 percent increase at 100,000
2W/m . When wire wraps were provided, in all cases, the
heat- transfer coefficient was improved at all heat fluxes.
The use of three wires gave the best performance with 341-
percent increase in heat-transfer coefficient at 10,000
2 2W/m and a 130 percent increase at 100,000 W/m .
The next three Gewa-T tubes had dimensions of 25 mm
OD x0.75 fins/mm with fin-tip gaps of 0.15, 0.25 and 0.35 mm,
respectively. The last three Gewa-T tubes had the same
dimensions except that the fin density was 1.02 fins/mm.
For each of these fin densities, the 0.25 mm fin-tip gap
produced the best boiling performance at all heat fluxes.
Also, for a given fin-tip gap, the boiling performance

increased with increase in fin density. For a fin-tip gap
of 0.25 mm, the lower fin-density tube produced an 80-percent
increase, while the higher fin density tube produced a 103-
percent increase in the boiling heat-transfer coefficient.

1
—
TABLE OF CONTENTS
I. INTRODUCTION 13
A. BACKGROUND 13
B. THESIS OBJECTIVES 17
II. EXPERIMENTAL APPARATUS 19
A. REQUIREMENTS GOVERNING DESIGN 19
B. TEST APPARATUS 19
C. INSTRUMENTATION 24
D. CALIBRATION OF THERMOCOUPLES 24
III. EXPERIMENTAL PROCEDURES 28
A. NORMAL OPERATION 28
B. GEWA-T SURFACES 29
C. HEAT-FLUX CALCULATION 31
IV. RESULTS AND DISCUSSION 40
A. DESIGNATION OF DATA FILES 40
B. CIRCUMFERENTIAL UNIFORMITY OF HEATFLUX AROUND HEATER ELEMENT 41
C. LONGITUDINAL UNIFORMITY OF HEAT FLUXALONG THE TEST SECTION 42
D. PLOT ANALYSIS FOR PLAIN SURFACE 42
E. REPEATABILITY WITH PREVIOUS DATA 48
F. REPEATABILITY STUDY OF PRESENT WORK 48
G. BOILING PERFORMANCE OF SMOOTH TUBE 51
H. BOILING PERFORMANCE OF GEWA-T TUBESWITH SHROUDS 53
I. PERFORMANCE OF GEWA-T TUBE WITH WIREWRAPS IN INTER-FIN GAP 60

J. BOILING PERFORMANCE OF TUBE 1 WITH60° x8.5° SHROUD AND THREE WIRES 65
K. EFFECTS OF FIN-TIP GAP AND FIN DENSITYOF GEWA-T TUBES ON BOILING PERFORMANCE 6 5
V. CONCLUSIONS 78
VI. RECOMMENDATIONS 80
APPENDIX A: COMPUTER PROGRAM:
81
APPENDIX B: SAMPLE CALCULATIONS 91
A. TEST-SECTION DIMENSIONS 91
B. MEASURED PARAMETERS 91
C. PROPERTIES OF FREON-113 AT SATURATIONTEMPERATURE 92
D. HEAT-FLUX CALCULATION 92
APPENDIX C: UNCERTAINTY ANALYSIS 96
A. UNCERTAINTY IN SOURCE HEAT-TRANSFER RATE 9 6
B. UNCERTAINTY I-N SURFACE AREA 9 7
C. UNCERTAINTY IN AT 97
D. UNCERTAINTY IN HEAT FLUX 97
E. UNCERTAINTY IN BOILING HEAT-TRANSFERCOEFFICIENT 98
LIST OF REFERENCES 99
INITIAL DISTRIBUTION LIST 100

LIST OF FIGURES
1. Schematic of Test Apparatus 21
2. Thermocouple Radial and Angular Positions 22
3. Cross-Sectional View of Test Section ; 23
4. Thermocouple Calibration Curve 26
5. Optical Micrograph of Gewa-T Fin Profile, 50X 30
6. Geometry of Unenhanced Ends 33
7. Typical Nucleate Pool-Boiling Curve for aGewa-T Surface 43
8. Photograph of Gewa-T Surface at High Heat Flux 45
9. Photograph of Gewa-T Surface at Low Heat Flux 46
10. Reproducibility Test: Hernandez Run No. 3
Versus Present Work (GT1H05) 49
11. Reproducibility Test: Plain Gewa-T Tube 1 50
12. Extrapolation to Smooth Tube (23.1 mm OD) fromSmooth-Tube Data of Hernandez (19.61 mm OD) 52
13. Effect of 60° *60° Shroud on Boiling Performanceof Plain Gewa-T Tube 1 55
14. Effect of 60° x30° Shroud on Boiling Performanceof Plain Gewa-T Tube 1 56
15. Effect of 30° x30° Shroud on Boiling Performanceof Plain Gewa-T Tube 1 57
16. Effect of 60° x8.5° Shroud on Plain Gewa-TTube 1 58
17. Effect of Two Wires Wrapped in the Inter-finCavity of Tube 1 on Boiling Performance 61
18. Effect of Three Wires Wrapped in the Inter-finCavity of Tube 1 on Boiling Performance 62
19
.
Effect of Four Wires Wrapped in the Inter-finCavity of Tube 1 on Boiling Performance 63
20. Effect of Five Wires Wrapped in the Inter-finCavity of Tube 1 on Boiling Performance 64
21. Effect of Three Wires Wrapped in the Inter-finCavity with 60° *8.5° Shroud on Gewa-T Tube 1
on Boiling Performance 66
22. Boiling Performance of Gewa-T Tube 2 68
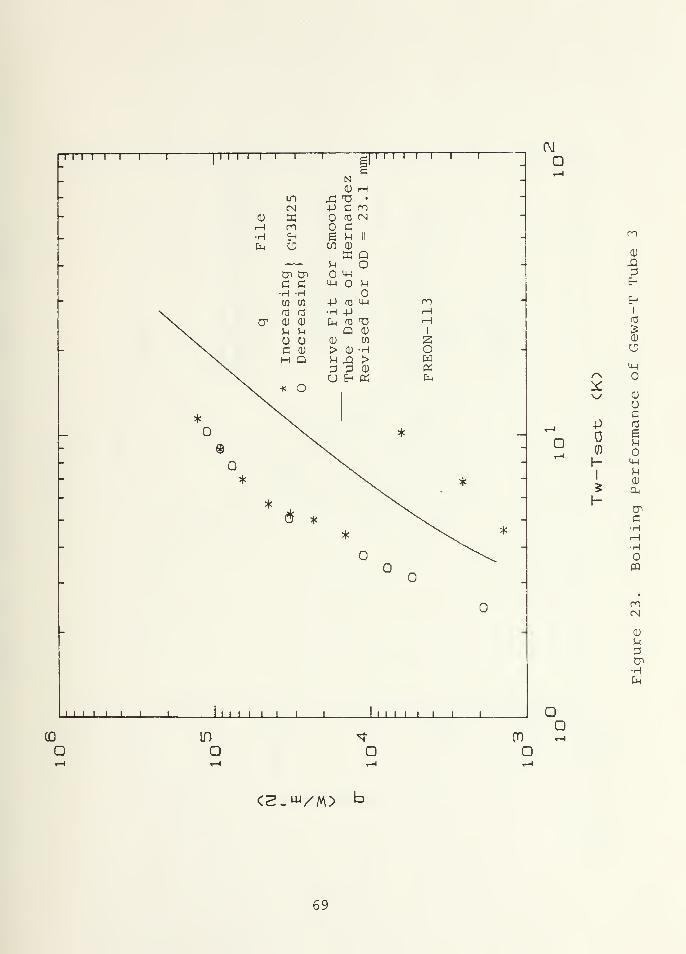
23. Boiling Performance of Gewa-T Tube 3 69
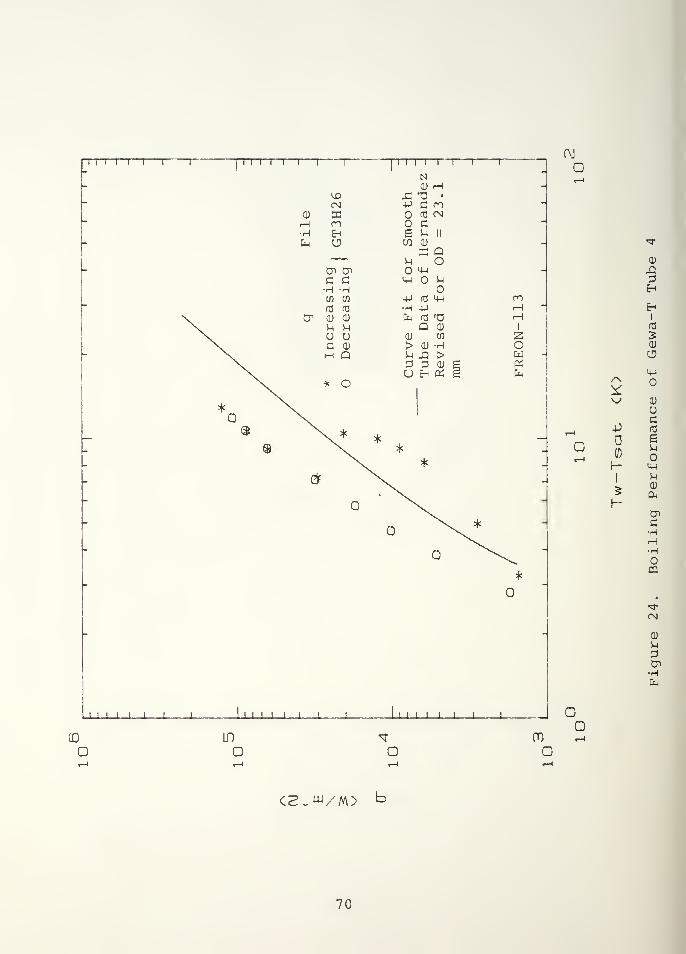
24. Boiling Performance of Gewa-T Tube 4 70
25. Boiling Performance of Gewa-T Tube 5 71
26. Boiling Performance of Gewa-T Tube 6 72
27. Boiling Performance of Gewa-T Tube 7 73
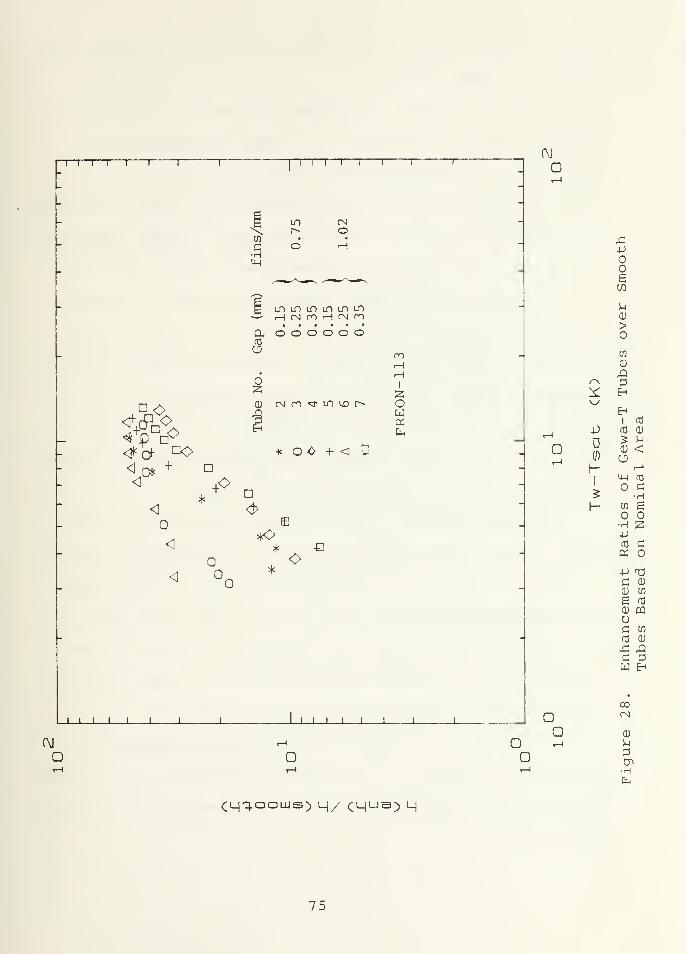
28. Enhancement Ratios of Gewa-T Tubes overSmooth Tubes Based on Nominal Area 75
29. Enhancement Ratios of Gewa-T Tubes overSmooth Tube Based on Actual Area 77

NOMENCLATURE
(T - T ) average wall superheat (K)
TD temperature at the base of the fins (°C)
T fluid saturation temperature (°C)
T average wall temperature (°C)
Qu heat- transfer rate from the cartridge heaterH
(W)
Q_ heat-transfer rate through unenhanced end (W]r
QTnqq total heat-loss rate (W)
2q heat flux from the Gewa-T surface (W/m )
_ 2h average heat- transfer coefficient (W/m .K)
k thermal conductivity of the copper (W/m.K)
k thermal conductivity of Freon-113 liquid(W/m.K)
8 volumetric thermal expansion coefficient(1/K)
2v kinematic viscosity (m /s)
2a. thermal diffusivity (m /s)
3p density of Freon-113 (kg/m
)
Nu Nussel number
Ra Rayleigh number
Pr Prandtl number
V voltage across the cartridge heater element(volts)
V-,^ voltage drop across the precision resistor(volts)
I current through the heater element (amps)
10

R resistance of the precision resistor (ohms)
O.D. outside diameter of the Gewa-T tube (m)
D, diameter at the position of the thermocouples(m)
D?
diameter at the base of the fins (m)
D outside diameter of the unenhanced ends (m)o
D inside diameter of the unenhanced ends (m)i
P outside wall perimeter of the unenhancedends (m)
H^ fin height (m)r
L length of enhanced test section (m)
L length of unenhanced ends (m)
L corrected length of unenhanced ends (m)
t tube thickness of unenhanced ends (m)
2A^ surface area at the base of the fins (m )
A cross-sectional area of tube wall at theunenhanced ends (m )
A outside surface area of the unenhanced endsb
(m2 )
2g gravitational acceleration (m/s )
11
ACKNOWLEDGMENTS
Above all, the author must thank for the continuous
encouragement he received from his wife.
For their infinite patience and accurate guidance
throughout this investigation, the author is sincerely
grateful to Dr. Paul Marto and Dr. A.S. Wanniarachchi
.
For their cooperation in furnishing samples of Gewa-T
tubing, the author wishes to thank Wieland Werke AG, West
Germany
.
12

I. INTRODUCTION
A. BACKGROUND
The energy crisis that began in 1974 has made a consider-
able impact on the design and operation of energy-conversion
devices. Today, designers are challenged to design more
and more efficient heat-transfer systems. Among the numer-
ous areas that designers are faced with this challenge,
boilers or evaporators used in many engineering applications
demand considerable attention. The use of advanced boiling
surfaces may lead to significant improvements in efficiency
and/or significant savings in the initial cost and equipment
sizes. Also, due to the ever-decreasing sizes of electronic
components, the presence of very high heat fluxes has made
the cooling of such components a challenging problem. Marto
and Lepere [Ref. 1] stated that the use of advanced boiling
surfaces may have potential promise in the field of electronic
cooling. However, the lack of generalized performance data
and useful theoretical models for such advanced surfaces
have still kept designers away from the utmost use of these
surfaces
.
Due to a lack of complete understanding, the theoretical
treatment of the nucleate pool-boiling process, even on a
smooth surface , is extremely complex. The existence of a
large number of semi-empirical formulas is probably a very
13

good indication of the complex nature of the nucleate boil-
ing process. Chongrungreon and Sauer [Ref. 2] summarized
nine(9) correlations for nucleate pool boiling of single-
component fluids from smooth tubes. They stated the inade-
quacy of any of these correlations when compared with
experimental data.
Nucleate pool boiling is strongly dependent on the sur-
face structure; i.e., the heat flux increases with increase
in stable nucleation site density. The size, shape and den-
sity of such nucleation sites are almost impossible to pre-
dict. However, the entire nucleate pool-boiling process is
dependent on the performance at these nucleation sites. It
is well known that the ability of these sites to develop and
trap small vapor bubbles is the reason for improved performance
in nucleate pool boiling in comparison with natural-convective
boiling.
When a bubble is being generated at a surface nucleation
site (or a pore) , the wall superheat is given by the follow-
ing approximate theoretical equation [Ref. 3]:
2 o TT„ - T,
pVhFG
R
Thus, for a given fluid, the wall superheat can be de-
creased (boiler performance increases with decrease in wall
superheat) with increase in pore radius. Of course, this
radius must have a practical upper limit since too large a
pore would not trap a vapor bubble.
14

Nishikawa and Ito [Ref. 4] recently discussed two methods
to augment nucleate boiling: (1) use teflon-coated pits to
reduce wettability of boiling liqud, and (2) manufacture
surfaces with numerous re-entrant cavities that have the
ability to trap vapor and keep the nucleation sites active.
Due to the high wettability of low surface-tension fluids
(such as f luorcarbons) , the use of teflon-coated pits has not
been successful. Thus, the surfaces with re-entrant- type
cavities are the viable candidates for low surface-tension
liquids
.
Taking advantage of the concept of re-entrant cavities,
a number of enhanced boiling surfaces have been invented
during the last two decades. They include the Linde High
Flux surface of Union Carbide, Gewa-T surface of Wieland
and Thermoexcel-E surface of Hitachi. All of these surfaces
are provided with re-entrant cavities through specialized
manufacturing processes. These re-entrant cavities introduce
yet more parameters to be desired.
In view of the inadequate understanding of the nucleate
pool boiling process on smooth tubes, a thorough understand-
ing of the boiling process on advanced surfaces may take
many more years to come. Thus, pbesent-day designers have
very little information when considering advanced boiling
surfaces. It is very important that researchers gather a
vast amount of experimental data covering a wide range of
heat-transfer fluids. Such extensive data will enable the
15

development of generalized correlations or successful
theoretical models.
Yilmaz, et al. [Ref. 5] compared the nucleate pool-boiling
heat- transfer performance of three copper tubes: Linde High
Flux, Wieland Gewa-T and Hitachi Thermoexcel-E . Their data
taken with p-xylene showed that while all tubes performed
better than smooth tubes, the best performance was with the
Linde High Flux surface. The Thermoexcel-E tube performed
better than the Gewa-T tube at low heat flux and both per-
formed similarly at high heat flux. These data were taken
under the fully-established boiling regime; thus, no infor-
mation was provided on the hysteresis behavior or temperature
overshoot of these surfaces.
Bergles and Chyu [Ref. 6] compared the nucleate pool-
boiling heat-transfer performance of four different Linde
High Flux tubes to a plain copper tube in distilled water and
in R-113. They used three different methods of aging the test
surface prior to collecting data. They reported significant
temperature overhsoots of both plain and High Flux surfaces
in R-113. They also reported that these overshoots were
sensitive to aging, initial subcooling and rate of power
increase.
Marto and Lepere [Ref. 1] obtained results on the heat-
transfer performance of three heat-transfer surfaces: Linde
High Flux, Thermoexcel-E, Gewa-T, and a plain copper sur-
face in R-113 and FC-72. They reported a two to tenfold
16

increase in the heat-transfer coefficient when compared to
plain surface. The High Flux surface was most effective over
a broad range of heat fluxes. The Thermoexcel-E surface
showed similar gains in heat-transfer coefficient to that
2of the High Flux surface below 10 kW/m . The Gewa-T surface
was not as effective as the other surfaces at low heat fluxes
2but performed comparably at high heat fluxes (near 100 kW/m )
Marto and Hernandez [Ref. 7] studied the boiling per-
formance of a Gewa-T finned surface in Freon-113. They
examined the influence of placing aluminum shrouds around the
test tubes, and found that the thermal performance of these
surfaces were dependent upon the liquid-vapor flow within
the channels between neighboring T-shaped fins. They also
examined the influence of the fins by progressively machining
away the fin height to arrive at a smooth cylindrical surface.
They reported that the addition of the "T-caps" to straight
fins produced the most significant improvement in heat-
transfer performance when compared to a smooth tube. The
use of shrouds increased the heat-transfer coefficient at
all practical heat fluxes, but decreased the heat- transfer
coefficient at very high heat fluxes when compared to the
unshrouded surface.
B. THESIS OBJECTIVES
Based on the foregoing discussion, the major motivation
in this work was to further study the boiling heat-transfer
performance of Gewa-T surfaces in R-113, and to attempt
17

to improve this performance through the use of further
enhancing techniques.
There were four major objectives in this thesis study:
1. Take data to verify results of Hernandez [Ref. 8] on
a standard 21.2 mm O.D. Gewa-T tube with and without shrouds
2. Use wire wraps in- the inter-fin area to improve
nucleate-boiling heat-transfer performance from Gewa-T
tubes
.
3. Take data using the combination of best shroud (found
in 1) and the best number of wire wraps (found in 2) on
Gewa-T tubes.
4. Take data to study the effect of fin-tip spacing and
fin density on the heat-transfer performance of Gewa-T
tubes
.
18

II. EXPERIMENTAL APPARATUS
A. REQUIREMENTS GOVERNING DESIGN
The purpose of this research was the observation of
nucleate pool boiling from different Gewa-T surfaces. In
order to get a more comprehensive knowledge about the physi-
cal mechanisms that govern this phenomenon, it is necessary
to measure the parameters involved which affect the nucleate
boiling process. The selected parameters to be obtained
are the following:
1. Barometric pressure
2. Test section wall temperature
3. Fluid bulk temperature
4
.
Vapor temperature
5. Surface heat flux
B. TEST APPARATUS
The experimental apparatus designed by Lepere [Ref. 9],
and modified by Hernandez [Ref. 8], with further minor modi-
fications, was used during this thesis work. To gather data
more conveniently at a faster rate, a Hewlett Packard model
9826 computer and an HP-3054A automatic data-acquisition
system were added to the experimental facility. Lepere
[Ref. 9] and Hernandez [Ref. 8] provide detailed descriptions
of the apparatus; therefore, only a brief description is
presented in this thesis.
19

Figure 1 shows a schematic of the test apparatus. The
boiling surfaces consist of a cylindrical copper tube with
a smooth interior surface and a commercially-available T-
shaped finned surface manufactured by Wieland-Werke , AG. Each
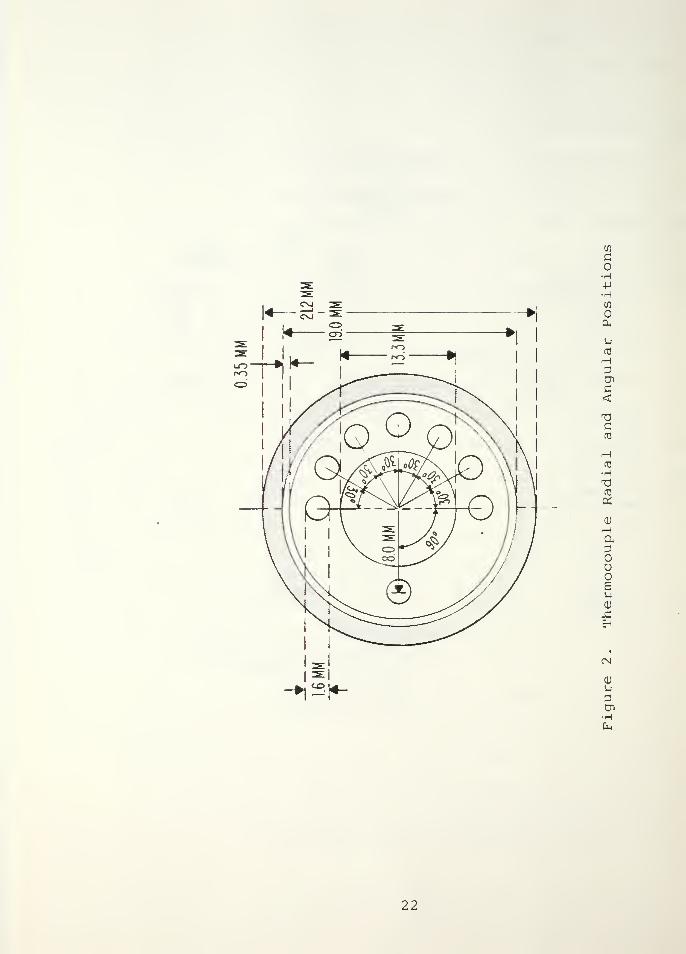
tube was conditioned for the insertion of thermocouples by
drilling eight longitudinal holes as indicated in Figure 2
and introducing the respective copper-constantan thermocouples
centered by means of capillary copper tubes. In the center
of the tube a cartridge heater was placed to act as the heat
source as shown in Figure 3.
Both ends of the test section were machined to remove
the enhanced surface on the outside and to increase the
interior diameter. This reduced the cross sectional area
and thereby minimized the heat transfer from the ends of the
test section. A Teflon plug was inserted into the free end
for sealing and heat transfer reduction purposes. The other
end of the test section was connected to a long copper ex-
tension tube through a 90-degree elbow, which allowed the test
section to be placed in a horizontal position within a thick-
walled Pyrex glass vessel. Since one of the requirements
of the apparatus was to maintain the liquid at saturation
temperature and atmospheric pressure, a plate heater and a
vent tube were provided to satisfy these conditions. In
addition avoiding excessive loss of vapor, a water-cooled
copper coil was placed in the vapor space of the vessel, to
act as a primary condenser. The vessel was covered with a
20
DIGITAL
VOLTMETER
SWITCH *
PRECISION
RESISTOR
VARIAC
VOLTAGEREGULATOR
AJ
POWERSUPPLY
COMPUTER+
DATA ACQUISITIONSYSTEM
GLASS
SECONDARY
CONDENSER
—0—VENT
o o
AUXILIARY HEATER
Figure 1. Schematic of Test Apparatus
21
CO
c
•H+J
•Hwoe^
nfd
H3CnC<
Cfd
fd
•H
fd
CD
rH
oDOeS-l
0)
X!
n
enHfa
22
c
•H-P
uQJ
CO
+J
co
QJ
En
M-l
O
QJ
•H>
co•H-p
uQJ
COI
CO
CO
uu
mQJ
M3
•HEn
23
Plexiglas lid, which had been fitted with a rubber O-ring.
Several holes were drilled in the lid to fix in place the
test section extension, vent tube, connections for primary
and secondary condensers, and two more thermocouples to sense
both the bulk liquid and vapor temperatures. The Pyrex
glass vessel with the attached fittings was placed on the
plate heater, which served to maintain the liquid at satura-
tion temperature. A secondary condenser was mounted external
to the vessel.
C. INSTRUMENTATION
The power supply was connected to the cartridge heater
through a voltage regulator and then to a Variac scaled from
to 120 VAC. This arrangement allowed fine adjustment for
a stable feed voltage during the runs. A precision resistor
of 2.031 ohms was connected in series with the cartridge
heater to provide a measure of the current flow by reading
the voltage drop across this element. A digital voltmeter
was used to measure both the voltage across the resistor and
the voltage across the cartridge heater. All the thermo-
couples were connected to a computer data acquisition system,
and ambient conditions and voltage readings were supplied
manually. The microcomputer processed all this information
through a program included in Appendix A.
D. CALIBRATION OF THERMOCOUPLES
A total of fifteen wall thermocouples in tubes 1 and 7
(one thermocouple in tube 1 was defective, hence it was
24
excluded) , and the two thermocouples for vapor and liquid
temperature measurements were calibrated in an insulated,
stainless-steel bath. The tubes were completely immersed
into the bath, which was provided with a motor-driven mixer.
The bath temperature was measured using a platinum-resistance
thermometer accurate to ±0.01 K.
Since the temperature measurements during this investiga-
tion ranged from 45°C to 60 °C, thermocouple calibration was
performed in the range of 45°C to 70°C. To begin the cali-
bration process, hot water (at about 75°C) was added to the
insulated container. Following proper mixing, all thermocouple
readings were automatically recorded through the data-
acquisition system. The bath temperature was measured using
the platinum- resistance thermometer. To obtain other lower
temperatures, small quantities of water were added to the
bath, allowing 5 minutes for temperature stabilization of the
test section.
The discrepancy (i.e., the platinum- resistance thermometer
reading minus the thermocouple reading) was plotted against
the thermocouple reading as shown in Figure 4 . The second
order polynomial curve shown in this figure was generated
using the data from all seventeen thermocouples. However,
for clarity, only three thermocouples were selected for data
points from each tube. It is evident that the thermocouples
in both tubes show similar discrepancies, the thermocouple
readings have only about ±0.1 K discrepancy around the
25

OJ
I—
I
D.D
EL(U
rU\>
h-
0)
>uouCo•H+J
(d
u
HrHrt3
U<D
Ha3
uoe
<D
xzEh
a)
en•Hfa
XouDcJajosig
26

calibration line. Based on this fact, no calibration was
performed for the other five tubes. Instead, the calibration
curve generated for tubes 1 and 7 was assumed for all tubes.
27

Ill . EXPERIMENTAL PROCEDURES
A. NORMAL OPERATION
The Procedure B employed by Marto and Hernandez [Ref. 7]
has been demonstrated to be the most adequate to carry out
the boiling runs. Because of the large influence of surface
past history on boiling incipience, this procedure was estab-
lished to allow repeatability and permit comparison of the
obtained data for different enhancements.
The procedure is as follows
:
1. Once the test section has been immersed in the pool,
it was subjected to one hour of pre-boiling by setting the
2cartridge heater to give a heat flux of about 30 kW/m . The
plate heater was adjusted to the maximum temperature for this
one-hour period. This initial vigorous boiling served to
degas the liquid and to force the noncondensable gases out to
the atmosphere.
2. After the initial aging process, both test-section heater
and plate heater were secured, allowing cooling of the liquid
and the test section for about 30 minutes.
3. The plate-heater voltage was then adjusted in order to
maintain the liquid at saturated conditions and the cartridge
heater was turned on to the first setting of 12 volts.
4. For all the consecutive settings during both increasing
and decreasing heat fluxes, the boiling was allowed to
stabilize for five minutes at each power setting.
28

5. At a given power setting, the following data were
recorded: heater voltage, precision-resistor voltage, vapor
temperature, liquid bulk temperature and wall temperatures
of the test section.
B. GEWA-T SURFACES
Three groups of surfaces were tested. The first surface
was the same as used by Hernandez [Ref. 8] with a fin density
of 0.75 fins/mm, an outside diameter of 21.2 mm, and an
inter-fin gap of 0.25 mm. The second group of three tubes
had 0.75 fins/mm, an outside diameter of 23.1 mm and inter-
fin gaps of 0.15, 0.25 and 0.35, and the third group of three
tubes had 1.02 fins/mm and all other specifications were the
same as the second group.
The geometry of the enhancement of these seven Gewa-T
surfaces was observed by making a longitudinal cut of the
tubes and photographing them with 50X magnification (Figure 5]
As can be seen, the tubes with 0.75 fins/mm had an approxi-
mately circular cavity shape, while the 1.02 fins/mm tubes
had a somewhat elongated cavity shape. This difference in
shape was probably due to the technique used in construction
to obtain the various specifications. All the T-shaped fins
had a fin height of approximately 0.9 5 mm.
The exact determination of diameters at the base of the
fins was carried out from the magnified photographs of the
cavities. This diameter was determined by subtracting twice
the fin height from the measured outside diameter:
29

(a) Gewa-T Tube Number 2
(b) Gewa-T Tube Number 5
Figure 5. Optical Micrograph of Gewa-T Fin Profile, 50X
30

D2
= O.D. - 2HF ,
resulting in the dimensions presented in Table 1
TABLE 1
Dimensions of Gewa-T Finned Tubes
UBEMO.
FINS/mm
FIN TIPGAP (mm)
FIN HEIGHT(mm)
O.D.(mm)
D 2(mm)
1 0.75 0.25 0.865 21.2 19.47
2 0.75 0.15 0.980 24.99 23.05
3 0.75 0.25 0.960 24.99 23.07
4 0.75 0.35 0.970 24.99 23.05
5 1.02 0.15 1.050 25.30 23.20
6 1.02 0.25 1.050 25.30 23.20
7 1.02 0.35 1.125 25.30 23.05
For simplicity, the diameter at the base (D~) was assumed
to be 19.5 mm for Tube 1 and 23.1 mm for all other tubes.
C. HEAT-FLUX CALCULATION
According to earlier description about test-section con-
struction, the cartridge heater acts as the heat source,
inserted into the tube, and variations in heat-transfer rate
are made through different power settings with a variac.
QH= vi
31
1)
where
:
Q = heat-transfer rate from the cartridgeheater (W)
V = voltage across the cartridge heaterelement (volts)
I = current through the heater element (amps
This circuit is connected in series with a precision
resistor, which provides the means to compute the electrical
current by the measurement of the voltage drop across the
resistor
:
1 = VRES
/R (2)
where
:
v t3tto= voltage drop across the precision
resistor (volts)
R = resistance of the precision resistor (ohms)
= 2.0 31 ohms
Both ends of the Gewa-T tube were machined to provide a
smooth surface and a reduced wall thickness in order to mini-
mize longitudinal heat conduction and therefore the heat
losses from the unenhanced ends. The geometry of these ends
is shown in Figure 6, where:
b = base of the T-shaped fins
T, = temperature at the base of T-shaped fins13
(°C)
32

-*. X'/////////////;//////////*
rfTD. D,
_L_
Lu,
Figure 6. Geometry of Unenhanced Ends
For this cylindrical geometry:
Ac - \<-^ (3)
Ac = Px LS c
(4;
where
= cross-sectional area of tube wall (m )
D = tube outside diameter (m)
= tube inside diameter (m)
A„ = tube outside surface area (m'
P = tube outside wall perimeter (ml
It was assumed that the temperature at the base of the
thin-walled fin was equal to the temperature at the base of
the T-shaped fins. Therefore:
33

(x) = T(x) - TSAT 5)
In general
,
d 9 2—j - m
dx^=
where
:
mh PkA^ 7)
Therefore
QF= QB
i * dTC dx
= -kAx=0
deC dx
x=0
Now, assuming negligible convective heat loss from the
thin tube tip:
de_
dx=
x=^(9
and
Cosh m(L-x)
BCosh inL
(10
For this case
- fi PkcAc
9B
Tanh ml^ 11)
34

'B = S <°» TB - T
SAT < 12
where
Q = heat-transfer rate through unenhancedend (W)
TqAT = fluid saturation temperature (°C)
k = thermal conductivity of the copper (W/m.K)
_ 2h = average heat-transfer coefficient (W/m .K)
Assuming the wall temperature is the same as the average
of the eight calibrated wall temperature thermocouple
measurements, less temperature drop due to radial conduction
from thermocouple position to the base of the T-shaped fin,
ln(D2/D
1)
TB
= TAVG " QH 2,Lk < 13 >
T = ( I T )/8.0 (14)AVGn4 1 n
where
D, = diameter at the position of thermocouples1
(m)
T vr= average wall temperature (°C)
For the geometry shown in Figure 6
:
Lc
.= Lu + | (15)
35
t = D - D. (16)o 1
where
L = corrected length (m)
L = length of unenhanced ends (m)
t = tube thickness (m)
The average difference between the wall temperature and
the saturation temperature may now be determined from the
following equation:
.. C Cosh m(Lr-x)= T=" / ~n u T^ dx (17)L
c ^ Cosh mLc
Tanh mLp (18)mL„ C
" TW - TSAT (19
where
(T -T ) = average difference between surfacewall temperature and fluidsaturation temperature (K)
Since the unenhanced ends are very long and the thickness
is very small, only very little heat transfer would take
place at these ends. Thus, these ends undergo free convection,
36
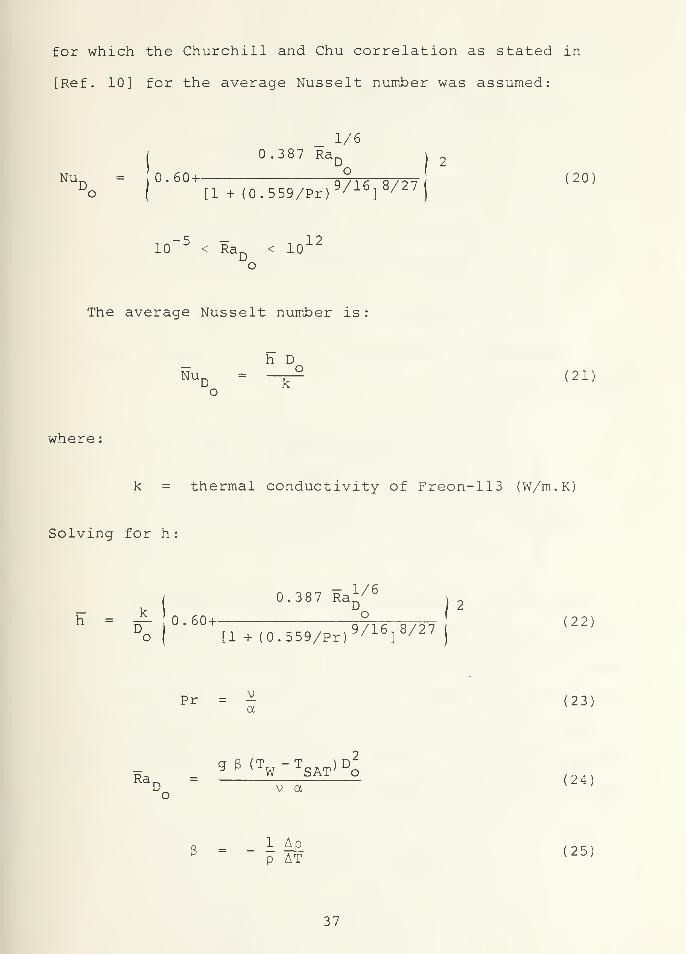
for which the Churchill and Chu correlation as stated in
[Ref. 10] for the average Nusselt number was assumed:
_ 1/6
j
0.3 87 RaD
nu = ,0.60+ °;D
o(
[1 + (0.559/Pr) 9/16]
8/27
-5 — 1210
D< Ra
D< 10
o
The average Nusselt number is
:
h DNu
D- -^ (2i;
o
where
:
k = thermal conductivity of Freon-113 (W/m.K)
Solving for h:
0.387 Ra 1/6
Ih = A 0.60+ °;D
oI
[1 + (0.559/Pr) 9/16]
8/27
Pr = ^ (23)
2q S (T - T ) D
d. W SAT ; o ,_.Ra = 24D v a
1 App AT
25
37

where
:
Pr = Prandtl number
2v = kinematic viscosity (m /s)
2a = thermal diffusivity (m /s)
Ra = average Rayleigh number
g
b
gravitational acceleration (m/s )
volumetric thermal expansion coefficient(1/K)
p = density of freon-113 (kg/m )
Now, substitution of Equations 7, 18 and 24 into Equation 22
results in:
0.387
hP ^2 u 1/6gBD
oeBTanh{
(j^-) Lc
vaL hP » 1/2(26)
Cv
kA,
h =D \
o0.60 +
[1 + (0.559/Pr)9/16
]
8/27
Equation 26 is solved for h by iterative technique
within a range of precision of 0.001. Knowing the value of
natural-convective heat-transfer coefficient at unenhanced
ends, the total heat-loss rate is calculated from Equation
11, and the heat-transfer rate through the enhanced Gewa-T
surface is obtained by subtracting the total heat-loss rate
from the total heat-transfer rate:
QLOSS= 2Q
F(27)
38
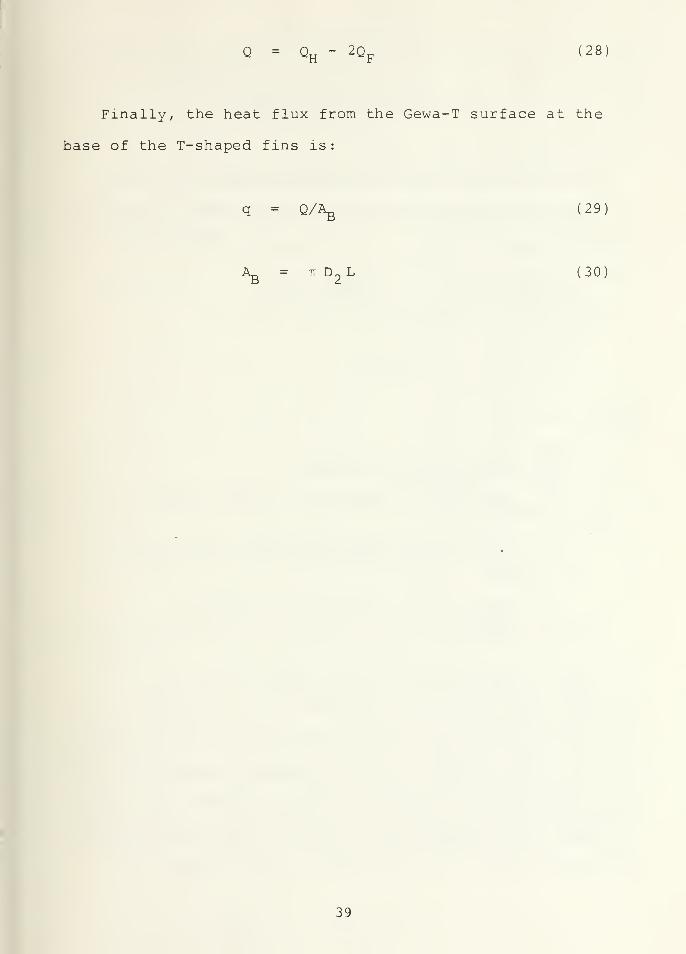
Q = QE~ 2Q
F28
Finally, the heat flux from the Gewa-T surface at the
base of the T-shaped fins is:
Q/^ (29)
Ag = tt D„ L (30)
39
IV. RESULTS AND DISCUSSION
A. DESIGNATION OF DATA FILES
A total of seven Gewa-T tubes were tested during this
investigation. As can be seen from Table 1, the primary
geometric variables were: fin-tip gap, fin density and
outside diameter of tubes including fins.
The general designation for data files is:
GTNPnn
where
:
GT indicates Gewa-T surface
N specifies the number of the tube tested(Table 1)
P indicates the position of the test section(i.e., H for horizontal arid V for vertical),and
nn indicates the corresponding cumulative runnumber
.
For example, GT5H28 specifies tube number five tested in the
horizontal position during run number 28. From Table 1,
the corresponding specifications for this test section are:
25.3 mm outside diameter, 23.1 mm diameter at the base of the
fins, 1.02 fins/mm and inter-fin gap of 0,15 mm. While the
file name just presented contain data in the very raw form,
the processed data (i.e., q versus AT) were stored in a
40

separate file. This plot data file could easily be recognized
by the "P" added at the beginning of the raw data file name.
In this manner, the plot data file corresponding to the above
raw data file has the name PGT5H28.
A total of thirty different data runs were carried out
during this investigation. These runs break down in the
following manner:
Run Number Tube Number Test Condition
Plain - Vertical position
Plain - Horizontal
With shrouds and/or Wires
Plain - Horizontal
Plain - Horizontal
Plain - Horizontal
Plain - Horizontal
Plain - Horizontal
Plain - Horizontal
B. CIRCUMFERENTIAL UNIFORMITY OF HEAT FLUX AROUND HEATERELEMENT
During the early stages of this investigation, it was
thought necessary to test if the heater element would provide
a non-uniform heat flux along the circumferential direction.
Such a non-uniform heat-flux variation was assumed possible
based on the heater-element construction. Therefore, tube 1
was immersed vertically in the R-113 liquid pool and three
41
1 -- 3 1
4 -- 10 1
11 -- 21 1
22 -- 23 2
24 -- 25 3
26 4
27 -- 28 5
29 6
30 7
runs were made. All of these runs showed only a negligible
variation of the wall thermocouple temperatures; maximum
variation was ±0.25 K. These runs clearly showed that the
heater element indeed provided a uniform heat flux along the
circumferential direction. No detailed data are presented
in this thesis for the tube in the vertical position. All
other results presented herein are for the tubes in the
horizontal position.
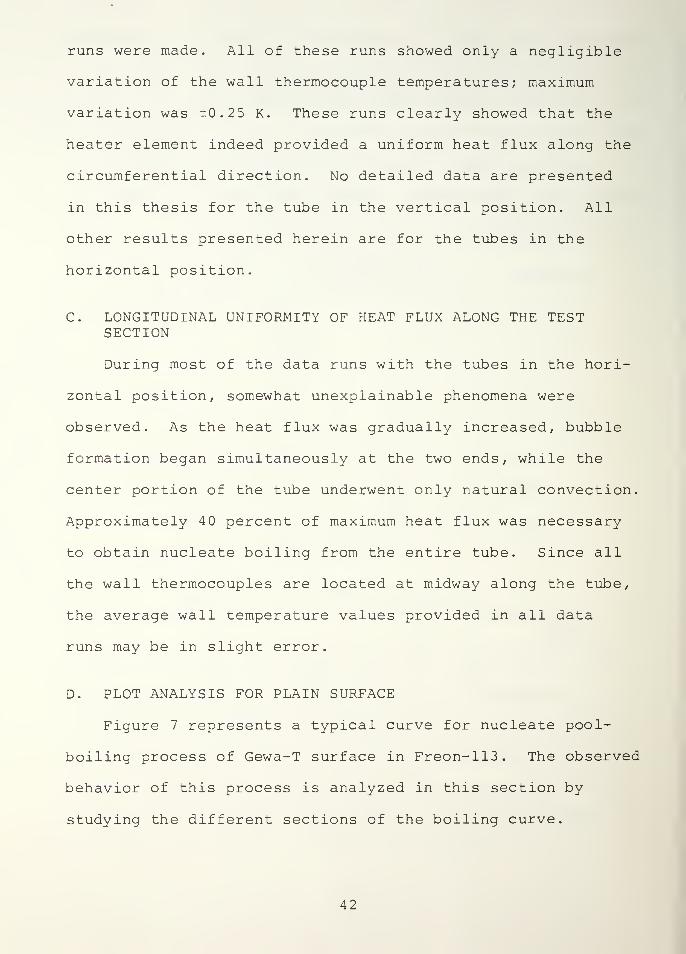
C. LONGITUDINAL UNIFORMITY OF HEAT FLUX ALONG THE TESTSECTION
During most of the data runs with the tubes in the hori-
zontal position, somewhat unexplainable phenomena were
observed. As the heat flux was gradually increased, bubble
formation began simultaneously at the two ends, while the
center portion of the tube underwent only natural convection.
Approximately 40 percent of maximum heat flux was necessary
to obtain nucleate boiling from the entire tube. Since all
the wall thermocouples are located at midway along the tube,
the average wall temperature values provided in all data
runs may be in slight error.
D. PLOT ANALYSIS FOR PLAIN SURFACE
Figure 7 represents a typical curve for nucleate pool-
boiling process of Gewa-T surface in Freon-113 . The observed
behavior of this process is analyzed in this section by
studying the different sections of the boiling curve.
42

Gewa-T Surfacein Freon-113
B + Incipient Boiling Point
ATA-BB-C
C-DD-EE-F
Natural ConvectionMixed Boiling (Activation ofNucleation Sites)Active BoilingHigh Flux Nucleate BoilingStable Nucleate Boiling
Figure 7. Typical Nucleate Pool-Boiling Curvefor a Gewa-T Surface
43

From point A to point B, a continuous increase in heat
flux, accompanied by an increase in wall superheat (TTT- T_._)
W SAT
is observed when heat flux is increased. This region corres-
ponds to natural-convection process, as also verified during
experimental runs with the absence of bubbles along both
enhanced surface and unenhanced ends
.
From point B to point C, a drastic reduction in wall
superheat was observed while the heat flux continuously
increased. This region was somewhat unstable as more and
more nucleation sites became active. This region is known
as the mixed boiling region, where transition from natural-
convective boiling to nucleate pool boiling takes place. At
these heat fluxes, visual observations revealed that the
bubble formation was quite random. While some portions of
the tube showed bubbles, other portions showed no bubble
formation. The wall superheat continued to decrease until
all nucleation sites became active, as indicated by point D.
Once all available nucleation sites have been activated,
the wall superheat starts to increase with increasing heat
flux as shown by region D to E. When boiling in this region,
the entire tube showed very high density of bubble formation.
At this point, it is important to point out that during all
experimental runs, for the entire range of power settings (7.5 to
485 W) , little or no nucleate pool boiling on the unenhanced
surface of the ends was observed (see Figures 8 and 9) for
the different test sections tested. This observation
44

X3rH
fa
-Pfd
(D
X!Cn•H
-P
Ufd
4-1
upen
En
I
rd
QJ
UM-l
o
X3afd
MCr>
O-P
O-CCM
oo
0)
HDen•Hfa
45

ill i . i ^JP^ I Mi
En
-P(T3
0)
EC
O
-Prd
Q)
Ord
iwS-l
wEh
I
rd
o
X!
fd
u0^
O4->
O
CD
M
enHEn
46

confirmed the validity of the mathematical model assumed for
data reduction. However, a small rate of bubble formation
was evident at the tip of the unenhanced fin end; these
bubbles were in fact generated at the base of the fin (i.e.,
between the Teflon plug and the inner surface of the fin)
.
The vapor bubbles generated in the inter-fin cavities
are carried up into the channels around the tube due to
buoyancy forces. As these bubbles travel up, they activate
more and more nucleation sites as well as they help for the
removal of larger bubbles from the channels. This phenomenon
is generally referred to as the "Chimney Effect."
If the heat flux is too large (see Figure 7) , the rate of
vapor bubble generation may be too large that the interfin
channels could be full of a vapor blanket that may disrupt
the flow of liquid to the hot metal surface where active
boiling takes places. At this point, further increase in
heat flux may result in excessive wall temperatures. Under
these conditions, vapor bubbles were seen ejecting radially
outward from the test surface. Line D-E represents the boil-
ing regime just described. It is clear that the slope (i.e.,
heat- transfer coefficient) at E is considerably smaller than
that at point D. This decrease in heat-transfer coefficient
is assumed to be due to the existence of an insulating vapor
blanket.
When heat flux is gradually decreased, the curve follows
a different path (D-F) as shown in Figure 7. This is due
to the existence of stable nucleation sites that will remain
active for a wide range of heat fluxes.
47

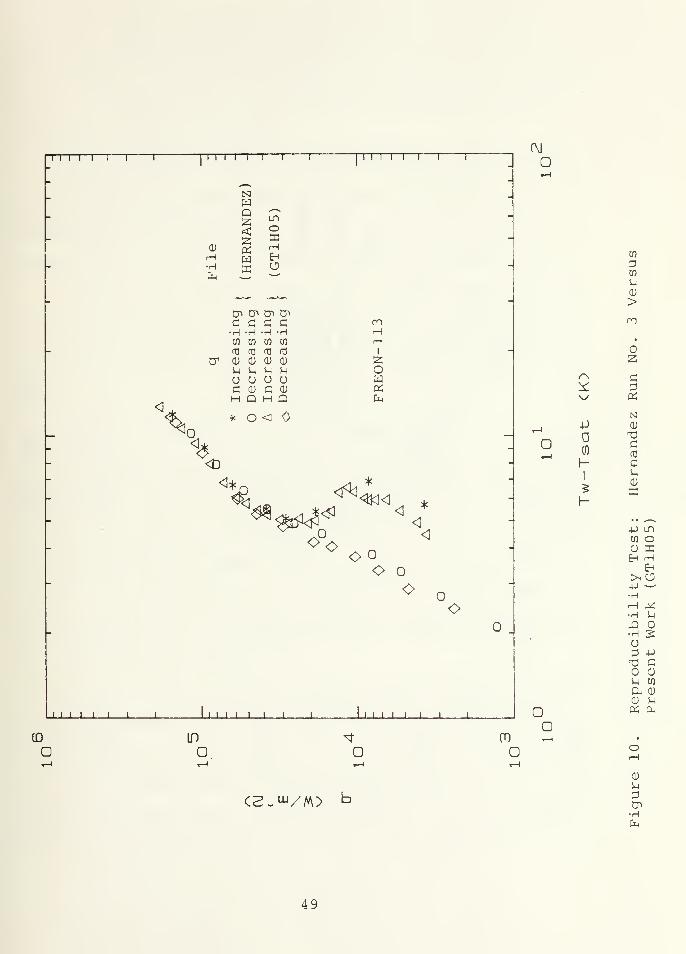
E. REPEATABILITY WITH PREVIOUS DATA
Following modifications made, especially to the data
gathering means (i.e., automatic data-acquisition system and
newly-written computer programs) , it was necessary to take
data for tube 1 (this is the same tube tested by Hernandez)
to check the present data with Hernandez . data under similar
conditions. Even though a total of 5 different runs were
made during this stage through debugging of programs and
system familiarization, only run number 5 will be presented
in this thesis with a comparison to Hernandez data.
Figure 10 shows the comparison between the present data
and the data of Hernandez. A very good agreement is evident
as the two sets disagree by less than 2 percent for the
nucleate boiling regime. However, considerable disagreement
exists in the region of increasing heat flux before total
nucleate boiling. This is believed to be due to the rather
random behavior of the boiling process during this regime
as it will be presented in the next section, even two consecu-
tive runs for a given tube would not give the same results
during the unstable boiling regime.
F. REPEATABILITY STUDY OF PRESENT WORK
Figure 11 shows data from two different runs completed
on two different days. As discussed earlier, a considerable
disagreement can be seen before the tube undergoes complete
nucleate-boiling process. However, for the complete
nucleate-boiling process, the data from different data runs
48
Tl 1 1 1 1 1 1 1" 1 1 1 1 1
1
II 1 1 1 1 1 1
-
fa-
- i ? -
-
0)
HERNA
TIHO
-
•Hfa
Cn Cr> 0~> ct>
c c c c•H -H -H -HW CO CO CO
mH
-
X
D1
Increa Decrea Increa Decrea
ofa-
fa
D
* o <
- % -
-<t>
-
*«.. ^4< * ;
- <<
-
OOO o
O oO
.
1 i 1 1 1 i i i Ill Mil 1 1 1 1 1 1 1 1 1 1 1
CM
O
o
o
co
3CO
5-1
<D
>m
•
2r\ C* D^y «
NV 0)
0)
T3Cfd
h- C1
5-4
5 aH
.. , ,
+J LOCO oa; aE-i ^
£h
>iCJ4J _H-H ^H J-i
-QH 2UD -PT3 C
0)
M CO
a a)
a) s-i
cc; a.
CD LO COo
o o o o
CS.w/M)5-1
Cn•Hfa
49

1 1 1 1 I II 1 1 1 1 1 1 1 1 II Mill ~T"T 1 1
-
-
<& <y\
-
o o
rH•H
H r-l
B Eh
fc<
Cn tJi Cn CnC C C C•H -H -H -Hen co co en
HH
i
i
CT
<*
Increa Decrea Increa Decrea
1
OwPi
<o* <;
*
- \ *
-
""
$» < < <-
-SI
-
-
o
< *<
-
O
- -
1 1 1 1 1 .1 1 1 1 1 1 1 1 1 1 1 1 1 1 1 _L ...
O
i i
,CM
O
Q
rs
4J
h-
I
(D ID COO
O O O O
CS_^/M> b
50
agree to within 0.2 percent at a heat flux of 30,000 to
2100,000 W/m . These data runs show considerably good repeata-
bility of this experiment. (Similar agreements were also
found for all other tubes.)
Also, these data show a considerable enhancement of
Gewa-T tube performance over the "Smooth" tube data of
Hernandez. For example, at AT = 3.1 K, the Gewa-T tube
gives a 4.65 times larger heat flux than the smooth tube.
As also discussed by Lepere [Ref. 9] and Hernandez [Ref.
8] this enhancement in boiling performance is mainly attri-
buted to the existence of re-entrant cavities in the Gewa-T
tube.
G. BOILING PERFORMANCE OF SMOOTH TUBE
To compare the performance of Gewa-T tubes to smooth-tube
performance, data of Hernandez were chosen. It is important
to point out that his smooth tube did not consist of a commer-
cially-available surface. Instead, Hernandez obtained his
"Smooth" surface by machining fins off of a Gewa-T tube.
He did not remove fins completely; the remaining portions on
the tube measured about 0.1 mm.
Figure 12 shows Hernandez 's data (heat flux as a function
of wall superheat) for only decreasing heat fluxes. A
least-squares- fit curve generated for these data points will
be used in future figures representing data on tube 1. Since
tubes 2 through 7 have a larger diameter, it was necessary
to revise Hernandez's data to include the difference in
51

T 1 ] I i i i 1 i i i i i i i i [i i i i i i i —
i
-
-
m-
m
a-
r-
CO
r- H• td -h Hm -P 4-1 1
<D fd 03 *\. Z-
<X Q 3 O -
'—
'
*\ HPi
1
N CD *\ Pn
CD 'V CT>
T3 C £*\vc rd -h
rd C CO
a M D ^v— u CD—
- CD X | *Sv -
- g rH4-1 •
*V-
5-1 nM-l CD CN
c \-fd •H || X. ~
-P Jres Qa0)
co OCD
5-1 5-1
*
-
l
-P
fd oD 4-1
crCO T3
1 CD
4-) CO
1
£
*
.1 i
Leas Revi
t 1 i i i i i i i i 1 I I l i l l l
(M
O
X
4-)
(/)
I
O
CD ID ono
o o o
CD
X!
E^I
-C4J
o6w
eo5-1
4-4
QO
CN
CD
X!DEh
434-1
&wo4-1
co•H4-1
rd
5-1
-PXw
H
C2.^/M> b
d)
S-l
CT«
•HCm
52

diameter. For this purpose, a semi-empirical correlation
developed by Cornwell et al. [Ref. 11] is used:
NUTB= C
TBRe
TB3
hTB
D= qD 2/3
kF
TB hFG V
P FDVA mD GD
G = q/h.^F
A P FA y
F' *' FG
CTB
kF
f
hTB
ATD// 3
hTB D
-( h
pG y F
1/3 _TB_^F,AT Dx '
hTB D
( hFG p p
>
r k 7 ?, , TB
KF , , ATD ,
hTB = (—^-
} ( hF7U; )
hTB " (C
TB V (h~~ yj Dr (a r
Using this relationship, Hernandez's data were revised
and a least-squares-fit curve was generated. This curve is
also plotted in Figure 12.
H. BOILING PERFORMANCE OF GEWA-T TUBE WITH SHROUDS
The same four shrouds tested by Hernandez were used
during this investigation. These shrouds had the following
geometry
:
53

Shroud Niimber Upp<sr Opening Lowe r Opening
1 60° 60°
2 60° 30°
3 30° 30°
4 60° 8.5°
All of these shrouds had been designed for tube 1; thus,
no shrouds were used for tubes 2 through 7
.
Figures 13, 14, 15, and 16 show data on tube 1 with shroud
numbers 1, 2, 3 and 4, respectively. As also reported by
Hernandez [Ref. 8], all the shrouds improved boiling per-
formance at low heat fluxes compared to plain Gewa-T tube.
Table 2 lists performance calculations for tube 1 with various
shrouds. It can be seen that the 60° *8.5° shroud (number 4)
produced the maximum improvement of 253 percent in the boiling
2coefficient over smooth tube at a heat flux of 10,000 W/m .
At this heat flux, the 30° x30° shroud resulted in a 165
percent improvement in the boiling heat-transfer coefficient.
2At a heat flux of 50,000 W/m , all shrouds resulted in about
190 percent improvement, except the 30° x30° shroud which
resulted in a 180 percent improvement.
2At very high heat fluxes, for example at q = 100,000 W/m ,
the 60° x60° shroud showed a maximum performance increase of
106 percent; the 60° x30° shroud resulted in a 49 percent
improvement; the 60° *8.5° shroud resulted in a 18 percent
increase; and the 30° x30° shroud resulted in an 13 percent
54

Trm—
r
~r~i—
r
Mill—
r
H
ro
Eh
NI d)
oo
Cn Cn
fd
C
CO 0) —
cH
Uo
c c iW H m Q)
H •H kO flw en 4-> fd • 4J 3rd rd •H 4-> <Ti •H £h
(1) 0) En rti .H Pn
u Sh Q Eh
o o <D II 0) 1
c 0) > QJ > fd
H Q U £1 Q Sh 5D 3 O P CD
u o
f\J
O
mr-\
HI
OwPi
fa
a
o
0)
ucfd
Sm
MhSh
Cm
tpcHH
r\ Hvy CQ
C4J
oCO
T33
h-
1
U .H
5 CO Q)
h- £1o DO Eh
^D
x Eh1
o ro
o 2*j3 0)
oIW
c•H
4-) fd
U ^H0) a.M-)
I I I I L I I I I J L
CD LT)
O O
i i i i i l _PJ o
^ roa
a Q
CS-W/M)
w o
U
tr>
•HPm
55

1 1 1!' 7 "T 1 T ] 1 VI 1 i i i i M 1 1 1 I i ~r~
1
NCD
T3
-
CD K 4-> c a -
H H (0 HH Eh c 03 -
fa
Di o>
s
M
MCD
1 H-
c c IW i—
1
4-1 CD
•H -H KD X3
* W w p <TS • P P m
\
-(0 n3 •H •P <2\ •H ^ H0) CD fa n3 H fa H
\q tr M 5-1 Q Eh 1
i
O O cu II d) 1 2 !
C 0) > CD > (0 O\- H Q M X! Q H 5 w
3 3 O 3 CD «0\
* oU Eh U
I
O ti
*
l
Ii
i
\\
- \
\-
~\\
"
- Q -
- *n
v.
-
- v. -
°*1
!
*"**.
**>. *
_ * *s|! *1
v.
"s,
- -i
1
(M
o
oI)
ID
h-
I
CD
Uc
e
omnCD
0>a•HH•H
CQ
CO
o
O
M-H
o
Mil L_J L I I I I I L
ID ID
O a
(2-W/M)
I I 1 l-L—L J o
^r COo
o oCD
u
Oi•Hfa
56

1 1 1 1 1 1 1 1
I
11 Ml 1 1 l N 1
'r r 1 t 1 -I- T~
H i 0)
-
<D
CM
re 3 cH•H
H 03
G•Hrd
PL, o e UCD
HCU
'
C C 4-1
i in rH
- •H -Hen en
M-l rH mSi
* to id +J rd • -p 3 CO
CT 0) cu H 4-J CT> H Eh i—
I
u uu u
fo it!
QH Pm
H 1
C CD CU II CU 1 S3H Q > CU > td O
\* H X! Q M 2 H- 3 3 O 3 0) «
* O U En ^*""' u O pq
1
1
1
-V
\
\
-
" \\N
"
N_ V -
tf^- "s. -
* ""v^, ^^^
- * ^ ^\^"^
*"Si
.Ill 1 1 1 i 1 III 1 1 1 l l 11 1.1 .1 1 ILL 1
C\!
o
o
cu
crd
Bu
muCU
(Xi
CncHH
rs •H*w cq
cP
d)
HI
U rH
5 CO d)
h- X!o 3O Ehro
X Eh1
o ro
o 5ro CU
UM-l
C•H
-P td
U rH0) cuM-l
MH M-l
W
to ID roo
o o o o
C2_w/AO b
U~)
CD
s-l
3tn-H
57

xi i i 'i—
r
C\]
D
JD
cu
OEh
Eh
I
rC
O
^ H
o
P
CO
(/)
h mCO
X
o
oVD
M-l
-POCD
M-l
"4-1
w
I I I -I I L i-Li 1 I L
(0 ID
O Q^f
CS-^/M)
j i J L .._..J o
COG
O
UD
CD
uPCT>
•H
58
CM
w
en
-PHw0)
PES
mo
>iS-l
(d
g
co
tfrs)- o\o Ub 2v H5o , .
o «o 1
« -£™,-o £o *\H s
II
rr ,^^
Eh U< o
pjo\° U
CN 23h H<[5
o Wo 1o ,C<N_•» eo
Lfi 2II
rr ,
Eh U< o
ft1
o\° Us
cm Mgs!< ^^
«o 1o XJCN.o E=^ \o sH
II
o1 Eh U< o
i-y*-iOH
Eh EhCO H££oo
aHCm H< §Eh 2
CMCN
00 ^poCM
oC") CO CO ^ -stf CM LO H
CO 001—
1
CTl
^pmo
CMH HCM
OCO
CMCO
CM^P
CM1
«^LD^3,1—I^DLDr^COnHCMCOi—I
cMCM^r^cTivnLnoorHLnr^-ooorHLnr^ococMLn^^LnCO"=Tl»DCT>r-i—i vo o ld vo cm r*LD ^ - ^£> CO ^ U3 ^^^^LD
r-i H CM CO CO CO ^riH rH rH .H iH .H nH
r^rHcoo^^r-oooocMf—I r»Or-MOCOCOCMO^DCOCOOCOr^ooco^rr—i oo m r-~ r^ r^ r^ r-H H i—
I
I—
I
I—
I
OOOOCOCO^Or^COCOcTiCOr—I
l co^Tr—ir-ocrii—ico^ro^'^cMCMcnooo^i^-voc^r^cocoH H H r—It—I i—I t—I rH H rH rH
oo^o^cMr^cMi—icoLTiLnr^r^cno^r^cMrHcocor^cMcTNLnCOO'5,,vDi—l^t—I 00 ^ CM 00 00o^oco^rco^ocMLncocot—I
CO CT\ 00 ^^^vv^^^^I—It—It—ItHOl—I O rH HrHHHrHrHHHrHiH
LDinivDCMr-^r^DcocMcTir-r^in^ro-^romooro^rO'^H
O'^'^rvocor^'cri—i c— •—i mIO^OCOOCO^^iHCOCO-H^r-LncM^v^r^^ro^coooCMCMf—I i—I rH ro CM CM ^P
r^^r^oo^oco^rcMiHoooor-r^o^ii—i^oLn^cMo^cMLOoHroaomoin'rpc^cMr^-^^£>r^r-~'sDi—locM-^ocoi—icoi—icMCMLnm^p^^pr^'^Q^oc^
00«3
LO ""sP o in mLD CO CM ^P
oo cm r-m KO O»—• vo ro ro iH CM CM
LD
00Xo
OCOXo3
o oV£> COXo
Xoco
ft
in o^
T3 T3
CO CO 3 3
CO CO CO CO
§ § § §y h H hS s s §cm co ^p
CM COCM
Tf KO
uJ3CO U0
003 2 x
oin nvo
00 CT\
CM r- CM CO o CM CO
1 00orH
CMCTi
COHH
CO ro CM CO o co r- HoCOin
COCMCM
rHrH
CO
oH
rH
CO
H^D
OrH
o
OH
r-
HH
inCM
mm H COin
COro in m H
COrH
CO <T\ HrH
a> <Ti CO orH
o m CO r- CO o rH
lCO00 oH
CMm o rHrHH
CMin
CO ^D a\ CM ^ o r- or^'^cTiinomLncoCOOUDCTiCMOOOOli3CMHC^ir^^DrO(T\cor^coLn^ovncom
mCMH ro
^r"5J
1
Hm CMo
inro
rorH
KD ^D CO r- r~~ ^D 00
*? O o H ^D CO 00
1 in OCO
H COCM CM
CMo CM
6
K H
w 3
^ 00 C3> CO 00 in
CMCMinrH
CMrHCMCM
CO
CM
in
rHCM rH
H
H00oCO
oCO
H
m CMm m COH mH CM
00rH
V£5 <3" ro ^r m m ro m
2: 2: g g 2 z 2;
ft A ft ft ft ft ft
CM m y3 r» CO a> oCM CM CM CM CM CM roK K K K K ffl ^CM ro ^p m Lfi in
e c3 B B B B B
59
improvement. It can be seen that the values just presented
are somewhat proportional to the summation of the two shroud
angles. This behavior indicates that at very high heat
fluxes, too small a shroud opening can obstruct the outflow
of vapor and/or the inflow of liquid.
However, it must be noted that at all practical heat
fluxes (10,000 to 80,000 W/m ) , all the shrouds resulted in
a considerable enhancement in the boiling performance. The
60° *8.5° shroud appears to be the best selection for all
practical heat fluxes.
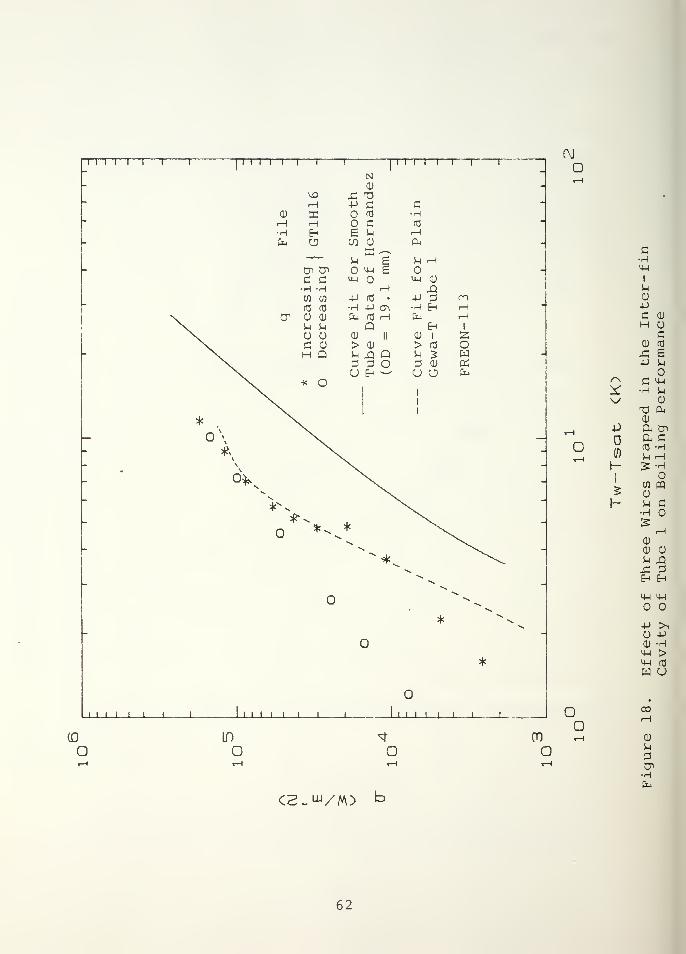
I. PERFORMANCE OF GEWA-T TUBE WITH WIRE WRAPS IN INTER-FIN GAP
A series of runs were made with two to five 0.1 mm-diameter,
copper wire wraps in the inter-fin gap of tube 1. Figures
17, 18, 19 and 20 show data with wire wraps of 2 , 3, 4 and
5, respectively. It can be seen that all of these curves
show increases in boiling performance at all wall superheats
for decreasing heat flux values. This enhancement is most
probably due to the increase in the nucleation sites within
the inter-fin cavities. However, there is a small reduction
in performance in the natural convection process probably
owing to that wires could act as an insulating material due
to the thermal contact resistance between the wires and the
inter-fin area.
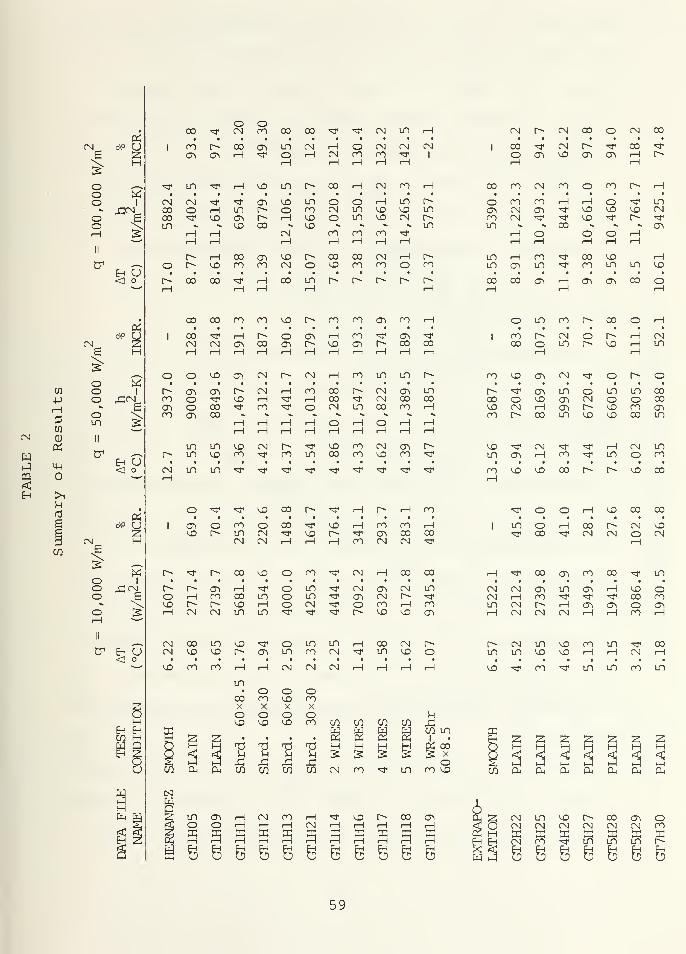
Table 2 also shows that the use of three wires resulted
in the best performance increase. This combination resulted
in a 341 percent improvement in the boiling heat-transfer
60

1 1 1 1 1 II I 1 1 1 1 1 1 1 1 1
1
1 1 1 1 1 r '
-
a-
r-{
T3a
-0> X r3 H -
H H C td
- H Eh B M t-H -
Cm U w 0)>i-s
Oa
- M e U r-1 -
cn tr> 4-1 ec c U-l uh a)
•H -H H XI-
en en +J ra • -p a CO -
(C <T3 •H 4J a> H Eh Hd) CD &-. nd i—
i
Cm HN. D1 U U Q Eh 1
O O dJ ii 0) 1 z- C 0) > CD > (13 o -
H Q U XJ a H £ wP 3 o 3 0) cr;
u E^ ^ u o Cm
* O1
* >v1
1
•\ N- *. -
-
\ * *
-
V
- *-
- 0*^ * -
*•«.
^\ *
***
1111 1 II 1 1 1 1 1 1 1 1 1 1 -LI .Mil 9 1
_ <\l
o
a
i
u0) 0)
-P
c cH fO
6QJ M£ o
r\ 4-> U-l
* u^ C 0)
•H Cm
4-> T3 Cn0) Co,-hCmM
H 03 -H
l
M
5S CQ
h w ca> ou•H .-H
20)
X5 p£ Eh
U-l U-l
4-1 >iU 4-)
0) -HU-l >U-4 fO
w u
o
(0 \D COQ
O O a o
C2. LU/M> b
r-
a)
Ml
PCn•HCm
61
[Mil II ] 1 1 1 1 1 r r " T —I
1 i i l l 1 1 1
*N
—
-
<o £J
CD-
- H 4-) C c "
0) K ffl •H-
.H rH C rd"
•H Eh e U HEl, U CO CD &4
•H -H4-1
4-i g
HM-I CD
CO to -P rfl • P P ro-
<T5 fC •H -P CT\ •H Eh H -
cr a; (D
S-i U|X| (T3 <—
1
aEn
EhH
1
o u 0) ii CD 1 2C CD > CD > 03 O
*
H Q
* O
uau
xi ao oEh — 3 CD
u o1
1
1
Em
— o\ —-
V
-
- \ -
- 0*^ -
-
Vx-
*-v*
s""+.
***.
*•*.
*
*x.
^ ^
Mill 11 1 III i i i1 1
(
l
D
h 1 1 1 1
*
1 1
^*
(M
O
O
IO
(0 ID ^r COQ
Q a o a
cHM-I
1
UCD
4J
C CD
H Uc
CD fd
x: £4-> M
rs C 4-1
X H i-|
\s CD
T3 C^
CD
4J Qj Cn
a a, C(0 -HU H
h £ -H
i
O
$03 CQCD
h !-l CH Os
rH
CU
CD CD
Sh X)X 3Eh Eh
4-1 4-1
O O
4J >,O -PCD -H4-1 >4-J rtj
w u
CO
CD
U
-HEn
ca.^/M>
62

rri" 1 T T 1 | 1 1 1 1 1 1 1 N 1
- |i I I i t~i—r i-
CD
•
- r- x: i -
H -p C G-
QJ S f0 H •"
.H r-\ c <d- •H H E u rH
fa CS w QJ (X
C7> CnSh
(UIUI
HJ
SH rH
- C C.H -HMH
HM-l QJ
X!
™
W W -P td • 4-> ro
(d 03 •H +J a> •H E-" rH
trU U
fa td <hQ
faEh
H1
U CD II QJ 1 Z i
C QJ > QJ > (d OM Q Sh 3§ Sh 5 W
- 3 P QJ fa -
U E-t ~ U U fa
* O1
1
*
1
— o\ —- -
- \\
-
- o^v
\
-
™ "
*-«.
*-*
*-*
*N.
*N.
-(D
-
^-,
•^^*^
*
*
H ' 1 1 1 L 1 III1 1 1 1 I . III 1 1 1 J_ _L J
-, (M
o
o
•HM-l
t
1
SH
QJ
4-> QJ
C OH C
fd
QJ gJZ u-P
rs M-l
* G Sh
\s •H QJ
fa
T3P qj cn
G(0
a c.
0,-HfO rH
h- S-l -H
1
55
CQin
h- QJ CSh
•H
S -H
Sh QJ
P X2P
fa Eh
M-i M-i
4J >iU 4->
QJ -HM-l >MH td
fa U
(0 in ma
o a o o
<T\
QJ
Sh
t7>
•Hfa
CS~w/M>
63

r ii i i i i i 1 1 i i i 1 1 1 l " Tl 1 1 1 1
~N
"
COCD
~
0!
H•rH
HH
P c03
ce u
cH03
H-
En O CO cd
| H—
sing sing
O M-l
M-l O
-P 03
H-p
CD
3 m~
03 03 •H -P o> •H £h rH~
\ ^ OJ CD
>-) MD OC Q)
Cn 03
Q0)
> CD
rH
II
En
cd
>
E-t
1
03
i-H
1
OH Q u xi
U Eh
QO
S-l
CJ En* O
1
1
* x
1
™"
0*"
- o \s*
-
-
0\"*, *
*-
- -
•s,
~»"
"X**
^."*.
*^*»*.
V*-V.
1X*.
*•*.
II 1 1 1 1 1 1 i i l I III i J J J . 1 . .1
CM
o
o
o
to ID COQ
O O o o
c•rH
i
uCD
-P CD
c oM C
03
CD gsz u-P
rs M-l
X C H\s •H CD
cx
T3p" cd tr>
(0
& ca-H03 -H
H P, -H
1S
$ CO
h- CD cs-i o•H
S HQJ (D
> .Q•-H aCm Eh
Hh M-i
O
-p >lO -PCD -HMh >M-l 03
W O
oCN
(1)
P.
DOi
C2-^/M5 bEn
64

coefficient over the smooth tube value at a wall superheat
of 1.4 K.
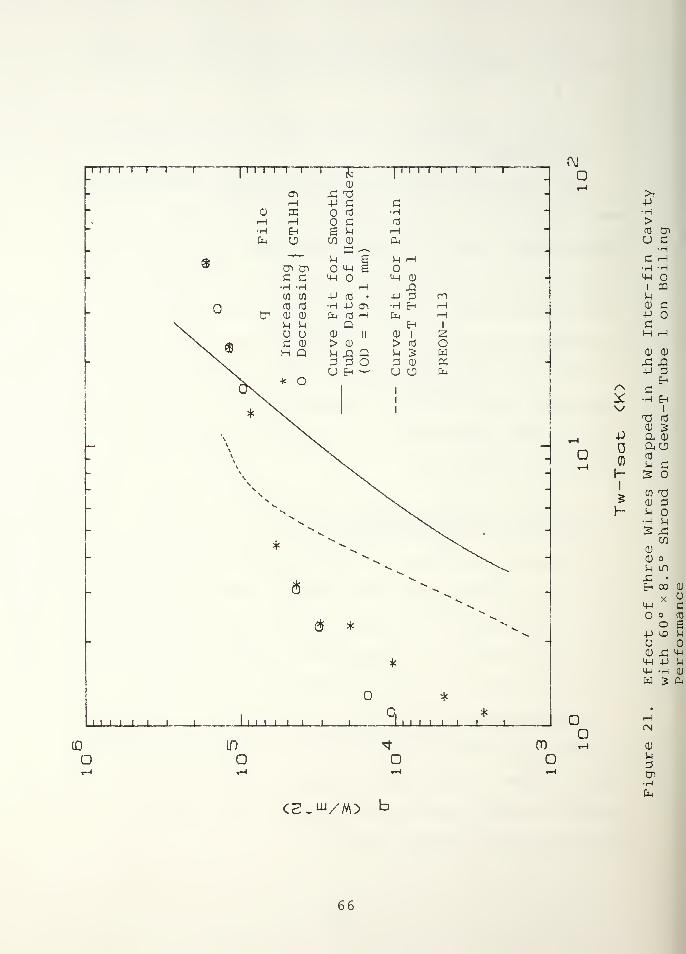
J. BOILING PERFORMANCE OF TUBE 1 WITH 60° x8.5° SHROUD ANDTHREE WIRES
Data were also taken to combine the best shroud and the
best number of wire wraps in the inter-fin channel. For
this purpose, three wire wraps were added to the inter-fin
channel and data were taken with the 60° x 8 . 5° shroud. As
Figure 21 and Table 2 show, this combination resulted in a
performance yet superior to the use of three wires or the use
of 60° x8.5° shroud separately. Table 2 shows that this
arrangement resulted in 481 percent increase in the boiling
heat-transfer coefficient over the smooth-tube value at a
heat flux of 10,000 W/m2
.
K. EFFECTS OF FIN-TIP GAP AND FIN DENSITY OF GEWA-TTUBES ON BOILING PERFORMANCE
As described earlier, six Gewa-T surfaces were tested
during this stage of the investigation; tubes 2, 3, and 4
had a fin density of 0.75 fins/mm, and tubes 5, 6 and 7
with a fin density of 1.02 fins/mm, and each set of tubes
with fin-tip gaps of 0.15, 0.25 and 0.33 (see Table 1).
Micrographs were obtained for all enhanced surfaces on
a Scanning Electron Microscope with a magnification of 50X.
Figure 5 shows micrographs representing tubes 2 and 5.
Computed surface areas and area ratios (with respect to
smooth tube) are listed in Table 3.
65
CM
O
o
(0 \D COO
O O O
>i-PH>fd enu c
•HC HH -H4-4
1 0QMCD CPcH HCD CD
£ -Q-P
Eh/N C* •H Eh\S 1
13 fC
CD ^P a, cdao(/)
h- £1
5CO T3CD 3
h- ^H US £
COCD
CD o
S-l LD
A •
Eh 00
X4n
o
o+J >sD
uCD JZ4-i +J
4-1 -HW 5
HCN
CD
UDen
En
CS-^/M)
66
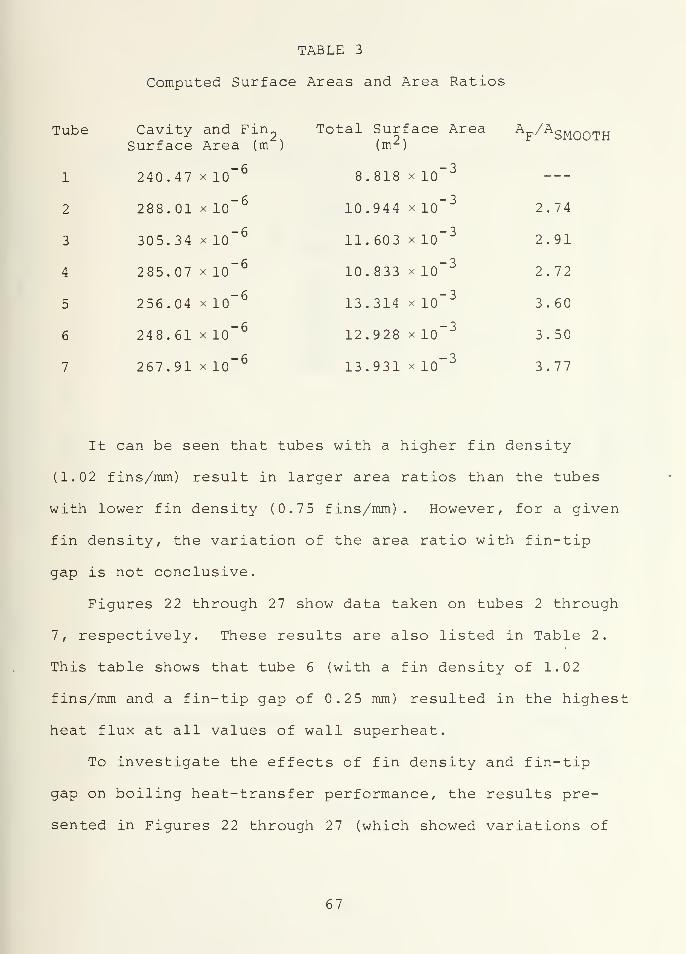
TABLE 3
Computed Surface Areas and Area Ratios
Tube Cavity and Fin2
Total Surface Area AF/
A<
Surface Area (m )
1 240.47 x 10" 6
2 288.01 x 10" 6
3 305.34 x 10" 6
4 285.07 x 10~ 6
5 256.04 x 10~ 6
6 248.61 x 10" 6
7 267.91 x 10" 6
(m z)
8.818 X 10⁻³
10.944 X ID"3
2.74
11.603 X ID"3
2.91
10.833 X 10⁻³ 2.72
13.314 X ID"3
3.60
12.928 X 10⁻³ 3.50
13.931 X ID"3
3.77
It can be seen that tubes with a higher fin density
(1.02 fins/mm) result in larger area ratios than the tubes
with lower fin density (0.75 fins/mm) . However, for a given
fin density, the variation of the area ratio with fin-tip
gap is not conclusive.
Figures 22 through 27 show data taken on tubes 2 through
7, respectively. These results are also listed in Table 2.
This table shows that tube 6 (with a fin density of 1.02
fins/mm and a fin-tip gap of 0.25 mm) resulted in the highest
heat flux at all values of wall superheat.
To investigate the effects of fin density and fin-tip
gap on boiling heat-transfer performance, the results pre-
sented in Figures 22 through 27 (which showed variations of
67
1 1 1 1 1 1 I 1 | 1 1 1 1 1 1 1 i N 1
1 1 1 1 1 1 I
O H- CM
CN ro-
HBCN
rd CN
Hfa
Eh gCO
u<u
II
m
en en
B4-(
QO
~
- c c-H -H
m U -
w w -p rrj m mfd fd •H -P H
cr 0) <D
o o
fa rd
QT3
CO
rH
1
2C 0) > U •H OH Q U Q > fa
* OU
3E-i fa g
2fa
* *-
* * -
0*™
_ * , -
- 6 *
*-
_ _
-
* 1
-
Mill 1 1 1 1 1 1 1 1 .i j. i 1 1 1 1 1 1 1 .1
f\l
o
o
I
C0 ID COO
CN
CD
ja
Eh
I
ro
(D
o4-1
o
OSrd
gMO4-1
u<a
fa
CnGH
CQ
CNCN
<u
uGen
O O O O
C2-W//vo b
68
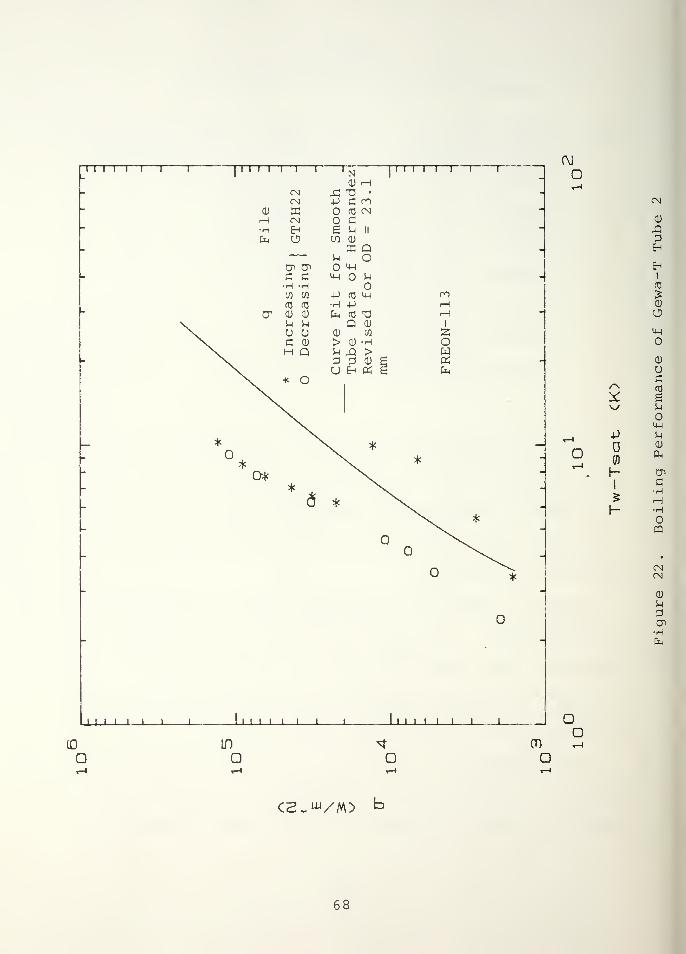
nil i i r r in i i i 1 I
||i i i I 1 1 1
- 1 -
- NCD H
-
" r T3-P G ro
mCD
Hfd
CCN
- Hfa
E-t 6 HCO cd
IS
II
Q
~
c cH -H
4-i
M-l
OU
N. cr
co en
id (d
cd cd
u uu u
•H -p
fa ra
Q(1)
M-l
nCU
co
HH
1
zC CD
H Q> CD
u aU H
•H>a)
oHPi
fa
* O
*_ * —- ® -
- -
- * *-
-
*-
- <$ *
* *
i i i i i i 1 1 1 1 1 1 1 1 1 1 1 1 1 1 1 1 1 .1
.
CM
a
oP
0)
hI
a
CD If) ma
mcu
X!3^Eh
I
fd
CD
OM-l
O
CL)
Ucrd
g
OM-l
5-1
<D
fa
CnG•HrH•HoCQ
CN
CD
U3tnHfa
Q O O
CS.lu/M>
69
T 1 1 1 1 1 i i | r i i i i i i T1
Mill I
N1 1
-
-
vnQJ .H "
QJ
CM 4-> C COfd CN
i-H
•HmEh
Ce >h ii
&H U 01 QJ
Sh o
sing sing
M-i
m o u
4-1 fd M-l ro
D1
rd fd
QJ QJ
u uu oC QJ
ve
Fi
e
Dat
ised
rHH
1
OH Q u J3 >
3 3 QJ £U Eh Oh E
wOS
fa
* O
*
9 V * *_ 9 * _
_ * _
- & -
- -
- * -
*
1 1 1 1 1 I i i In i i 1 1 l 1 Mill 1 1 1
0\J
CD ID
O
o
h
o
(DO
QJ
3Eh
rd
0)
oMH
r\ n*\-/ QJ
G4-J rd
n £
COuo
r- MH
|M
5QJ
Cm
CT>
cH
CQ
QJ
•H
O O o
C2-W/M)
70

-I 1 1 1 1 1 1 1 1
1
i i i i i 11
1 1 1 1 1 1 1 1
-CO
"
-
CD a 4->
-
" H•H
LDT3
"fc u g cd g
(/I CO g"
CD CDc a
•HH > rH
M-i CD •
~
CD
H -Hco wfd (d
0) cd
4n Pi <"">
CM4-) td NH +J CD II
o uc cu
H Q rve
F
be
Da
rnand
r
OD
rH1
OH
- 3 P (DO ffn -
* O U En X, M-I [X|
** * X
^~ e *
- &*
-
~ "
- * -
- >v -
- ^ -
1 1 1 1 1 1 1 1 , i i i 1 1 11 1 1 1 1 1 1 1
1
-
CM
O
O
o
(0 ID mo
h-
I
$
un
CD
Eh
Eh
I
td
CD
O4H
O
CD
UC(d
ES-l
o4HuCD
ft
CDCHrH•H
oCO-
LT)
CM
CD
UPCDH
o o o
<a~w/M>
71

1 1 1 1 1 1 1 1 1 1 1 1 1 r t i i 1" i i i 1 ! 1
-
-
N-
~CD iH
~
CTi s: <x
CD
CMf0 CM
H•HEn
U3een
CM II
CD
c c
uX QOM
•H -H4-1
•H -P
COH
CT 0) 0)
Sh >h
CnQ CD 1
*
*
Inc Dec >
DU
en
0) -h
.3 >D CD
Eh CC
Z -
OwCm
_- 8 -
- -
- 0* **
\**
-
- \* -
_ -
-*
1 1 1 1 1 1 i i 1 i i i i i i i i1..
1 1 1 1 1 1
CM
CD ID
O
o
o
COQ
H
>J3
0)
X!3Eh
Eh
I
03
QJ
U
»"\ nX\^ dj
unU td
n eCO nh IH
1M
5 0)
cx>
C
oCQ
CM
CD
U
cn•HEm
a o o o
ca^w/M}
72

TTTT 1 1 —
i
r "1 1 i i i i i i r
I
11 1 1 1 1 ! I
-
-
o A-
"
CD
en
'.—i
•H Eh g cd a~ fa CJ CO
u•H> H
"
sing sing
M-I
CD •
Pi nCM
ro-
rd us •H -P II .H -
o1a; cd
u uo uC CD
fa
CD
>
n3
Q aO
CD
H1
O
*
M Q
* O
U
uX! UPEh M-I
fa
fa
9 *
_ o* * -
- * * * -
- -
- -
-*
-
- -
- -
1 1 1 1 1 I i i Iiiii i i i i h 1 1 1 1 1 1
f\J
o
o
o
(0 \D CDo
5
CD
oEh
CD
UM-I
CD
CJ
c(T3
EM
h 4H-
UCD
G•HrH•Ho
rsi
CD
U3Cn•Hfa
O o o
CS_w//A>
73

heat flux as a function of wall superheat) were re-plotted
on a different basis as shown in Figure 28. This figure shows
the variations of the enhancement of heat-transfer coefficient,
over the smooth-tube value, with wall superheat for all six
tubes. It is evident that tube 6, which has a fin density
of 1.02 fins/mm and a fin-tip gap of 0.25 mm results in the
maximum enhancement at all wall superheat values.
Tube 5 shows poorer performance than tube 6. This poorer
performance is believed to be due to the fact that the smaller
fin-tip gap disrupts the flow of liquid into the channels
and/or the vapor flow out of the channels. Tube 7 (which has
the largest fin-tip gap of 0.35 mm) shows the poorest per-
formance among the set of these tubes with a fin density of
1.02 fins/mm. As visually observed during experimental
runs, this tube ejected a considerable portion of vapor
bubbles radially along tube periphery. This premature
departure of vapor bubbles results in a lower performance
by producing a thicker liquid film at the hot surface.
In comparison with the results for tubes 5, 6 and 7, the
curves representing tubes 2, 3 and 4 show that for a given
fin-tip gap, the performance has decreased with decrease in
fin density. This observation is believed to be due to the
presence of a greater number of channels (for a given length
of tube) in the higher-fin-density tubes. Again, for a fin
density of 0.75 fins/mm, the 0.25 mm fin-tip gap (tube 3)
resulted in the best boiling performance. The same
74
n o
<*
<
<
1—
r
CMo
en
•5
E in m m 10 m mw h <n n h M nQj o o o o o oo
(1) <n ro «* m ko r-
* O O + <
ro
l
OWEm
*offi
o
_L_I I I L J L J_l 1 I L J L
f\l
o
o
o
C\J oo
o o o
-p
ewuCD
>
en
CD
Sir\ PX EnV
Eh
1 03
4J rd CD
2 Mcu <o
H rH
i
iw nji c§ •H
h- en gO
•H 2+J
rfl ccd o
-P T3C CD
<d en
6 (0
CD CQ
C en
rd a-C XIC 3W Eh
00CN
CD
U
CnHfe
<i_|q.oaws) q/ <l|U3) M
75

explanations given above should be valid for the poorer per-
formance of tubes 2 and 4.
It can be seen that all tubes show smaller enhancement
ratios at low wall superheats, and the above-mentioned
differences in performance are more pronounced. On the
other hand, all the tubes show greater enhancements at larger
wall superheats and they seem to approach a common enhance-
ment ratio. The increase in enhancement is believed to be
due to the increased chimney effect, which helps to remove
vapor bubbles from channels resulting in a thinner liquid
film at the hot boiling surface. When heat flux is further
increased, vapor can provide a blanket around the hot
surface, which may eventually result in a critical heat
flux. It appears that the critical heat flux is not strongly
dependent on the fin density or fin-tip gap.
The results shown in Figure 28 were also replotted as
shown in Figure 29 to further study the performance of these
six tubes. This figure shows the variation in enhancement
ratio obtained beyond the area increase (i.e., the ratio of
heat-transfer enhancement/area ratio) as a function of wall
superheat. It is evident that obviously all tubes resulted
in enhancement ratios beyond the area increase.
In summary, a fin density of 1.02 fins/mm resulted in
performance superior to a fin density of 0.75 fins/mm. Also,
in both cases, a fin-tip gap of 0.25 mm resulted in the best
performance
.
76

-m—i—i—
r
ti—
r
LD o
l-OD
10
g LT) LT) Lfl LT) LD LD—• H (N n H (N rn
Oj o o o o o org
O
0) cn n rr m vo i-
* 00 + < u
m
t
Owfafa
< O +* n
<3 O +
O
HD
4Q
< o
J_J L J L J L
C\J
o
o
o
f\J oo
UQ)
>
CO
<D
si <d
3 d)
Eh U<
Eh
r\ 1 r-i
rd rd_v 2 P\y
0) -PO O
jJ<
4-1
n CCD
CO
Tdi
•H (1)
5 -P co
rd fd
h- « fa
-P QJ
C X!cd d6 EhCD
u x:C -Pfd o£1C gfa w
o>CN
CD
PDCn
fa
o o o
(OT^DJ) v/ (°T^DJ) M
77

V. CONCLUSIONS
(1) Experimental observations revealed a non-uniform
temperature distribution along test section. The bubble
generation was seen to start at the two ends and migrate into
the center as the heat flux was increased. No clear explana-
tion is possible for this temperature distribution.
(2) Results of the present investigation showed very
good repeatability with the results of Hernandez obtained
under similar conditions.
(3) The use of shrouds improved the boiling heat- transfer
coefficient of Gewa-T surface at all practical heat fluxes.
However, a considerable reduction in heat-transfer coefficient
2was seen at very high heat fluxes (> 100,000 W/m ) . Among
the four shrouds tested, the shroud with 60° *8.5° openings
resulted in the best performance verifying Hernandez's
results. This shroud resulted in a 253 percent increase in
boiling heat-transfer coefficient, over smooth tube, at a
wall superheat of 1.8 K.
(4) The use of 0.1 mm-diameter wires (2 to 5) improved
boiling heat-transfer coefficient at all practical heat
fluxes. The use of 3 wires resulted in the best performance
with a 341 percent increase in the heat-transfer coefficient
(over the smooth-tube value) at a wall superheat of 1.4 K.
(5) Further improvement in boiling performance was
obtained by using the 60° *8.5° shroud with three wire wraps.
7

This combination resulted in a 481 percent increase in boil-
ing heat-transfer coefficient at a wall superheat of 1.1 K.
(6) The use of wires appears to be superior to the use
of more expensive shrouds.
(7) Among the fin-tip gaps of 0.15, 0.25 and 0.35 mm
tested, the 0.25 mm gap resulted in the best boiling
performance
.
(8) The Gewa-T tubes with a fin density of 1.02 fins/mm
performed superior to a fin density of 0.75 fins/mm. At a
wall superheat of 3.5 K, the lower-fin-density tube increased
the boiling heat-transfer coefficient by 80 percent, while
the higher-fin-density tube increased by 103 percent.
79

VI. RECOMMENDATIONS
(1) Investigate the reason for the existence of a
longitudinal temperature profile and take appropriate
steps to alleviate this problem.
(2) Study the possibility of adding roughness in the
inter-fin cavity of Gewa-T tubes. This operation should
be performed before the rolling process to obtain the T-
shaped fins.
(3) Repeat runs made during this investigation with
water as the boiling medium.
80

APPENDIX A
DATA REDUCTION PROGRAM
'000!
1010!i 020!1030!10401050I 0601070108010901 1001110I 12011301 1401
1 501 1601170I 1801190120012101220123012401250125012701280129013001310132013301340135013601370138013901400141014201430144014501460147014801490150015101520153015401 5501560157015801590
~ILE "IAME: DRP2DATE: May 18. 1984REVISED: July 20. !384
"4X."6X"SX,
"Select option:''0 Tak inq data or'1 Plotting data'"
MainPlot
re-orocess inq previous data'
TUBE QD (0=0.75 in. in)". ltd
BEEPPRINTER ISPRINT USINGPRINT USINGPRINT USINGINPUT IdpIF ldp=0 THEN CALLIF Idp-1 THEN CALLENDSUB MainCOM /Cc/ C(7)DIM Emf (9> ,T(9)DATA 0. 10086091 .25727.34369.-767345.3295.78025595.31DATA -9247486589. 6. 97683E+1 1 . -2 .661 92E + 1 3 . 3 . 94073E + 1
4
READ C<*)BEEPINPUT "SELECTIF Itd-0 THEND1 - .0159 !
D2= . 01 93 ! UiameDi= .0133 !
Do=.0190 !
L=.0490 !
Lu=.0319 ! Length of unenhanced surface at the endsELSED1-. 01786D2= .0231Di=. 02032Do-. 02222L=.0503Lu=.03175END IFLc=Lu+<Do-Di)/2A=PI*(Do" 2-Di 2)/4P=PI*DoKcu=385 ! Thermal conductivity of CopperPRINTER IS 701CLEAR 709BEEPINPUT "ENTER MONTH. DATE AND TIME ( MM : DD : HH :MM : SS>" . DateSOUTPUT 709 :"TD": DateSOUTPUT 709:"TD"ENTER 709: DateS
Month, date and time
Diameter at thermocouple positionsDiameter of test section to the baseInside diameter of unenhanced endsOutside diameter of unenhanced endsLength of enhanced surfaceLength of unennanced surface at the
PRINTPRINTPRINTBEEPINPUTPRINTBEEPINPUT
USING "10X.""NOTE: Program name
'
: DateS
BOIL
"ENTER DISKUSING "1GX."
NUMBER", Dn"Disk number
"ENTER INPUT MODE (0=
"" .ZZ":Dn
3054A. I -FILE)", InIm =
IFIm+1
THENBEEPINPUT "GIVEPRINT USING
A NAME"16X."
P0R'New
THE RAW DATAfile name
:
FILE" ,D_f LieS. 14A" :D f ileS
81

1600!6!016201630164016501660167016801690! 700171017201730174017501760177017801790!300181013201830184018501860187013801390190019101920193019401950i960
19701980199020002010202020302040205020602070208020902100211021202130214021502'6021 702! 802190
BEEPINPUT "ENTER FLUID ( 0=FREON- 113 .
1 -WATER)" .CfCf-Cf+1CREATE BDAT D_FileS,20ASSIGN $File TO D_f ile£OUTPUT ?iFile:Date5,CfELSEBEEPINPUT "GIVE THE NAME OF THE EXISTING DATA FILE" .D_f i leSBEEPIhc-0INPUT "ENTER 1 IF USING FILE NUMBER < 25" .IhcPRINT USING "16X. ,,M
0ld file name: "". 1 4A" : D_f l leS
BEEPINPUT "ENTER THE NUMBER OF RUNS STORED" .NrtinASSIGN «File TO D_file$ENTER aFile:DoidS,CfPRINT USING "16X,""This output for file created at ""
. 1 4A" : DoIdSEND IF
BEEPINPUT "GIVE A NAME FOR PLOT FILE" .P_f i leSCREATE BDAT P_fiie$.5ASSIGN aPlot TO P_fileSIF Cf-1 THEN PRINT USING "16X .""FluidIF Cf-2 THEN PRINT USING "16X. ""FluidBEEPINPUT "ENTER OUTPUT VERSION <
t -SHORT. 0-LQNG)" . IovIF lov=0 THEM Iov=2BEEPINPUT "ENTER NUMBER OF DEFFECTIVE TCS <Q-DEFAULT>'IF ldtc>0 THENBEEPIF Idtc=1 THEMINPUT "ENTER DEFLECTIVE TC LOCATION" .LdtclPRINT USING "16X.""TC is deffective at location "'
END IFIF Idtc-2 THENINPUT "ENTER DEFFECTIVE TC LOCATIONS" , Ldtc 1 ,Ldtc2PRINT USING "16X.""TC are deffective at locationsEND IFEND IFIF Im-f THENBEEPINPUT "ENTER BAROMETRIC PRESSURE (inHg)".PatmPatm=Patm+2*1 500/1 3500OUTPUT 2>Fiie:PatmELSEENTER »)File:PatmIF Ihc-1 THEN Patm=Patm+2*1500/13500END IFPatm=Patm*25 .
4* 1 4 . 696/760Tsat=FNTsat<Cf .Patrn)PRINT USING "16X. ""Saturation temperature = ""
. 3D . DD. ""
< Deg C)'
J-1Sx=0Sy =
Sxs =
Sxy =
BEEPINPUT "HIT CONTINUE WHEN READY". 0k
Freon-1 1
3'
Water
Idtc
D":Ldtc1
D.4X.D":Ldtc1 .Ldtc2
; Tsat
82

2200 Repeat: !
2210 IF Im-I 'HEM2220 OUTPUT 709:"AR AF29 AL33 VR5"2230 FOR r=0 TQ 92240 OUTPUT 709: "AS SA"2250 Suin=02260 FOR J i=1 TO 202270 ENTER 709:E2280 Smn = Som+E2290 NEXT Ji2300 Emf<I>=Sum/202310 NEXT I
2320 BEEP2330 INPUT "ENTER HEATER VOLTAGE. Vh (V)
,,.Vh
2340 BEEP2350 INPUT "ENTER RESISTOR VOLTAGE. Ur (V>".Vr2360 ELSE2370 ENTER aFile:Emf <*> .Vr.Vh2380 END IF2390 Tua-02400 FOR 1=0 TO 92410 IF ldtc>0 THEN2420 IF (I+1)-Ldtc1 OR <I+1)-Ldtc2 THEM2430 T(I)=99.992440 GOTO 24902450 END IF2460 END IF2470 T(I)=FNTvsv(Emt <D )
2480 IF I<8 THEN Tua=Twa+T( I
)
2490 NEXT I
2500 Twa=Tuia/<8-Idtc)2510 Tld=T(9)2520 Tv=T<8>2530 Rho=FMRho<Cf .Tsat)2540 Mu=FNMu(Cf .Tsat)2550 K=FNK(Cf .Tsat)2560 Cp=FNCp(Cf .Tsat)2570 8eta=FNBeta(Cf .Tsat)2580 Ni=Mu7Rho2590 Alpha=K/(Rho*Cp)2600 Pr=Ni/Alpha2610 Amp=Vr/2.0312620 Q=Vh*AmD2630 Tu-Tua-Q-LQG<D2/D1 > /<2*PI*Kcu~L
)
2640 Thetab=Tw-Tsat2650 IF ThetaD<0 THEN2660 BEEP2670 OISP "TWALL<TSAT (HIT CONTINUE WHEN READY)"2680 PAUSE2690 GOTO 22102700 END IF2710 Hbar=1902720 Fe=<Hbar*P/(Kcu.*A) > .5*Lc2730 Tanh=FNTanh(Fe>2740 Theta=Thetab-Tann/Fe2750 Xx = <9.31*Beta*Thetab*Do 3*Tanh/<Fe*Ni*fHpha> ) .1666672760 Yy=(1+( .559/Pr) (9/16) )' (8/27)2770 Hbarc=K/Do*< .6+.387»Xx/Yy) 2
2780 IF ABS< < Hbar-Hbarc) /Hbarc ) > . 00 1 THEM2790 Hbar=(Hbar+Hbarc;*.52800 GOTO 2720

2810 END IF2320 Ql = (Hbar*P*x.cu*A) . 5*Thetab*Tann2830 Qc=Q-2*Ql2840 fls=PI*D2*L2850 Qdp=Qc/As2360 IF Iov-I THEN PRINT USING '"! OX . DD . 2X . 3D . DD . 2X .2< Z . 4DE . 2X> . DD . DD" : J . Twa.Hbar .Qdp. Thetab.2370 IF Iov=2 THEN2380 PRINT USING "1 OX. ""Data set number = ""
. DD" : J
2890 PRINT USING "1 OX .
,,
"Posi t ion numoer : 1 2 3 4 5 61 8
2900 PRINT USING "1 OX. ""Temperature :
"". 3( DD . DD . I X) " : T < ) . T< 1) . T( 2 ) , T( 3 ) .
T
(4) . T<5> ,T<6> .T(7>2310 PRINT USING "1 OX . ""Ti igd Tvapr Twa Hbar Qdp Thetab2920 PRINT USING "3X ,3(3D . DD .2X) . 2( Z . 4DE .2X > . 2D . DD" : T Id . Tv . Twa. Hbar , Qdp . ThetaD2930 END IF2940 IF Im-1 THEM2950 BEEP2960 INPUT "OK TO STORE THIS DATA SET ( 1 -Y . 0=N>?" .Ok2970 END IF2980 IF Ok-1 OR Im-2 THEN J = J + 1
2990 IF Ok-1 AND Im-1 THEN OUTPUT @Fi le :Emf < * > . Vr . Vh3000 IF Im=2 OR Ok=1 THEN OUTPUT «P lot :Odp . Thetab3010 IF Im-1 THEN3020 BEEP3030 INPUT "WILL THERE BE ANOTHER RUN (
I -Y . 0-N) 7" ,Go_jn3040 Nrun=J3U50 IF Go.onOI THEN 31103060 WAIT 30030 70 IF Go_on=! THEN Repeat3080 ELSE3090 IF J<Nrun+1 THEN Repeat3100 END IF3110 IF Im-1 THEM3120 BEEP3130 PRINT3140 PRINT USING "t OX . ""NOTE: "••.ZZ,'•
, data runs were stored in file,,,,
,!0A";J-1 .D_f ileS3'50 END IF3160 BEEP3 t 70 PRINT3180 PRINT USING "1 OX
. ""NOTE : "".ZZ."" X-Y pairs were stored in plot data file"", 10A":J-1 ,P_f ileS3190 ASSIGN iFile TO *
3200 ASSIGN wPlot TO *
3210 BEEP3220 INPUT "LIKE TO PLOT DATA ( 1 -Y , 0»N>?" .Ok3230 IF Ok-1 THEM3240 CALL Plot3250 END IF3260 SUBEND3270 DEF FNMu<Cf . T>
3230 IF Cf-I THEM3290! RANGE: 28 TO 50 DEG C3300 ttu=8.3629813E-4-T*< 1 . ! 094609E-5-T«5 . 566829E-8)3310 END IF3320 IF Cf-2 THEN3330 A=247.3/<T+133.15>3340 Mu=2.4E-5*l0 A
3350 END IF
84

3360 RETURN liu
3370 FNEND3380 DEF FNCp(Cf.T)3390 IF Cf-1 THEN3400! RANGE: TO 30 DEG C3410 Cp=9.2507273E-!+T*<9.3400433E-4+1 . 7207792E-6*T)3420 END IF3430 IF Cf-2 THEN3440 Cp=4.21120858-T*<2.26826E-3-T*(4.42361E-5+2.71428E-7*T)
)
3450 END IF
3460 RETURN Cp*10003470 FNEND3480 DEF FNRho(Cf.T)3490 IF Cf-1 THEN3500! RANGE: 30 TO 80 DEG C3510 Ro=1 .6207479E+3-TM2.2186346 + T*2.3578291E-3>3520 END IF3530 IF Cf-2 THEN3540 Ro=999.52946 + T*( .
!269-t*<5. 48251 3E-3-T-1 .234M7E-5))3550 END IF3560 RETURN Ro3570 FNEND3580 DEF FNPr(Cf.T)3590 Pr=FNCp<Cf ,T)*FNMu(Cf . T ) /FNK ( Cf . T)
3600 RETURN Pr3610 FNEND3620 DEF FNK(Cf.T)3630 IF Cf-1 THEN3640! RANGE: 30 TO 90 DEG C3650 K = 8.2095238E-2-TM2.2214286E-4 + T»2.3809524E-8>3660 END IF3670 IF Cf-2 THEN3680 X=(T+273. 15>/273.153690 K=-.92247+X*<2.8395-X*< I ,3007-X*< . 52577- . 07344»X )) )
3700 • END IF3710 RETURN K
3720 FNEND3730 DEF FNTanh(X)3740 P=EXP(X)3750 Q=EXP(-X>3760 Tanh=<P-0)/(P+Q)3770 RETURN Tanh3780 FNEND3790 DEF FNTvsv(V)3800 COM /Cc/ C(7)3310 T=C<0)3820 FOR 1=1 TO 7
2830 T-T+C(I>»V"I3840 NEXT I
3850 T=T+8.34643E-l-T*<2.4547896E-2-T»! .8722583E-4)3860 RETURN T
3370 FNEND3880 DEF FNBeta(Cf.T)3890 Rop=FNRho(Cf ,T+. 1
>
3900 Rom=FNRho<Cf .T-. 1
)
3310 Beta=-2/<Rop+Rom)*<Rop-Rom>/ .23920 RETURN Beta3930 FNEND3940 DEF FNTsaUCf .P>3950 Tl-103960 Th-110

3970398039904000401040204030404040504060406140704080408140824083408540904100411041204130414041504I60417041804190420042104220423042404250426042704280429043004310432043304340435043604370438043904400441044204430444044504460447044804490450045104520
2635*LGT(T>+2.0539E-3»T)
Ta=<Tl+Th>*.5Pc=FNPsat<Cf . Ta)IF ABS< (P-Pc)/P)>.0001 THEfIF Pc>P THEN Th=TaIF Pc<P rHEN Tl=TaGOTO 3970END IFRETURN TaFNENDDEF FNPsat(Cf . Tc)IF Cf-1 THENT=Tc*! .8+32+459.6P=I0"<33. 0655-4330. 98/T-9END IFIF C r =2 THENP=Pvstu(Tc)END IFRETURN P
FNENDSUB PlotDIM C(9)INTEGER IiPRINTER IS 1
Idv-1BEEPINPUT "LIKE DEFAULT VALUES FOR PLOT <!=Y.0=N>BEEPPRINTPRINTPRINTPRINTPRINTINPUTIF Po=3BEEPINPUT "SELECTEND IFPRINTER IS 705IF IdvOI THENBEEP
'ENTER
Idv
USINGUSINGUSINGUSINGUSINGOpo
THEN
"4X,"4X"4X,"4X"4X,
"Select Option:"0 q versus delta-T'
h versus delta-Th versus qh-ratio versus delta-T'
'1
TUBE DIAMETER <0=.75 IN> ".ltd
INPUTBEEPINPUT "ENTERBEEPINPUT "ENTERBEEPINPUT "ENTERELSECy = 3
IF 0do=0 THEMCx-2Xmi n=
1
Ymin=!000END IF'IF Odo-I THENCx=2Xm l
n=
'
Ynin=1 00END IFIF 0po=2 THEMCx=3
NUMBER
NUMBER
OF
OF
CYCLES
CYCLES
FOR
FOR
X-AXIS". Cx
Y-AXIS". Cy
MIN X-VALUE (MULTIPLE OF IO)",Xmin
MIN Y-VALUE (MULTIPLE OF IO>",Ymin
86

4530 Xmin=l00G-4540 Ymin='004550 END IF4b60 IF dpo-3 THEN4570 Cx = 2
4580 Cy = 3
4590 Xirun= 1
4600 Ymin=
1
4610 END IF4620 END IF4630 BEEP4640 PRINT "IN:SP1 :IP 2300. 18 00,3300 .68004650 PRINT "SC . 1 00 . . 1 00 : TL 2.0;"4660 Sfx=100/Cx4670 Sfy=100/Cy4680 PRINT "PU 0.0 PD"4690 Nn = 94700 FOR 1=1 TO Cx+14710 Xat=Xmin*10' ( 1-1
>
4720 IF r-Cx+1 THEN Nn-14730 FOR J=1 TO Nn4740 IF J-1 THEN PRINT "TL 2 0"
4750 IF J=2 THEN PRINT "TL 10"
4760 Xa=Xat*J4770 X=LGT(Xa/Xmin>*Sf x
4780 PRINT "PA":X.".0: XT:"4790 NEXT J4800 NEXT I
43 10 PRINT "PA I00.0:PU:"4820 PRINT "PU PA 0.0 PD"4830 Nn = 9
4840 FOR 1=1 TO Cy+14850 Yat = Ymin*10' <I-1
)
4860 IF I=Cy+! THEN Nn=14370 FOR J-1 TO Nn*380 IF J-1 THEN PRINT "TL 2 0"
4890 IF J-2 THEN PRINT "TL 10"
4900 Ya=Yat*J4910 Y = LGT(Ya/Ynun>»Sfv4920 PRINT "PA 0.":Y."YT"4930 NEXT J4940 NEXT I
4950 PRINT "PA 0, 100 TL 2"
4960 Nn = 94970 FOR 1=1 TO Cx+14980 Xat = Xmin*10' ( 1-1
)
4990 IF I-Cx+t THEN Nn=15000 FOR J-1 TO Nn5010 IF J-1 THEM PRINT "TL
-> *•
5020 IF J>1 THEN PRINT "TL 1"
5030 Xa=Xat*J5040 X = LGT(Xa/Xnun>*Sfx5050 PRINT "PA";X.", 100: XT"5060 NEXT J
5070 NEXT I
5080 PRINT "PA 100. 100 PU PA 100.0 P D"5090 Nn = 95'00 FOR 1=1 TO Cy+!5110 Yat = Ynun~10 ( 1-1
>
5'20 It- I=Cy+! THEN Nn-!5130 FOR J-1 TO Nn
87
5140 IF J- I THEN PRINT "TL Q 2"
5150 IF J>1 THEN PRINT "TL 1"
5160 Ya-Yat*J5170 Y=LGT(Ya/Ymin)*Sfy5130 PRINT "PD PA I 00 ."
. Y ."YT"5190 NEXT J
5200 NEXT I
5210 PRINT "PA 100. !U0 PIT5220 PRINT "PA 0.-2 SR 1 .5,2"5230 Ii=LGT(Xmin)5240 FOR 1=1 TO Cx + 1
5250 Xa=Xmin*10 (1-1
>
5260 X=LGT(Xa/Xmin>*Sfx5270 PRINT ,,PA":X.".0:"5290 IF li> = THEN PRINT "CP -2 , -2 :LB1 :PR -2 .2 ;LB" ; 1 1 ;
""
5290 IF li<0 THEN PRINT "CP -2 . -2 :LB1 :PR ,2;LB" : Ii:""
5300 Ii-Ii+15310 NEXT I
5320 PRINT "PU PA 0.0"5330 Ii-LGT(Ymin)5340 Y10-I05350 FOR 1=1 TO Cy + 1
5360 Ya=Ymin*10 (1-1)5370 Y=LGT(Ya/Ymin)*Sfy5380 PRINT "PA 0.":Y,""5390 PRINT "CP -4
.- .25 : LB1 :PR -2 .2 ; LB" : 1 1
: ""
5400 Ii-Ii+15410 NEXT I
5420 IF IdvOI THEN5430 BEEP5440 INPUT "ENTER X-LABEL" . X laDeiS5450 BEEP5460 INPUT "ENTER Y-LABEL" . Y laoelS5470 ELSE5480 IF Opo-0 THEN5490 XlabelS»"Tuj-Tsat (K>"5500 YlabelS="q <W/m 2)"5510 END IF5520 IF Dpo=1 THEN5530 XlabelS="Tu-Tsat < K
)
"
5540 YlabelS="h <W/m 2.K)"5550 END IF5560 IF 0po=2 THEN5570 XlabelS="a (W/m 2>"5580 YlabelS="h (W/m 2.K)"5590 END IF5600 IF Gpo=3 THEN5610 XlabelS="T u -Tsat <K>"5620 Y Labe lS="h(enh)/h( smooth)"5630 END IF5640 END IF5650 PRINT "SR l.5.2;PU p A 50.-16 CP" : -LEN(XlabelS>/2: "0 :LB" : XlabelS
:
'
5660 PRINT "PA -14.50 CP . " : -LEN< Y labe IS) /2*5/6 :
"DI . 1 :LB" : Y labe IS:
'
5670 PRINT "CP 0.0 DI"5680 Repeat:
!
5690 BEEP5700 INPUT "WANT TQ PLOT DATA FROM A FILE ( I -Y ,0-N)?" .Ok5710 IF Q|c-1 THEM5720 BEEP5730 INPUT "ENTER THE NAME OF "HE DATA FILE" .D_f i leS5740 ASSIGN ©File TO D f ileS
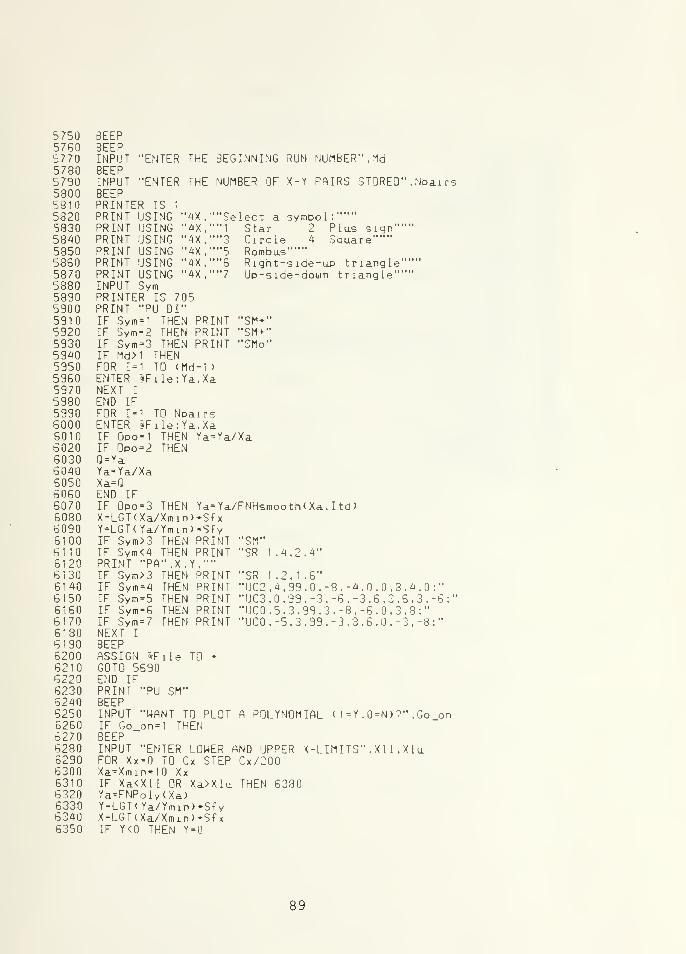
5750576057705780579058005810532058305840585058605870538058905900591059205930594059505960597059805990600060106020603060406050606050706080609061006110612061306140615061606170613061906200621062206230624052506260627062806290630063106320633063406350
BEEPBEEPINPUTBEEPINPUTBEEPPRINTER ISPRINT USING
•ENTER
•ENTER
THE BEGINNING RUN NUMBER" . Md
THE NUMBER OF X-Y PAIRS STORED" .Npairs
USINGUSINGUSINGUSINGUSINGSym
"4X"4X"4X"4X"4X"4X
elect a symbol :'"
Star 2 PI as sign"'Circle 4 Square"""RombusRight-side-up triangle'Up-side-doun triangle'"
PRINTPRINTPRINTPRINT USING "4X.""6PRINT USING "4X,""7INPUTPRINTER IS 705PRINT "PU DI"IF Sym=1 THEN PRINT "SM»"IF Sym=2 THEN PRINT "SM+"IF Sym=3 THEN PRINT "SMo"IF Md>1 THENFOR 1=1 TO <Md-1 )
ENTER «File;Ya.XaNEXT I
END IFFOR 1=1 TO NpairsENTER §»File:Ya.XaIF 0po=1 THEN Ya=Ya/XaIF 0po=2 THENQ = YaYa=Ya/XaXa=0END IFIF 0po=3 THEN Ya=Ya/FNHsmooth(XaX=LGT(Xa/Xmin)*SfxY=LGT(Ya/Ymin)*SfyIF Sym>3 THEN PRINT "SM"IF Sym<4 THEN PRINT "SR 1.4,2.4"PRINT "PA".X.Y.""IF Sym>3 THEN PRINT "SR 1
PRINTPRINTPRINTPRINT
ltd)
IFIFIFIF
THEMTHENTHENTHEN
"SR"UC2"UC3"IJCO
"UC0
4.990.99
6"
0.-8.-4.0.0.3.4.0.-3,-6,-3.6.3.6.3.'99.3.-8.-6.0,3.8:"
5.3.99.-3.3.6.0.-3.-8:"
Sym = 4
Sym = 5
Sym = 6Sym=7
NEXT I
BEEPASSIGN &File TO *
GOTO 5690END IFPRINT "PU SM"BEEPINPUT "WANT TO PLOT A POLYNOMIAL H=Y.0=N)IF Go_on=1 THENBEEPINPUT "ENTER LOWER AND UPPERFOR Xx = TO Cx STEP Cx/200Xa=Xmin*l0 XxIF Xa<Xll OR Xa>Xlu THEN 6330Ya=FNPol y (Xa)Y=LGT< Ya/Ymin)»SfyX=LGT(Xa/Xmin)*SfxIF Y<0 THEN Y=0
, bo on
X-LIMITS".Xll,Xlu
89

536(J ir Y > i U "HEN GOTO 63306370 PRINT "PA".X.Y."PD"6330 NEXT Xx6390 END IF6400 PRINT "PU PA 0.0 3P0"6410 SUBEND6420 DEF FNHsmoorhCX . ltd)6430 Hs=FNPoly<X>/X6440 IF Itd=1 THEN Hs=Hs*. 833476450 RETURN Hs6460 EMEND6470 DEF FNPoly(X)6480 Poly=-4.41237I8E+2-X»<6.8123917E+2-X»3.7416863E+2>6490 RETURN Poly6500 FNEND6510 DEF FNPvst(Tsteajn)6515 DIM K<8>6520 DATA -7
. 691 234564 . -26 . 08023696 .-! 68 . 1706546.64.23285504.-1 18.96462256525 DATA 4 . 1 671 1 732 .20 .9750676 . 1 ,E9 ,66530 READ K<»)6535 T=(Tsteam+273.15)/647.36540 Sum=06545 FOR N=0 TO 4
6550 Sum = Sum+K<N>*< l-T) (N+! )
6555 NEXT M6560 Br=Sum/<T*< 1+K<5)*<1-T)-H<<6>*<1-T> "2> >-< 1 -T>/(K<7>*< ?-T) "2+K(8>)6565 Pr=EXP<Br>6570 P=22120000*Pr6575 RETURN P
6580 FNEND
90

APPENDIX B
SAMPLE CALCULATIONS
Data set number fifteen of file GT6H29 corresponding to
tube number 6 was chosen for the sample calculation.
A. TEST-SECTION DIMENSIONS
O.D. = 25.30 (mm)
HF
= 1.05 (mm)
fins/mm = 1.02
inter--fin gap = 0.25 (mm)
D2
= 23.10 (mm)
Dl
= 17.86 (mm)
Do
= 22.22 (mm)
D.l
= 20.32 (mm)
Lu
= 31.75 (mm)
L = 50.80 (mm)
B. MEASURED PARAMETERS
V = 70.0 (volts)
VRES= 4.8 (volts)
R =2.0 31 (ohms)
kc
= 383 (W/m.K)
T1
= 54.23 (°C)
T2
= 54.29 (°C)
T3
= 53.91 (°C)
91

T4
= 53.65 (°C)
T5
= 53.40 (°C)
T c= 53.31 (°C)
T?
= 53.22 (°C)
Tg = 53.54 (°C)
TSAT
' = 47.51 CC)
C. PROPERTIES OF FREON-113 AT SATURATION TEMPERATURE
U = 4.948 x 10" 4(kg/m.s)
p = 1510.0 (kg/m3
)
Cp
= 0.973 (kJ/kg.K)
k = 0.0715 (W/m.K)
D. HEAT-FLUX CALCULATION
The heat transfer rate from the cartridge heater:
QH= VI (W) and I = V
R£S/R (amps)
I = 4.8/2.031 = 2.363 (amps)
Qu = 70.0x2.363 = 165.410 (WOH
The cross-sectional area of machined ends
An = n/4.0(D 2- D
2) (m
2)C o i
A = tt/4.0 (0.022222
- 0.020322
) = 63.481 xio" 6(m
2
92

The tube outside wall perimeter:
P = uD = 3.1416x0.02222 = 6.981x10 2(m)
o
The corrected length of ends
Ln = L r7 + t/2.0 t = D - D.C U o l
L = 0.03175 + (0.02222 - 0.02032)/2.0 = 32.7 x 10" 3(m)
Other thermophysical properties:
v = y/p = 4.948x10 4/1510.0 = 3.277x10 7
(m2/s;
a = k/pCp
= 0.0715/(1510.0x973) = 4.866x10 8(m
2/s;
1 A_p 1 , 1509.77 - 1510.26 ,
yp AT 1510 1 47.61 - 47.41 '
= 0.00162 (1/K)
Pr = v/a = 3.277x10 7/4. 866x10 8
= 6.734
Temperature at the base of the T-shaped fins
ln(D /D )
Tn = T_„_ - QTB AVG *H 2 tt L k,
TAVG
=( I T
N )/8-° = 53 ' 69 (
°C:
n=l
T 53 69 - 165 41ln ( 23 - 1/17 . 86)
5_ _. , .
B-LDD.ix
2ttx0. 0508x383 DJ,J4 K U'
93

B= TB" T
SAT= 53 ' 342 " 47 ' 51 = 5 ' 832
(R )
Average heat-transfer coefficient at the unenhanced
ends :
^ Do
eBTH(k^)1/2L
c|i 1/6
vaL_, (
C C
hP , 1/2
h = ^-< 0.60 +0.387c k
cAc
[l + (0.559/Pr)9 / 16
]
8/ 27
h = 187.49 (W/m .K)
Heat- transfer rate through unenhanced ends
JkQF= VhPk
cAc
9B
Tanh mLc
m =hP ,1/2 .187.489 x6.981 x 10
-2 1/2
kcV 0.0715 x 63.481 x 10-6
= 1.698 x 10"
QF= 3.29 (W)
QL0SS= 2Q
F= 6 - 579 (W:
Heat flux through Gewa-T surface
Q " QH " QLOSS
94
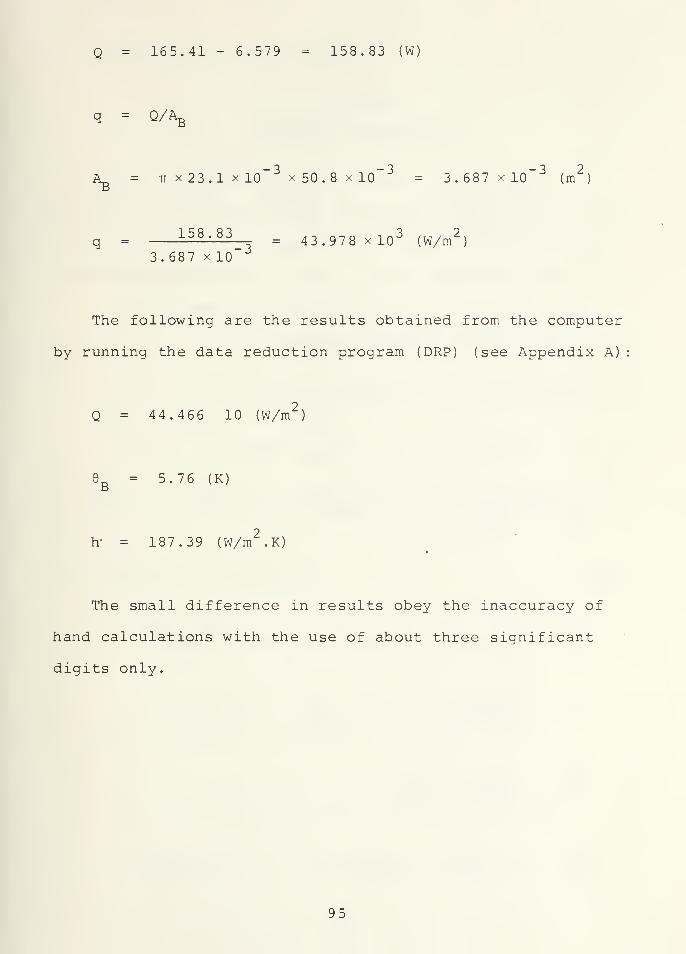
Q = 165.41 - 6.579 = 158.83 (W)
q = Q/Ag
A = tt x23.1 x 103 x50.8 x 10
3= 3.687 x 10
3(m
2
= 43.978 x 10³
(W/m2
3.687 x 10³
The following are the results obtained from the computer
by running the data reduction program (DRP) (see Appendix A)
q = 44.466 10 (W/m2
)
>
B= 5.76 (K)
h" = 187.39 (W/m2.K)
The small difference in results obey the inaccuracy of
hand calculations with the use of about three significant
digits only.
95
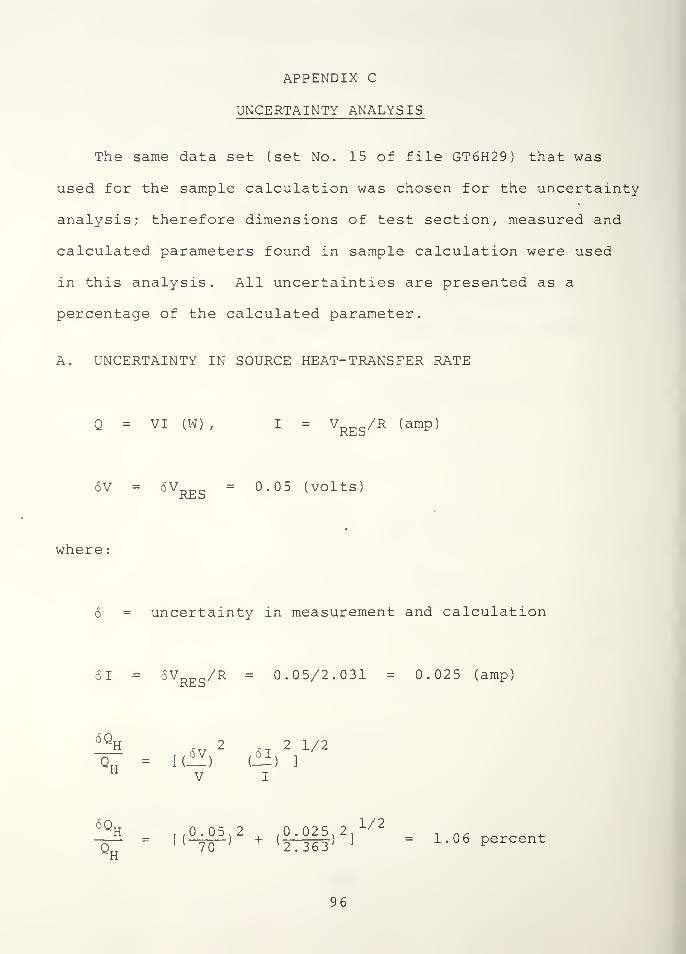
APPENDIX C
UNCERTAINTY ANALYSIS
The same data set (set No. 15 of file GT6H29) that was
used for the sample calculation was chosen for the uncertainty
analysis; therefore dimensions of test section, measured and
calculated parameters found in sample calculation were used
in this analysis. All uncertainties are presented as a
percentage of the calculated parameter.
A. UNCERTAINTY IN SOURCE HEAT- TRANSFER RATE
Q = VI (W) , I = VRES
/R (amp)
6V = SV^g = 0.05 (volts)
where
6 = uncertainty in measurement and calculation
61 = 5VT5r, c/R = 0.05/2.031 = 0.025 (amp)
6QH ... 2 2 1/2"or = K-) (— ) ]H VI|M . ((«-,^ («|,V/2
= 1. OS percentH
96

B. UNCERTAINTY IN SURFACE AREA
A^ = ttD^L 6D = 6 T 0.1 (mm)D Z Z Li
5AB 1
21
2 1/2
aJ "&T' + <M» ] = °- 48 Percent
C. UNCERTAINTY IN AT
AT = T - T 6T = 5T = 0.15 (°C)ai W SAT W SAT V ;
AT AT
5AT r ,0.15 N 2 , 0.15,2AT"
= [i 67T8 ) + (_6TT8 ) ] =3.43 percent
D. UNCERTAINTY IN HEAT FLUX
QH * 2QF
q =*B
Ra 6QH 22SQF 2
SAB 2
1/223, = [( 5
)
z + i EL)'' + (_ —2.)z
l
In this case, Qu = 165.41 (W) and Q_ = 3.29 (W)n r
97
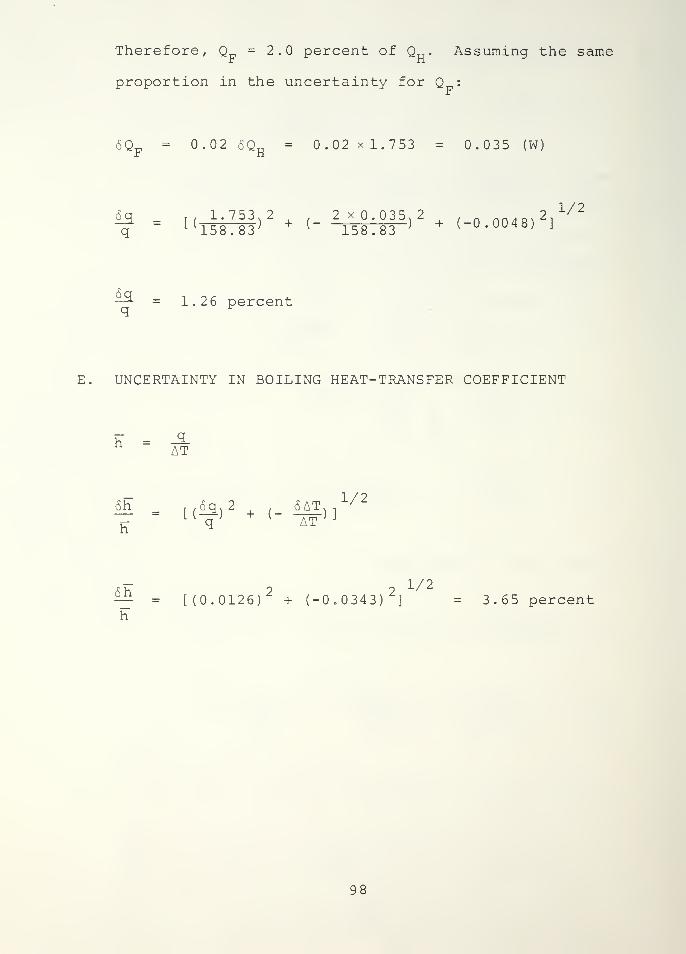
Therefore, Q = 2.0 percent of Q . Assuming the same
proportion in the uncertainty for Q :
F
6Q„ = 0.02 6QU = 0.02x1.753 = 0.035 (W!r n
5q _ 1.753 2 2 x 0.035 ,2 nn48> 2l
1/2
T " L( 158.83 } + ( 158.83 ) + (-°- 0048) J
— = 1.26 percent
E. UNCERTAINTY IN BOILING HEAT-TRANSFER COEFFICIENT
h = qAT
h
-[( 6a,2 + (
. 5AT 1/2
qv AT ; J
— 1/2— = [(0.0126)2
+ (-0.0343)2
] = 3.65 percent
98
LIST OF REFERENCES
1. Marto, P., and Lepere , V., "Pool Boiling Heat Transferfrom Enhanced Surfaces to Dielectric Fluids," Journal ofHeat Transfer , vol. 104, May 1982, pp. 292-299.
2. Chongrungreon, S., and Sauer, Jr., H.T., "NucleateBoiling Performance of Refrigerants and Refrigerant-OilMixtures," J. of Heat Transfer , vol. 102, pp. 701-705,1980.
3. Van Stralew, S., and Cole, R. , "Boiling Phenomena," v. 1,McGraw-Hill Book Company, 1979, p. 117.
4. Nishikawa, K. , and Ito, T., "Augmentation of NucleateBoiling Heat Transfer by Prepared Surfaces," Japan-UnitedStates Heat Transfer Joint Seminar , Tokyo, Sept. 1980.
5. Yilmaz, S., and Westwater, J., "Effect of CommercialEnhanced Surfaces on the Boiling Heat Transfer Curve,"Advances in Enhanced Heat Transfer , p. 74 , 1981.
6. Bergles, A., and Chyu, M. , "Characteristics of NucleatePool Boiling from Porous Metallic Coatings," Advances inEnhanced Heat Transfer , pp. 63-64, 1981.
7. Marto, P., and Hernandez, B., "Nucleate Pool BoilingCharacteristics of a Gewa-T Surface in Freon-113,"Heat Transfer-Seattle 1983, No. 225, vol. 79, pp. 1-9.
8. Hernandez, B., "An Experimental Study of Nucleate PoolBoiling Heat Transfer from a Gewa-T Finned Surface inFreon-113," 1982, pp. 32-40.
9. Lepere, V., "Pool Boiling Heat Transfer from EnhancedSurfaces to Dielectric Fluids," 1981, pp. 37-41.
10. Incropera, F.P., and DeWitt, D.P., Fundamentals of HeatTransfer , John Wiley and Sons, Inc., New York, N.Y.,p. 447, 1981.
11. Cornwell, K. , Schuller, R. , and Einarsson, J., "TheInfluence of Diameter on Nucleate Pool Boiling OutsideTubes," Heat Transfer , v. 4, pp. 47-52, 1982.
12. Rehm, J., and Bankoff, S., "Convective Boiling in a NarrowConcentric Annulus ,
" AIAA 19th Thermophysics Conferece,June 24-28, 1984, Snowmass, Colorado.
99
INITIAL DISTRIBUTION LIST
No. Copies
1. Defense Technical Information Center 2
Cameron StationAlexandria, Virginia 22314
2. Library, Code 0142 2
Naval Postgraduate SchoolMonterey, California 93943
3. Department Chairman, Code 69 1
Department of Mechanical EngineeringNaval Postgraduate SchoolMonterey, California 93943
4. Professor Paul J. Marto, Code 69Mx 2
Department of Mechanical EngineeringNaval Postgraduate SchoolMonterey, California 93943
5. Dr. A.S. Wanniarachchi, Code 69Wa 1
Department of Mechanical EngineeringNaval Postgraduate SchoolMonterey, California 93943
6. Mr. Fred Weiler 1
Wieland-America IncorporatedOrange, New Jersey 07050
7. Mr. Klaus Menze 1
Wieland Werke AGWEST GERMANY
8. TNEI Ricardo Pulido 1
Apartado Aereo No. 5878CartagenaCOLOMBIA
100


13 5 3 7 5


2107G8
ThesisP9hj6k Pulidoc.l Nucleate pool boiling
characteristics of Gewa-
T finned surfaces inFreon-113.
2107G8
ThesisP9l+T6 1+
c. 1
PulidoNucleate pool boiling
characteristics of Gewa-
T finned surfaces in
Freon-113.