Nuclear magnetic resonance and magnetization study of surfactant-coated epsilon-Co nanoparticles
7
Nuclear magnetic resonance and magnetization study of surfactant-coated epsilon-Co nanoparticles William Hines * ,1 , Joseph Budnick 1 , David Perry ** ,1 , Sara Majetich 2 , Ryan Booth 2 , and Madhur Sachan 2 1 Department of Physics, University of Connecticut, Storrs, CT 06269, USA 2 Physics Department, Carnegie Mellon University, Pittsburgh, PA 15213, USA Received 5 April 2010, revised 20 July 2010, accepted 26 July 2010 Published online 27 August 2010 Keywords nanoparticles, nuclear magnetic resonance, magnetization, surfactants * Corresponding author: e-mail [email protected], Phone: (860) 486-2343, Fax: (860) 486-3346 ** e-mail [email protected] A combination of 59 Co spin-echo nuclear magnetic resonance (NMR) and dc magnetization measurements have been carried out on two samples of surfactant-coated Co nanoparticles in disordered assemblies; 6.5 nm diameter e-Co and 12 nm diameter hcp-Co. The e-Co nanoparticles exhibit superpar- amagnetic behavior with a blocking temperature T B ¼ 70 K, while the hcp-Co nanoparticles remain ferromagnetic up to room temperature. In addition, the initial susceptibility for the e-Co nanoparticles can be described by the Curie–Weiss law with a negative Q ¼158 K. The NMR signal from the hcp-Co sample is strong at 77 K with no applied magnetic field; the spectra are straightforward and similar to that for bulk hcp Co. However, the NMR signal from the e-Co sample is not detectable at 77 K, even with fields up to 7.5 kOe. A NMR signal appears at 4.2 K; the echo amplitude increases dramat- ically with applied field. The spectra, which must be corrected for T 2 effects, are quite broad and characteristic of the small particle size. Due to the broadening, there were no observable spectral features which could be assigned to the two Co sites in crystalline e-Co. The results are discussed in the light of interparticle interactions which reduce the initial susceptibility and lead to negative Q-values. Estimates are given for the magnetic dipolar and magnetocrystalline anisotropy energies of the particles in both samples. ß 2011 WILEY-VCH Verlag GmbH & Co. KGaA, Weinheim 1 Introduction During the past decade, considerable research effort has been invested in the preparation and study of nanometer size metallic particles, including e-Co, in which high temperature solution chemistry techniques are employed in the preparation either by (i) the reduction of metal salts or (ii) the decomposition of organometallic precursors. These techniques result in particles coated with a variety of molecules, including polymers and surfactants, which control particle growth and stablize the particles by preventing oxidation and aggregation [1]. Due to the fact that nanometer size metallic particles have a significant number of atoms at or near the surface, they possess a variety of unique physical properties of interest for both basic and technological reasons. Applications range from magnetic storage media to catalytic materials. Samples of nanoparti- cles exist in completely random arrangements such as magnetic colloids (ferrofluids) as well as self-assemblies of two and three-dimensional dense packed arrays (colloidal crystals) [2–4]. Magnetic nanoparticles, such as Fe, Ni, and Co, are single domain and because of their nanometer size, magnetic moment fluctuations (superparamagnetism) are important. In addition, the magnetic dipole interaction energy between the particles is comparable to the single- particle anisotropy, Zeeman, and thermal energies [5, 6]. In a recent review, the effects of magnetostatic interactions between monodisperse single-domain nanoparticles are discussed in terms of the particle concentration and structural ordering within the assembly [7]. It has been known for a long time that bulk elemental cobalt exists in two stable crystalline phases at ambient pressure, hexagonal close-packed (hcp) and face-centered cubic (fcc). Although room temperature cobalt samples exist which exhibit both structures along with stacking faults, the bulk hcp phase is preferred below 420 8C, while the bulk fcc phase is preferred at higher temperature [8]. In the case of nanometer scale particles, however, the fcc phase is Phys. Status Solidi B 248, No. 3, 741–747 (2011) / DOI 10.1002/pssb.201046164 p s s basic solid state physics b status solidi www.pss-b.com physica ß 2011 WILEY-VCH Verlag GmbH & Co. KGaA, Weinheim
-
Upload
william-hines -
Category
Documents
-
view
213 -
download
0
Transcript of Nuclear magnetic resonance and magnetization study of surfactant-coated epsilon-Co nanoparticles

Phys. Status Solidi B 248, No. 3, 741–747 (2011) / DOI 10.1002/pssb.201046164 p s sb
statu
s
soli
di
hysi
ca
Nuclear magnetic resonance andmagnetization study of surfactant-coatedepsilon-Co nanoparticles
William Hines*,1, Joseph Budnick1, David Perry**,1, Sara Majetich2, Ryan Booth2, and Madhur Sachan2
basic solid state physicswww.pss-b.comp
1 Department of Physics, University of Connecticut, Storrs, CT 06269, USA2 Physics Department, Carnegie Mellon University, Pittsburgh, PA 15213, USA
Received 5 April 2010, revised 20 July 2010, accepted 26 July 2010
Published online 27 August 2010
Keywords nanoparticles, nuclear magnetic resonance, magnetization, surfactants
* Corresponding author: e-mail [email protected], Phone: (860) 486-2343, Fax: (860) 486-3346** e-mail [email protected]
A combination of 59Co spin-echo nuclear magnetic resonance
(NMR) and dc magnetization measurements have been carried
out on two samples of surfactant-coated Co nanoparticles in
disordered assemblies; 6.5 nm diameter e-Co and 12 nm
diameter hcp-Co. The e-Co nanoparticles exhibit superpar-
amagnetic behavior with a blocking temperature TB¼ 70 K,
while the hcp-Co nanoparticles remain ferromagnetic up to
room temperature. In addition, the initial susceptibility for the
e-Co nanoparticles can be described by the Curie–Weiss law
with a negative Q¼�158 K. The NMR signal from the hcp-Co
sample is strong at 77 K with no applied magnetic field; the
spectra are straightforward and similar to that for bulk hcp Co.
However, the NMR signal from the e-Co sample is not
detectable at 77 K, even with fields up to 7.5 kOe. A NMR
signal appears at 4.2 K; the echo amplitude increases dramat-
ically with applied field. The spectra, which must be corrected
for T2 effects, are quite broad and characteristic of the small
particle size. Due to the broadening, there were no observable
spectral features which could be assigned to the two Co sites in
crystalline e-Co. The results are discussed in the light of
interparticle interactions which reduce the initial susceptibility
and lead to negative Q-values. Estimates are given for the
magnetic dipolar and magnetocrystalline anisotropy energies of
the particles in both samples.
� 2011 WILEY-VCH Verlag GmbH & Co. KGaA, Weinheim
1 Introduction During the past decade, considerableresearch effort has been invested in the preparation and studyof nanometer size metallic particles, including e-Co, inwhich high temperature solution chemistry techniques areemployed in the preparation either by (i) the reduction ofmetal salts or (ii) the decomposition of organometallicprecursors. These techniques result in particles coated with avariety of molecules, including polymers and surfactants,which control particle growth and stablize the particles bypreventing oxidation and aggregation [1]. Due to the fact thatnanometer size metallic particles have a significant numberof atoms at or near the surface, they possess a variety ofunique physical properties of interest for both basic andtechnological reasons. Applications range from magneticstorage media to catalytic materials. Samples of nanoparti-cles exist in completely random arrangements such asmagnetic colloids (ferrofluids) as well as self-assemblies oftwo and three-dimensional dense packed arrays (colloidal
crystals) [2–4]. Magnetic nanoparticles, such as Fe, Ni, andCo, are single domain and because of their nanometer size,magnetic moment fluctuations (superparamagnetism) areimportant. In addition, the magnetic dipole interactionenergy between the particles is comparable to the single-particle anisotropy, Zeeman, and thermal energies [5, 6]. In arecent review, the effects of magnetostatic interactionsbetween monodisperse single-domain nanoparticles arediscussed in terms of the particle concentration and structuralordering within the assembly [7].
It has been known for a long time that bulk elementalcobalt exists in two stable crystalline phases at ambientpressure, hexagonal close-packed (hcp) and face-centeredcubic (fcc). Although room temperature cobalt samples existwhich exhibit both structures along with stacking faults, thebulk hcp phase is preferred below 420 8C, while the bulk fccphase is preferred at higher temperature [8]. In the case ofnanometer scale particles, however, the fcc phase is
� 2011 WILEY-VCH Verlag GmbH & Co. KGaA, Weinheim

742 W. Hines et al.: NMR and magnetization study of surfactant-coated epsilon-Co nanoparticlesp
hys
ica ssp st
atu
s
solid
i b
preferred at room temperature [9]. Ten years ago, a newphase of cobalt was identified by Dinega and Bawendi [10]which only occurs in Co nanoparticles and has beendesignated epsilon cobalt (e-Co). This new phase has thesame structure as the beta phase of elemental manganese (b-Mn), i.e., it is cubic (P4132) with a unit cell parameter of6.097� 0.001 A and contains 20 Co atoms per unit cellwhich are divided into two types (12 Co type I and 8 Co typeII). Dinega and Bawendi [10] report that the densities for e-Co, fcc-Co, and hcp-Co are 8.635 g/cm3, 8.788 g/cm3, and8.836 g/cm3, respectively, while the Co moment values are1.70 mB, 1.75 mB, and 1.72 mB, respectively.
This report presents a 59Co spin-echo nuclear magneticresonance (NMR) and dc magnetization study of themagnetostatic interactions in two powder samples ofsurfactant-coated Co nanoparticles. The samples are dis-ordered assemblies of 6.5 nm diameter e-Co and 12 nmdiameter hcp-Co nanoparticles, prepared by a solutionchemistry technique (decomposition of an organometallicprecursor).
2 Experimental procedure Surfactant-coated nano-particles were synthesized using an air-free high boilingpoint solution procedure [11]. The solvents were dicholor-obenzene (boiling point 180 8C) for e-Co and octyl ether(boiling point 286 8C) for hcp-Co. The particles were thenwashed with ethanol to get rid of the excess surfactant fromthe solution and redispersed into another solvent (toluene fore-Co and cyclohexanone for hcp-Co). To prepare the powdersamples, the particles were precipitated on a magnet fromtheir solutions (toluene and cyclohexanone, respectively) byadding ethanol. The precipitate was left to dry inside anargon glove-box (oxygen content< 1 ppm) so that anyremaining solvent evaporates. Once the particles were dry(i.e., powder form), they were immobilized and sealed intoglass ampules using eicosane. At no time were the particlesexposed to the atmosphere. The sample preparationdescribed above results in the particles forming disorderedassemblies. Transmission electron microscopy (TEM) wasused to determine the particle size distribution and shape,while both X-ray diffraction (XRD) and electron diffractionwere used to confirm the crystal structure. A representativeTEM image and XRD scan can be found in an earlier study[12]. The particles can be described as equi-axed, but notperfectly spherical, with a size distribution being within 10%of the average diameter. In particular, the average particlediameter for the e-Co sample was 6.5 nm, while the averageparticle diameter for the hcp-Co sample was 12 nm.
59Co spin-echo NMR spectra were obtained over thefrequency range from n¼ 150 to 250 MHz using a Matecmodel 7700 pulsed-oscillator mainframe and model 765pulsed-oscillator/receiver, with the samples in a tuned circuitthat was matched to 50V. The NMR echo amplitude wasoptimized using a standard tp1-t-tp2 spin-echo pulsesequence with tp1, tp2¼ 3.0–5.0ms RF pulses, a pulseseparation of t¼ 15ms, and a repetition rate of 33 Hz.Useable spectra were obtained by averaging the NMR
� 2011 WILEY-VCH Verlag GmbH & Co. KGaA, Weinheim
signals 500–1000 times at 2.0–5.0 MHz intervals across thespectrum. Spin-echo spectra were obtained at 77, 4.2, and1.3 K, in zero field and in fields up to 7.5 kOe. Thespectrometer NMR sensitivity (including the 1/n2 correc-tion) was monitored over the entire frequency range byinjecting an RF calibration pulse signal using a 50V antenna.Measurements of the spin–spin relaxation timeT2 were madeat various frequencies by varying the pulse separation timefrom t¼ 10 to 50ms. As discussed below, the frequencydependence of T2 can result in a significant correction to theNMR spectrum.
Measurements of the dc magnetization were carried outfor very low magnetic fields �10.0 Oe�H�þ10.0 Oe overthe temperature range 5 K� T� 325 K using a QuantumDesign MPMS-5 SQUID magnetometer.
3 Results and analysisMagnetization Figure 1a shows the measured e-Co
sample magnetic moment as a function of the (nominal)SQUID magnetic field �10.0 Oe�H�þ10.0 Oe for fivetemperatures in the range 100 K� T� 200 K. Figure 1bshows the same measurements for five temperatures in therange 225 K� T� 325 K. For these field and temperatureranges, the magnetic response is linear enabling a calculationfor the temperature dependence of the initial samplemagnetic susceptibility xi from the respective slopes.[Note that there is a small offset of þ1.5 Oe along themagnetic field axis which is due to the small residual field inthe SQUID superconducting magnet. Due to its very strongmagnetic response, it turned out that this e-Co sample wasextremely useful for accurately setting the SQUID magneticfield to zero at room temperature prior to the zero-field-cooled/field-cooled (ZFC/FC) measurements (see below).]Figure 2 shows a Curie–Weiss plot in which the inverse ofthe initial sample susceptibility values 1/xi from Figs. 1a andb are plotted versus temperature, where
xi ¼C= T�Qð Þ: (1)
It can be seen that the behavior is nearly linear for100 K� T� 325 K yielding a Curie–Weiss temperatureQ¼�158 K and a Curie-Weiss constant C¼ 1.40 emu-K/sample (best fit values). The small diviation from linearbehaviour is likely due to: (i) the lower temperatures beingtoo close to the blocking temperature (see below) and (ii)oversimplification of the Curie–Weiss law. As discussedbelow, the value for Q, which is negative and large inmagnitude, indicates that the interparticle interactions arerelatively strong.
Figure 3a shows the ZFC/FC curves (total samplemagnetic moment versus temperature curves) obtained fromthe e-Co sample forH¼ 5.0 Oe. [The 1.5 Oe offset describedabove was eliminated at room temperature such thatthe sample was cooled in exactly zero field.] The e-Cosample appears to exhibit superparamagnetic behaviorwhere the blocking temperature TB¼ 70 K is defined as themaximum in the ZFC curve, which is also the temperature at
www.pss-b.com

Phys. Status Solidi B 248, No. 3 (2011) 743
Original
Paper
Figure 2 Inverse of the sample initial susceptibility 1/xi (sample/emu) versus temperature T (K) for the 6.5 nm diameter e-Co nano-particles. A fit to the Curie–Weiss law yields a Curie–Weiss temper-ature Q¼�158 K, indicating strong interparticle interactions (seetext).
Figure 1 Total sample magnetic moment (emu) versus magneticfieldH (Oe) at temperatures (a)T¼ 100, 125, 150, 175, 200 K and (b)T¼ 225, 250, 275, 300, 325 K for the 6.5 nm diameter e-Co nano-particles. At each temperature, the magnetic field was varied in steps(�)1.0 Oe from þ10.0 to �10.0 Oe and back to þ10.0 Oe for themeasurements. The initial susceptibilityxi for each temperature wasobtained from the slope.
which the ZFC and FC curves bifurcate. A blockingtemperature of 70 K is certainly reasonable for 6.5 nmparticles; however, the broadening of the ZFC curve alsoindicates that the interactions between the particles aresignificant [13]. Similar ZFC/FC curves were also obtainedfor H¼ 1.0 and 10.0 Oe. Again, the sample initial suscepti-bility can be obtained from the total sample moment inFig. 3a (divided by H¼ 5.0 Oe). Consistent with the resultsabove, a second Curie–Weiss plot using the data from Fig. 3aexhibited linear behavior for T� 100 K with a Curie–Weisstemperature Q¼�162 K and a Curie–Weiss constant of
www.pss-b.com
1.45 emu-K/sample. Figure 3b shows the ZFC/FC curvesobtained from the hcp-Co sample for H¼ 3.0 Oe. Consistentwith the larger particle size (12 nm average particlediameter) as well as the larger anisotropy for hcp-Co, theZFC/FC curves indicate ferromagnetic behavior, i.e., theblocking temperature is above room temperature.
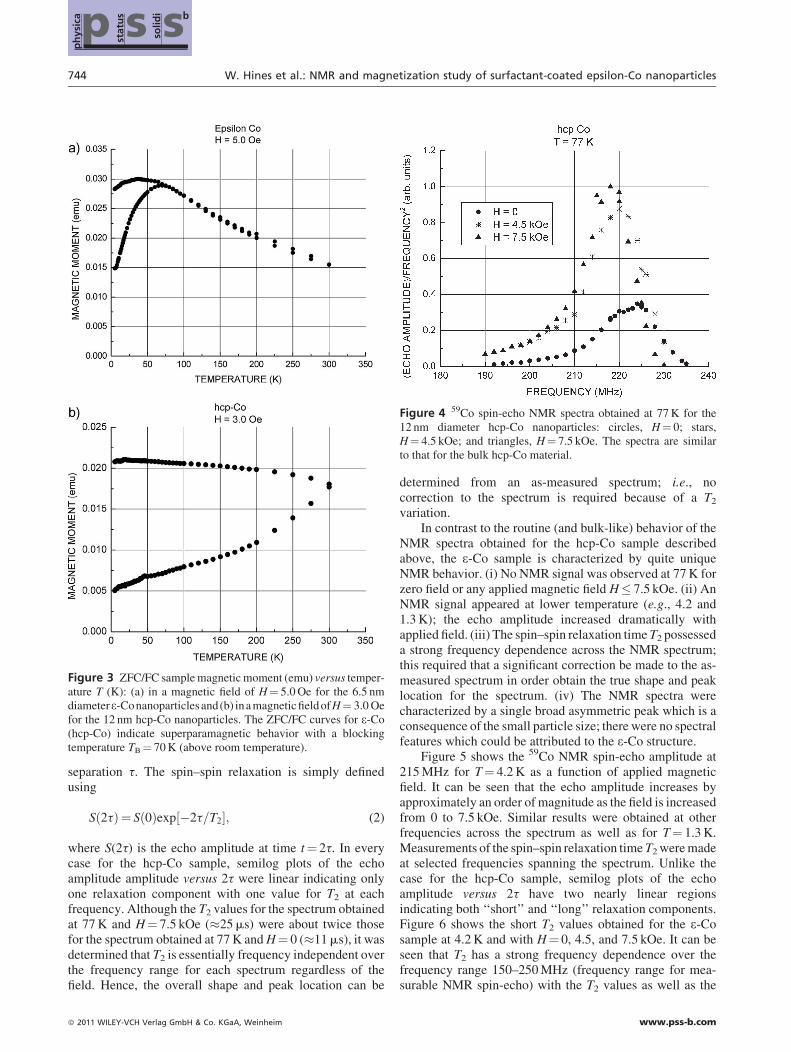
3.2 Nuclear magnetic resonance Figure 4 showsthe as-measured 59Co spin-echo NMR spectra obtained at77 K from the hcp-Co sample for applied magnetic fieldsH¼ 0, 4.5, and 7.5 kOe. ForH¼ 0, there is a broad peak witha maximum at 224 MHz and a small shoulder at 220 MHz.This spectrum resembles that for bulk hcp Co (maximum at227 MHz). Although the peak maximum is somewhat lowerin frequency, it is still located within the limits of the hcpfrequency range. As the field is increased, the maximumshifts down in frequency (220 MHz for H¼ 4.5 kOe and218 MHz for H¼ 7.5 kOe). The shoulder is less pronouncedfor H¼ 4.5 kOe and totally absent for H¼ 7.5 kOe. Thedownward shift in frequency with applied field is aconsequence of the negative sign for the core polarizationhyperfine interaction; the magnitude of the frequency shift(6.0 MHz) is somewhat less than that calculated for 59Co(7.5 MHz using g ¼ 1.0054 MHz/kOe andH¼ 7.5 kOe). Theobservation of a shift which is less than the calculated valueis a consequence of interparticle interactions between thesingle-domain particles. For a detailed discussion of NMR insingle-domain particle systems, in which there are inter-particle interactions, see Ref. [14].
Measurements of the spin–spin relaxation time T2 weremade at selected frequencies spanning the spectrum bymeasuring the echo amplitude as a function of the pulse
� 2011 WILEY-VCH Verlag GmbH & Co. KGaA, Weinheim
744 W. Hines et al.: NMR and magnetization study of surfactant-coated epsilon-Co nanoparticlesp
hys
ica ssp st
atu
s
solid
i b
Figure 4 59Co spin-echo NMR spectra obtained at 77 K for the12 nm diameter hcp-Co nanoparticles: circles, H¼ 0; stars,H¼ 4.5 kOe; and triangles, H¼ 7.5 kOe. The spectra are similarto that for the bulk hcp-Co material.
Figure 3 ZFC/FC sample magnetic moment (emu) versus temper-ature T (K): (a) in a magnetic field of H¼ 5.0 Oe for the 6.5 nmdiametere-Conanoparticles and(b) inamagneticfieldofH¼ 3.0 Oefor the 12 nm hcp-Co nanoparticles. The ZFC/FC curves for e-Co(hcp-Co) indicate superparamagnetic behavior with a blockingtemperature TB¼ 70 K (above room temperature).
separation t. The spin–spin relaxation is simply definedusing
� 20
S 2tð Þ¼ S 0ð Þexp �2t=T2½ �; (2)
where S(2t) is the echo amplitude at time t¼ 2t. In everycase for the hcp-Co sample, semilog plots of the echoamplitude amplitude versus 2t were linear indicating onlyone relaxation component with one value for T2 at eachfrequency. Although the T2 values for the spectrum obtainedat 77 K and H¼ 7.5 kOe (�25ms) were about twice thosefor the spectrum obtained at 77 K and H¼ 0 (�11ms), it wasdetermined that T2 is essentially frequency independent overthe frequency range for each spectrum regardless of thefield. Hence, the overall shape and peak location can be
11 WILEY-VCH Verlag GmbH & Co. KGaA, Weinheim
determined from an as-measured spectrum; i.e., nocorrection to the spectrum is required because of a T2
variation.In contrast to the routine (and bulk-like) behavior of the
NMR spectra obtained for the hcp-Co sample describedabove, the e-Co sample is characterized by quite uniqueNMR behavior. (i) No NMR signal was observed at 77 K forzero field or any applied magnetic field H� 7.5 kOe. (ii) AnNMR signal appeared at lower temperature (e.g., 4.2 and1.3 K); the echo amplitude increased dramatically withapplied field. (iii) The spin–spin relaxation timeT2 possesseda strong frequency dependence across the NMR spectrum;this required that a significant correction be made to the as-measured spectrum in order obtain the true shape and peaklocation for the spectrum. (iv) The NMR spectra werecharacterized by a single broad asymmetric peak which is aconsequence of the small particle size; there were no spectralfeatures which could be attributed to the e-Co structure.
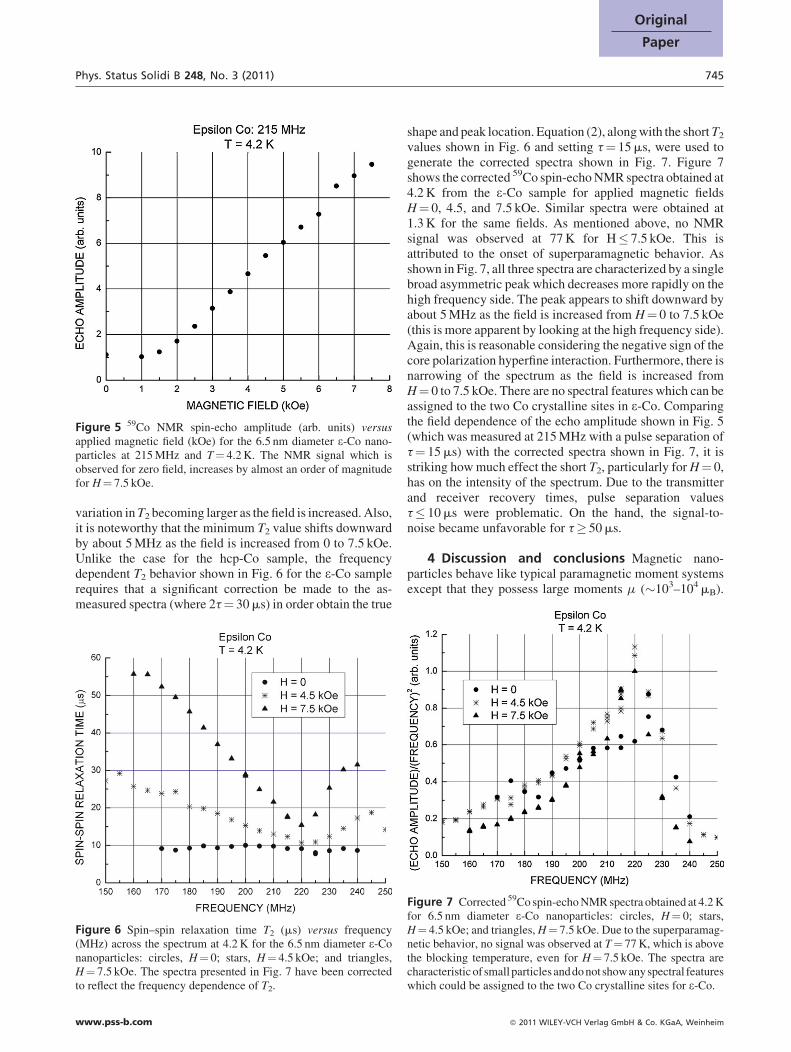
Figure 5 shows the 59Co NMR spin-echo amplitude at215 MHz for T¼ 4.2 K as a function of applied magneticfield. It can be seen that the echo amplitude increases byapproximately an order of magnitude as the field is increasedfrom 0 to 7.5 kOe. Similar results were obtained at otherfrequencies across the spectrum as well as for T¼ 1.3 K.Measurements of the spin–spin relaxation timeT2 were madeat selected frequencies spanning the spectrum. Unlike thecase for the hcp-Co sample, semilog plots of the echoamplitude versus 2t have two nearly linear regionsindicating both ‘‘short’’ and ‘‘long’’ relaxation components.Figure 6 shows the short T2 values obtained for the e-Cosample at 4.2 K and with H¼ 0, 4.5, and 7.5 kOe. It can beseen that T2 has a strong frequency dependence over thefrequency range 150–250 MHz (frequency range for mea-surable NMR spin-echo) with the T2 values as well as the
www.pss-b.com
Phys. Status Solidi B 248, No. 3 (2011) 745
Original
Paper
Figure 5 59Co NMR spin-echo amplitude (arb. units) versusapplied magnetic field (kOe) for the 6.5 nm diameter e-Co nano-particles at 215 MHz and T¼ 4.2 K. The NMR signal which isobserved for zero field, increases by almost an order of magnitudefor H¼ 7.5 kOe.
variation inT2 becoming larger as the field is increased. Also,it is noteworthy that the minimum T2 value shifts downwardby about 5 MHz as the field is increased from 0 to 7.5 kOe.Unlike the case for the hcp-Co sample, the frequencydependent T2 behavior shown in Fig. 6 for the e-Co samplerequires that a significant correction be made to the as-measured spectra (where 2t¼ 30ms) in order obtain the true
Figure 6 Spin–spin relaxation time T2 (ms) versus frequency(MHz) across the spectrum at 4.2 K for the 6.5 nm diameter e-Conanoparticles: circles, H¼ 0; stars, H¼ 4.5 kOe; and triangles,H¼ 7.5 kOe. The spectra presented in Fig. 7 have been correctedto reflect the frequency dependence of T2.
www.pss-b.com
shape and peak location. Equation (2), along with the shortT2
values shown in Fig. 6 and setting t¼ 15ms, were used togenerate the corrected spectra shown in Fig. 7. Figure 7shows the corrected 59Co spin-echo NMR spectra obtained at4.2 K from the e-Co sample for applied magnetic fieldsH¼ 0, 4.5, and 7.5 kOe. Similar spectra were obtained at1.3 K for the same fields. As mentioned above, no NMRsignal was observed at 77 K for H� 7.5 kOe. This isattributed to the onset of superparamagnetic behavior. Asshown in Fig. 7, all three spectra are characterized by a singlebroad asymmetric peak which decreases more rapidly on thehigh frequency side. The peak appears to shift downward byabout 5 MHz as the field is increased from H¼ 0 to 7.5 kOe(this is more apparent by looking at the high frequency side).Again, this is reasonable considering the negative sign of thecore polarization hyperfine interaction. Furthermore, there isnarrowing of the spectrum as the field is increased fromH¼ 0 to 7.5 kOe. There are no spectral features which can beassigned to the two Co crystalline sites in e-Co. Comparingthe field dependence of the echo amplitude shown in Fig. 5(which was measured at 215 MHz with a pulse separation oft¼ 15ms) with the corrected spectra shown in Fig. 7, it isstriking how much effect the short T2, particularly for H¼ 0,has on the intensity of the spectrum. Due to the transmitterand receiver recovery times, pulse separation valuest� 10ms were problematic. On the hand, the signal-to-noise became unfavorable for t� 50ms.
4 Discussion and conclusions Magnetic nano-particles behave like typical paramagnetic moment systemsexcept that they possess large moments m (�103–104mB).
Figure 7 Corrected 59Co spin-echo NMR spectra obtained at 4.2 Kfor 6.5 nm diameter e-Co nanoparticles: circles, H¼ 0; stars,H¼ 4.5 kOe; and triangles, H¼ 7.5 kOe. Due to the superparamag-netic behavior, no signal was observed at T¼ 77 K, which is abovethe blocking temperature, even for H¼ 7.5 kOe. The spectra arecharacteristicof smallparticles anddo not showanyspectral featureswhich could be assigned to the two Co crystalline sites for e-Co.
� 2011 WILEY-VCH Verlag GmbH & Co. KGaA, Weinheim

746 W. Hines et al.: NMR and magnetization study of surfactant-coated epsilon-Co nanoparticlesp
hys
ica ssp st
atu
s
solid
i b
For non-interacting particles, they can be described by theclassical Langevin equation which reduces to the Curie lawC/T when mH/kBT<< 1. Frequently, the magnetic inter-actions are treated using a mean-field approach which leadsto the Curie–Weiss law Eq. (1). Information concerning thenature and strength of the magnetic interactions andmagnetic ordering is typically inferred from the sign andmagnitude of Q (positive-ferromagnetic and negative-antiferromagnetic). In magnetic nanoparticle systems, themagnetic dipole interaction between particles can besignificant, particularly in cases with dense concentrations.Curie–Weiss-like behavior has indeed been observed innumerous nanoparticle systems; however, the situation is notstraightforward and much discussion still exists todayconcerning the interpretation.
Popplewell et al. [15] carried out early experimentalstudies concerning the effect of interparticle interactions onthe Curie–Weiss behavior in ferrofluids. In particular, theymeasured the initial susceptibility over the temperaturerange 220 K� T� 450 K for a series of (7.4 nm magneticdiameter and 8.1 nm physical diameter) Fe3O4 particlesamples with volume concentrations ranging from 1 to 8%.The measurement temperatures were greater than thefreezing temperature for the ferrofluids. From the observedCurie–Weiss behavior, they obtained values forQ from 0 forthe 1% sample to �75 K for the 8% sample, indicating thatthe interactions become significant with increased concen-tration. They attributed their results to ‘‘strong’’ interparticleinteractions which reduce the initial susceptibility belowthe noninteracting value in the temperature range ofmeasurement. Furthermore, the negative values for Qobtained for the ferrofluids studied in their work indicatemore strongly interacting particles than those observed byothers which resulted in positive values of Q [16].Popplewell et al. [15] suggest that strong interactions wouldlead to the particles forming closed structures or ‘‘aggre-gates’’ which have zero moment in zero magnetic fieldthrough flux closure, and thus, give a negative Q indicatingan average ‘‘antiferromagnetic-like’’ arrangement ofparticles. Popplewell et al. [15] also suggest that particleaggregates form at the time of preparation. Such would be thecase if the surfactant is not completely efficient in preventingaggregation. Similar negative Q-values were obtained byAyoub et al. [17] on dilute (0.8%) textured frozen F3O4
ferrofluids. Theoretically, the interaction effects in nano-particles have been treated using Monte Carlo techniques [6,13, 18]. Kechrakos and Trohidou [18] studied the effect ofthe magnetic dipolar interaction on the remanence andcoercivity for an assembly of single-domain ferromagneticparticles. From their simulations, Garcia-Otero et al. [13]conclude that as the particle concentration increases (i) theblocking temperature TB as defined by the peak in the ZFCcurve shifts to higher temperature, and at the same time thecurve broadens and flattens and (ii) the Curie–Weisstemperature Q tends to larger negative values. Chantrellet al. [6] also model the magnetic properties of interactingsuperparamagnetic particles and obtain Curie–Weiss
� 2011 WILEY-VCH Verlag GmbH & Co. KGaA, Weinheim
behavior for the initial susceptibility in which Q is negativeand has a magnitude that increases with packing density.Furthermore, they point out that a negative value of Q doesnot necessarily mean ‘‘antiferromagnetic’’ order as would bethe case for certain ordered lattice structures. In their modelsfor disordered systems, they attribute the negative Q torelatively short-range order configurations with low magne-tostatic energy and flux closure [6].
The Curie–Weiss model is quite simple and its agree-ment with experimental results is sometimes fortuitous.While a mean field approach works reasonably well forexchange interactions, it neglects the inherent inhomogen-eity that is possible with magnetic dipolar interactions.This inhomogeneity is largely responsible for the broadeningof the ZFC magnetization curve as the interaction strengthincreases. To our knowledge, a rigorous quantitativetreatment of magnetic dipolar interaction in the frameworkof the Curie–Weiss model does not exist at the present time.Nevertheless, in view of existing theoretical studiesconcerning the interactions for single-domain magneticparticles (e.g., see Refs. [6, 13, 18]), it is useful to determinethe magnetic dipolar and magnetocrystalline anisotropyenergies for the e-Co and hcp-Co particles studied in thiswork. The dipolar energy per particle can be obtained fromthe particle size and separation (4.0 nm edge-to-edge fromTEM), along with the density (above) and assuming asaturation magnetization of 100 emu/g. Values of1.7� 10�13 and 1.9� 10�12 erg are obtained for the 6.5 nme-Co and hcp-Co particles, respectively. For the 6.5 nm e-Coparticles, the anisotropy energy per particle can be obtainedfrom the blocking temperature, TB¼ 70 K, using the Neelrelation [12]. For the 12 nm hcp-Co particles, the anisotropyenergy can be calculated from the anisotropy constant(K¼ 1.2� 106 ergs/cm3) reported previously [12]. Values of2.4� 10�13 and 1.0� 10�12 erg are obtained for the 6.5 nme-Co and hcp-Co particles, respectively. Such interactionscan be very complex and there is a need for even more refinedmodels as well as microscopic experimental techniquessuch as NMR.
The absence of an observable NMR signal for the e-Cosample at 77 K even with H¼ 7.5 kOe is attributed to thesuperparamagnetic behavior. At 77 K, the particle magneticmoment fluctuations are faster than the time window for theNMR measurement. Based on the strength of the NMR spin-echo at 4.2 K, and taking the Boltzmann factor into account, areasonably strong signal would have been observed at 77 Kas was the case for the hcp-Co sample. The lower blockingtemperature for the e-Co particles is due to the reducedanisotropy and particle size compared to the hcp-Coparticles. The behavior shown in Fig. 5 is consistent withthe existence of particle aggregates or configurations whichhave zero moment through flux closure, although this is notan ‘‘antiferromagnetic-like’’ arrangement of the particles inthe strict sense. The application of a magnetic field is able toovercome the magnetostatic energy and results in a dramaticincrease in the strength of the NMR signal. The broad andasymmetric spectra reflect the small particle size for the e-Co
www.pss-b.com

Phys. Status Solidi B 248, No. 3 (2011) 747
Original
Paper
sample (6.5 nm) in which a significant number of Co atomsare at or near the particle surface. The hyperfine field, andconsequently the 59Co resonance frequency, is principallydetermined by the on-site moment with a smaller contributiondue to the neighboring moments. In small nanometer-sizeparticles, a distribution in the Co moments as well as theirinteractions gives rise to a broad hyperfine field distribution.The interparticle magnetic dipole interactions are muchsmaller; however, could account for the small narrowing ofthe spectrum with applied magnetic field. Unfortunately, thebroadening due to the small particle particle size prohibitsthe observation of spectral features or peaks which can beassigned to the two Co crystalline sites for e-Co. There was astrong frequency dependence for the spin–spin relaxation timeT2 which required a significant correction to the observedspectra as described above. The frequency dependence of T2
seems to reflect the spectra in that T2 shows a pronouncedminimum near the spectrum peak and increases for frequen-cies in the wings. This may be simply attributed to an increasein mutual spin flipping near the spectrum peak.
There have been numerous experimental studies con-cerning the nature of the magnetostatic interactions in bothdilute and concentrated assemblies of nanometer particles [7].In particular, the techniques of small angle X-ray scattering(SAXS) [19] and small angle neutron scattering (SANS) [20]have yielded useful information concerning the magneticcorrelation lengths. There is some controversy concerning thenature of the correlations; however, most of the data supportferromagnetic interactions over a length scale of 10–15particles at low temperature [7]. There is a recent report ofantiferromagnetic correlations in dense assemblies of 9 nmdiameter e-Co particles using resonant magnetic SAXS;however, the Q range studied did not extend low enough toyield information about longer length scales [19]. On the otherhand, recent magnetic SANS measurements on 7.9 nm e-Coparticles yielded a magnetic correlation length whichincreased with magnetic field [20]. This indicates thatdomain-like regions with uniform magnetization form;however, there is no preferential direction for H¼ 0. If theparticles are minimally oxidized, the assemblies are magne-tically soft. They magnetize easily with the application of amagnetic field as the domain size increases.
www.pss-b.com
Acknowledgements S. A. M. acknowledges the supportfrom NSF Grant Nos. ECS-0304453 and ECS-0507050.
References
[1] S. Sun and C. B. Murray, J. Appl. Phys. 85, 4325 (1999).[2] R. W. Chantrell, A. Bradbury, J. Popplewell, and S. W.
Charles, J. Appl. Phys. 53, 2742 (1982).[3] S. Sun, C. B. Murray, D. Weller, L. Folks, and A. Moser,
Science 287, 1989 (2000).[4] V. F. Puntes, K. M. Krishnan, and A. P. Alivisatos, Science
291, 2115 (2001).[5] J. L. Dormann, D. Fiorani, and E. Tronc, Adv. Chem. Phys.
98, 283 (1997).[6] R. W. Chantrell, N. Walmsley, J. Gore, and M. Maylin, Phys.
Rev. B 63, 024410 (2000).[7] S. A. Majetich and M. Sachan, J. Phys. D, Appl. Phys. 39,
R407 (2006).[8] M. Hansen, Constitution of Binary Alloys (McGraw-Hill,
New York, 1958).[9] O. Kitakami, H. Sato, Y. Shimada, F. Sato, and M. Tanaka,
Phys. Rev. B 56, 13849 (1997).[10] D. P. Dinega and M. G. Bawendi, Angew. Chem., Int. Ed. 38,
1788 (1999).[11] V. F. Puntes, D. Zanchet, C. K. Erdonmez, and A. P.
Alivisatos, J. Am. Chem. Soc. 124, 12874 (2002).[12] S. Kan, M. Sachan, J. Kirchhoff, and S. A. Majetich, IEEE
Trans. Magn. 41, 3370 (2005).[13] J. Garcia-Otero, M. Porto, J. Rivas, and A. Bunde, Phys. Rev.
Lett. 84, 167 (2000).[14] Y. D. Zhang, J. I. Budnick, W. A. Hines, S. A. Majetich, and
E. M. Kirkpatrick, Appl. Phys. Lett. 76, 94 (2000).[15] J. Popplewell, B. Abu-Aisheh, and N. Y. Ayoub, J. Appl.
Phys. 64, 5852 (1988).[16] K. O’Grady, A. Bradbury, S. W. Charles, S. Menear, J.
Popplewell, and R. W. Chantrell, J. Magn. Magn. Mater.31–34, 958 (1983).
[17] N. Y. Ayoub, B. Abu-Aisheh, M. Dababneh, N. Laham, andJ. Popplewell, IEEE Trans. Magn. 25, 3860 (1989).
[18] D. Kechrakos and K. N. Trohidou, Phys. Rev. B 58, 12169(1998).
[19] J. B. Kortright, O. Hellwig, K. Chesnel, S. Sun, and E. E.Fullerton, Phys. Rev. B 71, 012402 (2005).
[20] M. Sachan, C. Bonnoit, S. A. Majetich, Y. Ijiri, P. O. Mensah-Bonsu, J. A. Borchers, and J. J. Rhyne, Appl. Phys. Lett. 92,152503 (2008).
� 2011 WILEY-VCH Verlag GmbH & Co. KGaA, Weinheim