
NTPC Limited 07July2011 - Business...
27
NTPC Limited Initiating Coverage July 7, 2011 Destimoney Research
Transcript of NTPC Limited 07July2011 - Business...

NTPC LimitedInitiating Coverage
July 7, 2011
Destimoney Research

NTPC Limited - BUY, with a target upside of 15.6%
BUYTARGET : `̀̀̀220
CMP : `̀̀̀190.3
Key Data
Bloomberg Code NTPC IN
NSE Code NTPC
BSE Code 532555
Sector Power
Industry Electric Utilities
Face value (` per share) 10
Book value (` per share) 82.9
Dividend yield 2.0%
(`̀̀̀ mn) (YE Mar) FY11 FY12E FY13E FY14E
Net Revenue 619,064 739,518 854,981 968,807
EBITDA 191,577 206,039 237,822 264,756
EBITDA Margin 30.9% 27.9% 27.8% 27.3%
EPS (Rs.) 11.3 12.4 13.6 14.3
EV/EBITDA 11.6 10.7 9.3 8.4
P/E (x) 16.8 15.3 14.0 13.3
Price Performance CY09 CY10 YTD
FIIs
4%
DIIs
8%
Other
4%Promoters
84%
Dividend yield 2.0%
52 Wk.(H/L)(`) 222.3 / 165.2
Market Cap. (` mn) 1,568,700
Price Performance CY09 CY10 YTD
Absolute 33% -13% -4%
Relative -43% -31% 3%
Shareholding pattern as on Mar 31 2011 Relative stock performance (Jul’10=100)
2
70
85
100
115
130
Jul-1
0
Au
g-1
0
Sep
-10
Oct
-10
No
v-1
0
Dec-
10
Jan
-11
Feb
-11
Mar-
11
Ap
r-1
1
May-
11
Jun
-11
Jul-1
1
NTPC Nifty

� NTPC Limited, a company with “MAHARATNA” status, is a leading power generator in India with aregulated business model.
� The company’s high operational efficiency, coupled with lower cost per unit, provides a competitiveadvantage in the power generation market.
� NTPC’s capacity addition is expected to accelerate, as 14.7 GW of projects under construction areanticipated to be commissioned over the next few years.
� India’s energy deficit scenario and low per capita consumption of electricity offers immenseopportunity for the company.
NTPC …. poised for long term growth
opportunity for the company.
� Additionally, government's thrust on expanding the power sector provides the necessary impetus tothe company.
� Going ahead, we expect NTPC’s growth would depend on the pace of its capacity addition.
� The company also intends to diversify into related areas like coal mining, distribution, transmission,merchant sales and gas exploration.
� We initiate coverage on NTPC Limited with a BUY rating and a target price of `220 per share.
3

Rest of India
80%NTPC
20%
Installed Capacity of 34,194 MW* as on 31 March 2011
Power Generation of 220.54 BU# for FY2010-11
Market leader in power generation in India with an installed capacity of 34,194 MW
� National Thermal Power Corporation (NTPC), the leading
power company in India, has 15 coal based and 7 gas
based stations, situated across the country.
� Out of fifteen coal stations, three have achieved Plant Load
Factor (PLF) of more than 95% and seven others achieved
PLF of more than 90%.
� National Thermal Power Corporation (NTPC), the leading
power company in India, has 15 coal based and 7 gas
based stations, situated across the country.
� Out of fifteen coal stations, three have achieved Plant Load
Factor (PLF) of more than 95% and seven others achieved
PLF of more than 90%.
* Including JV’s
Rest of India
73% NTPC
27%
Electricity
Generation
93%
Others
7%
Revenue of `̀̀̀ 574,184 Million for FY2010-11
PLF of more than 90%.
� Achieved the highest ever PLF of 78.8% for gas based
stations.
� Conferred with a “MAHARATNA” status in May 2010 by
the Government of India.
� Attractively placed in the power sector with regulated
returns and sizable fuel supply under a long-term contract.
PLF of more than 90%.
� Achieved the highest ever PLF of 78.8% for gas based
stations.
� Conferred with a “MAHARATNA” status in May 2010 by
the Government of India.
� Attractively placed in the power sector with regulated
returns and sizable fuel supply under a long-term contract.
4
Source: Company Reports
# Standalone basis

Coal-based plants account for about 85% of the company’s total operational capacity
ANTA(413 MW)
AURAIYA(652 MW)
BADARPUR(705 MW)
FARIDABAD(430 MW)
NCTPP(1,820 MW)
DADRI(1330 MW)
KOLDAM(800 MW)
LOHARINAG PALA(600 MW)
RUPSIABAGAR KHASIABARA(260MW)
LATA TAPOVAN(162 MW)
TAPOVAN VISHNUGAD(520 MW)
TANDA(440 MW)
UNCHAHAR(1,050 MW)
FARAKKA(2,100 MW)
KAHALGAON(2,340 MW)
BARH
RIHAND(3,000 MW)
RAMMAM III2,100 MW)
DADRI(817 MW)
Region-wise Break Up of Installed Capacity,As on 31 March 2011: 34,194 MW
Eastern
14%
Southern
26%
Western
26%
Northern
34%
GANDHAR(648 MW)
KAWAS(645 MW)
KAYAMKULAM(350 MW)
SIMHADRI(2,000 MW)
MAUDA(1000 MW)
RAMAGUNDAM(2,600 MW)
TALCHER THERMAL(460 MW)
TALCHER KANIHA(3,000 MW)
VALLUR(1000 MW)
KORBA(2,600 MW)
SIPAT2,980 MW
BONGAIGAON(750 MW)
(2,100 MW)BARH3,300 MWSINGRAULI
(2,000 MW)
VINDHYACHAL(4,260 MW)
Note: Plants shown are excluding Joint Ventures
Plants Break-up by Type,Plants in FY2010-11: 25
Hydro Plants
3
Gas Based
Plants
7
Coal Based
Plants
15
Hydro- under construction
Hydro- Existing
Gas -Existing
Thermal- under construction
Thermal - Existing
Coal-mines
5
Source: Company Reports

While NTPC’s installed capacity accounts for 20% of India’s total installed capacity, its share in total electricity generation is about 27%
23,935 26,350 27,350 27,850
100,352
28,840
120,115115,711
105,979
130,558
0
40,000
80,000
120,000
160,000
2005-06 2006-07 2007-08 2008-09 2009-10
MW
NTPC India Excluding NTPC
Installed Capacity
India : non-
NTPC
80%
NTPC
20%
FY11
Source: Company Reports
446.5470.75
503.59 516.85552.71
170.88 188.67218.84206.94200.86
0
160
320
480
640
2005-06 2006-07 2007-08 2008-09 2009-10
BU
Power Generation
non-NTPC
73% NTPC
27%
6

…Largely due to operational efficiencies compared to its peers
PLF
76.8 78.6 77.2 77.5 75.1
89.4 92.2 91.1 88.391.1
0
25
50
75
100
2006-07 2007-08 2008-09 2009-10 2010-11
(%)
85.5%
70.9%
83.9%77.5%
91.1%
0.0%
25.0%
50.0%
75.0%
100.0%
Central State Pvt sector National NTPC
PLF - 2010
Source: Company Reports
2006-07 2007-08 2008-09 2009-10 2010-11
All india PLF NTPC PLF
� NTPC enjoys a high Plant Load Factor (PLF) and
Availability Factor compared to the industry,
despite its huge capacity and wide geographical
presence of plants across India.
� We believe such operational efficiency levels
would be difficult for its peers to replicate.
sector sector avg.
85.0% 85.5%
92.2% 91.8%
50.0%
62.5%
75.0%
87.5%
100.0%
National NTPC
Availability Factor- 2010
7
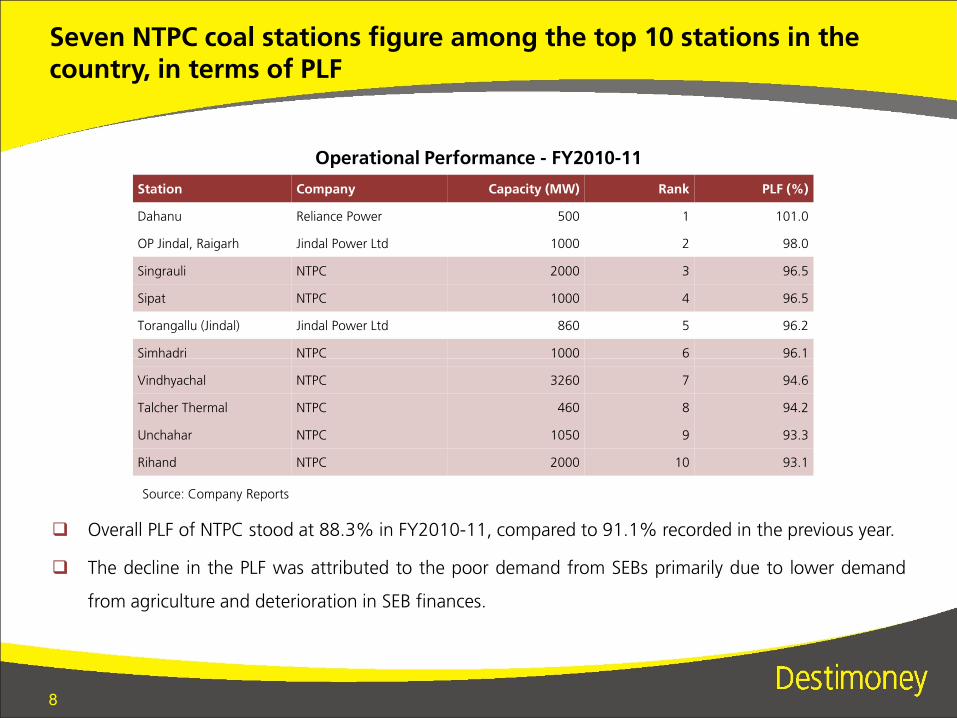
Seven NTPC coal stations figure among the top 10 stations in the country, in terms of PLF
Operational Performance - FY2010-11
Station Company Capacity (MW) Rank PLF (%)
Dahanu Reliance Power 500 1 101.0
OP Jindal, Raigarh Jindal Power Ltd 1000 2 98.0
Singrauli NTPC 2000 3 96.5
Sipat NTPC 1000 4 96.5
Torangallu (Jindal) Jindal Power Ltd 860 5 96.2
Simhadri NTPC 1000 6 96.1
� Overall PLF of NTPC stood at 88.3% in FY2010-11, compared to 91.1% recorded in the previous year.
� The decline in the PLF was attributed to the poor demand from SEBs primarily due to lower demand
from agriculture and deterioration in SEB finances.
Source: Company Reports
Simhadri NTPC 1000 6 96.1
Vindhyachal NTPC 3260 7 94.6
Talcher Thermal NTPC 460 8 94.2
Unchahar NTPC 1050 9 93.3
Rihand NTPC 2000 10 93.1
8

Regulated business model provides stable earnings visibility
� The CERC tariff regulation for power generation and transmission for 2009-14 ensures certainty of RoE
at base rate of 15.5%.
� Under the CERC tariff norms, NTPC is allowed to pass on fuel charges through the tariff, provided the
company meets certain operating parameters, thereby insulating the company from any fuel price
hikes.
� NTPC has signed power purchase agreements (PPAs) before the expiry of the January 2011 deadline,� NTPC has signed power purchase agreements (PPAs) before the expiry of the January 2011 deadline,
after which competitive bidding-based tariff regime became applicable.
� The Company’s strategic alliance with Coal India Limited would provide a competitive edge over its
peers in handling the current tight fossil fuel supply situation.
� The Company has been realizing 100% payment of current bills for sale of power for the last seven
consecutive years, ensuring steady cash-flows.
9

2.4%
9.0%8.5%
3.8%
7.5%
9.5% 9.8%
6.7%7.4%
7.0%6.9%4.4%
5.7%
9.3%
4.7%
7.2%
3%
6%
9%
12%
Co-relation between GDP and demand for energy
Energy demand is highly co-related to GDP growth
0%
2003 2004 2005 2006 2007 2008 2009 2010
Real GDP growth Growth in demand for energy
Source: NHPC IPO, 2009
10

With GDP growth expectations at 8-9% energy demand is a secular growth story
0
220
440
660
880
0
1,200
2,400
3,600
4,800
Demand at GDP growth at 8% Demand at GDP growth at 9%
0
280
560
840
1,120
0
1,500
3,000
4,500
6,000
0
2011–12 2016–17 2021–22 2026–27 2031–32
0
Projected Peak Demand (LHS) Installed Capacity Required (LHS)
Total Energy Required (RHS)
Source: Integrated Energy Policy (IEP) Report
0
2011–12 2016–17 2021–22 2026–27 2031–32
0
Projected Peak Demand (LHS) Installed Capacity Required (LHS)
Total Energy Required (RHS)
� In order to sustain a 8% to 9% GDP growth rate, India needs to add power generation capacity to
adequately match with this pace.
� The Planning Commission, in its Integrated Energy Policy report estimates that, India would require
additional capacity of about 71-84 GW by 2012, 157-188 GW by 2017 and 276–339 GW by 2022,
respectively.
11

All India actual power supply position
The Indian power sector is characterized by increasing energy shortages
70,000
105,000
140,000
MW -10%
-5%
0%
0
35,000
2001 2002 2003 2004 2005 2006 2007 2008 2009 2010
-20%
-15%
Demand (MW)-LHS Availability (MW)-LHS Deficit- RHS
12
Source: Ministry of Power, Annual Report 2009-10

…that has resulted in large energy deficit…
12.9
9.8
12.711.9
16.6
13.8
12.3
11.711.2
12.211.8
13.0
9.6
11.1
10.110.3
9
12
15
18
%
Energy Deficit in India
7.8 7.5
8.8
7.1 7.3
8.4
9.6 9.8 10.1
8.5
6
9
2000-01 2001-02 2002-03 2003-04 2004-05 2005-06 2006-07 2007-08 2008-09 2009-10 2010-11 2011-12E
Peak Defi cit Energy Deficit
Source: CEA
� The energy and peak deficits have been in double digits lately and could widen further, considering the
huge demand of power from India’s rising population and rapid industrialization and urbanization.
13

6,067 6,4437,148 7,703 8,072
11,174
13,647
17,053
10,000
15,000
20,000
(KW
h)
Global per capita consumption of electricity
Per capita consumption of energy in India is low
734
2,232 2,453
6,067
0
5,000
India Brazil China UK Russia Germany France Japan Australia US Canada
Source: IEA, Key World Statistics 2010 (RoW), CEA (India)
� India ranks among the lowest in the world, in terms of per capita consumption of electricity, largely due
to inadequate supply and distribution infrastructure and rapid increase in population.
14

17,340
7,092
8,460
65,08656,626
49,534
~ 10,000
32,19420000
40000
60000
80000
MW
32,194
42,892+
~ 75,000
To tap this opportunity, NTPC has outlined a detailed capacityaddition programme until 2017
Capacity additions until 2017
32,194
0
Jul-10 Under Construction Bids Invited FR Approved FR under
preparation
FY2017 target
32,194
Source: Company Reports
� The company intends to add around 43 GW of capacity over FY10-17.
15

Major capacity additions expected to be completed in next two years…
ProjectCapacity added this
year (MW)Commercial
Capacity Under Construction (MW)
Expected year of completion
Dadri, Unit # 6 490 31st Jul 2010 - -
Kanti, Unit # 2 110 15th Oct 2010 - -
Korba, Unit # 7 500 21st Mar 2011 - -
Simhadri, Unit-3 500 500 May 2011
Farakka, Unit # 6 500
Sipat, Stage- I - - 1980 September 2011
Mouda Stage- I - - 1000 August 2012
Rihand-III - - 1000
Vindhyachal-IV - - 1000 March 2012Vindhyachal-IV - - 1000 March 2012
Bongaigaon - - 750 July 2011
Barh –I - - 1980 June 2011
Barh –II - - 1320 August 2013
Joint Ventures
Jhajjar, Unit # 1 500 5th Mar 2011
Vallur 1500
Indira Gandhi STPP - JV With HPGCL & IPGCL (Coal), Haryana
1000
Nabinagar-JV With Railways (Coal), Bihar 1000
Muzaffarpur-II (Coal), JV With BSEB, Bihar 390
Koldam (Hydro), Himachal Pradesh 800 December 2011
Tapovan Vishnugad ( Hydro ), Uttaranchal 520 March 2013
16

…With bids invited for several other projects
Projects for which bids invited Capacity (MW)
Coal
Solapur 1320
Meja 1320
Mouda-II 1320
Nabinagar 1980
Tanda 1320
Unchahar 500
Vindhyachal-V 500
Projects under bulk tendering (COAL) Capacity (MW)
Lara 1600
Darlipalli 1600
Kudgi 2400
Gajmara 1600
Renewable projects
Wind- Modurgudda, Karnataka 36
Wind- Chakala, Maharashtra 39
Wind-Guledagudda- Karnataka 100
Solar-Dadri 5
Hydro projects
Lata Tapovan 171
Ramman – III 120
Rupsiyabagar Khasiyabara 261
Note: Environment clearance of MOEF obtained for Solapur(2x660MW), Mouda-II(2x660MW), Meja JV(2x 660MW, Nabinagar JV(3x660MW).
17

� Signed Long Term Model Coal Supply Agreement
Coal (MMT)
2007-08 2008-09 2009-10 2010-11
Coal – Domestic 117.46 124.37 129.9 126.64
Coal - Imported 2.74 5.41 6.3 10.56
Total 120.2 129.78 136.2 137.2
2007-08 2008-09 2009-10 2010-11
Gas – APM+PMT - - 9.08 9
Gas – Long Term/Fallback/ Spot RLNG
2.77 1.99 4.45 2.86
Gas - KG D6 - - 0.35 1.91
Total 11.76 10.74 13.88 13.77
Gas (MMSCMD)
Source: Company Reports
Source: Company Reports
To achieve its targets, the company has secured long term fuel supply…
� Signed long term contract for supply with GAIL for� Signed Long Term Model Coal Supply Agreement
(CSA) with Coal India Limited (CIL) for supply of coal
for 20 years.
� Formed JV company with CIL: ‘CIL NTPC Urja Pvt Ltd.’
for development of coal mines blocks and acquisition
of coal mines in India and abroad.
� International Coal Ventures Ltd (ICV) incorporated for
overseas acquisition and operation of coal mines and
blocks.
� Signed long term contract for supply with GAIL for
supply of 12.9 MMSCMD gas
� Signed long term contract for supply of RLNG of 2.0
MMSCMD on firm basis and 0.5 MMSCMD on fallback
basis with GAIL for a period of 10 years.
� Gas Sale Agreement with GAIL, IOCL and BPCL for
supply of 1.2 MT RLNG p.a. for 20 years.
� Govt. allotted 4.46 MMSCMD from KG-D6 for NCR
projects
� Allotted a Block under NELP – V and 4 Blocks under
NELP – VIII
18
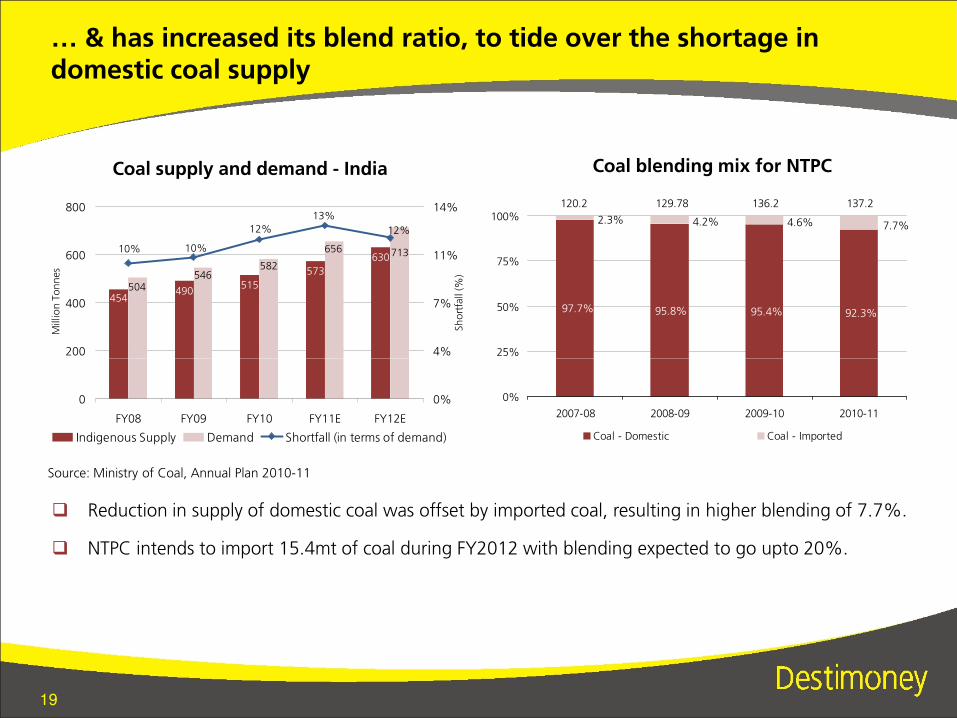
… & has increased its blend ratio, to tide over the shortage in domestic coal supply
92.3%95.4%95.8%97.7%
7.7%4.6%4.2%2.3%
25%
50%
75%
100%120.2 129.78 136.2 137.2
Coal blending mix for NTPC
630
573
515490
454
713656
582546
504
12%
10% 10%
12%
13%
200
400
600
800
Millio
n T
on
nes
4%
7%
11%
14%
Sh
ort
fall (%
)
Coal supply and demand - India
� Reduction in supply of domestic coal was offset by imported coal, resulting in higher blending of 7.7%.
� NTPC intends to import 15.4mt of coal during FY2012 with blending expected to go upto 20%.
0%
2007-08 2008-09 2009-10 2010-11
Coal - Domestic Coal - Imported
Source: Ministry of Coal, Annual Plan 2010-11
0
FY08 FY09 FY10 FY11E FY12E
0%
Indigenous Supply Demand Shortfall (in terms of demand)
19

NTPC is also exploring for coal mines abroad to improve fuel security
� In order to secure supplies of coal, a new company, International Coal Ventures (ICV), which is a
consortium of NTPC Limited, Steel Authority of India Limited, National Mineral Development Corp. Ltd,
Coal India Limited and Rashtriya Ispat Nigam Ltd, was formed.
� NTPC is separately pursuing coal block acquisition in Indonesia and Mozambique in addition to
exploring mines in Australia and Canada through ICV.
� The Company is also expanding its global footprints by setting up capacities abroad.
20
Country Capacity MW Details
Bangladesh (1320 MW Project in JV)Feasibility Report for the site at Khulna has been prepared by NTPC and sent to Bangladesh Power Development Board.
Sri Lanka (500 MW Project in JV)Joint Venture Agreement (JVA), Power Purchase Agreement and Board of Investment (BOI) agreement has been finalized. JVA will be signed after clearance from Sri Lankan authorities.
Bhutan (620 MW Project) NTPC is preparing the Detailed Project Report for Amochhu HEP in Bhutan.
� The Company is also expanding its global footprints by setting up capacities abroad.
Source: Company Reports

These factors would benefit NTPC in the recently introduced “tariff based competitive bidding”
� In January 2011, the Central Electricity Regulatory Commission (CERC) shifted to tariff-based
competitive bidding regime for future power projects, as against the previous “cost-plus” pricing
model.
� However, with its agreement with Coal India, to procure coal at about 40% discount to international
spot price, in place, NTPC is expected to be a beneficiary.
� NTPC is well placed in terms of fuel security due to its tie-ups with coal companies and its ability to
21
� NTPC is well placed in terms of fuel security due to its tie-ups with coal companies and its ability to
pass through hike in fuel costs.

Further, to reduce its dependency on fossil fuels, NTPC has set aggressive targets for future, with a change in installed capacity mix
34,194
75,000
128,000
0
35,000
70,000
105,000
140,000
2010-11 2017E 2032E
Inst
alle
d C
ap
aci
ty, M
W
Targets set by NTPC
Source: Company Reports
2010-11 2017E 2032E
56%
16%
11%
9%
8%
71%
13%
3%
1%12%
Coal
Gas
Nuclear Energy
Renewable Energy
Hydro Power
Installed Capacity Mix, 2017 Installed Capacity Mix, 2032
22

Utility Powertech Ltd. (50%)
National Power Exchange Ltd. (16.67%)
NTPCNTPC
Name of Joint VentureName of Joint Venture
NTPC - Alstom Power Services Private Ltd. (50%)
NTPC-SAIL Power Company Private Ltd. (50%)
NTPC –Tamil Nadu Energy Company Ltd. (50%)
Name of SubsidiaryName of Subsidiary
National High Power Test Laboratory Private Ltd. (25%)
Energy Efficiency Services Private Ltd. (25%)
NTPC Electric Supply Company Ltd. (100%)
NTPC Vidyut Vyapar Nigam Ltd. (100%)
NTPC Hydro Ltd. (100%)
Kanti Bijlee Utpadan Nigam Ltd. (64.57%)
Bhartiya Rail Bijlee Company Ltd. (74%)
NTPC has also forayed across energy verticals through various subsidiaries
NTPC –Tamil Nadu Energy Company Ltd. (50%)
Ratnagiri Gas and Power Private Ltd. (29.65%)
Aravali Power Company Private Ltd. (50%)
Meja Urja Nigam Private Ltd. (50%)
NTPC - SCCL Global Ventures Private Ltd. (50%)
NTPC - BHEL Power Projects Private Ltd. (50%)
BF - NTPC Energy Systems Ltd. (49%)
Nabinagar Power Generating Company Private Ltd.(50%)
Transformers & Electrical Kerala Ltd. (44.6%)
International Coal Ventures Private. Ltd. (14.28%)
Anushakti Vidhyut Nigam Ltd. (49%)
CIL NTPC Urja Private Ltd. (50%)
Power generation
Power generation
ServicesServices
Equipment Manufacturing
Equipment Manufacturing
Coal AcquisitionCoal Acquisition
Power TradingPower Trading
23

We expect traction in capacity addition going forward
5,2005,500
5,200
4,300
1,500
3,000
4,500
6,000
MW
NTPC installed capacity additions
� We factor in capacity addition of 4.3GW in FY2011-12.
� Expectations of NTPC's accelerated capacity addition are due to the fact that a large part of its
expansion projects have been under construction since December 2007.
0
FY2011-12E FY2012-13E FY2013-14E FY2014-15E
24
Source: Destimoney Research
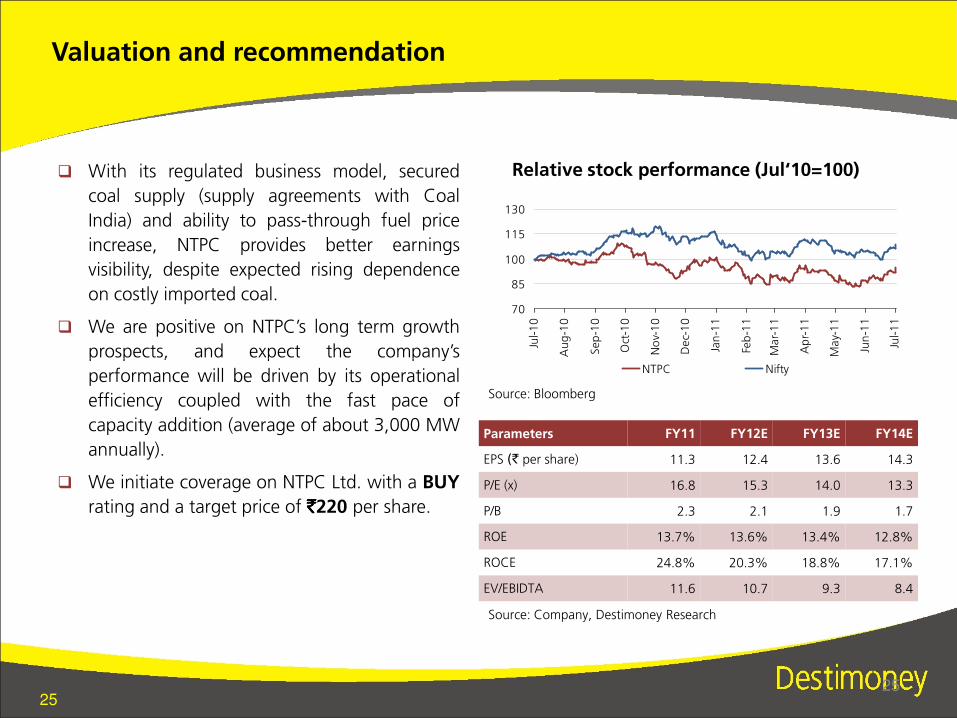
� With its regulated business model, secured
coal supply (supply agreements with Coal
India) and ability to pass-through fuel price
increase, NTPC provides better earnings
visibility, despite expected rising dependence
on costly imported coal.
� We are positive on NTPC’s long term growth
prospects, and expect the company’s
Valuation and recommendation
Relative stock performance (Jul‘10=100)
70
85
100
115
130
Jul-1
0
Au
g-1
0
Sep
-10
Oct
-10
No
v-1
0
Dec-
10
Jan
-11
Feb
-11
Mar-
11
Ap
r-1
1
May-
11
Jun
-11
Jul-1
1
25
Source: Company, Destimoney Research
prospects, and expect the company’s
performance will be driven by its operational
efficiency coupled with the fast pace of
capacity addition (average of about 3,000 MW
annually).
� We initiate coverage on NTPC Ltd. with a BUY
rating and a target price of `̀̀̀220 per share.
Parameters FY11 FY12E FY13E FY14E
EPS (` per share) 11.3 12.4 13.6 14.3
P/E (x) 16.8 15.3 14.0 13.3
P/B 2.3 2.1 1.9 1.7
ROE 13.7% 13.6% 13.4% 12.8%
ROCE 24.8% 20.3% 18.8% 17.1%
EV/EBIDTA 11.6 10.7 9.3 8.4
Source: Bloomberg
25
NTPC Nifty

Income Statement Balance Sheet
`̀̀̀ Mn (consolidated) FY11 FY12E FY13E FY14E
Total Income 619,064 739,518 854,981 968,807
Total Expenditure 427,487 533,478 617,159 704,051
EBIDTA 191,577 206,039 237,822 264,756
Depreciation 27,197 33,627 40,277 47,557
EBIT 164,380 172,412 197,544 217,199
Interest & Fin. Charges 24,929 33,770 46,049 58,328
Provisions 15,528 1,823 1,968 2,070
Prior Year Adjust. (Net) 0 0 0 0
` ` ` ` Mn (consolidated) FY11 FY12E FY13E FY14E
Sources of Funds
Share Capital 82,455 82,455 82,455 82,455
Reserves & Surplus 601,391 672,672 753,485 839,753
Shareholders Equity 683,846 755,127 835,940 922,208
Loan Funds 507,548 687,548 937,548 1,187,548
Minority Interest 4,851 4,851 4,851 4,851
Deferred Liabilities 16,818 16,818 16,818 16,818
Total Liabilities 1,213,062 1,464,344 1,795,157 2,131,425
Financials
Source: Company, Destimoney Research
Prior Year Adjust. (Net) 0 0 0 0
PBT 123,923 136,819 149,528 156,801
Tax 30,441 34,205 37,382 39,200
PAT 93,482 102,614 112,146 117,601
EPS 11.3 12.4 13.6 14.3
Total Liabilities 1,213,062 1,464,344 1,795,157 2,131,425
Application of Funds
Gross Block 874,785 1,046,785 1,254,785 1,462,785
Depreciation 354,423 388,050 428,328 475,885
Net Block 520,362 658,735 826,457 986,900
Goodwill on Consolidation 6 6 6 6
Net Current Assets 227,709 340,618 503,708 679,534
Investments 83,573 83,573 83,573 83,573
Deferred Assets 4,592 4,592 4,592 4,592
Capital Work in Progress 376,820 376,820 376,820 376,820
Total Assets 1,213,062 1,464,343 1,795,156 2,131,424
Ratios FY11 FY12E FY13E FY14E
EBIDTA Margin (%) 30.9% 27.9% 27.8% 27.3%
Net Margin (%) 15.1% 13.9% 13.1% 12.1%
ROCE 24.8% 20.3% 18.8% 17.1%
RONW 13.7% 13.6% 13.4% 12.8%
26

Destimoney Securities Private Limited6th Floor, " A" Wing , Tech-Web Centre, New Link Road, Oshiwara , Near Behram Baug, Jogeshwari (West), Mumbai - 400102
Disclaimer:In the preparation of the material contained in this document, Destimoney* has used information that is publicly available, as also data developed in-house. Some of thematerial used in the document may have been obtained from members/persons other than Destimoney and which may have been made available to Destimoney.material used in the document may have been obtained from members/persons other than Destimoney and which may have been made available to Destimoney.Information gathered & material used in this document is believed to be from reliable sources. Destimoney has not independently verified all the information and opinionsgiven in this material. Accordingly, no representation or warranty, express or implied, is made as to the accuracy, authenticity, completeness or fairness of the informationand opinions contained in this material. For data reference to any third party in this material no such party will assume any liability for the same.Destimoney does not in any way through this material solicit or offer for purchase or sale of any financial services, commodities, products dealt in this material. Destimoneyand any of its officers, directors, personnel and employees, shall not be liable for any loss or damage of any nature, including but not limited to direct, indirect, punitive,special, exemplary, consequential, as also any loss of profit in any way arising from the use of this material in any manner. The recipient alone shall be fully responsible,and/or liable for any decision taken on the basis of this material. All recipients of this material before dealing and/or transacting in any of the products advised, opined orreferred to in this material shall make their own investigation, seek appropriate professional advice and make their own independent decision. This information is notintended for distribution to, or use by, any person or entity in any jurisdiction or country where such distribution or use would be contrary to law or regulation or whichwould subject Destimoney or its affiliates to any registration requirement within such jurisdiction or country. This information does not constitute an offer to sell or asolicitation of an offer to buy any financial products to any person in any jurisdiction where it is unlawful to make such an offer or solicitation. No part of this material maybe duplicated in whole or in part in any form and / or redistributed without the prior written consent of Destimoney. This material is strictly confidential to the recipient andshould not be reproduced or disseminated to anyone else.Names such as Teji Mandi, Maal Lav, Maal Le or similar others for market calls and products are merely names coined internally and are not universally defined, and shallnot be construed to be indicative of past or potential performance. Recipients of research reports shall always independently verify reliability and suitability of the reportsand opinions before investing.*"Destimoney" means any company using the name “Destimoney” as part of its name.
27