NSW weed risk management system form · WEED RISK MANAGEMENT SYSTEM . ... The score for weed risk...
21
NEW SOUTH WALES WEED RISK MANAGEMENT SYSTEM INDUSTRY AND INVESTMENT NEW SOUTH WALES ORANGE NSW 2800 August 2009
Transcript of NSW weed risk management system form · WEED RISK MANAGEMENT SYSTEM . ... The score for weed risk...

NEW SOUTH WALES WEED RISK MANAGEMENT SYSTEM
INDUSTRY AND INVESTMENT NEW SOUTH WALES ORANGE NSW 2800 August 2009

NEW SOUTH WALES WEED RISK MANAGEMENT FORM
INTRODUCTION
The NSW Weed Risk Management (WRM) system aims to provide a standard, nationally accepted and transparent process to help make decisions about the introduction, prioritisation and declaration of potential weed or weed species. It has been designed so that it can be applied to a number of geographic scales, for example it can be applied to the state of New South Wales, to regions or catchments, or to individual Local Control Areas, and may even be applied to individual land management units, for example a farm or a National park. This document contains the assessment form for the NSW WRM system. It is important that this form be submitted with declaration applications. “How do I fill in the form?” This assessment form is filled out after referring to the instructions contained in the New South Wales Weed Risk Management Guide. It is important to use accurate information to complete this form. To enable this, useful information sources are listed in the Sourcing information (page Error! Bookmark not defined.) and Information sources (page Error! Bookmark not defined.) sections of the guide. “Is there any other information that I should provide?” Aside from the answers required in this form, it is important to provide a copy of the source of the information (page Error! Bookmark not defined.) of the guide. Failure to supply information may result in the assessment being sent back to the assessor/s. “What do I do with the completed form?”
The completed form and any additional information should be sent prior to 30 June annually to be considered that year to: - NWAC Secretary Weeds Unit New South Wales Department of Industry and Investment Locked Bag 21 ORANGE NSW 2800 Alternatively Fax: 02 6391 3206 (and post the original) Assessments may not be processed in the year of submission if they are received after 30 June. NSW DII will advise you of the outcome of the assessment.

NEW SOUTH WALES WEED RISK MANAGEMENT FORM
Contact Assessors details
Contact Assessor’s Name: ............................................................................. Company/Organisation: ............................................................................. Telephone Number: ............................................................................. Fax Number: ............................................................................. Postal Address: ............................................................................. ............................................................................. ............................................................................. ............................................................................. Assessment working group (stakeholders and experts who helped conduct assessments): ....................................... ...................................... ....................................... ...................................... ....................................... ...................................... ....................................... ...................................... ....................................... ......................................
General weed information Genus: ............................................................................. Species: ............................................................................. Common Name(s): ............................................................................. Family: ............................................................................. Subspecies/Variety/Cultivar............................................................................. Management Area: ............................................................................. Land use: .............................................................................
3

4
Assumptions

Invasiveness Question scores ‘Do not know’ scores Q1 Q2 Q3 Total Q1 Q2 Q3a Q3b Q3c Total
5
Invasiveness 1. What is the ability of the weed to establish amongst existing plants? SCORE very high "Seedlings” establish within dense vegetation or weeds. 3 high "Seedlings" establish within open vegetation or weeds. 2 medium "Seedlings" establish after moderate disturbance. 1 low "Seedlings" mainly need bare ground to establish. 0 do not know 1.5 Source and comments 2. What is the weed’s tolerance to average weed management practices in the land use? SCORE very high 95% + weeds survive common management. 3 high Between 50 and 95% of weeds survive. 2 medium Between 5 and 50% of weeds survive. 1 low Less than 5% of weeds survive. 0 do not know 1.5 Source and comments 3. What is the reproductive ability of the weed in the land use? (a) Time to seeding (b) Annual seed production (c) Vegetative reproduction 1 year or less 2 high 2 frequent 2 >1 to 3 yrs 1 low 1 infrequent 1 >3 yrs/never 0 none 0 none 0 do not know 1 do not know 1 do not know 1 Total score (a+b+c) SCORE 5 or 6 3 3 or 4 2 1 or 2 1 0 0 Source and comments

Invasiveness Question scores ‘Do not know’ scores Q1 Q2 Q3 Q4 Q5 Total Q1 Q2 Q3a Q3b Q3c Q4a Q4b Q4c Q4d Q5a Q5b Q5c Q5d Total
6
4. How likely is long-distance dispersal (>100 m) by natural means? (a) Flying animals (b) Other wild animals (c) Water (d) Wind common 2 2 2 2 occasional 1 1 1 1 unlikely 0 0 0 0 do not know 1 1 1 1
Total score (a+b+c+d)
SCORE
6, 7 or 8 3 3, 4 or 5 2 1 or 2 1 0 0
Source and comments 5. How likely is long-distance dispersal (>100 m) by human means? (a) Deliberate spread
by people (b) Accidentally by people and vehicles
(c) Contaminated produce
(d) Domestic/farm animals
common 2 2 2 2 occasional 1 1 1 1 unlikely 0 0 0 0 do not know 1 1 1 1 Total score
(a+b+c+d) SCORE
6, 7 or 8 3 3, 4 or 5 2 1 or 2 1 0 0 Source and comments

Invasiveness scores Impact Question scores ‘Do not know’ scores Questions Uncert Q1 Q2 Q3 Total Q1 Q2 Q3 Total
7
Impacts 1. Does the weed reduce the establishment of desired plants? SCORE >50% reduction More than 50% of desired plants do not establish. 3 10-50% reduction Between 10 and 50% of desired plants do not establish. 2 <10% reduction Less than 10% of desired plants do not establish. 1 no reduction Establishment unaffected. 0 do not know 1.5 Source and comments 2. Does the weed reduce the yield or amount of desired vegetation? SCORE >50% reduction More than 50% reduction in desired plants yield/amount. 4 25-50% reduction Between 25 and 50% reduction in yield/amount. 3 10-25% reduction Between 10 and 25% reduction in yield/amount. 2 <10% reduction Less than 10% reduction in desired plants yield/amount. 1 no reduction Desired plant yield or amount is unaffected. 0 do not know 2 Source and comments 3. Does the weed reduce the quality of products, diversity or services available from the land use? SCORE high Severe reductions. 3 medium Substantial reductions. 2 low Slight reductions. 1 none No reduction. 0 do not know 1.5 Source and comments
Invasiveness scores Impact Question scores Questions Uncertainty Q1 Q2 Q3 Q4 Q5 Q6 Total
‘Do not know’ scores
Q1 Q2 Q3 Q4 Q5 Q6a Q6b Q6c Q6d Q6e Q6f
8
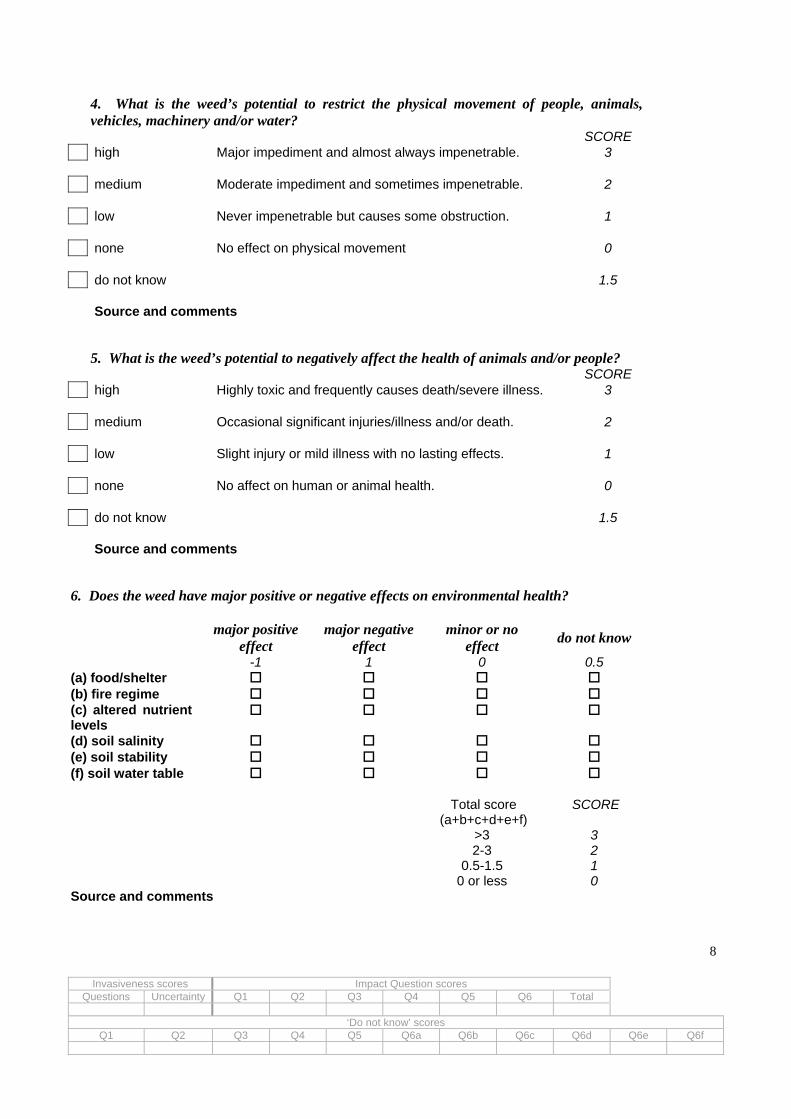
4. What is the weed’s potential to restrict the physical movement of people, animals, vehicles, machinery and/or water?
SCORE high Major impediment and almost always impenetrable. 3 medium Moderate impediment and sometimes impenetrable. 2 low Never impenetrable but causes some obstruction. 1 none No effect on physical movement 0 do not know 1.5 Source and comments
5. What is the weed’s potential to negatively affect the health of animals and/or people? SCORE high Highly toxic and frequently causes death/severe illness. 3 medium Occasional significant injuries/illness and/or death. 2 low Slight injury or mild illness with no lasting effects. 1 none No affect on human or animal health. 0 do not know 1.5 Source and comments
6. Does the weed have major positive or negative effects on environmental health?
major positive effect
major negative effect
minor or no effect do not know
-1 1 0 0.5 (a) food/shelter (b) fire regime (c) altered nutrient levels
(d) soil salinity (e) soil stability (f) soil water table Total score
(a+b+c+d+e+f) SCORE
>3 3 2-3 2 0.5-1.5 1 0 or less 0 Source and comments

Invasiveness scores Impact scores Potential distribution scores Questions Uncertainty Questions Uncertainty Question Uncertainty
9
Potential distribution
Within the geographic area being considered, what is the percentage area of land use that is suitable for the weed?
SCORE >80% of land use Weed has potential to spread to 80%+ of land use. 10 60-80% of land use Weed has potential to spread to 60-80% of land use. 8 40-60% of land use Weed has potential to spread to 40-60% of land use. 6 20-40% of land use Weed has potential to spread to 20-40% of land use. 4 10-20% of land use Weed has potential to spread to 10-20% of land use. 2 5-10% of land use Weed has potential to spread to 5-10% of land use. 1 <5% of land use Weed has potential to spread to less than 5% of land use. 0.5 unsuited to land use Weed not suited to growing in any part of land use. 0 do not know 5 Source and comments
(Please attach relevant maps if information is not published)

Comparative Weed Risk and Uncertainty Scores
The score for weed risk is calculated by adjusting the Invasiveness, Impacts and Potential distribution scores to range from 0 to 10, and then multiplying these. Weed risk will have a maximum of 1000 and a minimum of 0. The electronic form does this for you.
To calculate manually, adjust the raw scores as follows: Invasiveness: Divide by 15 and multiply by 10. Round score to nearest decimal place. Impacts: Divide by 19 and multiply by 10. Round score to nearest decimal place. Potential distribution: Leave score unchanged.
Comparative Weed Risk = Invasiveness × Impacts × Potential distribution
(Round to the nearest whole number)
Splitting up these possible scores into bands of 20% gives cut-offs for categories of weed risk as follows: Frequency bands and weed risk Categories Frequency band Weed Risk Score Weed Risk 80-100% (top 20% of possible scores) 192+ Very high 60-80% 101-192 High 40-60% 39-100 Medium 20-40% 13-38 Low 0-20% (bottom 20% of possible scores) <13 Negligible Weed Risk scores Raw score Correction Adjusted score
Invasiveness … ((Raw score)/15) x 10 … (a)
Impacts … ((Raw score)/19) x 10 … (b)
Potential Distribution … Unchanged … (c)
Comparative Weed Risk … i.e. (a) x (b) x (c)
Weed Risk Category (from frequency band table above)
… (e.g. Very high)
10

The uncertainty score for weed risk assessment is determined by calculating the percentage of ‘do not know’ answers that have been recorded in the Invasiveness, Impacts and Potential distribution sections. In the case of part questions, for example Invasiveness Questions 3-5 and Impacts Question 6 record the individual scores from each ‘do not know’ question in each part to determine the section uncertainty score. Do not combine the scores from each ‘do not know’ question to calculate a score for that question as was done to calculate the question score. See page Error! Bookmark not defined. for an example. The electronic form does this for you.
Weed Risk uncertainty scores Section uncertainty score Correction Adjusted uncertainty score
Invasiveness … ((Raw score)/14) x 100 …
Impacts … ((Raw score)/11) x 100 …
Potential Distribution … ((Raw score)/5) x 100 …
To calculate manually, adjust the section uncertainty score as follows: Invasiveness: Divide by 14 and multiply by 100. Round to nearest whole number. Impacts: Divide by 11 and multiply by 100. Round to nearest whole number. Potential distribution: Divide by 5 and multiply by 100.
(Round to the nearest whole number)
11

Control cost scores ‘Do not know’ scores Q1 Q2 Total Q1a Q1b Q1c Q1d Q2 Total
12
Control costs 1. How detectable is the weed? (a) Distinguishing features (b) Period of year shoot growth visible non-descript 2 <4 months 2 sometimes distinct 1 4-8 months 1 always distinct 0 >8 months 0 do not know 1 do not know 1 (c) Height at maturity
(d) Pre-reproductive height in relation to other vegetation
<0.5 m 2 below canopy 2 0.5-2 m 1 similar height 1 >2 m 0 above canopy 0 do not know 1 do not know 1 Total (a+b+c+d) SCORE
6, 7 or 8
3
3, 4 or 5 2 1 or 2 1 0 0 Source and comments
2. What is general accessibility of known infestations at the optimum time of treatment? SCORE low Most sites difficult to access, requiring special equipment. 2 medium Most sites readily accessed, may require extra equipment. 1 high All sites readily accessible by conventional methods. 0 not present Not known to be present. 0 do not know 1 Source and comments

Control cost scores ‘Do not know’ scores Q1 Q2 Q3 Q4 Total Q1a Q1b Q1c Q1d Q2 Q3a Q3b Q3c Q4 Total
13
3. How expensive is management of the weed in the first year of targeted control? (a) Chemical cost -
How much chemical will you use/ha?
(b) Labour costs - How many person hours will it take you to control/ha?
(c) Equipment costs - What equipment are you going to use?
very high 4 4 - -
high 3 3 3
medium 2 2 2
low 1 1 1
none/not present 0 0 0
do not know 2 2 1.5
Total score
(a+b+c) SCORE
8.5-11 5 6.5-8 4 4.5-6 3 2.5-4 2 1-2 1 0 0 Source and comments
4. What is the likely level of participation from landholders/volunteers within the land use at risk? SCORE low Weed management rarely undertaken, beyond capacity. 2 medium Significant weed management changes needed, within capacity. 1 high Minimal weed management changes needed. 0 do not know 1 Source and comments

Control cost scores Persistence scores ‘Do not know’ scores Questions Uncert Q1 Q2 Q3 Total Q1 Q2 Q3 Total
14
Persistence
1. How effective are targeted management treatments applied to infestations of the weed? SCORE low More than 25% of weeds survive annual targeted treatment/s. 3 medium 5-25% of weeds survive annual targeted treatment/s. 2 high 1-5% of weeds survive annual targeted treatment/s. 1 very high <1% of weeds survive annual targeted treatment/s. 0 do not know 1.5 Source and comments
2. What is the minimum time period for reproduction of sexual or vegetative propagules? SCORE <6 months Minimum generation time <6 months. 3 6-12 months Minimum generation time 6-12 months. 2 <1-2 years Minimum generation time <1-2 years. 1 >2 years Minimum generation time >2 years. 0 do not know 1.5 Source and comments
3. What is the maximum longevity of sexual or vegetative propagules? SCORE >5 years Propagules remain viable for at least 5 years. 2 2-5 years Propagules remain viable for 2-5 years. 1 <2 years Propagules remain viable for less than 2 years. 0 do not know 1 Source and comments

Control cost scores Persistence scores ‘Do not know’ scores Questions Uncert Q1 Q2 Q3 Q4 Total Q1 Q2 Q3 Q4a Q4b Total
15
4. How likely are new propagules to continue to arrive at control sites, or to start new infestations? (a) Long-distance (>100 m) dispersal (b) Long-distance (>100 m) dispersal by natural means by human means frequent 2 2 occasional 1 1 rare 0 0 do not know 1 1 Total (a+b) SCORE 4 3 2 or 3 2 1 1 0 0 Source and comments

Control cost scores Persistence scores Current distribution scores ‘Do not know’ scores Questions Uncert Questions Uncert Q1 Q2 Total Q1 Q2 Total
16
Current distribution 1. What percentage area of the land use in the geographic area is currently infested by the weed?
SCORE >80% land use Weed infests more than 80% of land use. 10 60-80% land use Weed infests 60-80% of land use. 8 40-60% land use Weed infests 40-60% of land use. 6 20-40% land use Weed infests 20-40% of land use. 4 10-20% land use Weed infests 10-20% of land use. 2 5-10% land use Weed infests 5-10% of land use. 1 1-5% land use Weed infests 1-5% of land use. 0.5 <1% land use Weed infests less than 1% of land use. 0.1
0% of land use but Weed not known in land use but infests 20-40% of geographic area. 2 20-40% of area 0% of land use but Weed not known in land use but infests 10-20% of geographic area. 1 10-20% of area 0% of land use but Weed not known in land use but infests 5-10% of geographic area. 0.5 5-10% of area 0% of land use but Weed not known in land use but infests 1-5% of geographic area. 0.1 1-5% of area 0% of land use and Weed not known in land use and infests <1% of geographic area. 0.05 <1% of area not present Weed not known to be present in the geographic area. 0 do not know 5 Source and comments (Please attach relevant maps or other information if not published)
2. What is the number of infestations, and weed distribution within the geographic area being considered?
SCORE widespread Weed occurs as large and small infestations across most of the geographic area. 2 scattered Weed occurs mainly as small infestations across much of the geographic area. 1 restricted Weed is localised in a small number of outbreaks within the geographic area. 0 not present Weed is not known to be present within the geographic area. 0 do not know 1 Source and comments

Comparative Feasibility of Coordinated Control and Uncertainty scores
The score for feasibility of coordinated control is calculated by adjusting the Control costs, Persistence and Current distribution scores to range from 0 to 10, and then multiplying these. Feasibility of coordinated control will have a maximum of 1000 and a minimum of 0. The electronic form does this for you.
Splitting up these possible scores into bands of 20% gives cut-offs for categories of feasibility as follows: Frequency bands and weed feasibility of coordinated control categories Frequency band Feasibility Score Weed Feasibility 80-100% (top 20% of possible scores) 113+ Negligible 60-80% 56-113 Low 40-60% 31-55 Medium 20-40% 14-30 High 0-20% (bottom 20% of possible scores) <14 Very high Feasibility of coordinated control scores Raw score Correction Adjusted score
Control costs … ((Raw score)/12) x 10 … (a)
Persistence … ((Raw score)/11) x 10 … (b)
Current Distribution … ((Raw score)/12) x 10 … (c)
Comparative Weed Risk … i.e. (a) x (b) x (c)
Weed Feasibility Category (from frequency band table above) … (e.g. Negligible)
To calculate manually, adjust the raw scores as follows: Control costs: Divide by 12 and multiply by 10. Round score to nearest decimal place. Persistence: Divide by 11 and multiply by 10. Round score to nearest decimal place. Current distribution: Divide by 12 and multiply by 10. Round score to nearest decimal place. Feasibility of coordinated control = Control Costs × Persistence × Current Distribution
(Round to the nearest whole number)
17

The uncertainty score for feasibility of coordinated control is determined by calculating the percentage of ‘do not know’ answers that have been recorded in the Control costs, Persistence and Current distribution sections. In the case of part questions, for example Control costs Questions 1 and 3 and Persistence Question 4 record the individual scores for each ‘do not know’ question in each part to determine the section uncertainty score. Do not combine the scores from each ‘do not know’ question to calculate a score for that question as was done to calculate the question score. See page Error! Bookmark not defined. for an example. The electronic form does this for you.
Feasibility uncertainty scores Section uncertainty score Correction Adjusted uncertainty score
Control costs … ((Raw score)/12) x 100 …
Persistence … ((Raw score)/6) x 100 …
Current Distribution … ((Raw score)/6) x 100
…
To calculate manually, adjust the section uncertainty score as follows: Control costs: Divide by 12 and multiply by 100. Round to nearest whole number. Persistence: Divide by 6 and multiply by 100. Round to nearest whole number. Current distribution: Divide by 6 and multiply by 100. Round to nearest whole number.
(Round to the nearest whole number)
18

Overall uncertainty score Calculation of overall uncertainty score
Section Adjusted uncertainty score (Percentage uncertainty)
Invasiveness
Impacts
Potential distribution
Control costs
Persistence
Current Distribution
=(sum of adjusted uncertainty scores above)/6
(round to nearest whole number)
The following levels of overall uncertainty need to be considered before submitting assessments. Assessments submitted with levels of overall uncertainty exceeding 15% will generally be returned to the assessor/s for further research.
Overall uncertainty level Suggested response needed
<15%
Submit assessment (ensure all information sources have been attached)
15-30%
Revisit existing literature and source new literature
before submitting assessment (contact NSW DII staff for other possible information sources)
>30%
Do not submit assessment (contact NSW DII regional staff for help in locating information)
19

Positive impacts Are there any other positive impacts the species may have? Positive impact Source
List stakeholders consulted and outcomes of these discussions. Stakeholders consulted Outcomes
20

21
Further comments Are there any further comments you would like to offer to support this assessment?