NSTTUTE FOR RESEARCH ON
25
NST TUTE FOR 133-72 RESEARCH ON WELFARE POLICY AND THE EMPLOYMENT RATE OF AFDC MOTHERS Irwin Garfinkel and Larry L. Orr
Transcript of NSTTUTE FOR RESEARCH ON

NSTTUTE FOR 133-72
RESEARCH ONPOVER1YD,scWK~J~~
WELFARE POLICY AND THE EMPLOYMENTRATE OF AFDC MOTHERS
Irwin Garfinkel andLarry L. Orr
Welfare Policy and the EmploymentRate of AFDC Mothers
by
Irwin Garfinkel and Larry Orr
The authors are respectively visiting staff economist in the PolicyResearch Division, Office of Economic Opportunity on leave from theInstitute for Research on Poverty and Social Work Department, Universityof Wisconsin, and staff economist in the Policy Research DiviS'ion, Office ofEconomic Opportunity. The research reported here was supported in part byfunds granted to the Institute for Research on Poverty at the University ofWisconsin, by the Office of Economic Opportunity pursuant to the provisionsof the Economic Opportunity Act of 1964. Edward M. Gramlich and StanleyMasters provided helpful comments and suggestions. The final responsibility,ho~ever, is ours.

ABSTRACT
The paper analyzes the effect of economic incentives in the AFDC
program on the employment of AFDC mothers. Multiple regression analysis is
applied to cross-sectional aggregate state program data for 1967. Our
estimates indicate that the level of guarantees, tax rates and set-asides
affect AFDC employment rates in the direction predicted by economic theory.
Short of a drastic reduction in guarantees, however, manipulation of any
of these program parameters is not likely to induce most AFDC mothers tb
work.
I. Introduction
Concern for the employment of welfare beneficiaries has been a
continuing theme of national public assistance policy over the past
decade. Primary attention has focused on the Aid to Families with
Dependent Children (AFDC) program comprised mainly of single mothers
of minor children.
Prior to 1962, working mothers in the program were likely to be
worse off, in terms of net disposable income, than non-working mothers,
because gross earnings were offset dollar-for-dollar against AFDC benefits.
In 1962, deductions for work-related expenses were introduced in an effort
to encourage employment (and thereby reduce governmental transfer costs),
but a 100% tax on net earnings remained in force in most states. The 1967
Amendments to the Social Security Act, aimed at fostering "independence and
self-support" of AFDC mothers, further liberalized the treatment of earnings
by exempting the first $30 of monthly earnings and one-third of the remainder,
in addition to work-related expenses. l The 1967 Amendments also reorganized
and expanded existing work training programs under the new "Work Incentive
Program" (WIN), and provided for prompt reinstatement of welfare benefits
to former AFDC mothers who b~came involuntarily unemployed. Finally, these
Amendments provided that the federal government would not provide matching
grants for beneficiaries in excess of the number who were on the rolls as
of July 1968, a provision which was subsequently repealed.

2
In 1971, in response to rapidly rising costs and case loads under
the program, national policy took a more purely coercive tack. Congress
enacted the Talmadge Amendment, which required that able-bodied AFDC
mothers with no preschool children register for, and accept, work or
training. This measure, slated to take effect July 1, 1972, puts into
force essentially the same work requirement as is embodied in the
Administration's pending welfare reform legislation.
In view of these repeated legislative attempts to get AFDC mothers
"off the welfare rolls and onto payrolls," it seems surprising that there
have been very few rigorous attempts to evaluate the efficacy of the various
program features and incentives designed to further this goal. Governmental
evaluations have been scattered and inconclusive, while, for the most part,
academic researchers have tended to ignore the existing welfare programs,
concentrating their efforts instead on the labor supply of the currently
ineligible "working poor" who would be newly covered by a universal income
maintenance program.2
But the labor supply of female heads of households
like that of married women may be far more elastic with respects to wage
rates and income from nonemployment sources than that of able-bodied
males heads of households because for women with children, the opportunity
cost of working is so high. It would be inappropriate therefore to generalize
from studies of able-bodied males to the AFDC population or vice versa.
Thus, given the wide variation in state AFDC policies toward employment of
welfare mothers, it seems worthwhile to carefully analyze whatever impact
these policies have had upon the labor market behavior of AFDC beneficiaries.
That is the central purpose of this paper.
This study provides--for the first time, to our know1edge--a comprehensive
analysis of virtually all of the employment-relevant features of AFDC. This
3
is possible only through the use of program data, since many of the AFDC
program parameters have no counterparts in the private sector, or even in
the income maintenance experiments now in the field. The use of program
data also allows us to evaluate these features in the context of real
world program administration, thereby enhancing the applicability of the
results to future policy decisions and program modifications.
II. Policy Parameters of the AFDC Program
The study reported here was designed to estimate the effects of the
various AFDC policy parameters on the employment rate of AFDC mothers.
The technique employed is multiple regression analysis 6£ cross-sectional
state aggregates for November and December 1967.
The employment rate (i.e., the ratio of working mothers to all mothers
in the program) was selected as the sole dependent variable primarily because
other desirable measures of ~bor supply, such as hours of work, were
unavailable.3
In any case, there appears to be sufficient policy interest
in this variable to justify its analysis.
The year 1967 was chosen because it is the most recent period for which
reliable state data for all of the variables of interest are available. In
addition, 1967 is more likely to represent a period of relative equilibrium
in the AFDC program than more recent years, because it preceded the effective
date of the fundamental changes enacted under the Social Security Amendments
of 1967 and the rapid case10ad increases which have occurred since.
In all states, mothers with incomes below the state AFDCneed standard,
or break-even level of net income, were eligible for assistance. Benefit
schedules in 1967 all conformed to one of the three structures shown
graphically in Figure 1:

4Figure 1
State AFDC Benefit Schedules in 1967
Total C
NetIncome
A B
//
//
//
/a Net
EarningsCase 1.
Total CNet
Income
S/
A //
//
/a Net
EarningsCase 2.
Total D
NetIncome
S B C
/A /
//
//
Neta EarningsCase 3.
5
Case 1. In twenty-four states, earnings net of work-related
expenses were offset in full against AFDC benefits.
As shown in Figure 1, the state standard OA was equal
to the guarantee, the payment to a family with no other
income. Thus, net income of working AFDC mothers in
these states was invariant with net earnings up to the
breakeven point (B) where welfare benefits fell to zero
and the mother left the AFDC rolls.
Case 2. In nine states, AFDC benefits were computed as a fraction
of the difference between net non-assistance income and
the state need standard. The effect of these so-called
"reduction formulas" was to produce a negative tax-like
transfer schedule with the guarantee (OA) equal to some
fraction of the state standard or break-even level of
income (OS) and with a constant marginal tax ~ate
(slope AB) equal to the fraction of the deficit filled
by benefits.
Case 3. In the remaining seventeen states, the Case I-type
transfer schedule was modified since the maximum payment
allowed (OA) was less than the state need standard (OS).
In this case the guarantee (OA) was equal to. the maximum
payment. So long as net earnings plus the maximum payment
was less than the state standard, payments were not
reduced. This produced an initial "set-aside" range of
zero marginal tax rate, up to the point (B) where net
earnings plus the maximum benefits was equal to the state
need standard. Additional net earnings beyond this point
were fully offset against AFDC benefits, with a breakeven
point (C) at the state need standard.
6
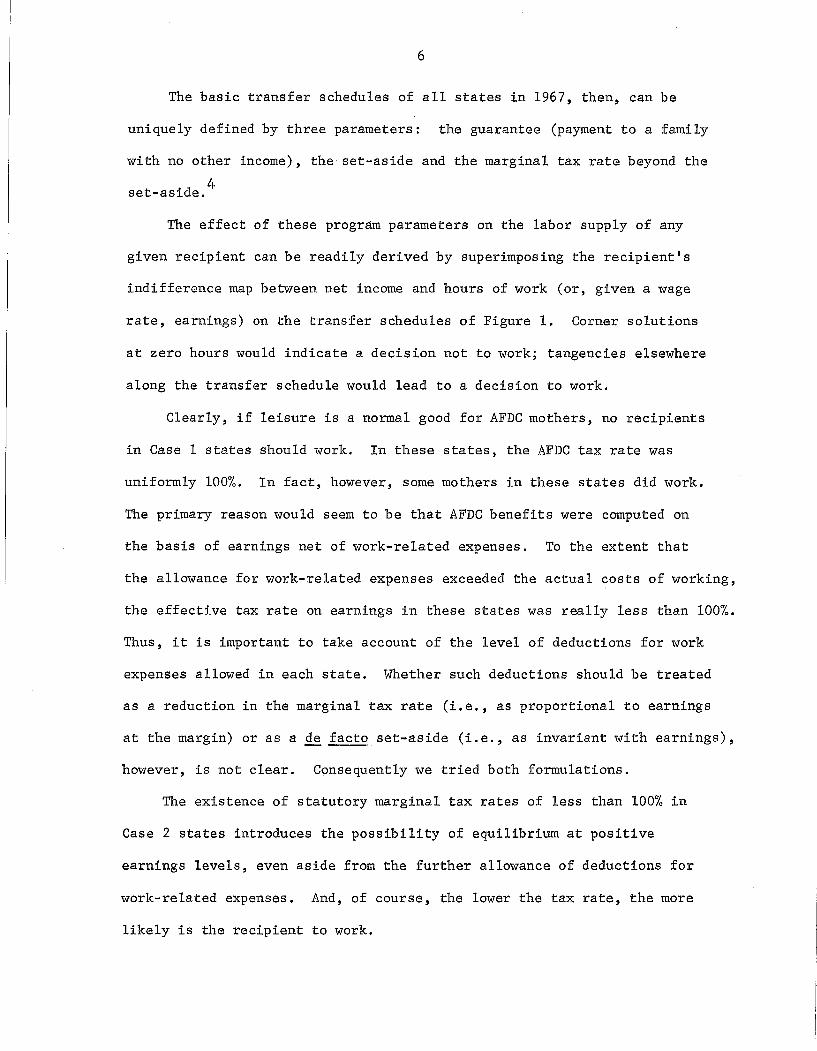
The basic transfer schedules of all states in 1967, then, can be
uniquely defined by three parameters: the guarantee (payment to a family
with no other income), the set-aside and the marginal tax rate beyond the
set-aside. 4
The effect of these program parameters on the labor supply of any
given recipient can be readily derived by superimposing the recipient's
indifference map between net income and hours of work (or, given a wage
rate, earnings) on the transfer schedules of Figure 1. Corner solutions
at zero hours would indicate a decision not to work; tangencies elsewhere
along the transfer schedule would lead to a decision to work.
Clearly, if leisure is a normal good for AFDC mothers, no recipients
in Case 1 states should work. In these states, the AFDC tax rate was
uniformly 100%. In fact, however, some mothers in these states did work.
The primary reason would seem to be that AFDC benefits were computed on
the basis of earnings net of work-related expenses. To the extent that
the allowance for work-related expenses exceeded the actual costs of working,
the effective tax rate on earnings in these states was really less than 100%.
Thus, it is important to take account of the level of deductions for work
expenses allowed in each state. Whether such deductions should be treated
as a reduction in the marginal tax rate (i.e., as proportional to earnings
at the margin) or as a de facto set-aside (i.e., as invariant with earnings),
however, is not clear. Consequently we tried both formulations.
The existence of statutory marginal tax rates of less than 100% in
Case 2 states introduces the possibility of equilibrium at positive
earnings levels, even aside from the further allowance of deductions for
work-related expenses. And, of course, the lower the tax rate, the more
likely is the recipient to work.
7
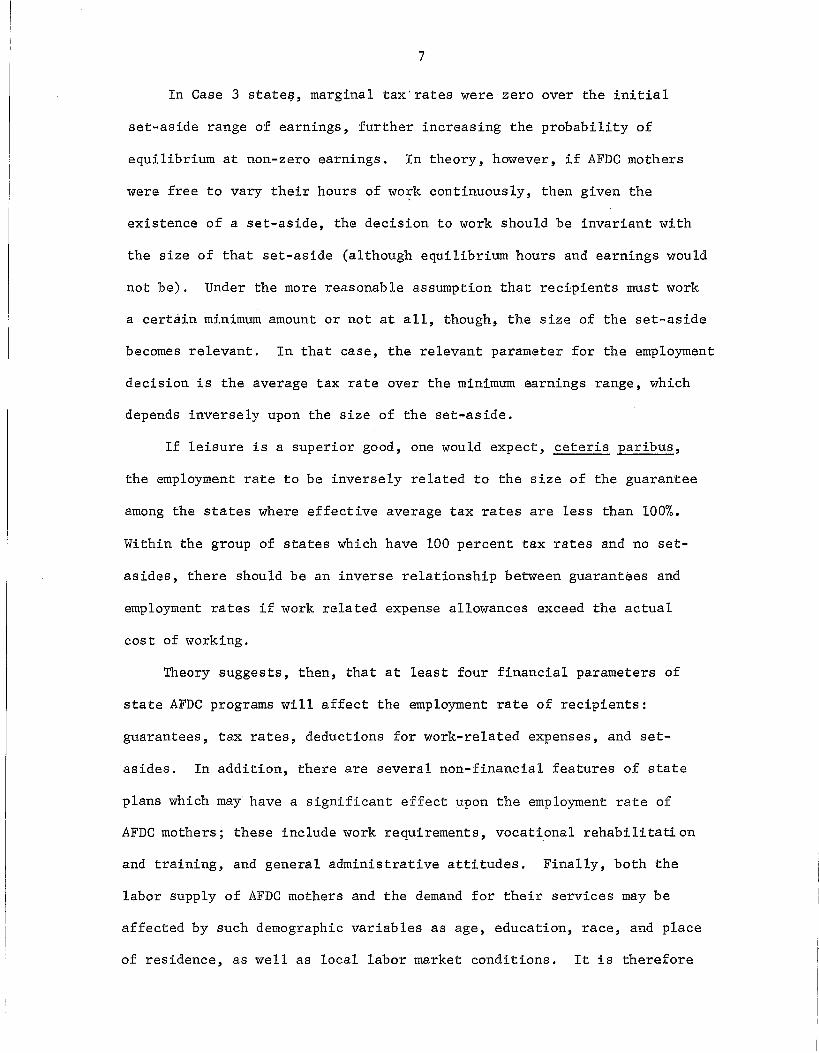
In Case 3 state~, marginal tax'rates were-zero over the initial
set-aside range of earnings, further increasing the probability of
equilibrium at non-zero earnings. In theory, however, if AFDC mothers
were free to vary their hours of work continuously, then given the
existence of a set-aside, the decision to work should be invariant with
the size of that set-aside (although equilibrium hours and earnings would
not be). Under the more reasonable assumption that recipients must work
a certain minimum amount or not at all, though, the size of the set-aside
becomes relevant. In that case, the relevant parameter for the employment
decision is the average tax rate over the minimum earnings range, which
depends inversely upon the size of the set-aside.
If leisure is a superior good, one would expect, ceteris paribus,
the employment rate to be inversely related to the size of the guarantee
among the states where effective average tax rates are less than 100%.
Within the group of states which have 100 percent tax rates and no set
asides, there should be an inverse relationship between guarantees and
employment rates if work related expense allowances exceed the actual
cost of working.
Theory suggests, then, that at least four financial parameters of
state AFDC programs will affect the employment rate of recipients:
guarantees, tax rates, deductions for work-related expenses, and set
asides. In addition, there are several non-financial features of state
plans which may have a significant effect upon the employment rate of
AFDC mothers; these include work requirements, vocational rehabilitation
and training, and general administrative attitudes. Finally, both the
labor supply of AFDC mothers and the demand for their services may be
affected by such demographic variables as age, education, race, and place
of residence, as well as local labor market conditions. It is therefore

8
important to control for these variables as well as possible in attempting
to estimate the effects of program policy variables.
III. Empirical Estimates of Effects on the AFDC Employment Rate
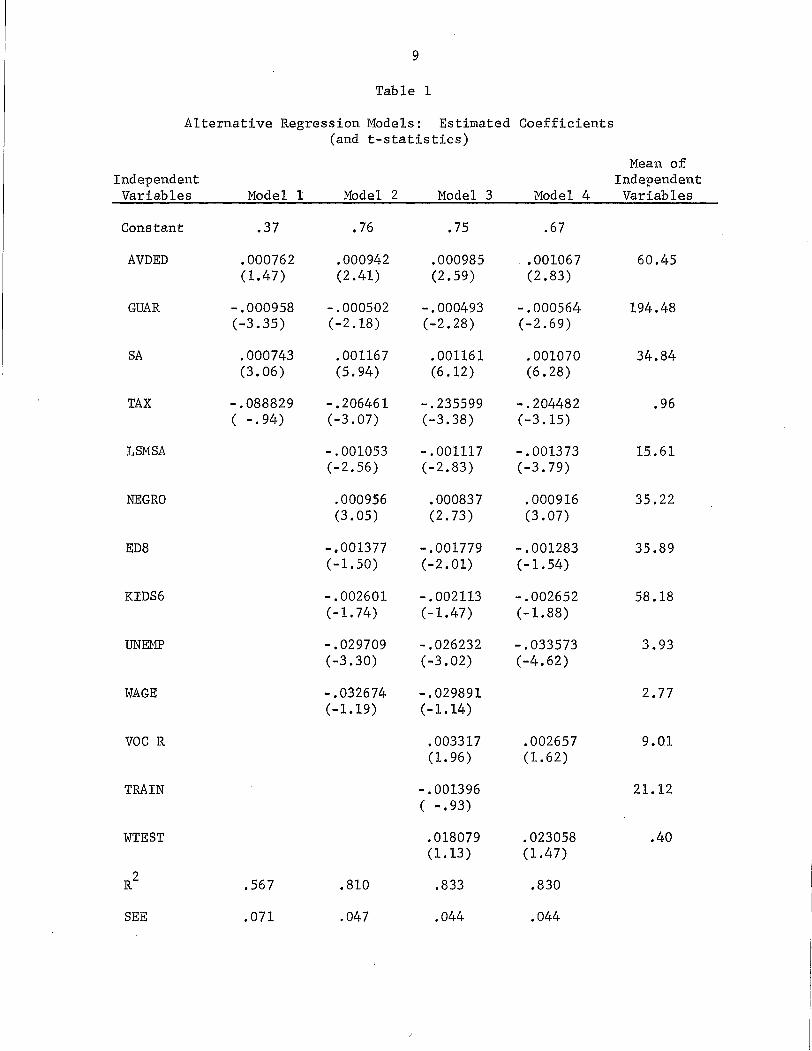
The estimated coefficients and tests of significance for several
alternative regression models are shown in Table 1. The dependent variable
in all of the models is the state AFDC employment rate. Each model is
discussed in turn below.
Modell. As a first test of the hypotheses advanced in Section II,
the employment rate was regressed on only the four financial parameters
of the program: the guarantee (GUAR), tax rate (TAX), set-aside (SA),
and average deductions from gross income (AVDED). Due to data limitations,
AVDED is defined as average total deductions for all reasons (for those
mothers with deductions) rather than only work-related deductions.
Nationally, work~related expenses accounted for 59% of total deductions
in 1967. The three variables GUAR, SA, and AVDED are measured in dollars
per month.
In this simple model, all of the coefficients have the theoretically
anticipated signs, and GUAR and SA are significantly different from zero
at the .01 level. The'TAX coefficient is iRsignificant in this model.
While the standard error of the AVDED variable is larger than that of SA,
the magnitudes of the two coefficients are extremely close. An alternative
form of the deduction variables was used in several of the models presented
here to test the hypothesis that deductions acted like a tax variable,
rather than a set-aside. The variable used was the ratio of average total
deductions for those with deductions (AVDED) to average earnings of working
mothers. This variable was invariably much less significant than AVDED.
These findings support the hypotheses that allowances for work related
9
Table 1
Alternative Regression Models: Estimated Coefficients(and t-statistics)
Mean ofIndependent IndependentVariables Model 1 Model 2 Model 3 Model 4 Variables
Constant .37 .76 .75 .67
AVDED .000762 .000942 .000985 .001067 60.45(1.47) (2.41) (2.59) (2.83)
GUAR -.000958 -.000502 -.000493 -.000564 194.48(-3.35) (-2.18 ) (-2.28) (-2.69)
SA .000743 .001167 .001161 .001070 34.84(3.06 ) (5.94) (6.12) (6.28 )
TAX -.088829 -.206461 -.235599 -.204482 .96( -.94) (-3.07) (-3.38) (-3.15)
LSMSA -.001053 -.001117 -.001373 15.61(-2.56) (-2.83) (-3.79)
NEGRO .000956 .000837 .000916 35.22(3.05) (2.73) (3.07)
ED8 - .001377 -.001779 -.001283 35.89(-1.50) (-2.01) (-1.54)
KIDS6 -.002601 -.002113 -.002652 58.18(-1.74) (-1.47) (-1.88)
UNEMP -.029709 -.026232 -.033573 3.93(-3.30) (-3.02) (-4.62)
WAGE -.032674 -.029891 2.77(-1.19) (-1.14)
VOC R .003317 .002657 9.01(1. 96) (1. 62)
TRAIN -.001396 21.12( -.93)
WTEST .018079 .023058 .40(1.13 ) (1.47)
R2 .567 .810 .833 .830
SEE .071 .047 .044 .044
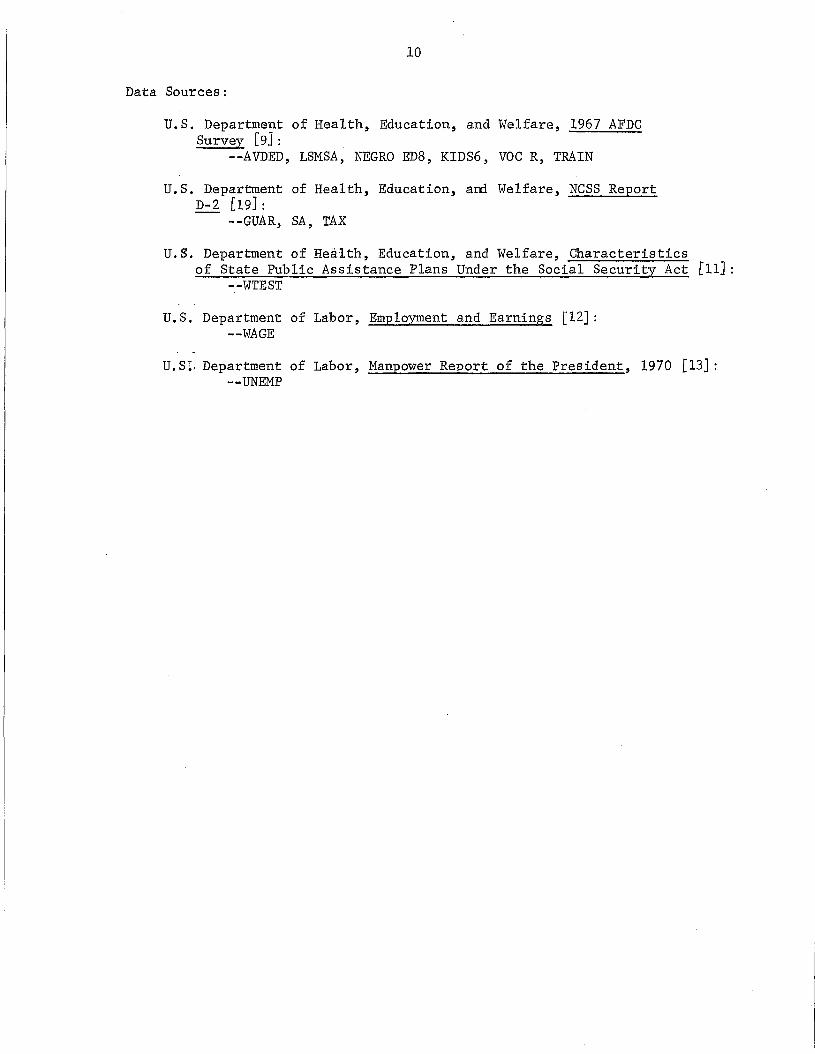
10
Data Sources:
u.S. Department of Health, Education, and Welfare, 1967 AFDCSurvey [9]:
--AVDED, LSMSA, NEGRO EDS, KIDS6, VOC R, TRAIN
u.S. Department of Health, Education, and Welfare, NCSS ReportD-2 [19]:
--GUAR, SA, TAX
u.S. Department of Health, Education, and Welfare, Characteristicsof State Public Assistance Plans Under the Social Security Act [11]:
--WTEST
u.S. Department of Labor, Employment and Earnings [12]:--WAGE
u.S:. Department of Labor, Manpower Report of the President, 1970 [13]:--UNEMP
11
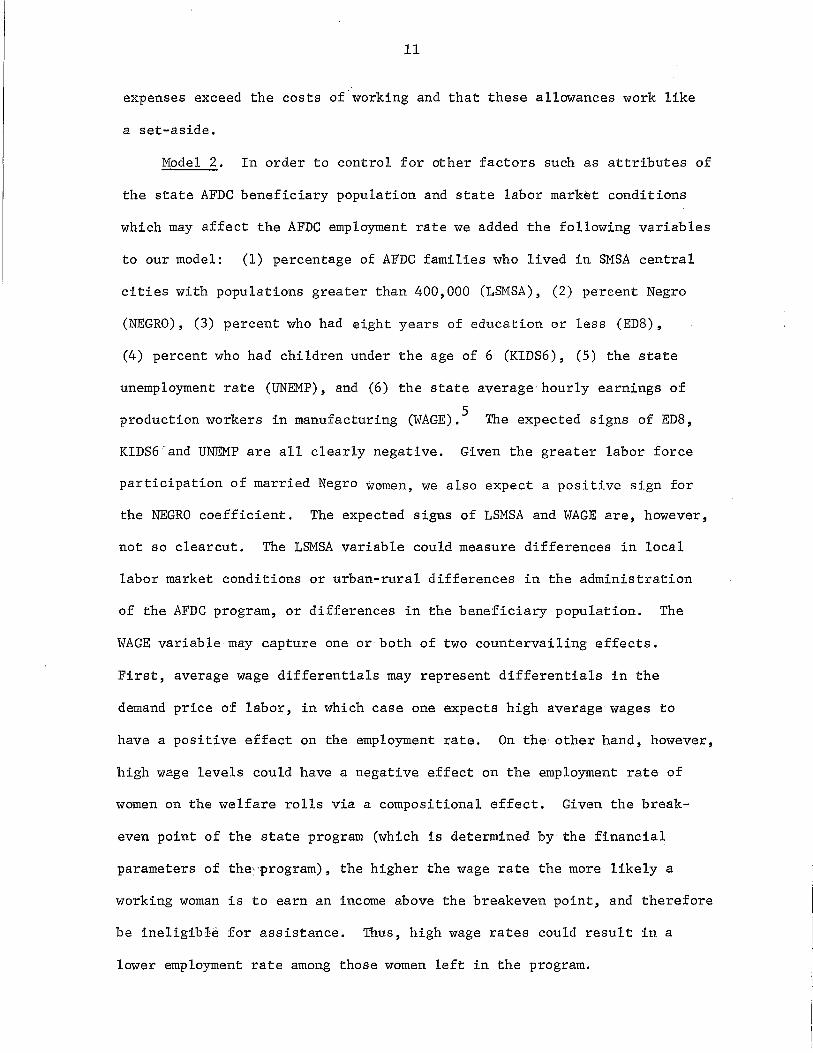
expenses exceed the costs of ,working and that these allowances work like
a set-aside.
Model 2. In order to control for other factors such as attributes of
the state AFDC beneficiary population and state labor market conditions
which may affect the AFDC employment rate we added the following variables
to our model: (1) percentage of AFDC families who lived in SMSA central
cities with populations greater than 400,000 (LSMSA), (2) percent Negro
(NEGRO), (3) percent who had eight years of education or less (ED8) ,
(4) percent who had children under the age of 6 (KIDS6), (5) the state
unemployment rate (UNEMP), and (6) the state average hourly earnings of
production workers in manufacturing (WAGE).5 The expected signs of ED8,
KIDS6-and UNEMP are all clearly negative. Given the greater labor force
participation of married Negro women, we also expect a positive sign for
the NEGRO coefficient. The expected signs of LSMSA and WAGE are, however,
not so clearcut. The LSMSA variable could measure differences in local
labor market conditions or urban-rural differences in the administration
of the AFDC program, or differences in the beneficiary population. The
WAGE variable may capture one or both of two countervailing effects.
First, average wage differentials may represent differentials in the
demand price of labor, in which case one expects high average wages to
have a positive effect on the employment rate. On the other hand, however,
high wage levels could have a negative effect on the employment rate of
women on the welfare rolls via a compositional effect. Given the break
even point of the state program (which is determined by the financial
parameters of the: program), the higher the wage rate the more likely a
working woman is to earn an income above the breakeven point, and therefore
be ineligib~e for assistance. Thus, high wage rates could result in a
lower employment rate among those women left in the program.

12
As expected the addition of these variables substantially increases
the explanatory power of the regression. The signs of ED8, KIDS6, UNEMP,
and NEGRO are also consistent with our expectations, though the first two
are not significant at the .05 level. The LSMSA coefficient is negative
and significant. The WAGE variable is negative but is the least significant
of all of our variables. This may indicate that the two opposing wage
effects discussed above cancel one another out, or it may simply indicate
that WAGE is not an adequate proxy for the wage rates available to AFDC
mothers.
More important, the addition of these variables has a noteworthy
effect on all four program policy coefficients. The coefficients of AVDED
and SA become larger and much more significant. The most dramatic changes,
however, are in the GUAR and TAX coefficients. 6 The former shrinks by
one-half while the latter doubles! All four policy coefficients are now
highly significant. The difference between the magnitude and significance
of these coefficients in Models 1 and 2 is an indication of how sensitive
the results are to a misspecification in the models. This suggests that
caution should be exercised both in the interpretation of these results
and in any further analysis of this type of data.
Model 3. In this model, three additional policy variables were
included along with the variables of Model 2. 7 These were: the percentages
of the AFDC population which had received vocational rehabilitation or work
training services in the past two years (VOC R and TRAIN, respectively) and
a dummy variable for states which had a work requirement (WTEST). While the
exact form of work requirements varied from state to state, in general they
specified that AFDC mothers must accept suitable employment if adequate
provisions for child care could be arranged.8
___~__J

13
As indicated in Table 1, of these three variables only vac R had a
significant effect on the employment rate in Model 4. The coefficient
of TRAIN is not only insignificant, but is also of the wrong sign.
Addition of these policy variables had little effect upon the coefficients
of the four financial program parameters, with the exception of a slight
increase in the size and significance of the TAX coefficient.
A word of caution is in order with regard to the interpretation of
these results. Unlike the financial parameters of the AFDC program, the
work requirement, training, and vocational rehabilitation components are
not easily measured by the simple quantitative variables employed here.
Training and rehabilitation are themselves complex social programs whose
content and efficacy undoubtedly vary greatly from state to state.
Similarly, there is a great deal of administrative discretion in the
application of the work requirement, and its efficacy is also probably
highly variable, depending upon the selection procedures employed and the
quality of the supportive services (counseling, placement, child care, etc.)
made available. Thus, it is difficult to extrapolate these results to any
new policy proposals in these areas. All we can say is that these results
reflect the overall effects of the state-run programs as they existed in
1967.
Model 4. A final model was estimated in order to eliminate the effects
of insignificant variables on the coefficients of the policy variables of
interest. In this regression, TRAIN and WAGE were deleted from the set of
independent variables in Model 3. WTEST, though insignificant in Model 4,
was retained becaus~ there is substantial policy interest in this variable
and because its coefficient attained a marginal significance level once these
14
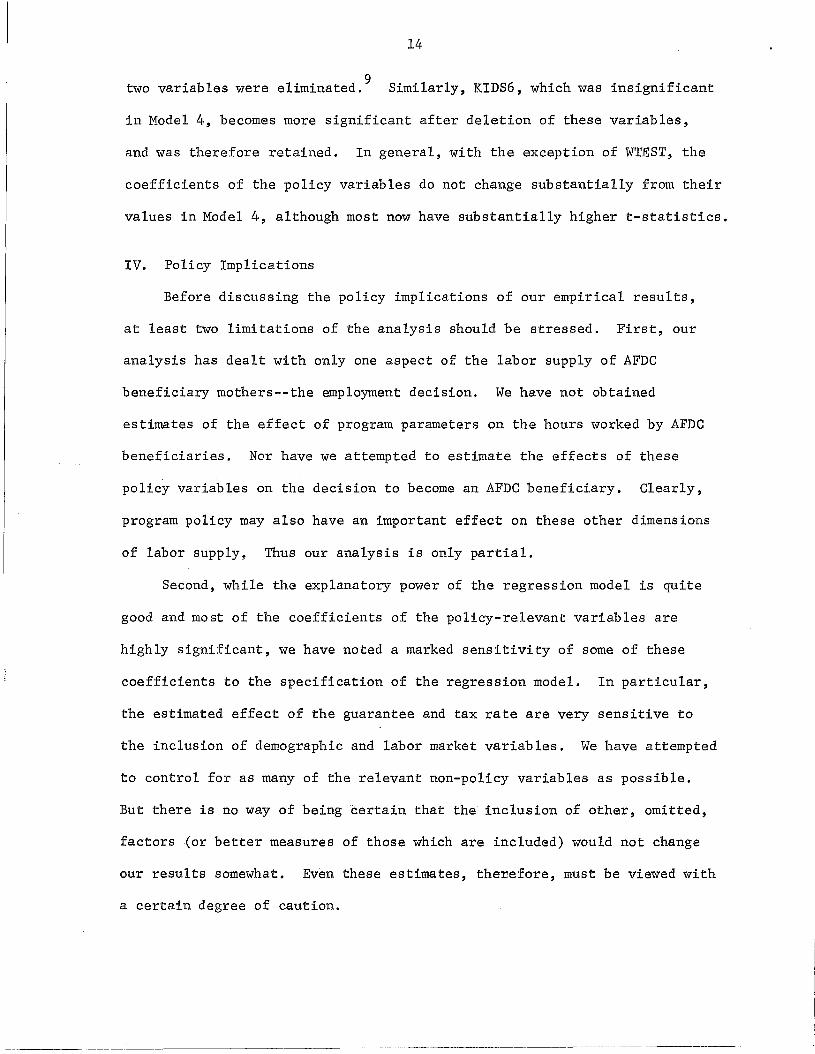
two variables were eliminated. 9 Similarly, KIDS6, which was insignificant
in Model 4, becomes more significant after deletion of these variables,
and was therefore retained. In general, with the exception of WTEST, the
coefficients of the policy variables do not change substantially from their
values in Model 4, although most now have substantially higher t-statistics.
IV. Policy Implications
Before discussing the policy implications of our empirical results,
at least two limitations of the analysis should be stressed. First, our
analysis has dealt with only one aspect of the labor supply of AFDC
beneficiary mothers--the employment decision. We have not obtained
estimates of the effect of program parameters on the hours worked by AFDC
beneficiaries. Nor have we attempted to estimate the effects of these
policy variables on the decision to become an AFDC beneficiary. Clearly,
program policy may also have an important effect on these other dimensions
of labor supply~ Thus our analysis is only partial.
Second, while the explanatory power of the regression model is quite
good and most of the coefficients of the policy-relevant variables are
highly significant, we have noted a marked sensitivity of some of these
coefficients to the specification of the regression model. In particular,
the estimated effect of the guarantee and tax rate are very sensitive to
the inclusion of demographic and labor market variables. We have attempted
to control for as many of the relevant non-policy variables as possible.
But there is no way of being certain that the inclusion of other, omitted,
factors (or better measures of those which are included) would not change
our results somewhat. Even these estimates, therefore, must be viewed with
a certain degree of caution.
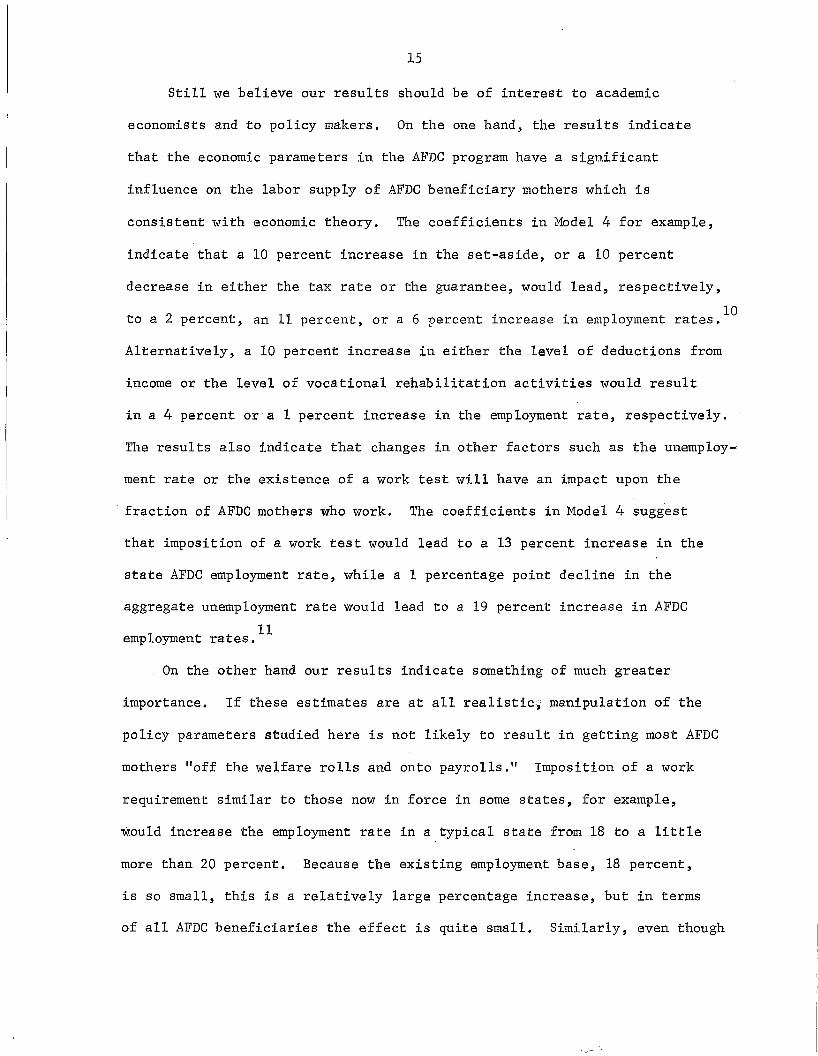
15
Still we believe our results should be of interest to academic
economists and to policy makers. On the one hand, the results indicate
that the economic parameters in the AFDC program have a significant
influence on the labor supply of AFDC beneficiary mothers which is
consistent with economic theory. The coefficients in Model 4 for example,
indicate that a 10 percent increase in the set-aside, or a 10 percent
decrease in either the tax rate or the guarantee, would lead, respectively,
to a 2 percent, an 11 percent, or a 6 percent increase in employment rates. 10
Alternatively, a 10 percent increase in either the level of deductions from
income or the level of vocational rehabilitation activities would result
in a 4 percent or a 1 percent increase in the employment rate, respectively.
The results also indicate that changes in other factors such as the unemploy
ment rate or the existence of a work test will have an impact upon the
fraction of AFDC mothers who work. The coefficients in Model 4 suggest
that imposition of a work test would lead to a 13 percent increase in the
state AFDC employment rate, while a 1 percentage point decline in the
aggregate unemployment rate would lead to a 19 percent increase in AFDC
11employment rates.
On the other hand our results indicate something of much greater
importance. If these estimates are at all realistic; manipulation of the
policy parameters studied here is not likely to result in getting most AFDC
mothers "off the welfare rolls and onto payrolls." Imposition of a work
requirement similar to those now in force in some states, for example,
would increase the employment rate in a typical state from 18 to a little
more than 20 percent. Because the existing employment base, 18 percent,
is so small, this is a relatively large percentage increase, but in terms
of all AFDC beneficiaries the effect is quite small. Similarly, even though
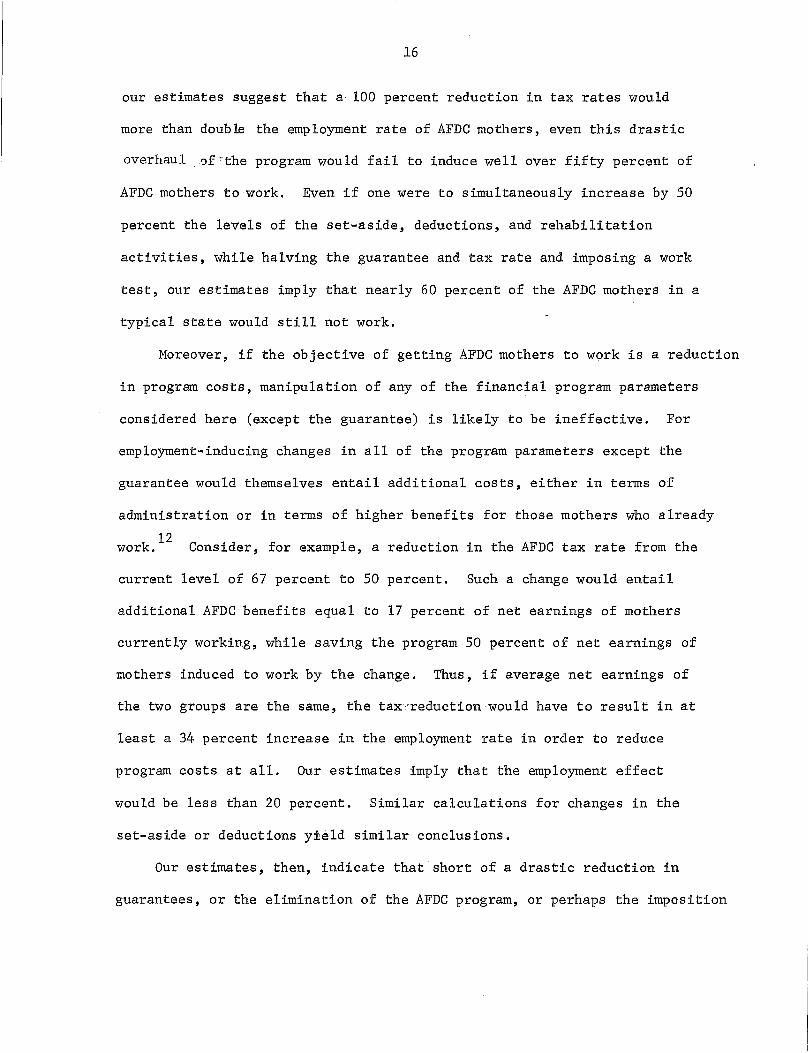
16
our estimates suggest that a 100 percent reduction in tax rates would
more than double the employment rate of AFDC mothers, even this drastic
overhaul 0f,the program would fail to induce well over fifty percent of
AFDC mothers to work. Even if one were to simultaneously increase by 50
percent the levels of the set-aside, deductions, and rehabilitation
activities, while halving the guarantee and tax rate and imposing a work
test, our estimates imply that nearly 60 percent of the AFDC mothers in a
typical state would still not work.
Moreover, if the objective of getting AFDC mothers to work is a reduction
in program costs, manipulation of any of the financial program parameters
considered here (except the guarantee) is likely to be ineffective. For
employment-inducing changes in all of the program parameters except the
guarantee would themselves entail additional costs, either in terms of
administration or in terms of higher benefits for those mothers who already
12work. Consider, for example, a reduction in the AFDC tax rate from the
current level of 67 percent to 50 percent. Such a change would entail
additional AFDC benefits equal to 17 percent of net earnings of mothers
currently working, while saving the program 50 percent of net earnings of
mothers induced to work by the change. Thus, if average net earnings of
the two groups are the same, the tax reduction would have to result in at
least a 34 percent increase in the employment rate in order to reduce
program costs at all. Our estimates imply that the employment effect
would be less than 20 percent. Similar calculations for changes in the
set-aside or deductions y±eld similar conclusions.
Our estimates, then, indicate that short of a drastic reduction in
guarantees, or the elimination of the AFDC program, or perhaps the imposition

17
and successful enforcement of a radically different kind of work test
( th t 1 b d .. f h . f· d) 13e. g., • a emp oyment e a con l.tl.on or t e recel.pt 0 al. , we are
unlikely to either voluntarily induce the vast majority of AFDC mothers
to go to work or to effect any reductions in program cost. If we provide
the financial security to enable deserted, divorced,and unwed mothers the
opportunity to devote most of their time and energy to rearing their
children, most of them will do precisely that.
19
NOTES
lThe following excerpt from the Report of the House Ways and MeansCommittee on the 1967 Amendments [8] is very revealing of the motivationfor this legislation:
"Your connnittee is very deeply concerned that a largenumber of (AFDC) families have not achieved independenceand self-support, and is very greatly concerned over therapidly increasing costs to the taxpayers. Moreover, yourconnnittee is aware that growth in this program has receivedincreasingly critical public attention."
2The two -most notab Ie exceptions are a series of studies [2, 3, 4 and 7]analyzing state General Assistance Program (GAP) beneficiary rates as a functionof average GAP payments in the state and Hausman's [6] study of the laborsupply of AFDC beneficiary mothers. The studies relating average GAP benefitlevels to GAP beneficiary rates cannot by themselves provide reliable estimatesof the effect of benefit levels on labor supply. For ceteris paribus, thehigher the benefit level, the larger the proportion of a state's populationthat will be eligible for general assistance payments. Thus GAP benefit levelsand beneficiary rates will be positively correlated even if benefit levels haveno effect on the labor supply decisions of potential beneficiaries. While thedata base and methodology of Hausman's study is much closer to ours, therestriction of his sample to three states, Alabama, Mississippi, and Kentucky,severely limits the variation in program features represented and the degreeto which his results can be generalized to the rest of the AFDC population.For a collection of the most recent studies on the labor supply of able-bodiedmales, see [5].
3There are two other available measures of labor supply which unfortunatelyare not very useful. They are: (1) average earnings of mothers who worked(AEW) and (2) average earnings of all mothers (AE). The higher the guaranteeand set-as ide, and the lower the ·:tax rate, the higher will be the break-evenlevel of income in a state. And, the higher the breakeven level of income,the more a working mother can earn and still be eligible for .AFDC benefits.If either AEW or AE is the dependent variable, this compositional effect willimpart a positive bias to the guarantee and set-aside coefficients and anegative bias to the tax rate coefficients. In addition, since there is apositive correlation between state guarantees and state wage levels, to theextent that we do not adequately control, for inter-state differences in wagerates of AFDC mothers, the positive bias in the guarantee coefficient will bereinforced. In fact, we found that the biases were so strong that the guaranteecoefficient was actually significantly positive in the AEW regressions. Notsurprinsingly, since AE is simply the product of AEW and the employment rate,the guarantee coefficient in the AE regressions was not significantly differentfrom zero.

20
4Guarantees and maximum payments in all states were adjusted forfamily size. Here we shall use the values for a family of four as anindex of the entire family size-adjusted transfer schedule.
Sather demographic variables which were tried, but rejected asinsignificant included: a set of regional dummies, the average age ofAFDC mothers, and the percentages of AFDC families who were Indian, wereLatin American, lived on farms, or lived in SMSA central cities of lessthan 400,000 population.
6Experimentation with the independent variables indicated that UNEMPwas most responsible for the changes in the GUAR and TAX coefficients.
7An additional policy variable which was tried, but dropped asinsignificant, was the proportion of new applications for assistance whichwere denied for non-financial reasons. This was constructed as a measureof administrative stringency in the. state, on the hypothesis that morestringent states would either screen out a higher proportion of potentiallyemployable applicants (resulting in a negative sign) or be more insistentupon beneficiaries finding employment (resulting in a positive sign). Itis possible that both of these effects are operative, and cancel one anotherout.
A further test for the type of compositional bias described in connectionwith Model 3 was also undertaken with this model. For a given wage rate,working women are more likely to be ineligible for AFDC the lower is the statebreakeven level. The breakeven level is determined by the state's guarantee,set-aside, and tax rate. If the level of the breakeven point has a significantcompositional effect on the employment rate of AFDC mothers, then the estimatedcoefficient of TAX is negatively biased and those of SA and GUAR are positivelybiased. To test for such biases, Model 3 was estimated with the addition ofa dummy variable for states with breakeven levels above the mean for all states.The breakeven dummy coefficient though positive was not significant. Nor didthe addition of the variable change the policy coefficients substantially. Thehypothesis of compositional bias in these coefficients was therefore rejected.
8The District of Columbia, unlike any other jurisdiction, had a regulationthat any woman who worked full-time or was capable of working full-time wasineligible for receipt of AFDC benefits. The extremely low employment ratein D.C. (.02) indicates that this regulation was stringently enforced. Forthis reason, D.C. was excluded from all the regressions reported here.
9If only vac R is eliminated from Model 4, the t-statistic of WTEST is1.95. It appears that both of these variables may measure the generalorientation of state AFDC officials toward encouraging employment of welfaremothers. The simple correlation between the two variables is .30.
10All percentages are based on the 1967 means of the relevant variables.
lIlt should be noted, however, that since many states already have a workrequirement (twenty states in 1967), the effect of such a national work requirement on the national AFDC employment rate would be markedly less than 13 percent.

21
12See [1] where the effect of the 1967 tax rate reductions on employmentof AFDC mothers and program costs in Michigan is estimated.
13The Senate Finance Committee has proposed just suchfor AFDC mothers with no children under six years of age.this amounts to elimination of the AFDC program for these
a work requirementIn a real sense
mothers.

23
REFERENCES
1. Gary Louis Appel, Effects of a Financial Incentive on AFDCEmployment: Michigan's Experience Between July 1969 and July1970, Institute for Interdisciplinary Studies, Minneapolis,Minnesota, March 1972.
2. Peter Albin and Bruno Stein, "The Demand for General AssistancePayments: Corrnnent," American Economic Review 57 (June 1967),575-85.
3. C.T. Brehm and T.R. Saving, "The Demand for General AssistancePayments," American Economic Review 54 (December 1964), 1002-18.
4. , "The Demand for General AssistancePayments: Reply," American Economic Rev:i:'ew 57 (June 1967), 585-88.
5. Glen Cain and Harold Watts, ed., Income Maintenance and Labor Supply:Econometric Studies, Institute for Research on Poverty MonographSeries, forthcoming.
6. Leonard J. Hausman, "The Impact of Welfare on the Work Effort ofAFDC Mothers," in The President's Corrnnission on Income MaintenancePrograms: Technical StudQes, 83-100.
7. Hirschel Kasper, "Welfare Payments and Work Incentive: SomeDeterminants of the Rates of General Assistance Payments," Journalof Human Resources 3 (Winter 1968), 86-110.
8. U.S. Congress, House Corrnnittee on Ways and Means, Social SecurityAmendments of 1967, 90th Congress, 1st Session, 1967, House Reporton H.R. 12080.
9. U.S. Department of Health, Education and Welfare, Social andRehabilitation SerVice, National Center for Social Statistics,Findings of the 1967 AFDC Study: Data by State and Census Division,NCSS Report AFDC-3 (67), Part I and II (mimeo).
10. , Old Age Assistance and Aid to FamiliesWith Dependent Children: Tables on Percent of Basic Needs Metfor Specified Types of Cases, NCSS Report D-2 (mimeo).
11. U.S. Department of Health, Education and Welfare, Social andRehabilitation SerVice, Assistance Payments Administration,Characteristics of State Public Assistance Plans Under the SocialSecurity Act, Public Assistance Report No. 50 (1967 Ed.).
-------------------------- ~-~--~
I
I
~--------------- ~)

24
12. U.S. Department of Labor, Bureau of Labor Statistics, Employmentand Earnings, States and Areas, 1939-70, (Washington, D.C.:U.S. Government Printing Office).
13. U.S. Department of Labor, Manpower Report of the President,March 1970,(Washington, D.C.: U.S. Government Printing Office):