NSF Searles Lakes v.2-5 - University of Wyominggeofaculty.uwyo.edu/heller/Temp Files/NSF Searles...
11
C-1 New intro 1/25/13 w/ Shuman & Tom Minkley – Say we have 3 hypotheses/parts of the study. 1. Reconstruct the climate over 3 m.y. via pollen, - can guarantee a result 2. Seismic work to look at fanning of dip/subsidence and tectonic development tied to age control at well. Rift basin and filling history, general stuff. Pretty much gurantee a result. 3. Test the climate response idea – as part of a multiscale analysis that includes extant data from small, Pleistocene river fed lakes of Shuman where we already have data and compare with the types of response (aggradation rate tied to climate) at Searles. Pitch this as we wish to address the question of how well the record of sediment supply, and shoreline progradation, can be used as a proxy for climate change, and over what time scales? Add a reference - {Howarth, 2012 #6416} talk about how tectonics (earthquakes of >7.6) can generate significant amount of sediment flux to lakes in New Zealand, 27% of total sed flux via landslides. 1.0 - INTRODUCTION Sedimentary basins contain the most continuous record of tectonic activity and climate change affecting the Earth’s surface. Deconvolving the sedimentary record to uniquely interpret the magnitudes and timing of these input boundary conditions is fraught with difficulties. Routing systems between sediment sources and sinks can buffer, transform, dilate and dissipate sedimentary delivery to basins, shredding any linear relationship between cause and effect {Jerolmack, 2010 #6356; Allen, 2012 #6389}. As such, uniquely interpreting climatic or tectonic history from the sedimentary record becomes difficult, especially at high resolution. Yet the fidelity of the sedimentary record sets a limit as to how well we can reconstruct past surface history.
Transcript of NSF Searles Lakes v.2-5 - University of Wyominggeofaculty.uwyo.edu/heller/Temp Files/NSF Searles...

C-1
New intro 1/25/13 w/ Shuman & Tom Minkley – Say we have 3 hypotheses/parts of the study.
1. Reconstruct the climate over 3 m.y. via pollen, - can guarantee a result 2. Seismic work to look at fanning of dip/subsidence and tectonic development tied
to age control at well. Rift basin and filling history, general stuff. Pretty much gurantee a result.
3. Test the climate response idea – as part of a multiscale analysis that includes extant data from small, Pleistocene river fed lakes of Shuman where we already have data and compare with the types of response (aggradation rate tied to climate) at Searles.
Pitch this as we wish to address the question of how well the record of sediment supply, and shoreline progradation, can be used as a proxy for climate change, and over what time scales? Add a reference - {Howarth, 2012 #6416} talk about how tectonics (earthquakes of >7.6) can generate significant amount of sediment flux to lakes in New Zealand, 27% of total sed flux via landslides. 1.0 - INTRODUCTION Sedimentary basins contain the most continuous record of tectonic activity and climate change affecting the Earth’s surface. Deconvolving the sedimentary record to uniquely interpret the magnitudes and timing of these input boundary conditions is fraught with difficulties. Routing systems between sediment sources and sinks can buffer, transform, dilate and dissipate sedimentary delivery to basins, shredding any linear relationship between cause and effect {Jerolmack, 2010 #6356; Allen, 2012 #6389}. As such, uniquely interpreting climatic or tectonic history from the sedimentary record becomes difficult, especially at high resolution. Yet the fidelity of the sedimentary record sets a limit as to how well we can reconstruct past surface history.

C-2
In recent years the influence of climate and tectonic controls on source-to-sink routing systems and resulting stratigraphy have been addressed by using small-scale, physical models in which most boundary conditions can be independently set, including sediment supply, discharge, lake level and subsidence (e.g. {Paola, 2001 #2146; Paola, 2009 #6177; Powell, 2012 #6392}}. Even these small physical models show complexities, such as lag times, hysteresis, buffering, filtering, and reduction or amplification of shoreline responses that arise due to changes in controlling parameters (e.g. {Powell, 2012 #6392;Kim, 2008 #6395;Kim, 2006 #6396} {Connell, 2012 #6391} as well as refs above). Nonetheless, experiments do provide a basis for understanding how different processes active even in simple cases interact to generate high-frequency stratigraphy. A logical next step in applying these experimental results to real-world stratigraphy, is to find small, simple natural basins where changes in boundary conditions are independently known, and a relatively high-resolution stratigraphic framework of the basin fill can be established (e.g. {Covault, 2010 #6403}. Natural basins provide added complexities not observable in experimental studies. Some of these complexities arise naturally from an increase in scale, including three-dimensional effects that provide more opportunities for interactions between the constituent basin transport systems. Natural systems also include other impacts that are hard to capture in scale models, such as complex fault arrangements, a wide variety of climatic impacts, variable sediment transport mechanisms and the role of changes in vegetation patterns. The ideal study area to begin to consider these effects is a small, bite-size, basin in a simple, but active, tectonic setting that is young enough to have excellent age control, but long-lived enough to have a sizable stratigraphic record. We suggest that Searles Valley, California, is such a basin. Available age control spanning the past 3 M.Y., subsurface control, regional understanding of Plio-Pleistocene geologic history as well as previous work demonstrating that seismic acquisition can yield high-resolution stratigraphic patterns, all suggest that a coupled paleoclimate-seismic stratigraphy study provides a means of evaluating the timing and magnitude of sedimentation to changes in climate and tectonic subsidence. The basin, is small enough – 5 orders of magnitude larger than experimental basins – to be tractable and yet large enough to incorporate a range of natural variability to evaluate experimental results as well as proposed models of sediment transfer from source to sink due to climatic and tectonic influences. The specific goals of this study are:
1) to establish the timing and geometry of sediment supply to the basin as compared to the timing and magnitude of climate change and basin subsidence history (all to be established as part of this study); and
Figure 1. Proposed relationships
between change in precipitation (dashed) and resulting change in sediment supply from catchments to basins. A. Sub-humid {Knox, 1972 #6408}. B. Arid {Bull, 1991 #260}. C. Tropical humid {Thomas, 2003 #6373} and semi-humid {Foreman, 2012 #6381}. Note that C follows the ideas of {Lane, 1955 #1005}

C-3
2) develop a long record of climate history for this area reaching back to c. 3 M.Y. (is this longer than any other record in this region?). BRYAN writes this.
2.0 – THE PROBLEM OF DECONVOLVING STRATIGRAPHY Although in some ways basin stratigraphy records nearly the entire local history of extrinsic controls (e.g. climatic and tectonic history) that impacted the Earth’s surface {Cross, 1998 #420}, it is an imperfect recording. A variety of effects can dampen or exaggerate the extrinsic controls on sedimentation. These effects include, among others, changes in sediment routing and storage between source and sink (e.g. {Armitage, 2011 #6212; Allen, 2008 #5990}, shredding of signals by the interaction of processes along the transport path (e.g. {Jerolmack, 2010 #6356}, self-organization within the depositional system {Hajek, 2012 #6380}, and relative time scales of external controls versus sediment transport {Paola, 1992 #1341; Simpson, 2012 #6375}. Furthermore these processes can interact with each other in complex ways (e.g. {Humphrey, 1995 #840; Allen, 2012 #6389}. The net effect of these controls is to make basins act as signal filters, wherein the stratigraphic record is typically offset or otherwise modified from the source input signal. The trick is to invert this record to interpret the source signal. The result is that it can be extremely difficult to make unique interpretations of extrinsic controls from the resultant stratigraphic record. In some cases, even the timing of sedimentary response to individual perturbations in extrinsic controls is unclear. The most documented example of this relates to the relative timing and magnitude of shoreline progradation in response to changes in base level (e.g. sea level). Years of debate regarding the correlation of sequence stratigraphy to sea level centered around whether the stratigraphic record tied more strongly to the magnitude versus the rate of relative sea-level change versus somewhere in between (e.g. {Angevine, 1989 #65;Pitman, 1978 #1397;Vail, 1977 #1863; Postma, 2008 #6402}. Similar debates can be found regarding the relative timing of sediment dispersal to basins
Figure 2. A. Dry lakes of SE California showing water overflow
paths during times maximum glaciation. Box outlines Searles Lake area. B. Detail of boxed area in A showing Searles Valley. C. Neogene stratigraphy of Searles Valley. Modified from Smith (2009).

C-4
as a result of climate change. Is sediment delivery most closely tied to type and magnitude of climate change {Mayer, 1984 #1137; Antinao, 2013 #6409} or to the rate of change in climate {Bull, 1991 #260; Thomas, 2003 #6373; Simpson, 2012 #6375}? Similarly the timing of sediment delivery to basins as a result of basin margin tectonism is not as simple or obvious as it once was (e.g. {Heller, 1988 #776; Heller, 1992 #782; Humphrey, 1995 #840; Jones, 2004 #2648}. One advance made from experimental work is an approach to scaling stratigraphies in different basins so they can be compared. This allows a method for looking at basin fills over a wide range of sizes and, in a sense, normalize the stratigraphic response. This involves a mass balance approach that balances volumetric sediment input against the rate of basin volume created over time (but subsidence or base level change). This χ analysis {Strong, 2002 #5500}, is a dimensionless mass extraction parameter that describes how flux lost to deposition is the integral of the net rate of deposition over a distance across a basin. This normalization approach provides a way of comparing basin filling stratigraphy over large range of sizes and subsidence geometries {Strong, 2002 #5500; Strong, 2005 #5634; Kim, 2011 #6393; Paola, 2012 #6397}. This approach provides a way of comparing basin filling geometries seen in natural basins with those observed in experimental basin studies and will be utilized in this study. [DOES THIS PARA GO IN THE METHODS SECTION?] Although experimental and theoretical models of sediment dispersal provide frameworks to evaluate stratigraphic response to extrinsic controls (references found above), there are precious few places with adequate age control, independent record of timing of external controls (e.g. climate and tectonic subsidence history) that allow these models to be evaluated in natural systems. We believe Searles Valley is such a place and propose to document the changes in sediment supply and stratigraphic style as compared to the known history of extrinsic controls. 3.0 - STUDY AREA An ideal natural system to understand the stratigraphic response to extrinsic control, that can serve as a comparison to extant experimental studies, should have the following features: a closed basin, so that all sediment delivered resides in the basin; an established chronologic framework; a known history of basin subsidence (as an indicator or tectonic processes and a measure of the rate of creation of accommodation for deposition); a relatively simple tectonic setting; a well defined catchment system (so that water flux and potential sediment delivery can be estimated; preserved geomorphic
Figure 3. Google Earth image of Searles
Valley, CA. Yellow dot is location of deep core, KM-3. Structure contour map (in feet) on top of basement based on seismic reflection, refraction and gravity data (Mabey, 1956).
C-5
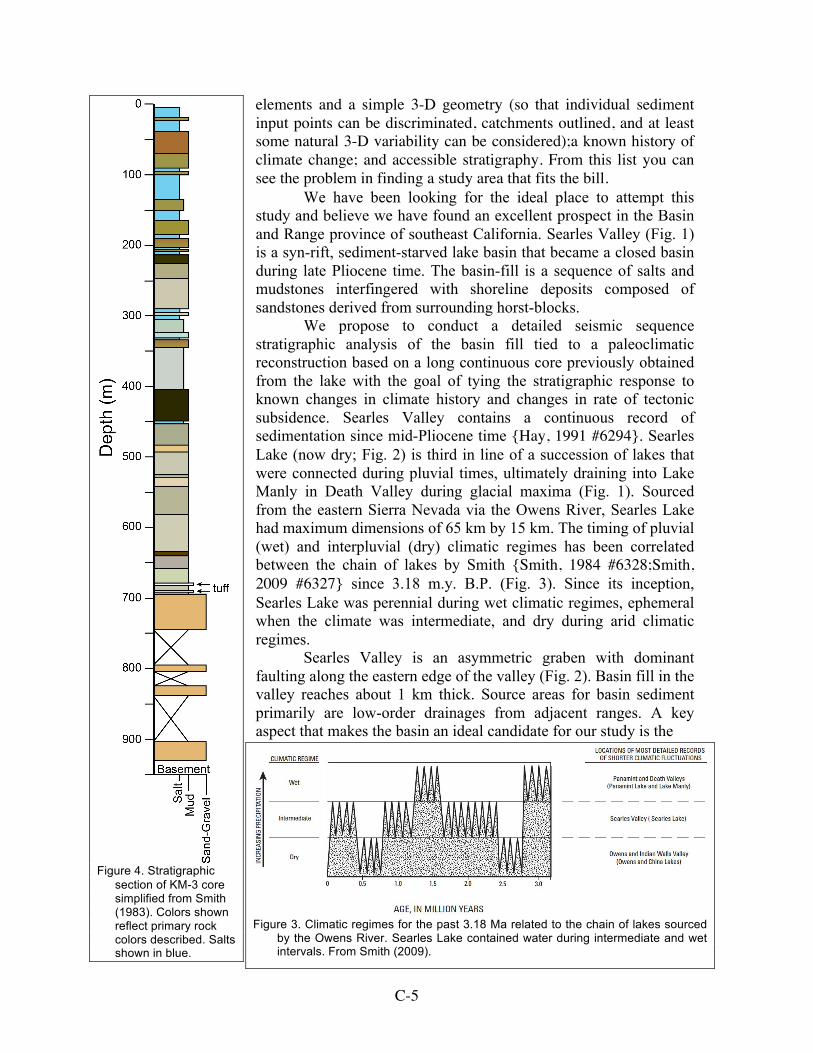
elements and a simple 3-D geometry (so that individual sediment input points can be discriminated, catchments outlined, and at least some natural 3-D variability can be considered);a known history of climate change; and accessible stratigraphy. From this list you can see the problem in finding a study area that fits the bill. We have been looking for the ideal place to attempt this study and believe we have found an excellent prospect in the Basin and Range province of southeast California. Searles Valley (Fig. 1) is a syn-rift, sediment-starved lake basin that became a closed basin during late Pliocene time. The basin-fill is a sequence of salts and mudstones interfingered with shoreline deposits composed of sandstones derived from surrounding horst-blocks. We propose to conduct a detailed seismic sequence stratigraphic analysis of the basin fill tied to a paleoclimatic reconstruction based on a long continuous core previously obtained from the lake with the goal of tying the stratigraphic response to known changes in climate history and changes in rate of tectonic subsidence. Searles Valley contains a continuous record of sedimentation since mid-Pliocene time {Hay, 1991 #6294}. Searles Lake (now dry; Fig. 2) is third in line of a succession of lakes that were connected during pluvial times, ultimately draining into Lake Manly in Death Valley during glacial maxima (Fig. 1). Sourced from the eastern Sierra Nevada via the Owens River, Searles Lake had maximum dimensions of 65 km by 15 km. The timing of pluvial (wet) and interpluvial (dry) climatic regimes has been correlated between the chain of lakes by Smith {Smith, 1984 #6328;Smith, 2009 #6327} since 3.18 m.y. B.P. (Fig. 3). Since its inception, Searles Lake was perennial during wet climatic regimes, ephemeral when the climate was intermediate, and dry during arid climatic regimes. Searles Valley is an asymmetric graben with dominant faulting along the eastern edge of the valley (Fig. 2). Basin fill in the valley reaches about 1 km thick. Source areas for basin sediment primarily are low-order drainages from adjacent ranges. A key aspect that makes the basin an ideal candidate for our study is the
Figure 4. Stratigraphic
section of KM-3 core simplified from Smith (1983). Colors shown reflect primary rock colors described. Salts shown in blue.
Figure 3. Climatic regimes for the past 3.18 Ma related to the chain of lakes sourced
by the Owens River. Searles Lake contained water during intermediate and wet intervals. From Smith (2009).

C-6
existence of ~40 cores, one of which (KM-3) is very long (915 m; Fig. 4), taken from the lake surface in 1968 by Kerr-McGee Corporation. This core has been much studied (e.g. {Smith, 1983 #6325}) and provides abundant proxy evidence through lithofacies and clay mineralogy of climate changes throughout deposition. These cores are presently housed at the U.S. Geological Survey and are available for further study and analysis. The core indicates that the lake formed abruptly at 694 m MD (3.18 Ma) and has intermittently existed since that time (Fig. 3). Available age control from the long core includes magnetostratigraphy {Liddicoat, 1980 #6324}, as well as uranium-series {Bischoff, 1985 #6400}, C14 {Stuiver, 1979 #6401}, and K-Ar {Smith, 1983 #6325}, cosmogenic isotope {Jannick, 1991 #6331} dating (Fig. 5). Lake-level history and timing is constrained from core data as well as dated exposed shorelines {Smith, 2009 #6327}. KM-3 has been extensively sampled and analyzed for mineralogy (acid-soluble components and x-ray diffraction; {Jannick, 1991 #6331;Smith, 1983 #6325}) and clay mineralogy {Hay, 1991 #6294}. 4.0 - THIS PROPOSAL The overarching theme of this study is to produce a stratigraphic framework, utilizing seismic stratigraphy that is tied to a relatively high-resolution geochronology and paleoclimate record in order to assess the timing of sediment delivery and attendant shoreline progradation relative to changes in climate and tectonic subsidence events. These results will address two fundamental scientific questions regarding the detailed Plio-Pleistocene history of paleoclimate in this part of the world [Bryan?] and the nature and timing of coupling between climate change and sediment delivery from source to sink. These results will a) further extend our record of climate history in continental U.S (or some Bryan-esque thoughts) and b) provide a natural system. The first of its kind, that can be compared to results garnered from experimental and theoretical modeling. To this end we propose two hypotheses to be examined: 4.1 Hypothesis 1: Paleoclimate stuff (Bryan) 4.2 Hypothesis 2: climate control on sediment delivery As described in Section 2 (see references therein), there are a range of model predictions regarding the timing of sediment transfer from source to sink resulting from climate change and tectonic activity (primarily subsidence). Experimental studies indeed confirm that sediment delivery to shorelines can be significantly transformed by the sediment transfer system (e.g. {Kim, 2008 #6395;Kim, 2007 #5931;Kim, 2006 #6396;Kim, 2006 #6181}. However examples of Holocene climate change indicate that
Figure 5. Sedimentation rate from KM-3 core
based on various dating methods. Data from Jannick et al., (1991) and Liddicoat et al. (1980).

C-7
very high-frequency climate signals may propagate quickly across depositional systems {Covault, 2010 #6403}. In order to evaluate these models, we hypothesize that we will find a simple, direct relationship between accumulation rates and progradation events in the basin fill and the history of climate change. Alternatively, it may as easily turn out that the signals are offset in time, or otherwise buffered by a variety of processes, including localized storage along the sediment routing system or coupling feedbacks between the erosional and depositional parts of the system (e.g. {Humphrey, 1995 #840}. Least likely, it is possible there is complete uncoupling between the climate and depositional signals. In order to test this hypothesis, we will obtain two, long, high-resolution seismic stratigraphic cross sections in the basin (Fig. 6). These data can be used to observe reflector stacking patterns that result from aggradation, clinoform progradation, unconformities and onlap. These data provide a framework of the relative timing of depocenter migration and magnitudes of deposition. In addition, fanning of bedding dips through time (e.g Fig. 7 – seismic line) and fault offsets can be used to determine the relative timing tectonic activity and/or rotational subsidence in the basin. The key to comparing this stratigraphy to age control and the history of climate change is tying the seismic record to basin cores, in particular core KM-3 where our climate record will be established. Seismic stratigraphy will be tied to core locations by running the seismic lines through well locations. Tying the stratigraphy to the climate record provides us a way to evaluate whether and how pulses of sediment supply tie to the history of climate change. The known history of lake level changes (e.g. {Smith, 2009 #6327;Smith, 1983 #6325}) provides us with another record against which we can compare sediment volumes. The history of lake level changes in Searles Valley are not entirely in sync with the regional history of climate change due to localized tectonic effects, changes in volume of water supply and the buffering of water storage through out the ancestral Owens River system {Phillips, 2008 #6379}. While overall we expect to see clear evidence of sediment partitioning in response to lake level changes, we suspect that changes in aggradation rate due to climate change will also be preserved in the rock record. During times of relatively deep water lakes, climate should impact the amount of fine-grained sediment delivered to the basin floor {Jannick, 1991 #6331}. During shallow water times, variations in shoreline progradation should strongly vary between catchments of different size providing different volumes of
Figure 6. Map of Searles Lake showing roads, man-
made structures, location of core KM-3 and other cores (black dots), location of seismic line 4 (Fig. 7) and proposed sites for seismic lines.

C-8
sediment. Methods used for this part of the study, including seismic and paleoclimate reconstruction, are described below. 5.0 – METHODS The unique aspect of this study is the combination of a seismic stratigraphic framework to a stratigraphic record of climate change. While cores collected from the basin, and available at the U.S.G.S. allow us to evaluate lithologic character at discrete locations across the basin, especially in the upper 100 m or so, our goal is gather a more complete stratigraphic architecture which can only be completed by seismic surveys across the entire basin floor. Here we will concentrate on methods used in the paleoclimate and seismic surveys. 5.1 Paleoclimate Reconstruction - Bryan In this study we will develop a proxy history of climate change by analyzing the KM-3 core (Fig. 4) taken from near the center of Searles Lake (Fig. 2; Smith et al., 1983). The core is residing at the U.S.G.S. core facility in Lakewood, Colorado. Our primary method of reconstructing climate will come from analysis of pollen collected from the core. This work will be coupled with other proxy indicators of climate including clay mineralogy. We have used this approach in the past for a variety of Quaternary lacustrine sequences across the U.S. (e.g. (Williams and Shuman, 2008; Shuman, 2012). Appropriate calibration data exists to tie pollen types to climate (Whitmore et al., 2005; Williams and Shuman, 2008). Pollen processing will use standard techniques (Faegri et al., 1989). All of the lithologies present in the core should be suitable for pollen preservation. 5.2 Seismic Reflection Survey - Steve Secondly, we will conduct two seismic reflection surveys across Searles Lake (Fig. 6). Limited seismic reflection lines made available to us from the land owner (Searles Valley Minerals), demonstrate the suitablity of the basin fill to imaging and stratigraphic analysis (Fig. 7). These lines, while encouraging that a continuous, suitable record can be acquired, are of insufficient detail and coverage to be of much use for the scale of question we are trying to answer. Unfortunately these are only paper copies, the original data for these surveys is long gone as is any information on acquisition parameters. Thus we are unable to reprocess the data for detailed interpretations needed to tie to the climate record provided by the cores. These extant lines suggest that no major faulting disrupts the basin fill at least along the western half of the basin, and can be used to reconstruct periods of major tilting of the basin floor. To provide a higher resolution imaging of the fine structure of basin fill in the upper part of the stratigraphic sequence, seismic lines will be shot along extant roads which criss-cross the lake surface and surrounding lake margin. Linear roads composed of compact materials have been built between evaporation ponds used to extract trona from brines derived from solution mining from beneath the lake surface (Fig. 6). In this first phase of our study of Searles Lake, we will acquire seismic data along two orthogonal lines across the lake. One line will run past the site of the KM-3 core, so that seismic reflectors can be tied back to known stratigraphy.

C-9
To conduct the seismic work, we will use a mix of rented and borrowed equipment from commercial sources and the PASSCAL/IRIS instrumentation center. We will test two different seismic sources: a mini-Vibrator, and the PEG-40Kg Thumper automated Propelled Energy Generator source. The PEG-40Kg is an accelerated-weight-drop source, with a large metal plate that strikes the ground, propelled by an elastodynamic band. The unit is lightweight and portable; it can be deployed from the back of a pickup truck. We can borrow this source at little cost from PASSCAL. The mini-vibrator will have to be commercially rented, but will likely have greater penetration depths. We will test both sources early in the acquisition, in order to determine the signal penetration and frequency content of each source. As receivers, we will also test two different systems: (1) four 24-channel Geode arrays, with 5-m takeouts, for a maximum source-receiver offset of 480 m, to enable deep imaging, and (2) a "land streamer" that will enable quicker (roll-along) acquisition aimed at shallower (~200 m), high-resolution imaging. We propose two different field acquisition campaigns: a short (~1-week) campaign early in the project, to determine the best configuration of source/receiver geometries to optimize imaging in the Searles Lake environment, and a second, dedicated campaign (~3 weeks) to conduct the full acquisition plan with the selected equipment. The key to correlating the seismic stratigraphy to the history of climate change that a seismic survey will be tied to the KM-3 core site in the field. In addition, seismic velocities will be determined from samples available from the core. Once the seismic framework is interpreted, the position of major sequence boundaries and regressive
Figure 7. A. Seismic line 4 (Fig. 6) with contrast enhancement in order to reduce noise. [Steve caption]. B.
detail from Seismic line 762 highlighting apparent prograding clinoforms.

C-10
shoreline intervals will be correlated back to their position in the KM-3 core. The KM-3 core provides the climate proxy record that will be tied to the position and timing of these events. Available seismic lines collected at Searles Lake during 1989-1990, and made available to us by Searles Valley Minerals, are of relatively poor quality as they were not fully processed. Unfortunately, original data tapes form these surveys are lost and so cannot be reprocessed, necesitating this study. However, the lines are of good enough quality to show that reflectors are visible across the basin (e.g. Fig. 7). It is tempting to try to interpret subtle features on these lines, such as prograding clinoforms, unconformities and onlap, but the quality of the data is too poor to have any confidence in such interpretations. Correlation of seismic record to core will be done by using seismic properties of the rocks in the core? Do we propose to piggy back and down hole VSP on one of the Trona companies holes? 6.0 – Expected Results HERE we need to make the last, best pitch as to why this work is important and transformative. 7.0 – Responsibilities, Work Schedule and Expected Results The project will be done over a 2 year period (3 yr?) Year one begin the paleoclimate work and collect a limited seismic line to see what collection parameters are best for imaging. Collect seismic Yr. 2. Interpretation finished during year 2-3. Responsibility: Shuman – paleoclimate, Holbrook – seismic, Heller – basin modeling and developing stratigraphic framework. Two grad students? One focused on paleoclimate and one on seismic. NEED a statement on data repository! 8.0 – Broader Impact The primary impacts of this study are three fold. First, the study will be used to support two Ph.D. students at the University of Wyoming. One student will focus on the long-term climate history utilizing the cores from Searles Valley and be primarily directed by Dr. Shuman. The second student will be responsible for processing and interpreting the seismic stratigraphy of the basin fill. This student will work under the direction of Drs. Heller and Holbrook. In addition, at least one undergraduate student will be funded to assist in the acquisition and aspects of interpretation of the seismic data. Secondly, the results of the study have a direct bearing on controls of the distribution of of trona, an important source of sodium carbonate in the United States. Trona is a widely used ore in the manufacture of glass, baking soda, paper, various chemicals and is used in water treatment processes. Searles Valley is one of the three main areas of trona mining in the U.S. Lastly, we will develop a short, narrated educational PowerPoint presentation on how long-term climate reconstructions are done to include as part of a video display in our recently refurbished Geological Museum on the University of Wyoming campus. The video, lastly 5 to 10 minutes, will be geared towards students in secondary school through

C-11
college. The Geological Museum is just completing a $1 million dollar renovation. As part this work, a interactive computer display is being installed that will feature highlights of departmental research wherein the visitor can view which program to be watched. Our presentation will be used to explain the science behind climate reconstruction using paleobotanical and geochemical proxies. The museum is a campus public outreach facility and a major attraction for school groups from across the state.