NSERC/Manitoba Hydro Alternative Energy...
79
NSERC/Manitoba Hydro NSERC/Manitoba Hydro Alternative Energy Chair Alternative Energy Chair CENTRE FEST June 9, 2006, Assiniboine Park, Winnipeg Manitoba Dr. Eric Bibeau Dr. Eric Bibeau Mechanical & Manufacturing Engineering Dept Mechanical & Manufacturing Engineering Dept Manitoba Hydro/NSERC Alternative Energy Chair Manitoba Hydro/NSERC Alternative Energy Chair
Transcript of NSERC/Manitoba Hydro Alternative Energy...
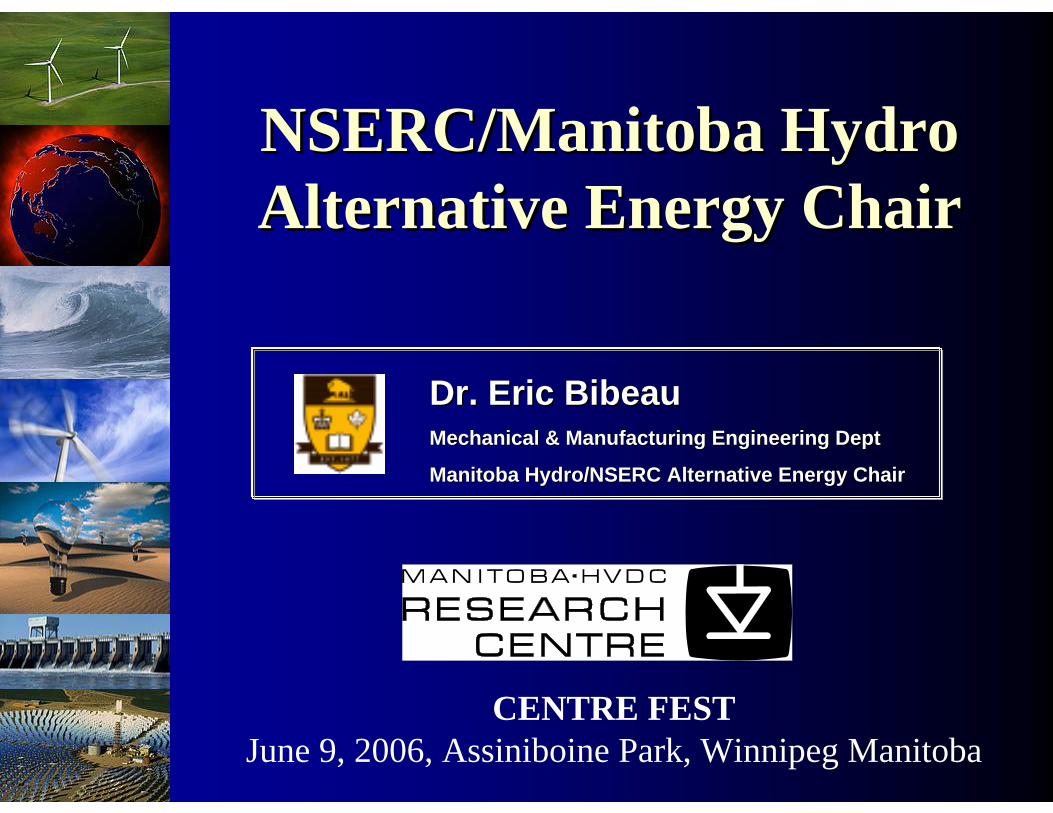
NSERC/Manitoba Hydro NSERC/Manitoba Hydro Alternative Energy ChairAlternative Energy Chair
CENTRE FEST June 9, 2006, Assiniboine Park, Winnipeg Manitoba
Dr. Eric BibeauDr. Eric BibeauMechanical & Manufacturing Engineering DeptMechanical & Manufacturing Engineering Dept
Manitoba Hydro/NSERC Alternative Energy Chair Manitoba Hydro/NSERC Alternative Energy Chair
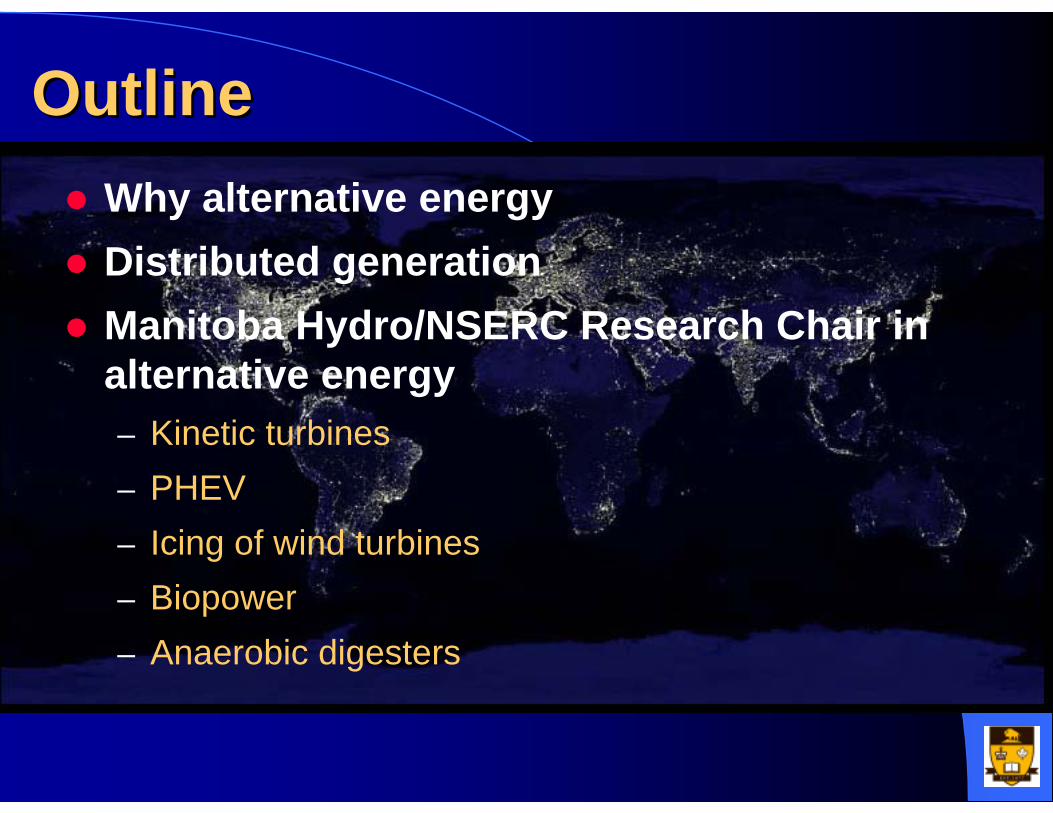
OutlineOutlineWhy alternative energyDistributed generationManitoba Hydro/NSERC Research Chair in alternative energy – Kinetic turbines– PHEV– Icing of wind turbines– Biopower– Anaerobic digesters
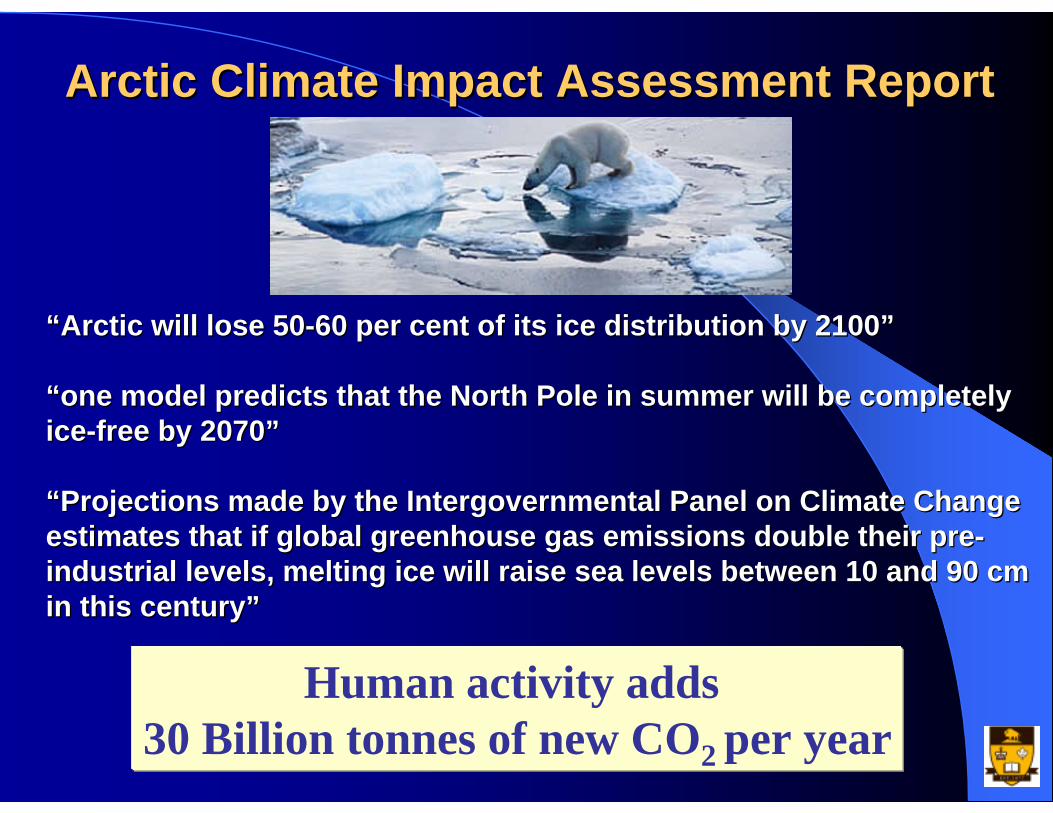
Arctic Climate Impact Assessment ReportArctic Climate Impact Assessment Report
““Arctic will lose 50Arctic will lose 50--60 per cent of its ice distribution by 2100”60 per cent of its ice distribution by 2100”
“one model predicts that the North Pole in summer will be comple“one model predicts that the North Pole in summer will be completely tely iceice--free by 2070”free by 2070”
“Projections made by the Intergovernmental Panel on Climate Chan“Projections made by the Intergovernmental Panel on Climate Change ge estimates that if global greenhouse gas emissions double their pestimates that if global greenhouse gas emissions double their prere--industrial levels, melting ice will raise sea levels between 10 industrial levels, melting ice will raise sea levels between 10 and 90 cm and 90 cm in this century”in this century”
Human activity adds 30 Billion tonnes of new CO2 per year
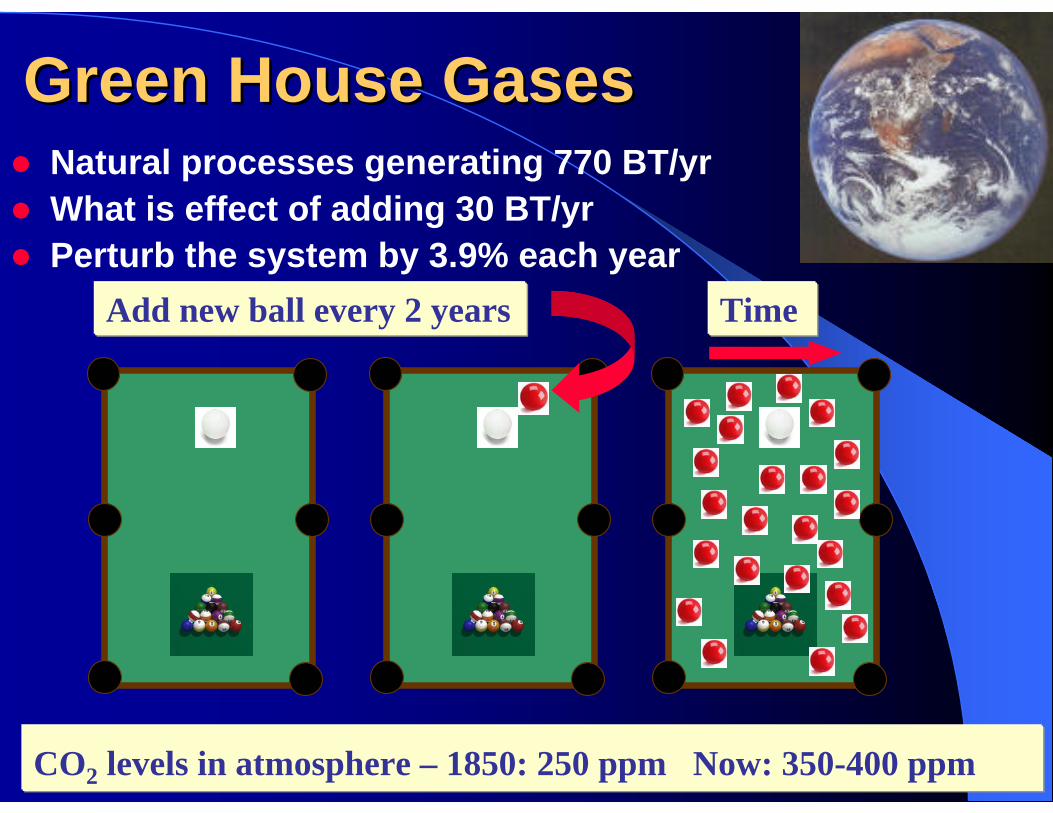
Green House GasesGreen House GasesNatural processes generating 770 BT/yr What is effect of adding 30 BT/yrPerturb the system by 3.9% each year
CO2 levels in atmosphere – 1850: 250 ppm Now: 350-400 ppm
Add new ball every 2 years Time
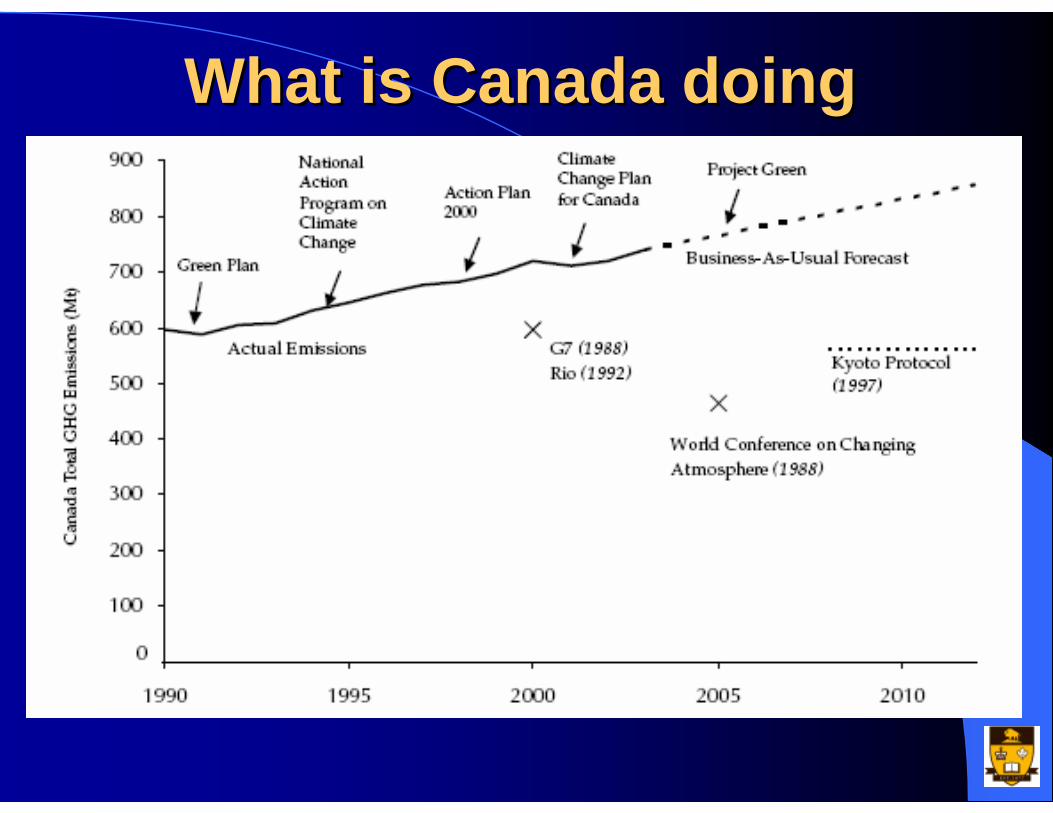
What is Canada doingWhat is Canada doing
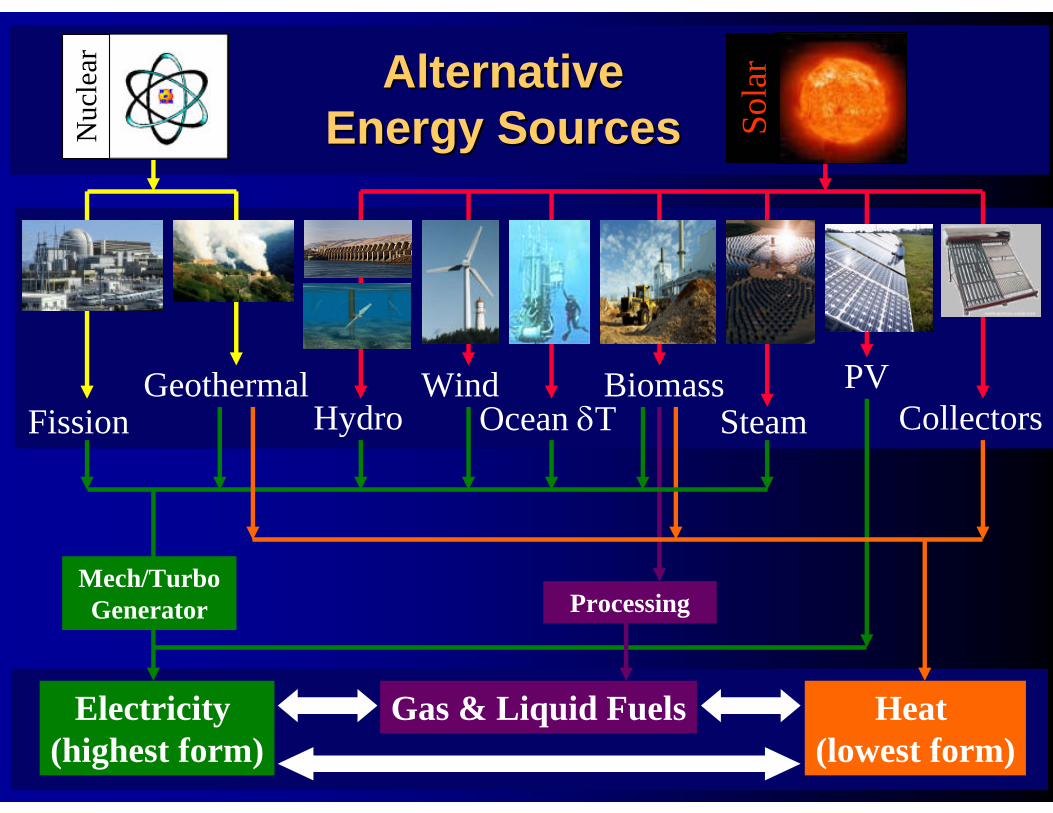
Alternative Alternative Energy SourcesEnergy Sources
Electricity (highest form)
Heat (lowest form)
Gas & Liquid Fuels
WindOcean δT
BiomassSteam
PVCollectorsHydro
GeothermalFission
Processing
Sola
r
Mech/Turbo Generator
Nuc
lear
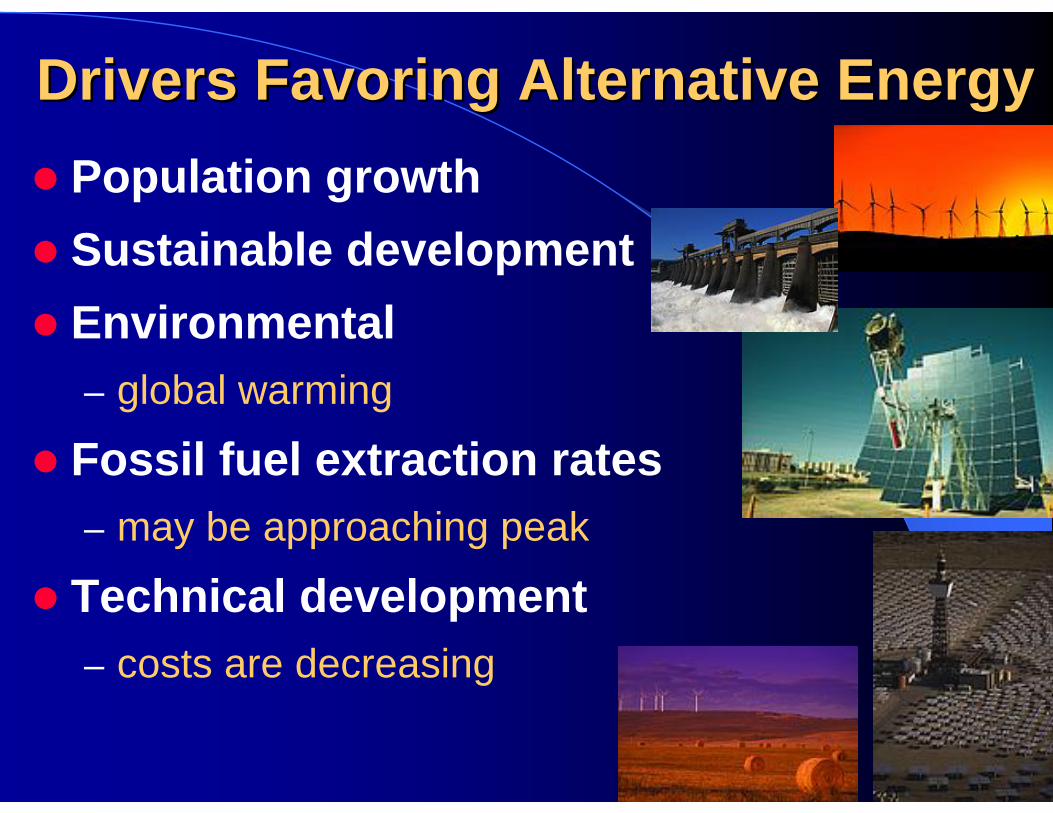
Drivers Favoring Alternative EnergyDrivers Favoring Alternative EnergyPopulation growth Sustainable developmentEnvironmental– global warming
Fossil fuel extraction rates– may be approaching peak
Technical development– costs are decreasing
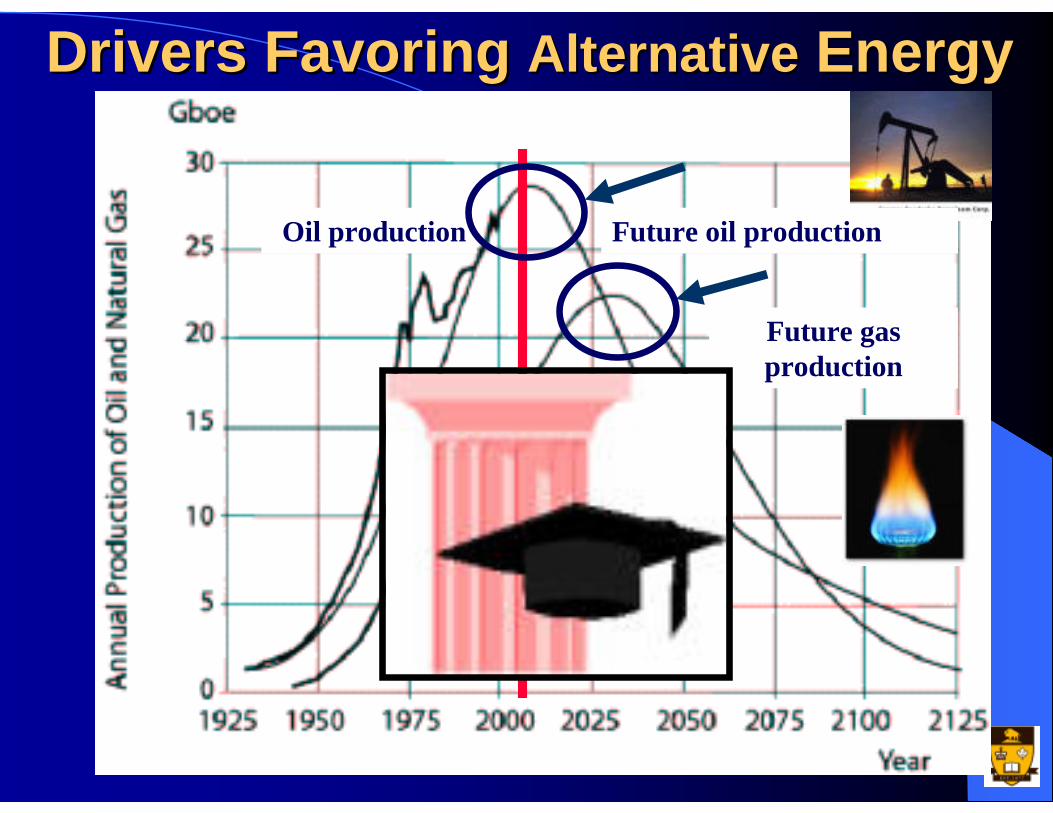
Drivers Favoring Drivers Favoring AlternativeAlternative EnergyEnergy
Future gas production
Oil production Future oil production
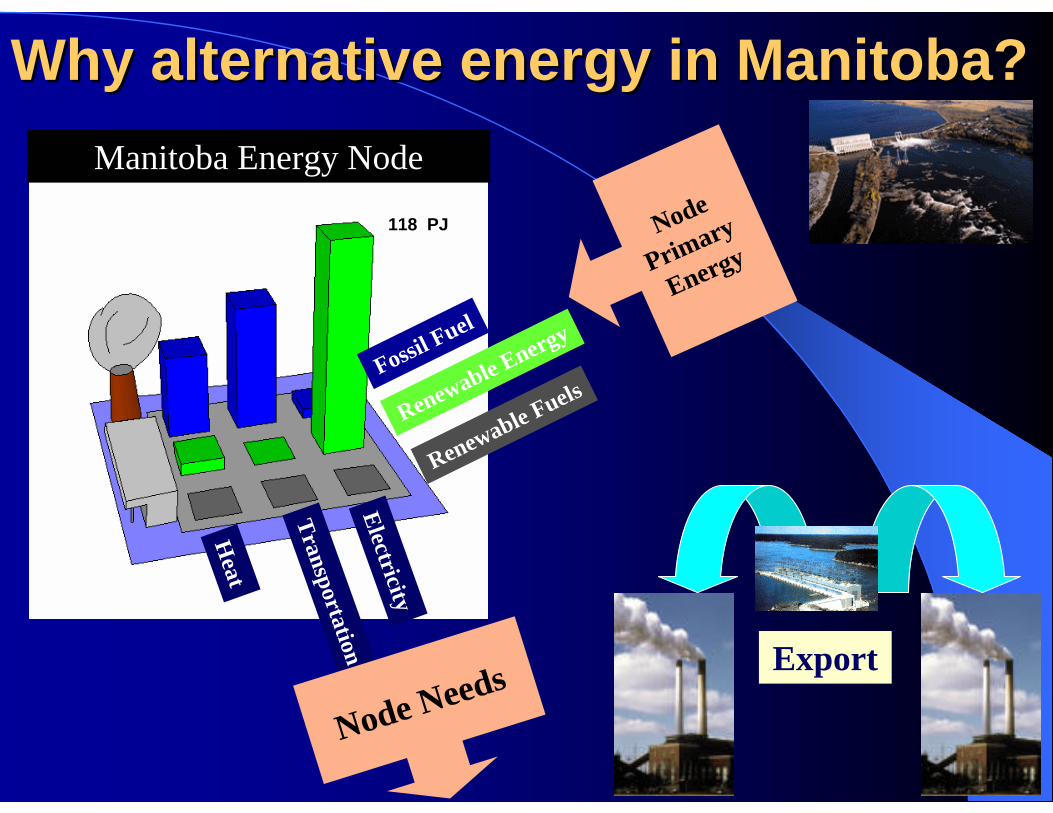
Why alternative energy in Manitoba?Why alternative energy in Manitoba?
Export
Manitoba Energy Node
Node
Primary
Energy
Fossil Fuel
Renewable Energy
Renewable Fuels
Heat
TransportationElectricity
Node Needs
118 PJ
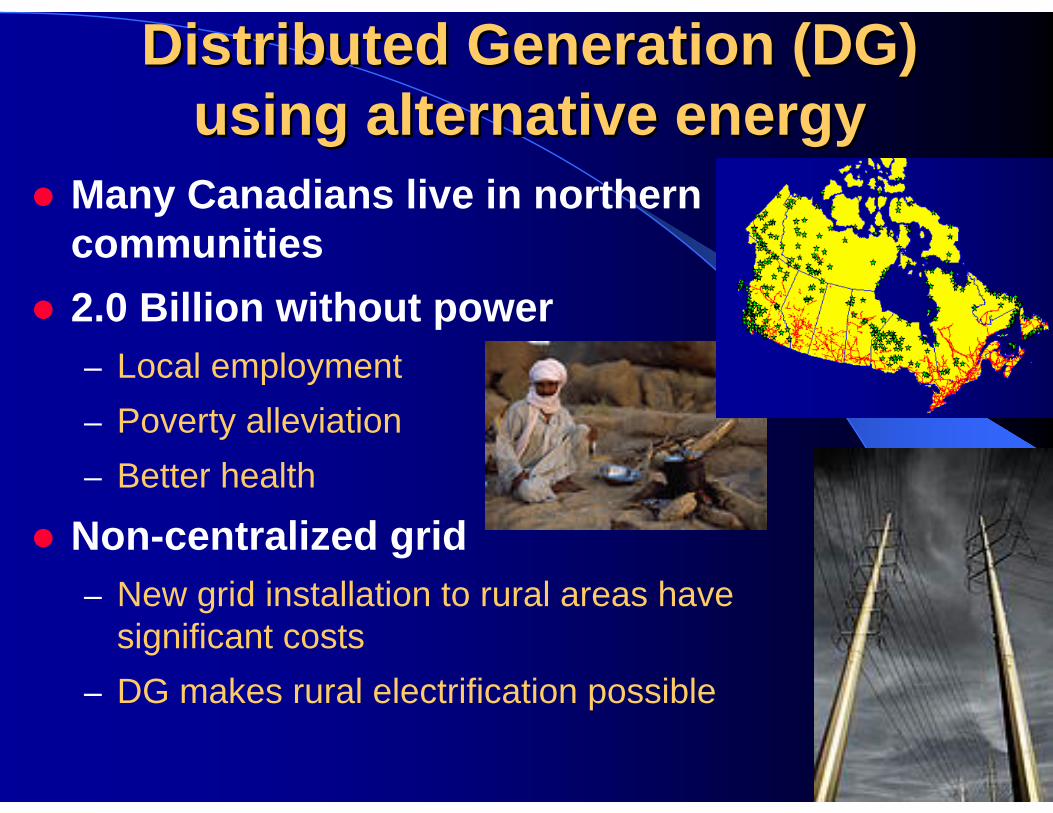
Distributed Generation (DG) Distributed Generation (DG) using alternative energyusing alternative energy
Many Canadians live in northern communities2.0 Billion without power– Local employment– Poverty alleviation– Better health
Non-centralized grid – New grid installation to rural areas have
significant costs– DG makes rural electrification possible
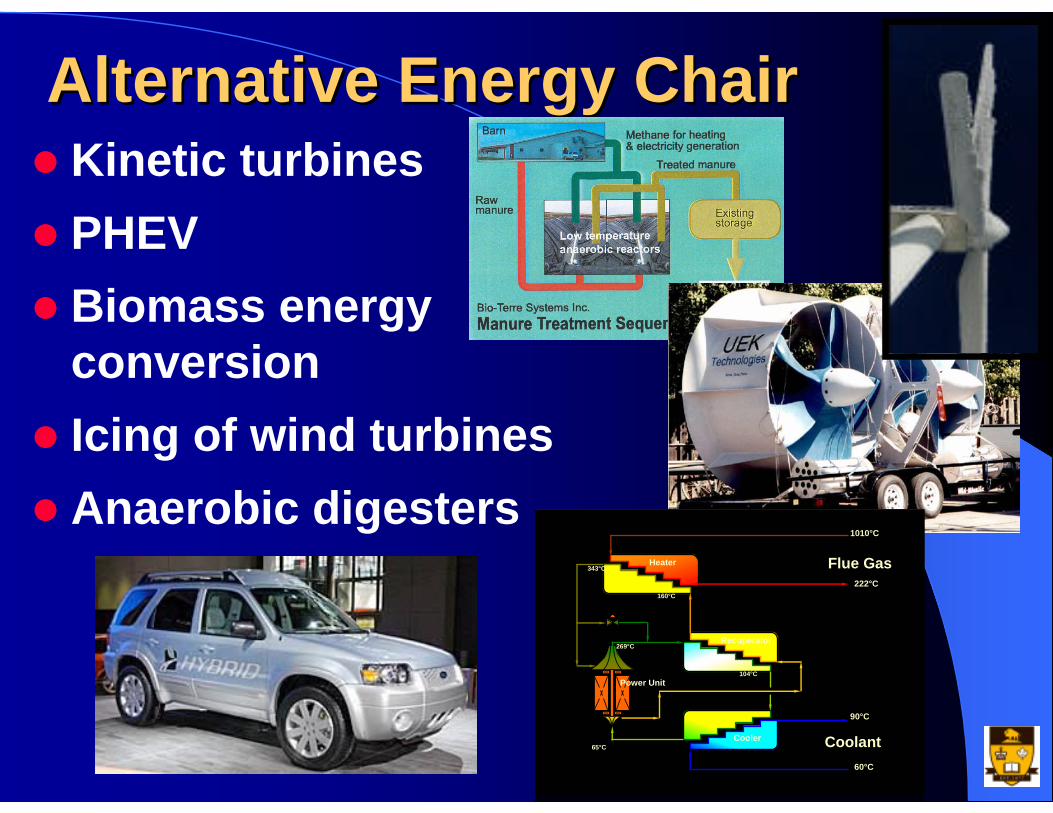
Alternative Energy ChairAlternative Energy ChairKinetic turbinesPHEVBiomass energy conversionIcing of wind turbinesAnaerobic digesters
Heater
Recuperator
Cooler
Flue Gas
Coolant
90°C
60°C
1010°C
222°C
343°C
65°C
104°C
160°C
269°C
Power Unit
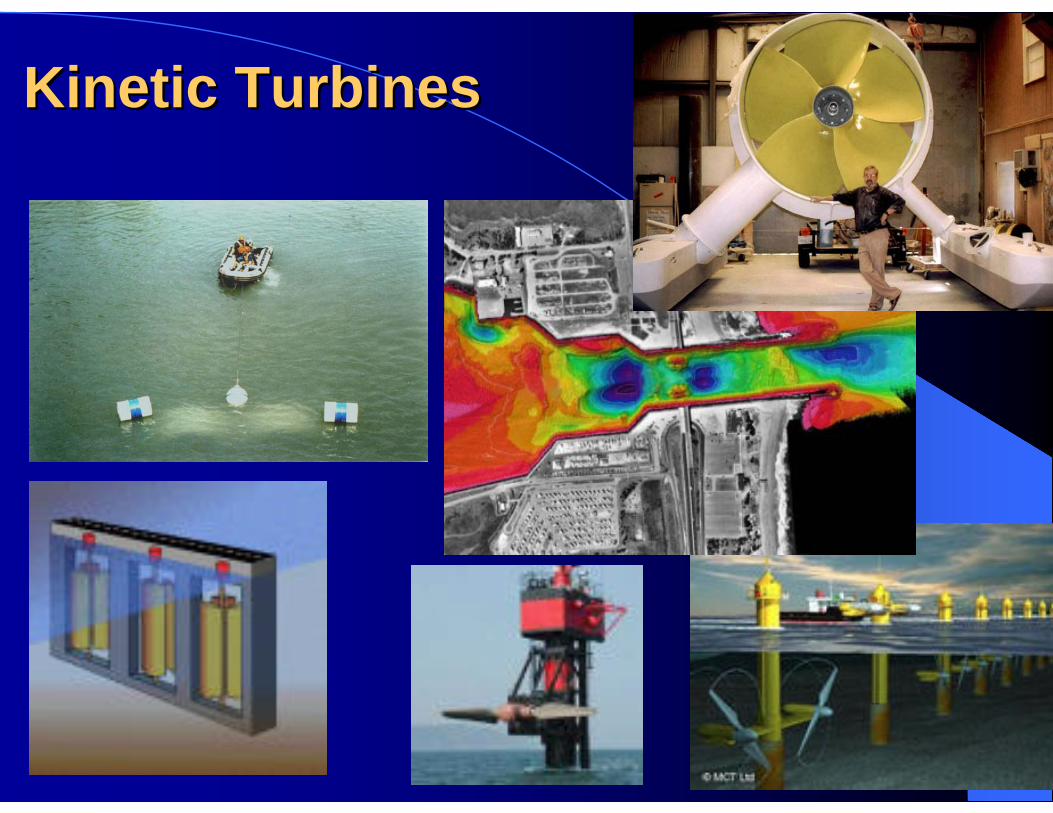
Kinetic TurbinesKinetic Turbines
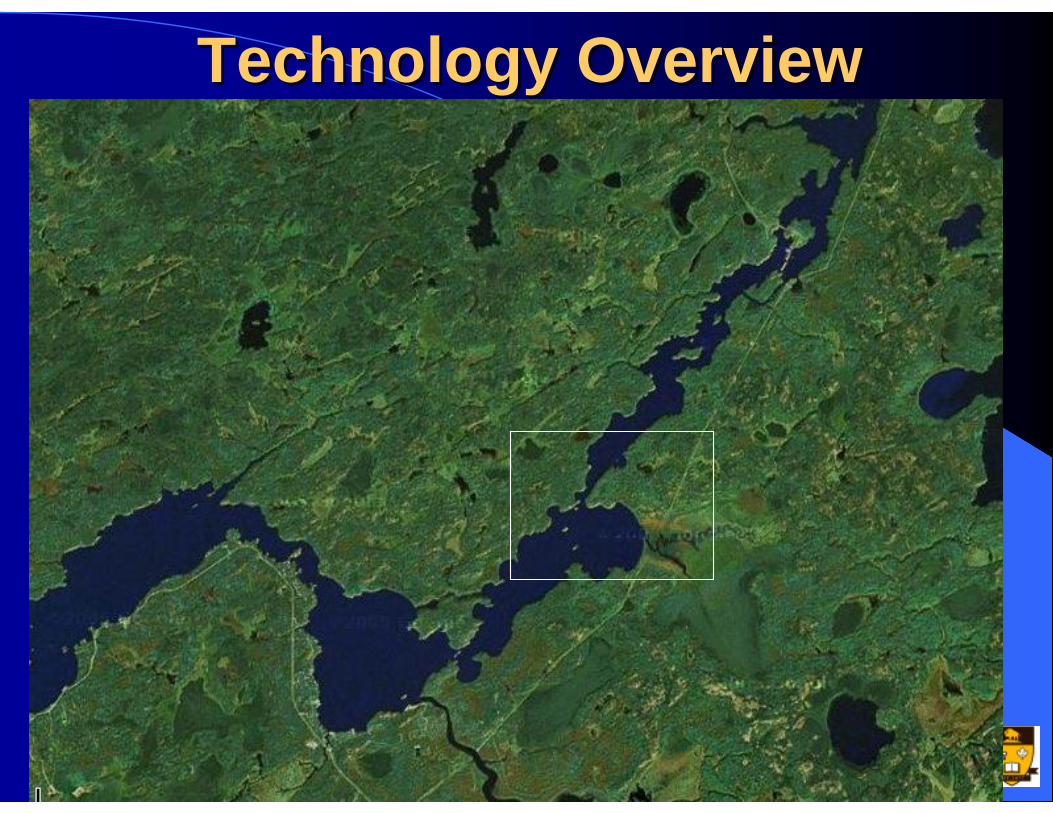
Technology OverviewTechnology Overview
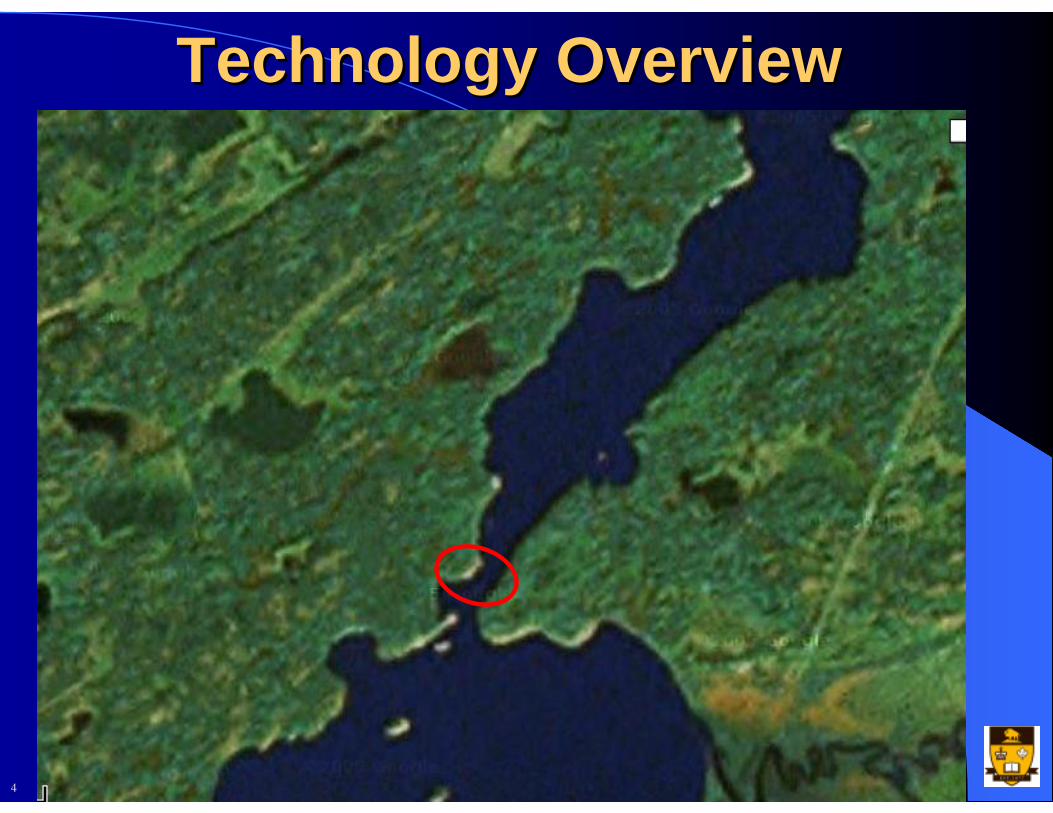
Technology OverviewTechnology Overview
4

Shroud (cut away)
Turbine, Huband Generator
Technology OverviewTechnology Overview
Anchoring System
To Power Distribution
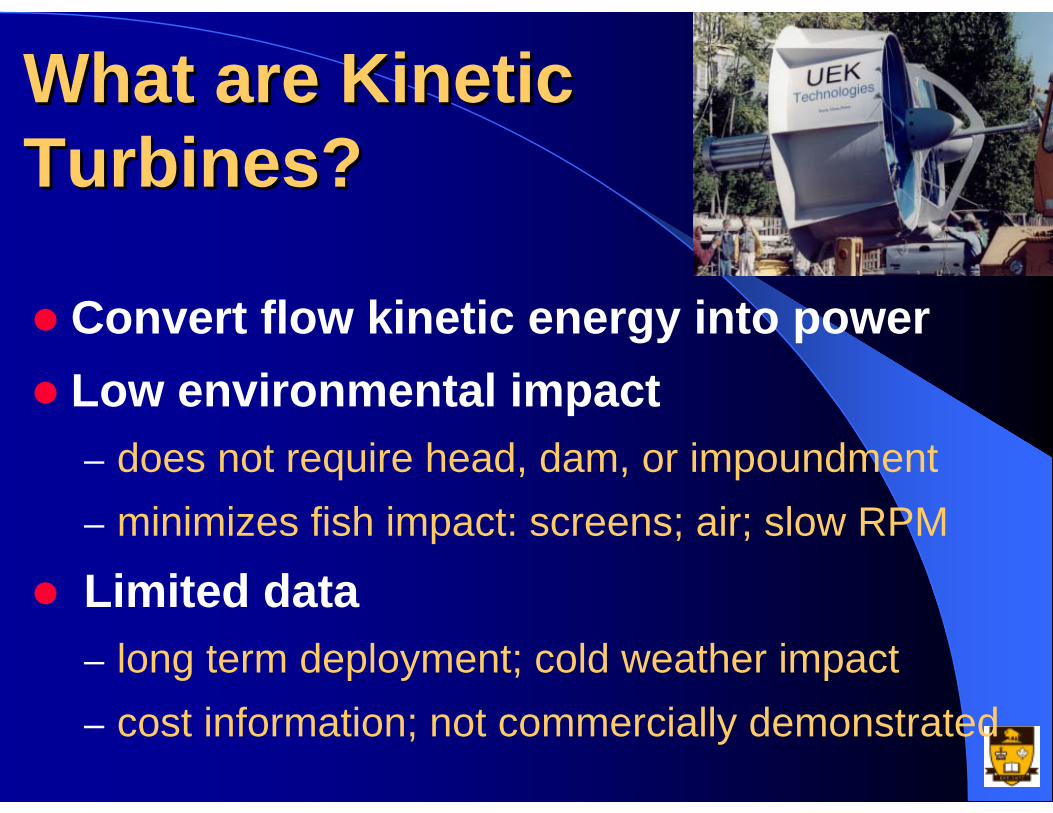
What are Kinetic What are Kinetic Turbines?Turbines?
Convert flow kinetic energy into powerLow environmental impact – does not require head, dam, or impoundment– minimizes fish impact: screens; air; slow RPM
Limited data – long term deployment; cold weather impact– cost information; not commercially demonstrated
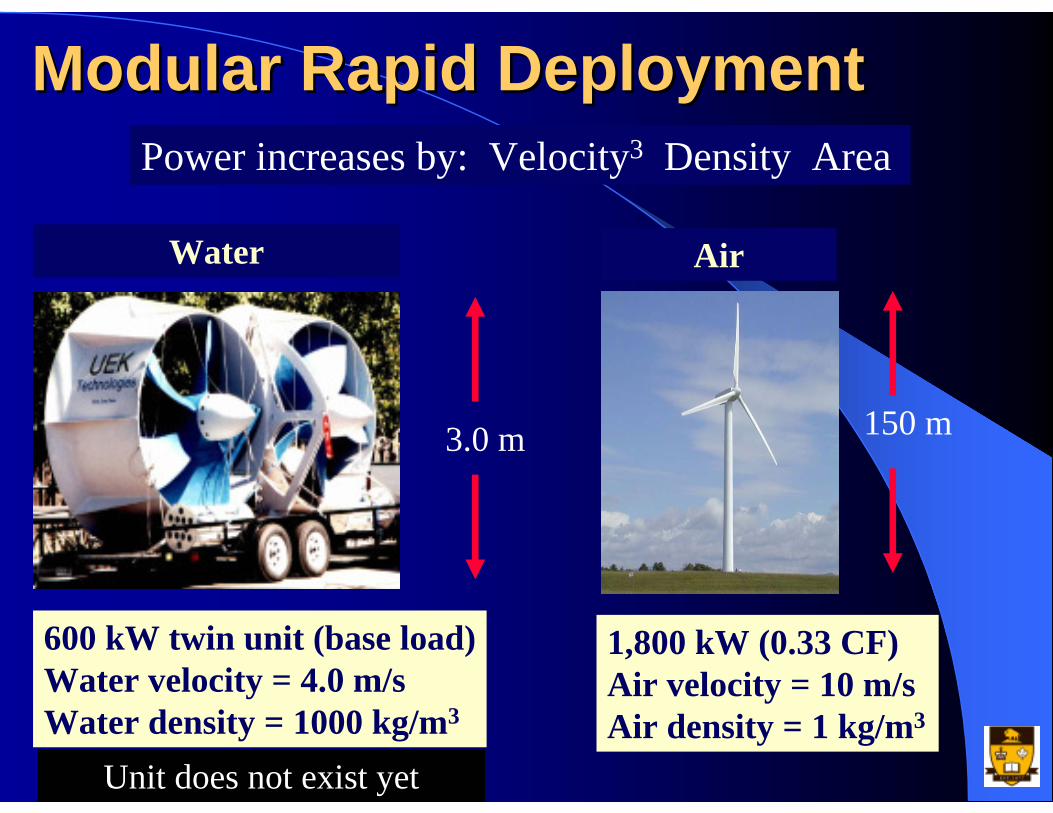
Modular Rapid DeploymentModular Rapid Deployment
600 kW twin unit (base load)Water velocity = 4.0 m/sWater density = 1000 kg/m3
1,800 kW (0.33 CF)Air velocity = 10 m/sAir density = 1 kg/m3
Water Air
150 m3.0 m
Unit does not exist yet
Power increases by: Velocity3 Density Area
Commercialization Commercialization ObjectivesObjectives
Prove year-long operationEvaluate the applicability of kinetic turbines Establish operation and cost-effectiveness in all seasonsProve kinetic turbines can– achieve high capacity factor/
high availability – deliver base load power
Commercial Testing Commercial Testing of Kinetic Turbines of Kinetic Turbines
Positive step towards SustainabilityEnvironmental breakthrough for remote communitiesNew source of renewable energy Support distributed generation industry Show DG can workConnect alternative power to grid

Why Kinetic Turbines in ManitobaWhy Kinetic Turbines in ManitobaManitoba resource– vast river system– requires flow velocities above 2.5 m/s
Renewable energy technologyRemote communities applicationFits hydro-base cultureRapid deployment and modularBase load generationLikely cost effective distributed energyEnhance and build research capacity at the University of Manitoba
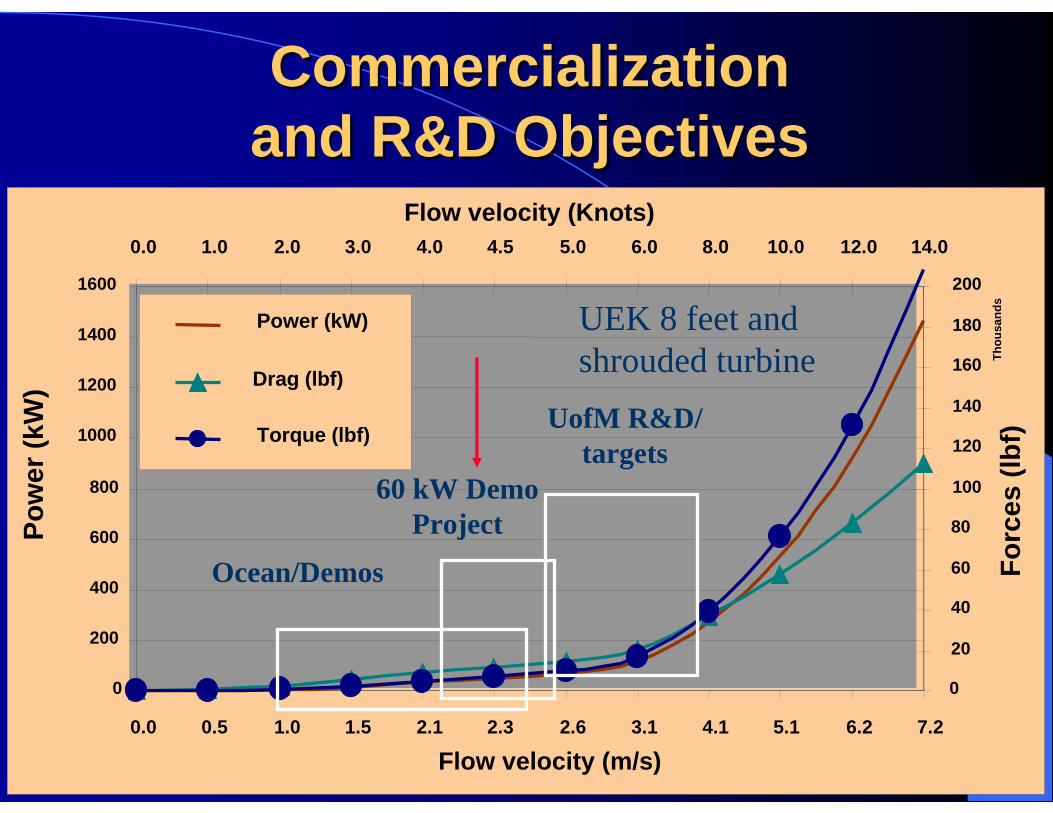
Commercialization Commercialization and R&D Objectivesand R&D Objectives
0
200
400
600
800
1000
1200
1400
1600
0.0 0.5 1.0 1.5 2.1 2.3 2.6 3.1 4.1 5.1 6.2 7.2
Flow velocity (m/s)
Pow
er (k
W)
0
20
40
60
80
100
120
140
160
180
200
0.0 1.0 2.0 3.0 4.0 4.5 5.0 6.0 8.0 10.0 12.0 14.0
Thou
sand
s
Flow velocity (Knots)
Forc
es (l
bf)
Power (kW)
Drag (lbf)
Torque (lbf)
Ocean/Demos
60 kW DemoProject
UofM R&D/targets
UEK 8 feet and shrouded turbine
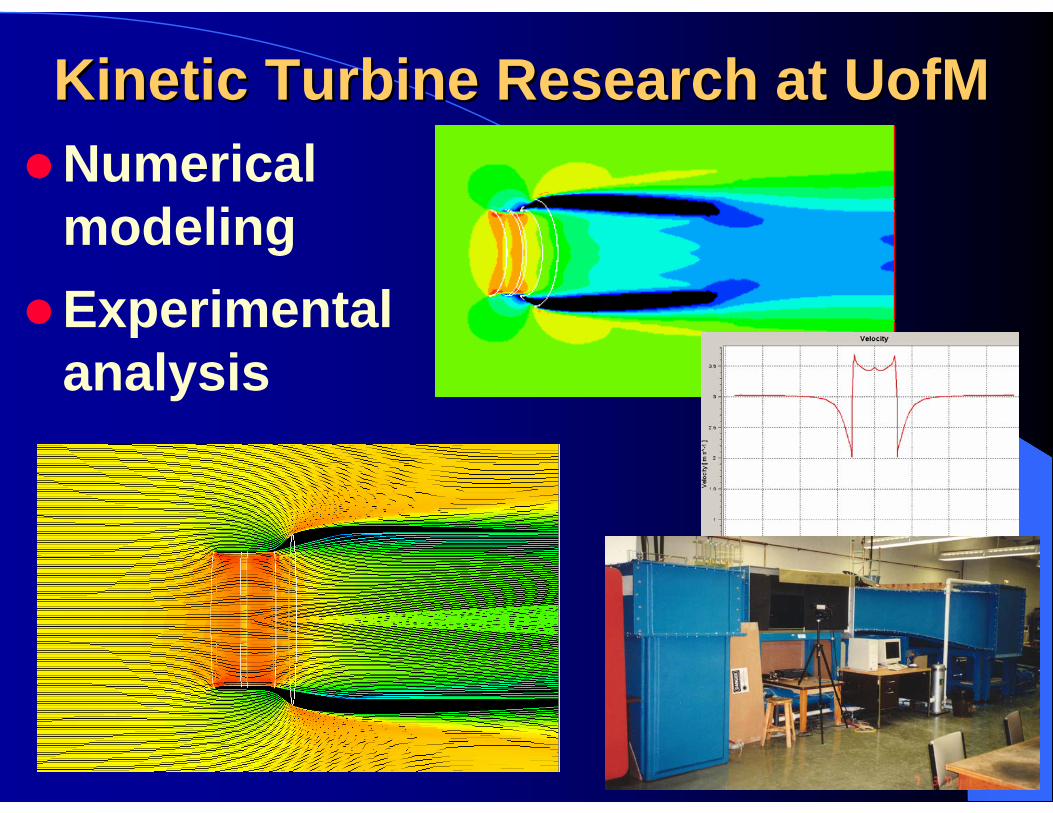
Kinetic Turbine Research at UofMKinetic Turbine Research at UofMNumerical modelingExperimental analysis
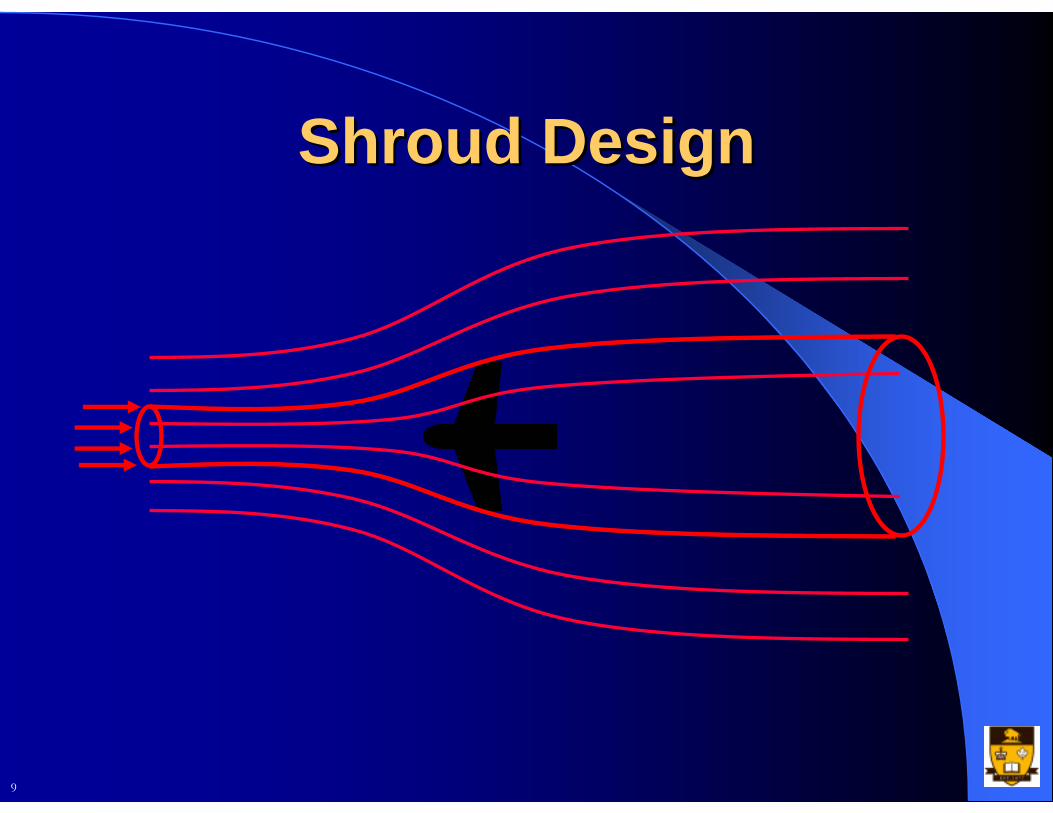
Shroud DesignShroud Design
9
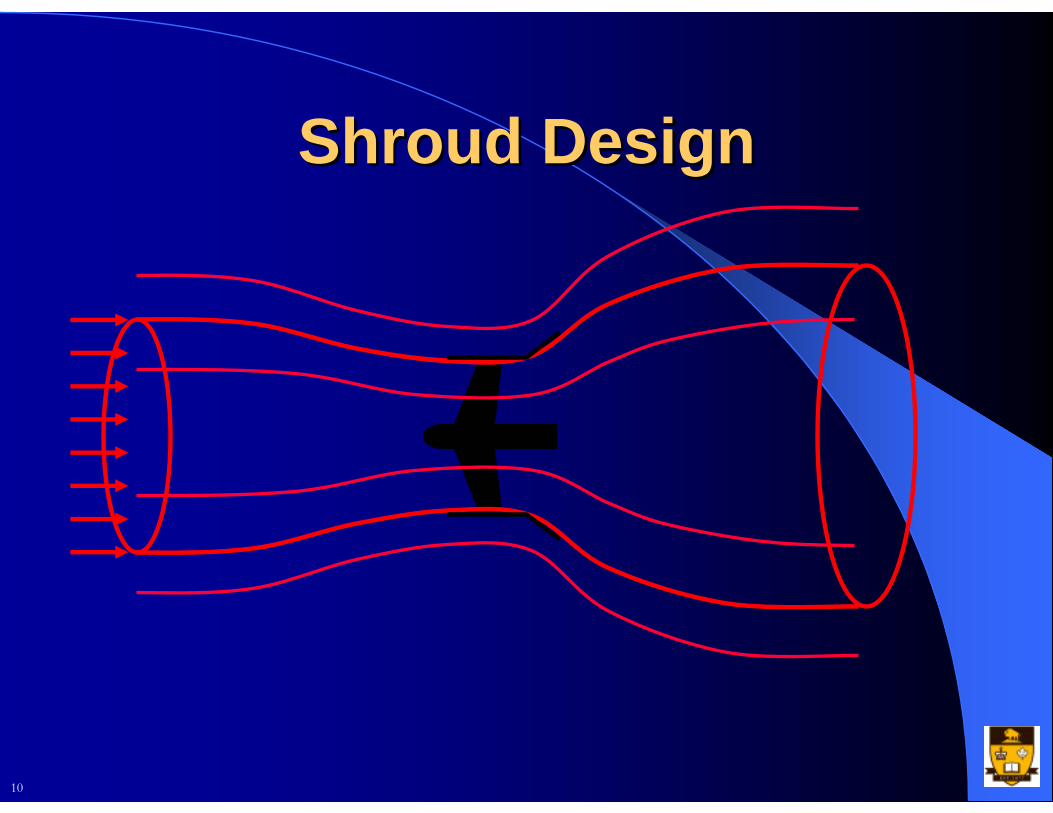
Shroud DesignShroud Design
10
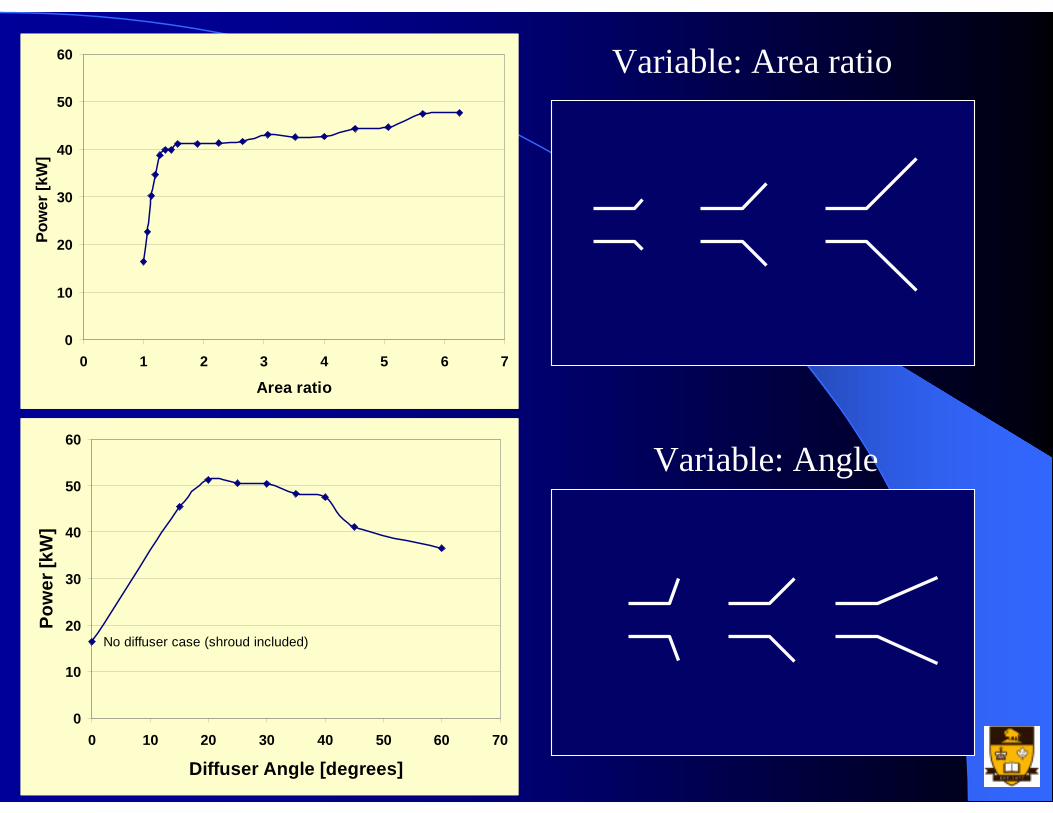
0
10
20
30
40
50
60
0 1 2 3 4 5 6 7
Area ratio
Pow
er [k
W]
Variable: Area ratio
0
10
20
30
40
50
60
0 10 20 30 40 50 60 70
Diffuser Angle [degrees]
Pow
er [k
W]
No diffuser case (shroud included)
Variable: Angle
3.8703.3612.8512.3421.324 1.8330.814-0.204 0.305-0.714
Axial velocity [m/s]
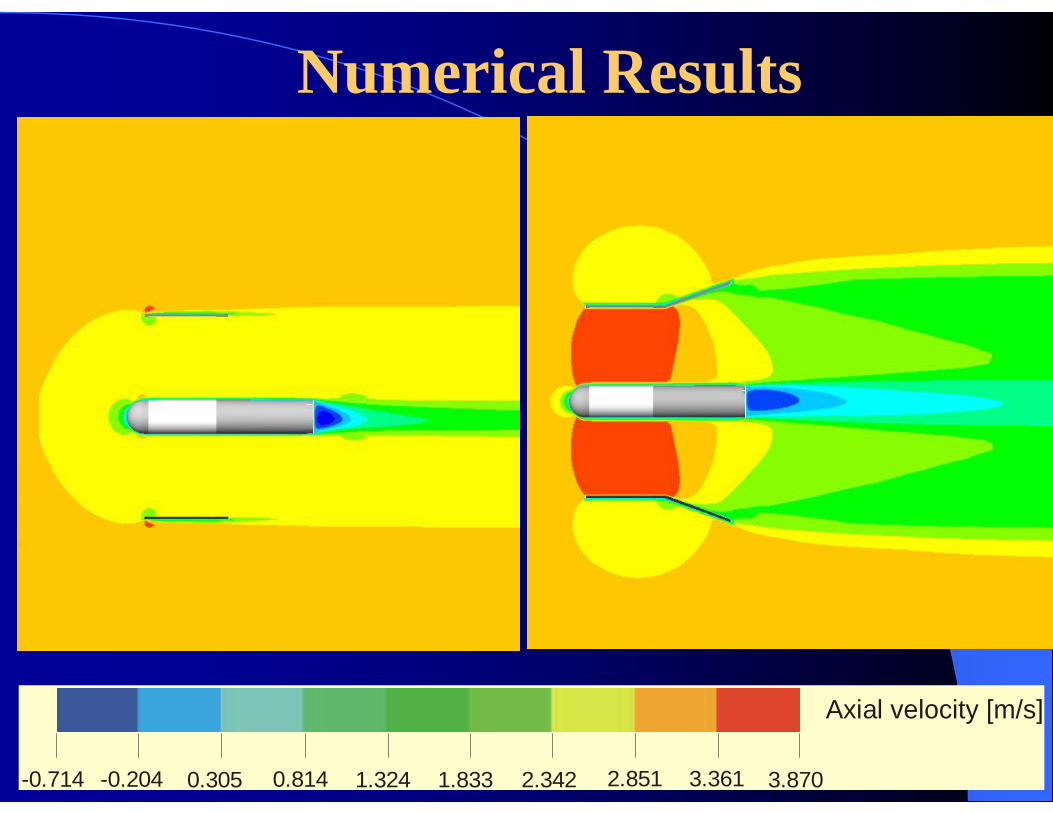
Numerical Results
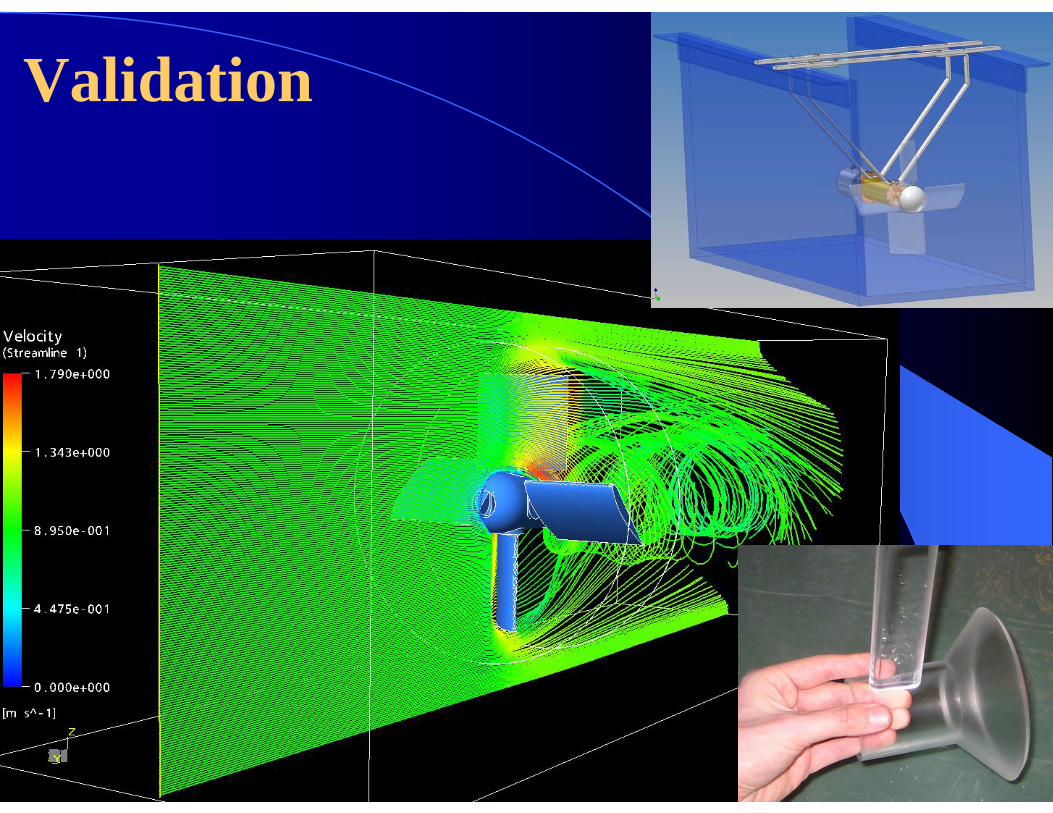
Validation
Station
River
Bridge
FlowSpillway
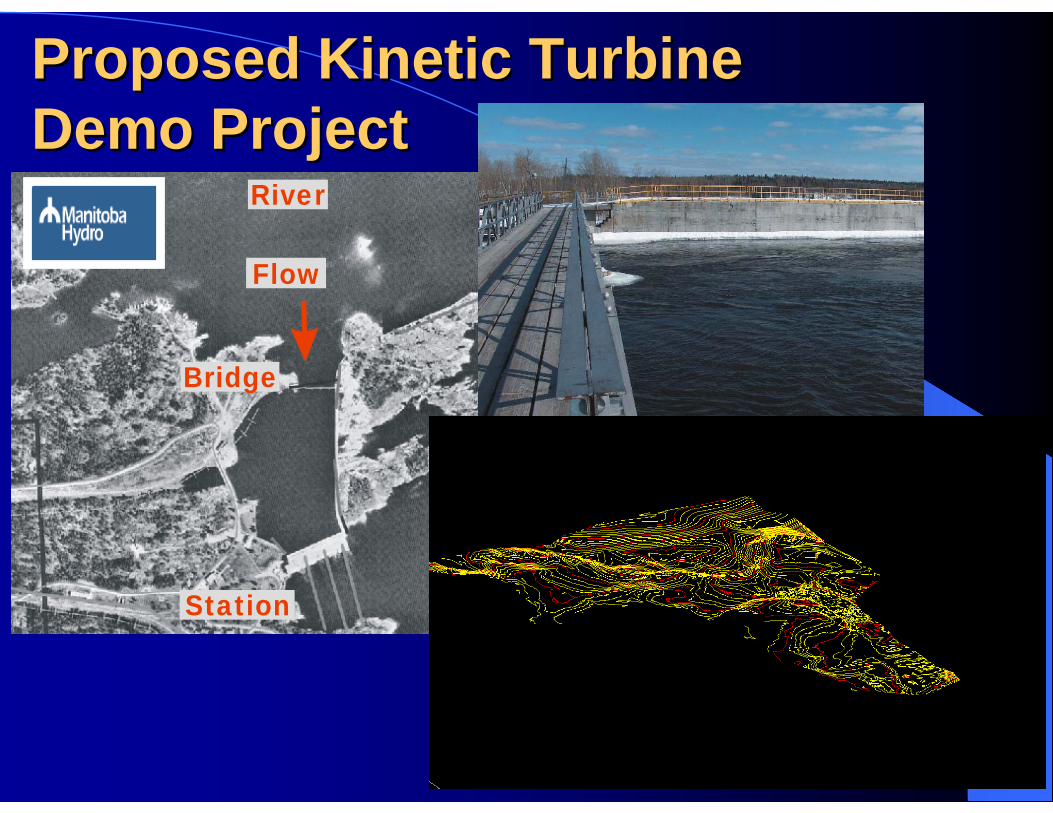
Proposed Kinetic Turbine Proposed Kinetic Turbine Demo ProjectDemo Project
Kinetic Turbine ProjectKinetic Turbine Project
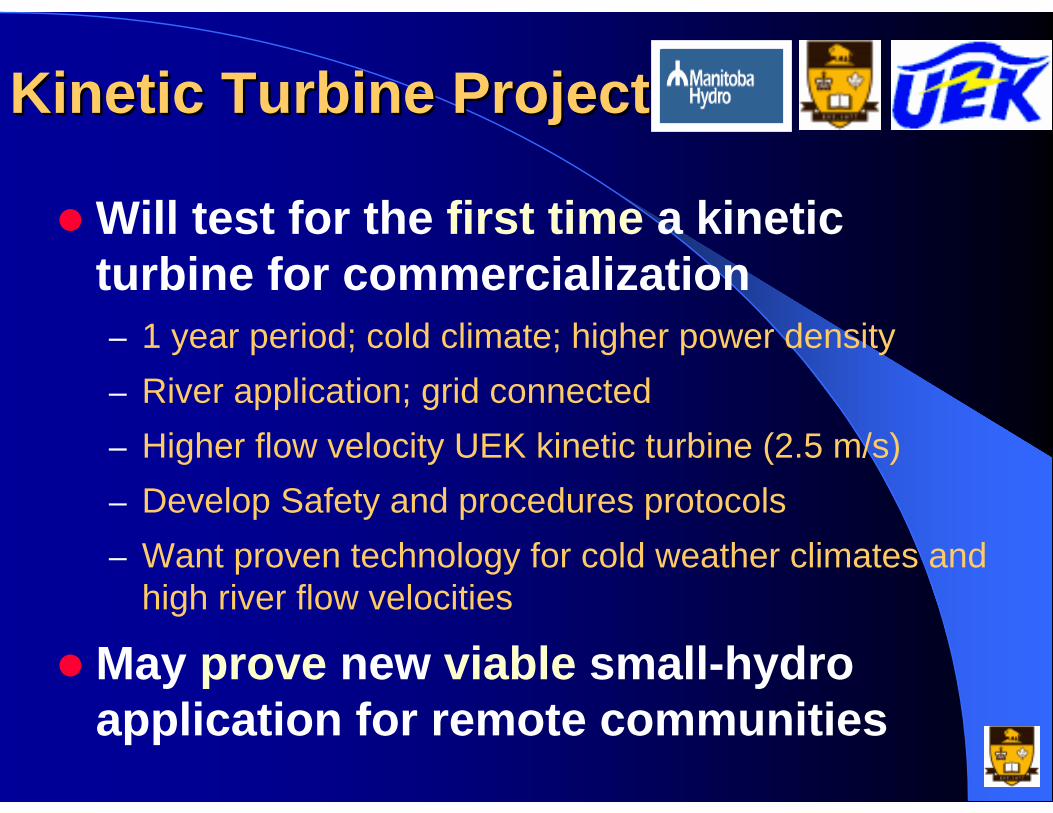
Will test for the first time a kinetic turbine for commercialization – 1 year period; cold climate; higher power density– River application; grid connected– Higher flow velocity UEK kinetic turbine (2.5 m/s)– Develop Safety and procedures protocols– Want proven technology for cold weather climates and
high river flow velocities
May prove new viable small-hydro application for remote communities
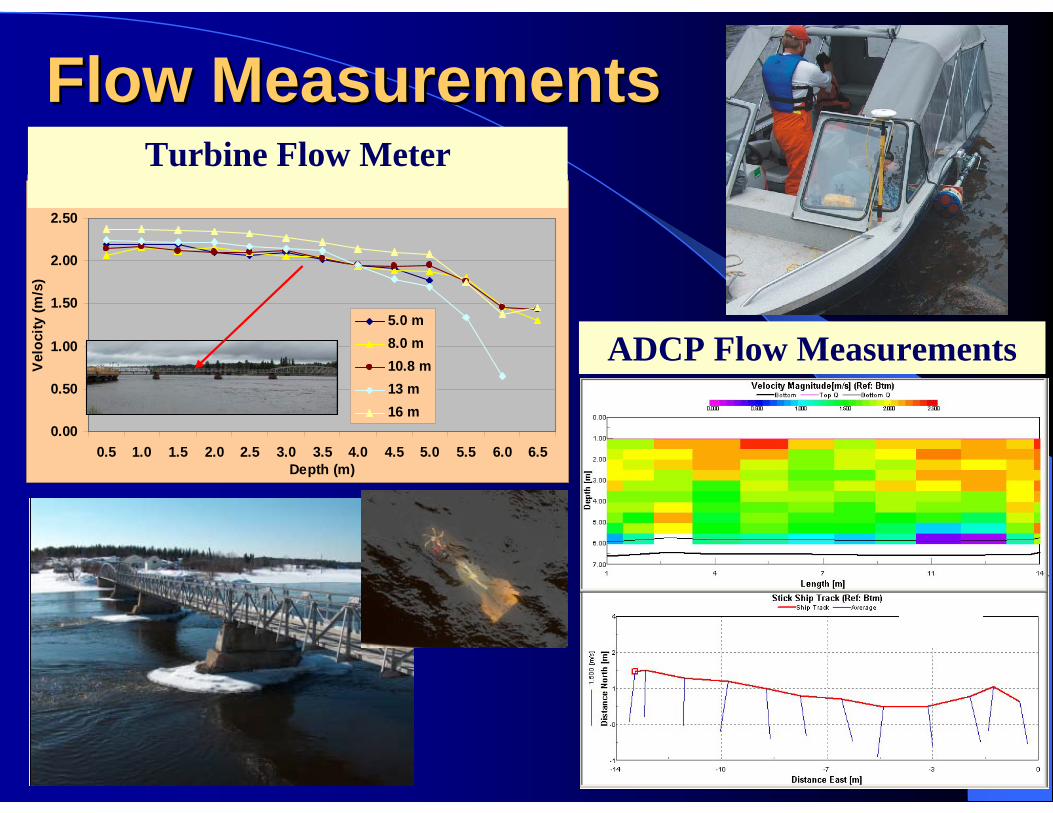
Flow Measurements Flow Measurements Velocity downstream walkway Pointe du Bois June 13, 2005
0.00
0.50
1.00
1.50
2.00
2.50
0.5 1.0 1.5 2.0 2.5 3.0 3.5 4.0 4.5 5.0 5.5 6.0 6.5Depth (m)
Vel
ocity
(m/s
)
5.0 m8.0 m10.8 m13 m16 m
ADCP Flow Measurements
Turbine Flow Meter
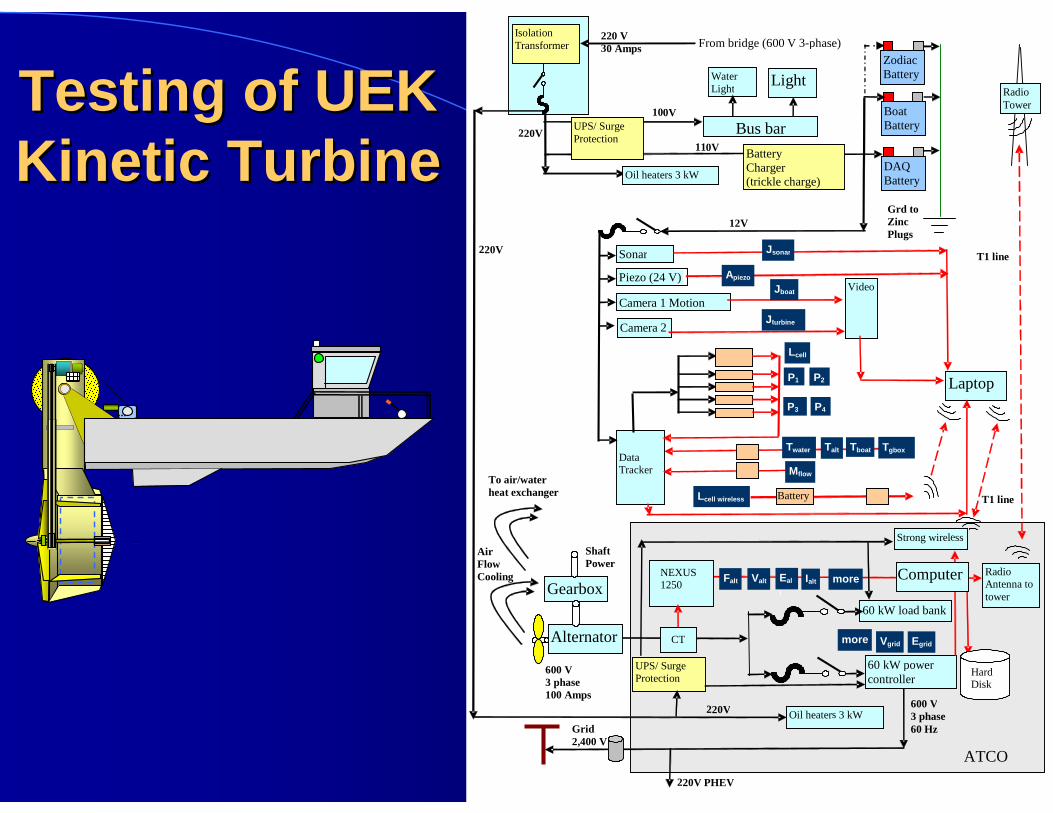
Testing of UEK Testing of UEK Kinetic TurbineKinetic Turbine
UPS/ Surge Protection
Oil heaters 3 kW
Data Tracker
110V
220V
Boat Battery
DAQ Battery
Zodiac Battery Light
Grd to Zinc Plugs
12V
Alternator
60 kW load bank
Shaft Power
600 V 3 phase 100 Amps
60 kW power controller
Gearbox
To air/water heat exchanger
Air Flow Cooling
220 V 30 Amps
Video Camera 1 Motion
Camera 2
600 V 3 phase 60 Hz
Lcell
P1
P3 P4
P2
Jboat
Jturbine
TboatTwater Talt
Mflow
Vgrid Egrid
Valt Ialt Falt Eal
t
Tgbox
NEXUS1250
Water Light
100V
Grid 2,400 V
From bridge (600 V 3-phase)
Laptop
Bus bar
Lcell wireless Battery
Battery Charger(trickle charge)
Hard Disk
ATCO
Sonar
Oil heaters 3 kW 220V
Jsonar
more
more
Computer RadioAntenna to tower
Radio Tower
Strong wireless
Isolation Transformer
CT
T1 line
T1 line
Piezo (24 V) Apiezo
UPS/ Surge Protection
220V
220V PHEV
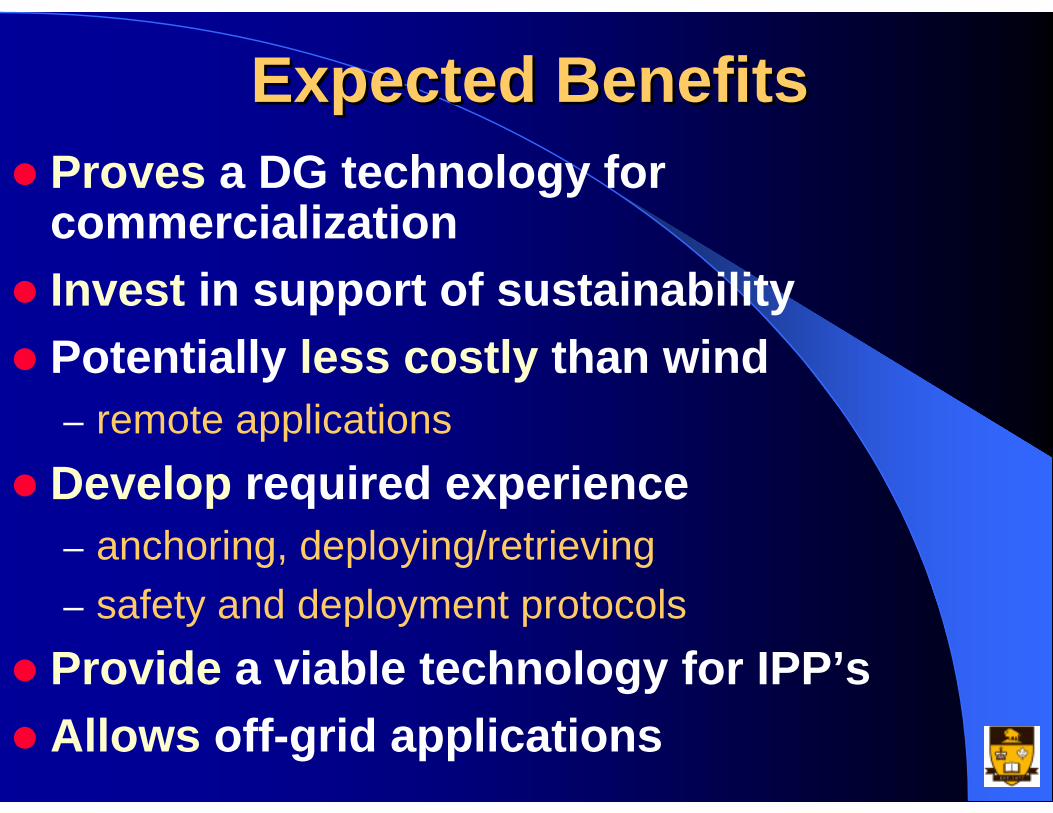
Expected BenefitsExpected BenefitsProves a DG technology for commercializationInvest in support of sustainabilityPotentially less costly than wind – remote applications
Develop required experience – anchoring, deploying/retrieving– safety and deployment protocols
Provide a viable technology for IPP’s Allows off-grid applications
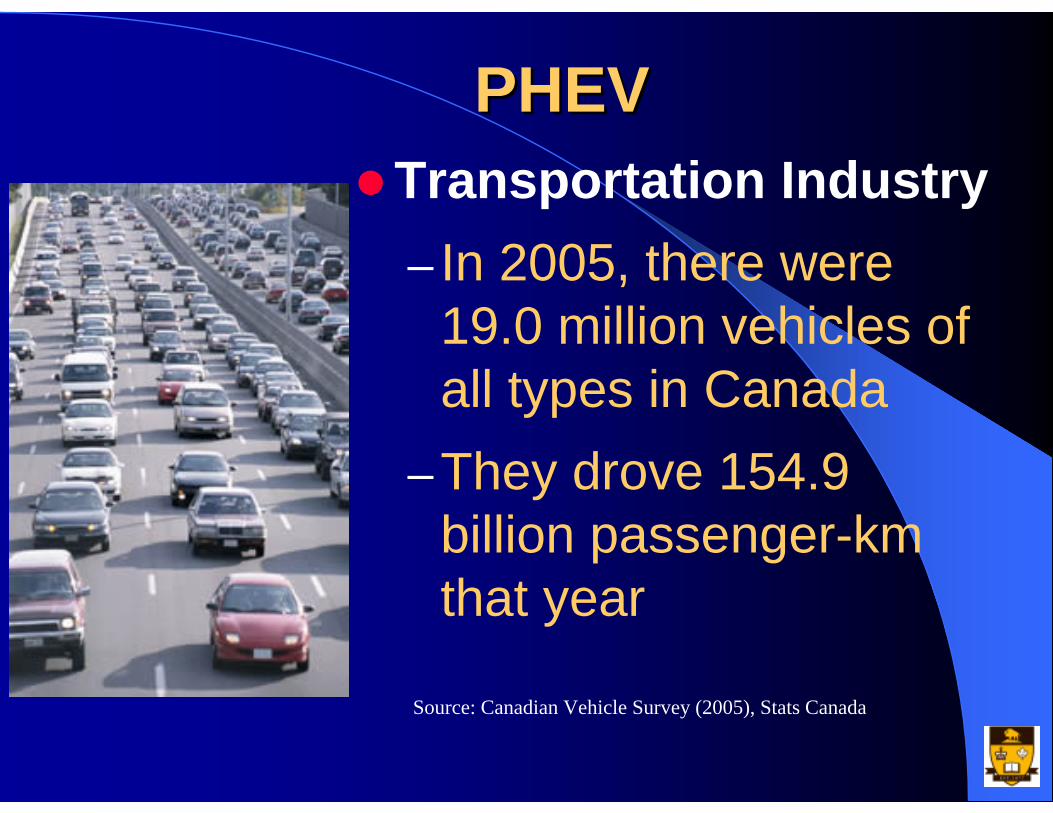
PHEVPHEVTransportation Industry– In 2005, there were
19.0 million vehicles of all types in Canada
–They drove 154.9 billion passenger-km that year
Source: Canadian Vehicle Survey (2005), Stats Canada

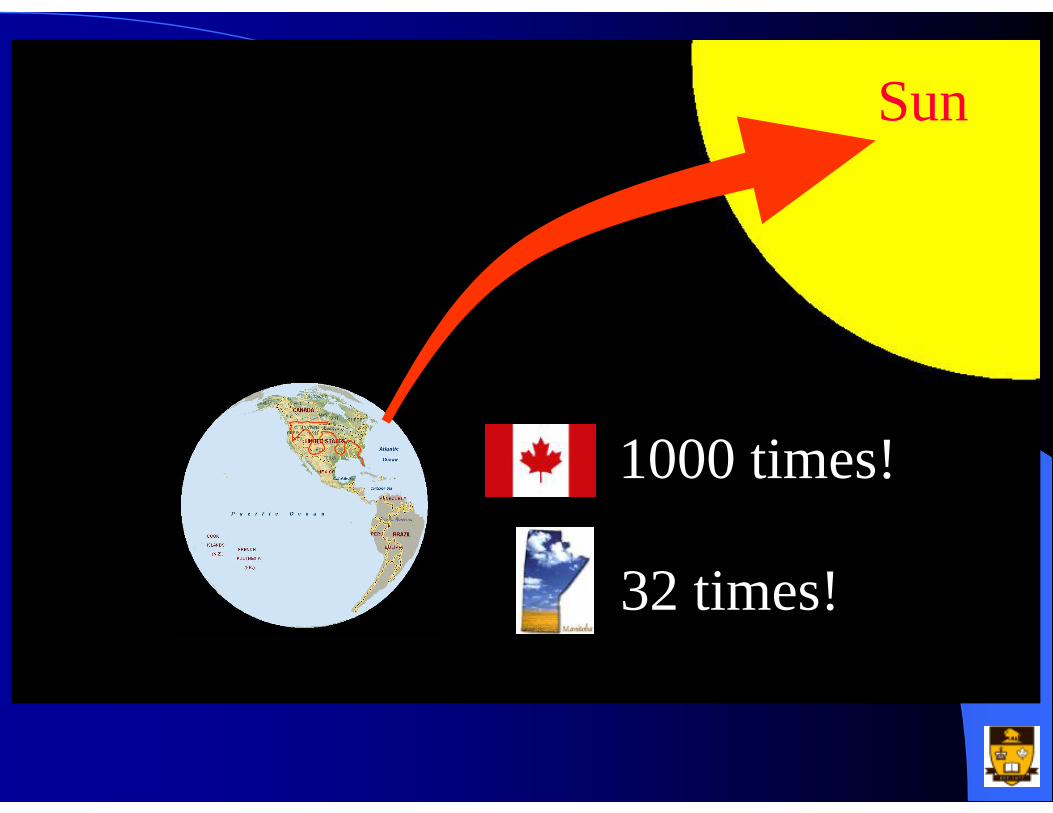
1000 times!
32 times!
Sun
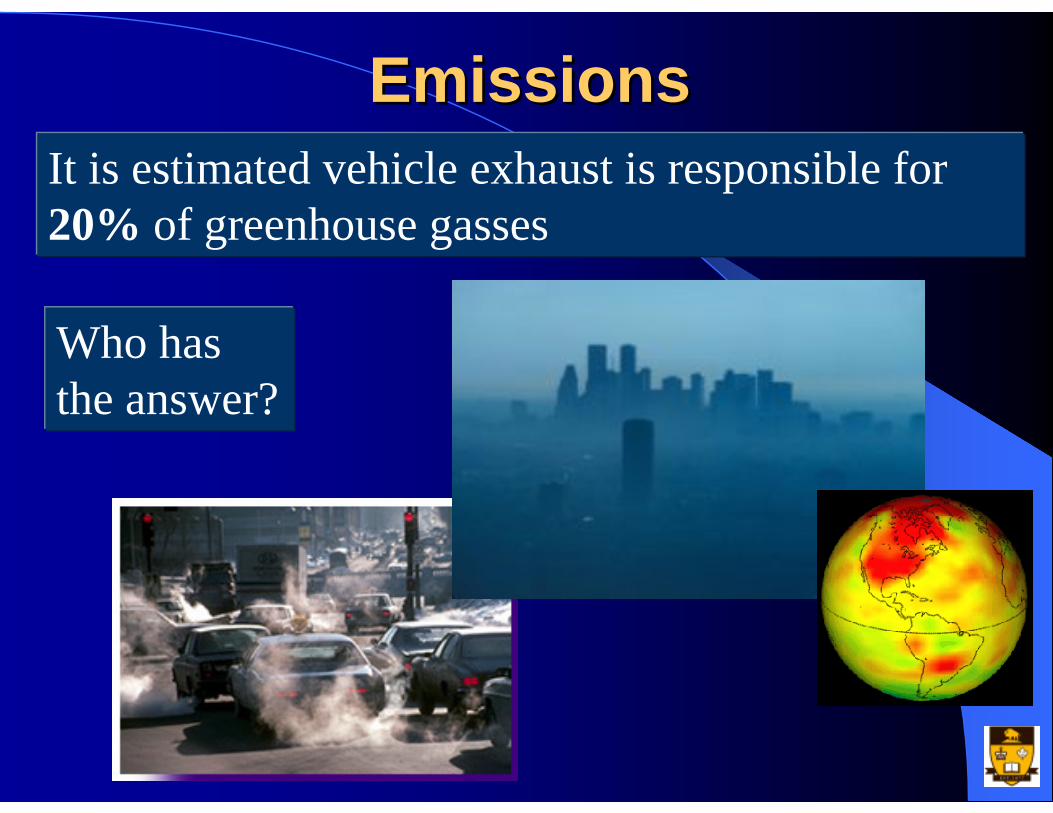
EmissionsEmissionsIt is estimated vehicle exhaust is responsible for20% of greenhouse gasses
Who has the answer?

Source: Online databases, Office of Energy Efficiency, Natural Resources Canada http://oee.nrcan.gc.ca/
Vehicle GHG Emissions in Canada
0.0
20.0
40.0
60.0
80.0
100.0
120.0
140.0
1990
1991
1992
1993
1994
1995
1996
1997
1998
1999
2000
2001
2002
2003
Year
GH
G's
(Mt)
GasolineDieselTotal
50 times the weight of all Canadians
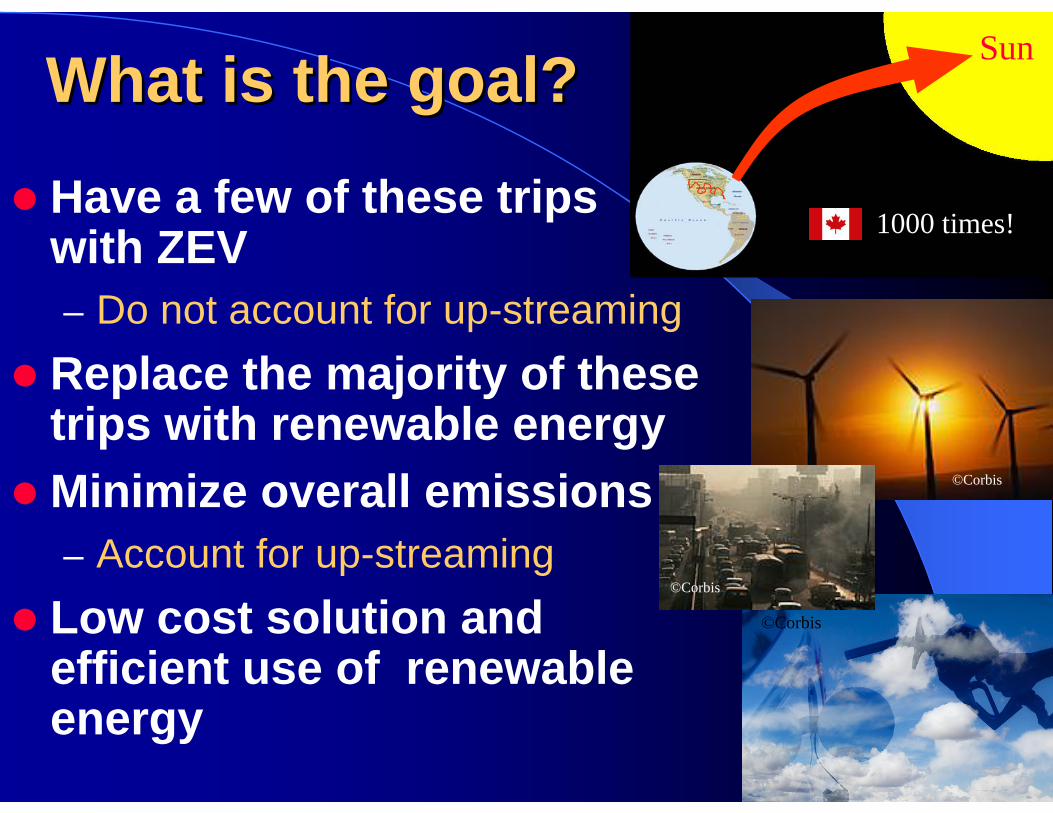
1000 times!
SunWhat is the goal?What is the goal?Have a few of these trips with ZEV– Do not account for up-streaming
Replace the majority of these trips with renewable energyMinimize overall emissions– Account for up-streaming
Low cost solution and efficient use of renewable energy
©Corbis
©Corbis
©Corbis
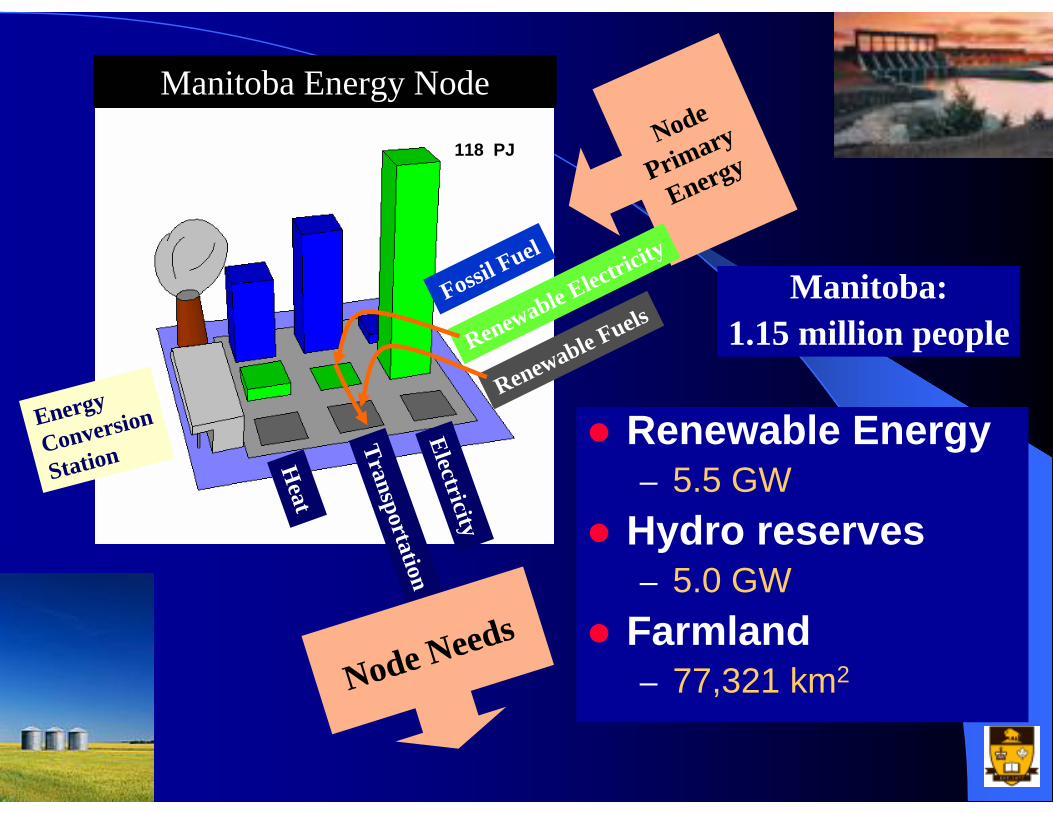
Manitoba Energy NodeNode
Primary
Energy
Fossil Fuel
Renewable Electricity
Renewable Fuels
Heat
TransportationElectricity
Energy
Conversion
Station
Node Needs
118 PJ
Renewable Energy– 5.5 GW
Hydro reserves– 5.0 GW
Farmland – 77,321 km2
Manitoba: 1.15 million people
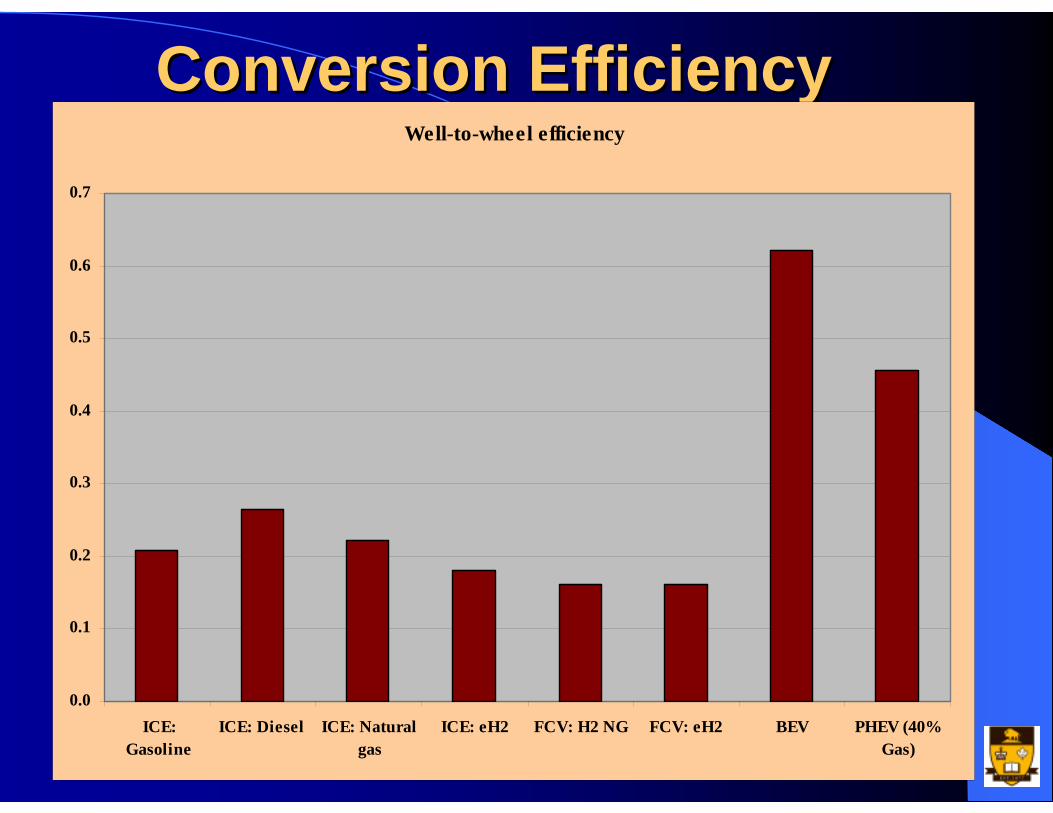
Conversion EfficiencyConversion EfficiencyWell-to-wheel efficiency
0.0
0.1
0.2
0.3
0.4
0.5
0.6
0.7
ICE:Gasoline
ICE: Diesel ICE: Naturalgas
ICE: eH2 FCV: H2 NG FCV: eH2 BEV PHEV (40%Gas)
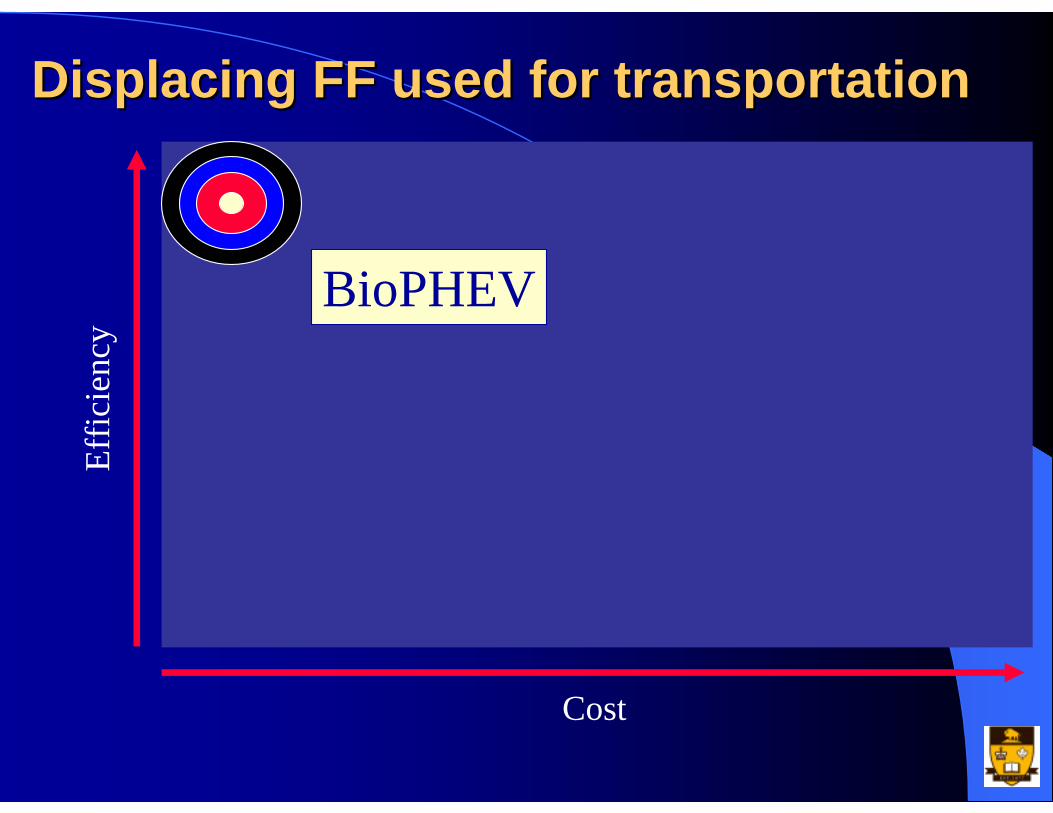
Displacing FF used for transportation Displacing FF used for transportation
Cost
Effic
ienc
y
BioPHEV
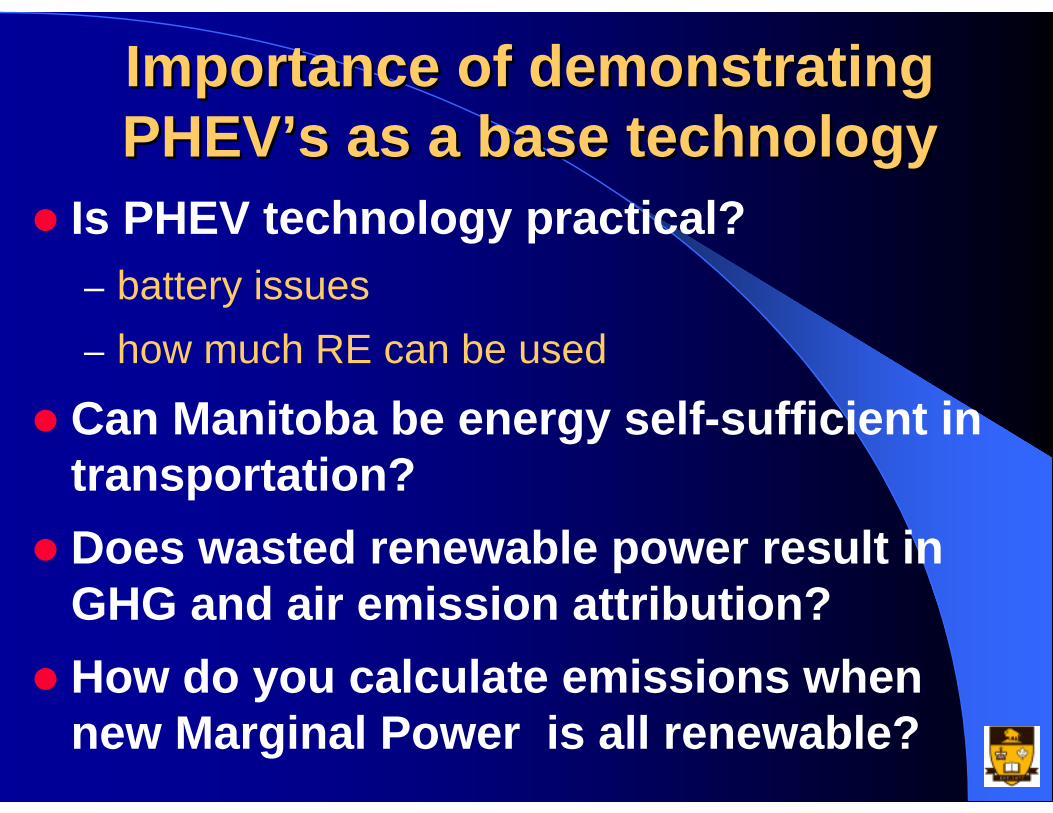
Importance of demonstrating Importance of demonstrating PHEV’s as a base technologyPHEV’s as a base technology
Is PHEV technology practical?– battery issues– how much RE can be used
Can Manitoba be energy self-sufficient in transportation?Does wasted renewable power result in GHG and air emission attribution?How do you calculate emissions when new Marginal Power is all renewable?

MB Winter Load
0
1000
2000
3000
4000
5000
6000
7000
8 9 10 11 12 13 14 15 16 17 18 19 20 21 22 23 24 1 2 3 4 5 6 7
Day Hours
Load
(MW
)
WinterWinter + FCVWinter + BEVWinter + PHEV
Daytime Nightime
Manitoba Grid Infrastructure WinterManitoba Grid Infrastructure Winter
0 500 1000 1500 2000 2500 3000
Power FCX FCV
Power Rav4 EV
Power PHEV New MW power
Vehicles in Manitoba cars 662,200Driving mileage per day km/day 50
Generating Capacity GHG/Emissions?
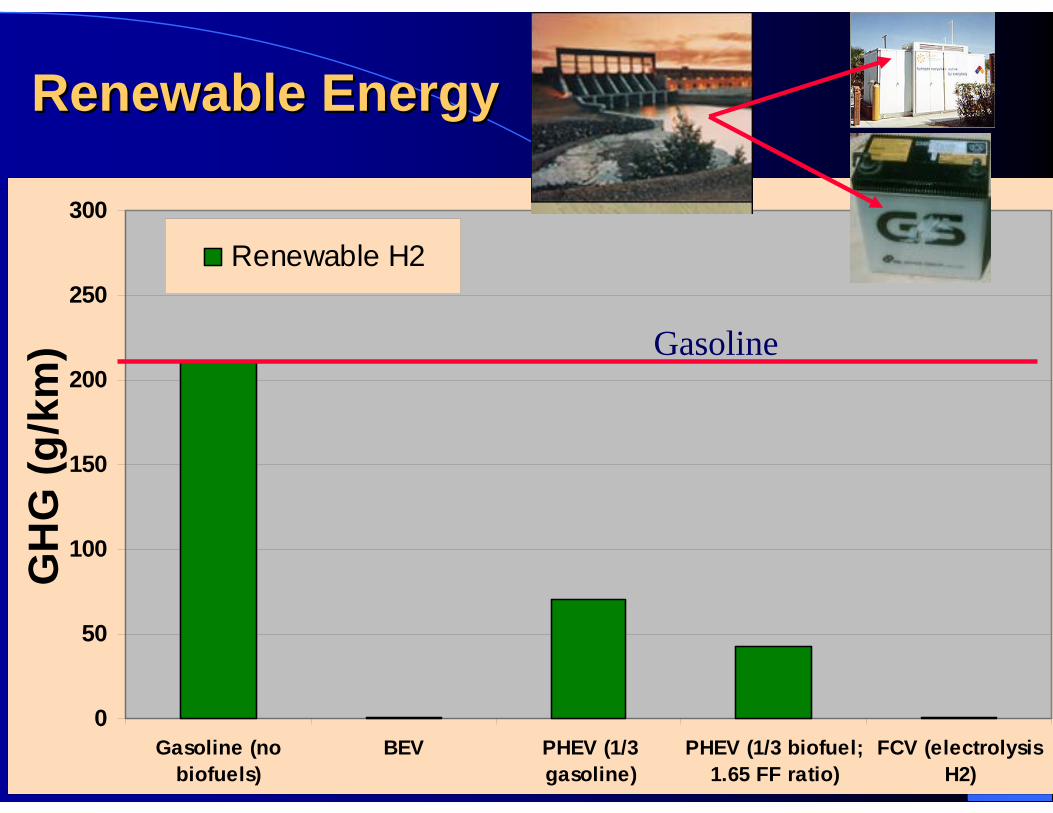
0
50
100
150
200
250
300
Gasoline (nobiofuels)
BEV PHEV (1/3gasoline)
PHEV (1/3 biofuel;1.65 FF ratio)
FCV (electrolysisH2)
GH
G (g
/km
)
Renewable H2
Renewable EnergyRenewable Energy
Gasoline
0
50
100
150
200
250
300
Gasoline (nobiofuels)
BEV PHEV (1/3gasoline)
PHEV (1/3 biofuel;1.65 FF ratio)
FCV (electrolysisH2)
GH
G (g
/km
)
Renewable H2
Electrical Mix
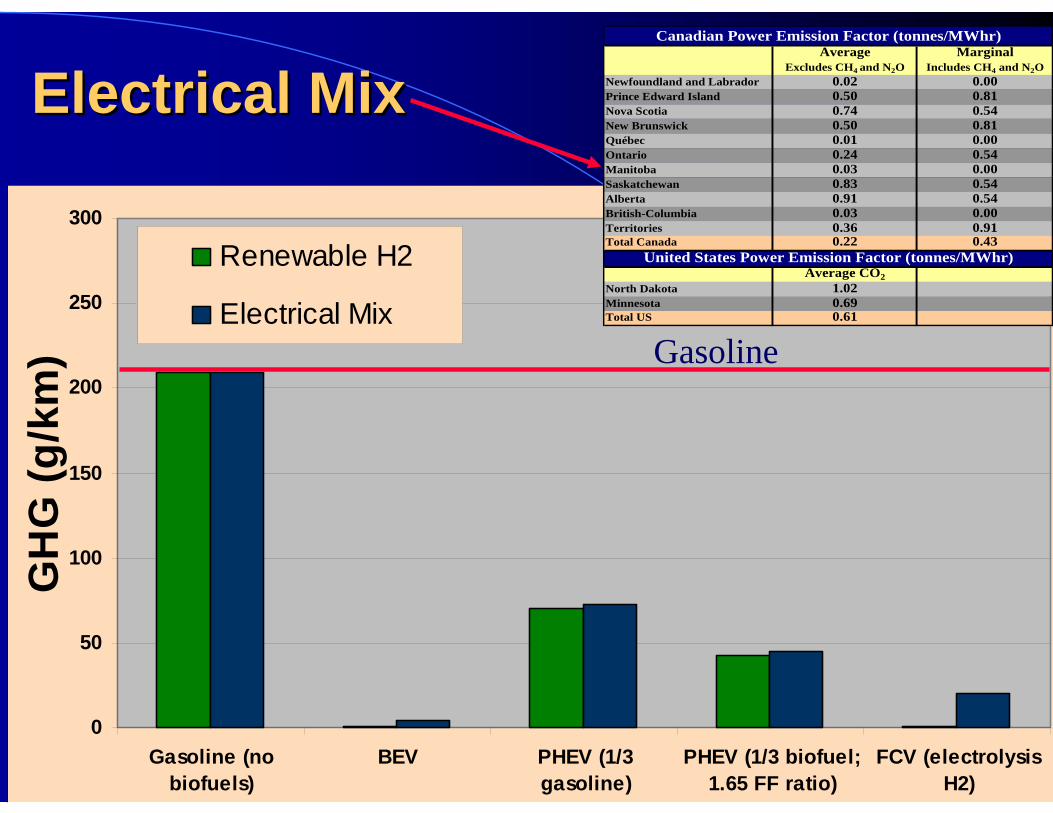
Electrical Mix Electrical Mix
Gasoline
Average MarginalExcludes CH4 and N2O Includes CH4 and N2O
Newfoundland and Labrador 0.02 0.00Prince Edward Island 0.50 0.81Nova Scotia 0.74 0.54New Brunswick 0.50 0.81Québec 0.01 0.00Ontario 0.24 0.54Manitoba 0.03 0.00Saskatchewan 0.83 0.54Alberta 0.91 0.54British-Columbia 0.03 0.00Territories 0.36 0.91Total Canada 0.22 0.43
Average CO2North Dakota 1.02Minnesota 0.69Total US 0.61
Canadian Power Emission Factor (tonnes/MWhr)
United States Power Emission Factor (tonnes/MWhr)
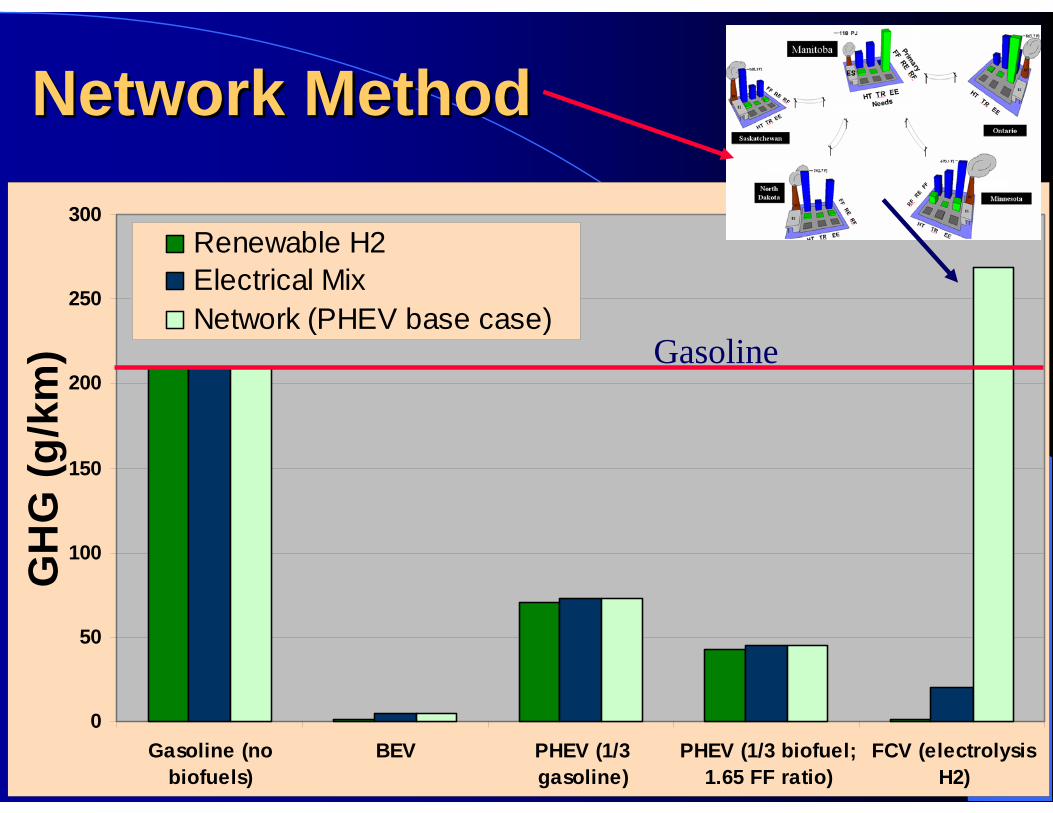
Network MethodNetwork Method
0
50
100
150
200
250
300
Gasoline (nobiofuels)
BEV PHEV (1/3gasoline)
PHEV (1/3 biofuel;1.65 FF ratio)
FCV (electrolysisH2)
GH
G (g
/km
)
Renewable H2Electrical MixNetwork (PHEV base case)
Gasoline
PlugPlug--in Highway Programin Highway Program
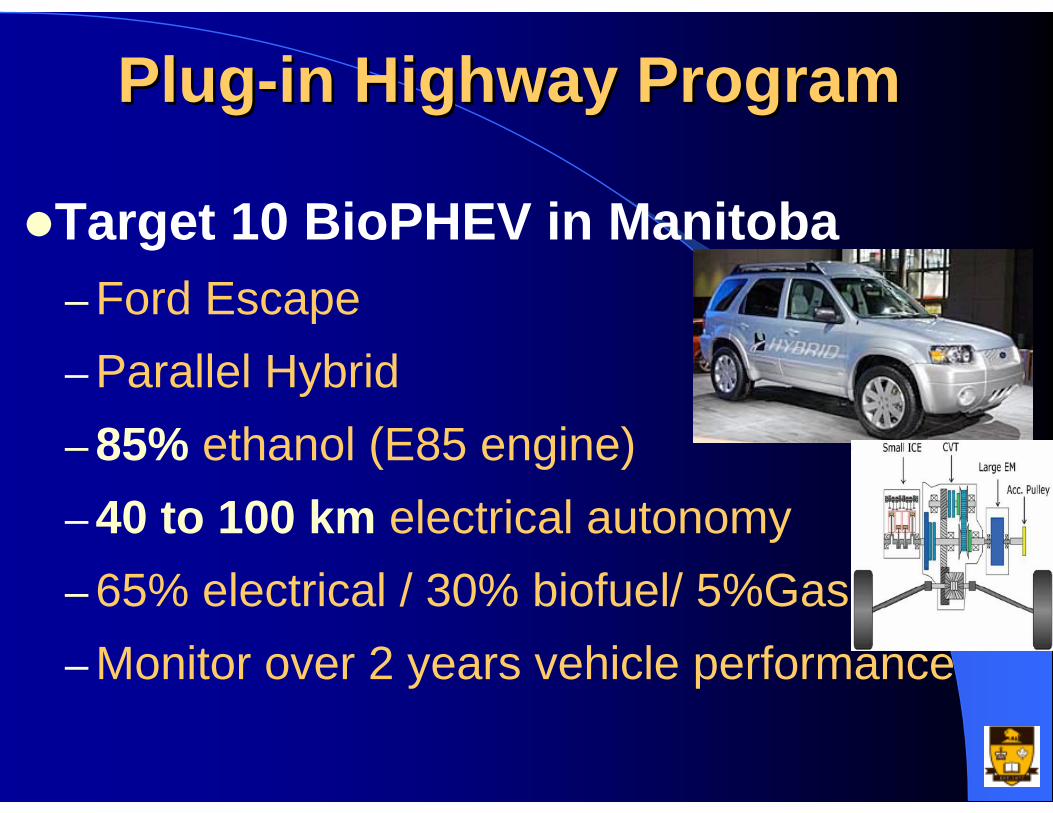
Target 10 BioPHEV in Manitoba– Ford Escape– Parallel Hybrid– 85% ethanol (E85 engine)– 40 to 100 km electrical autonomy– 65% electrical / 30% biofuel/ 5%Gas– Monitor over 2 years vehicle performance
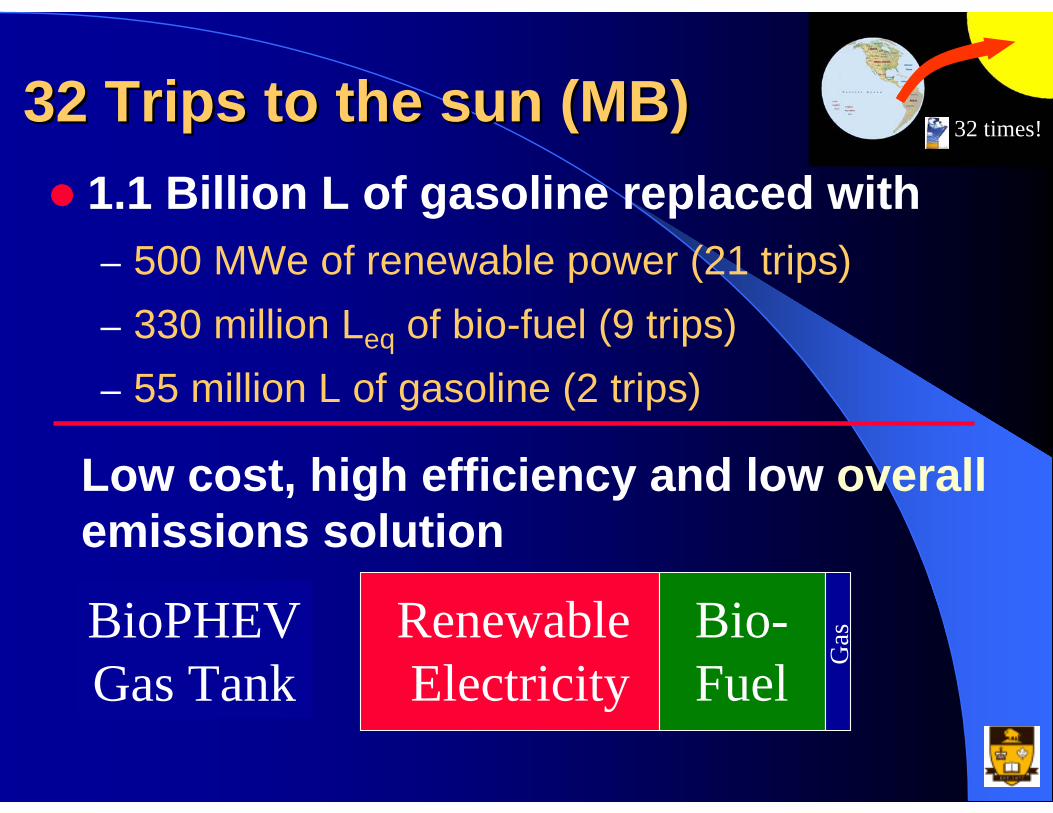
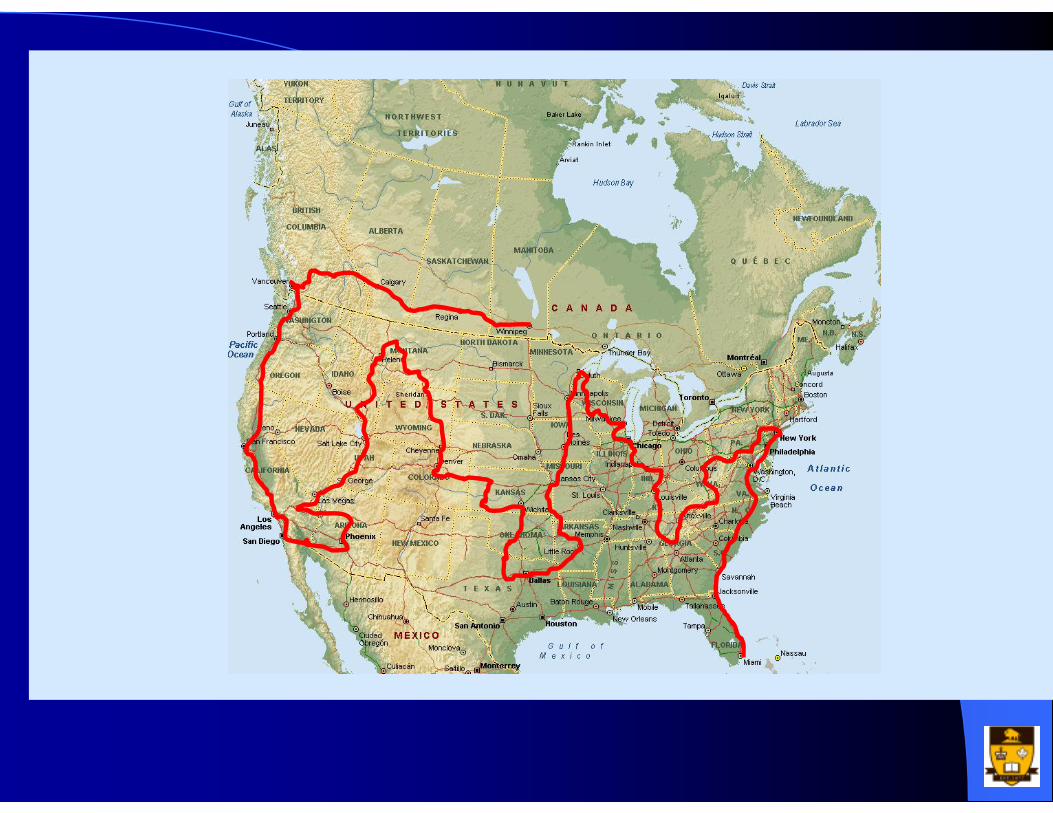
32 Trips to the sun (MB)32 Trips to the sun (MB)1.1 Billion L of gasoline replaced with– 500 MWe of renewable power (21 trips)– 330 million Leq of bio-fuel (9 trips)– 55 million L of gasoline (2 trips)
BioPHEVGas Tank
Renewable Electricity
Bio-Fuel
Low cost, high efficiency and low overallemissions solution
Gas
32 times!
Why PlugWhy Plug--in Highway Programin Highway ProgramPossible 90% reduction in gasolineManitoba ideal location for BioPHEV’s Canada needs to demonstrate real solutions No infrastructure costsMake renewable transportation a realityHelp overcome inertia of automotive industryInformation for utilities to adjust power growth rates V2G
PlugPlug--in Highway in Manitobain Highway in ManitobaOptimal use of renewable energy sources – without new infrastructure and lifestyle sacrifices
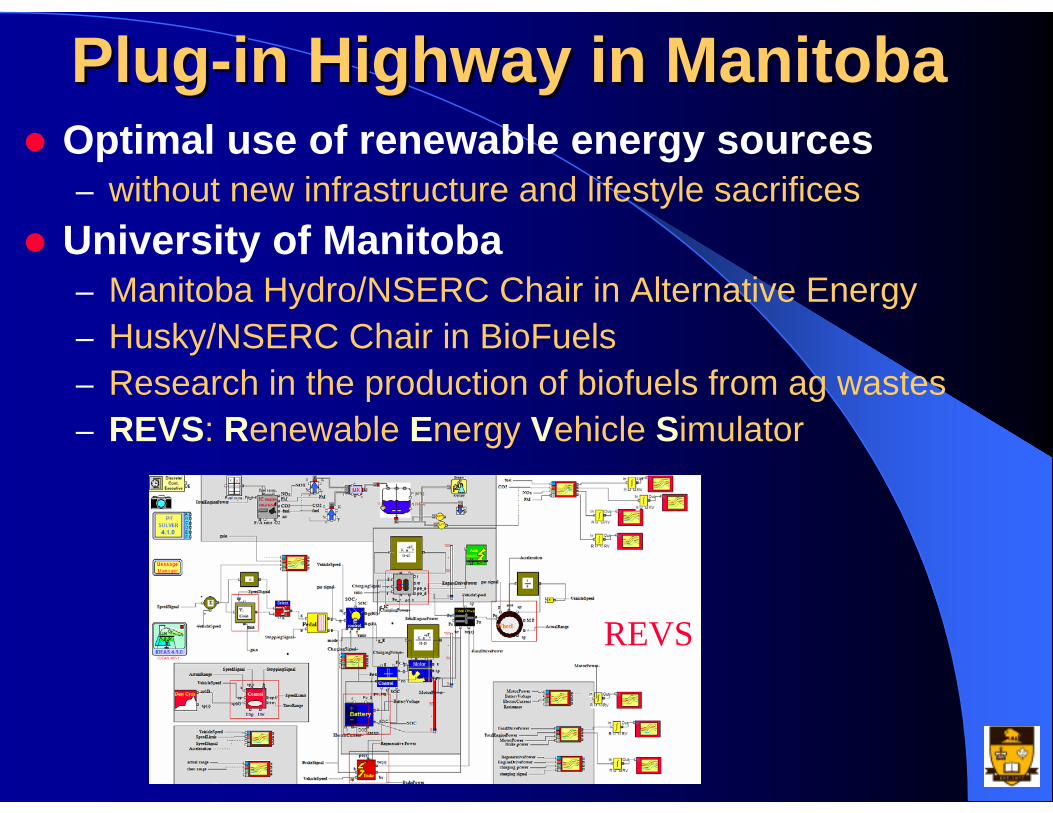
University of Manitoba– Manitoba Hydro/NSERC Chair in Alternative Energy– Husky/NSERC Chair in BioFuels– Research in the production of biofuels from ag wastes – REVS: Renewable Energy Vehicle Simulator
REVS
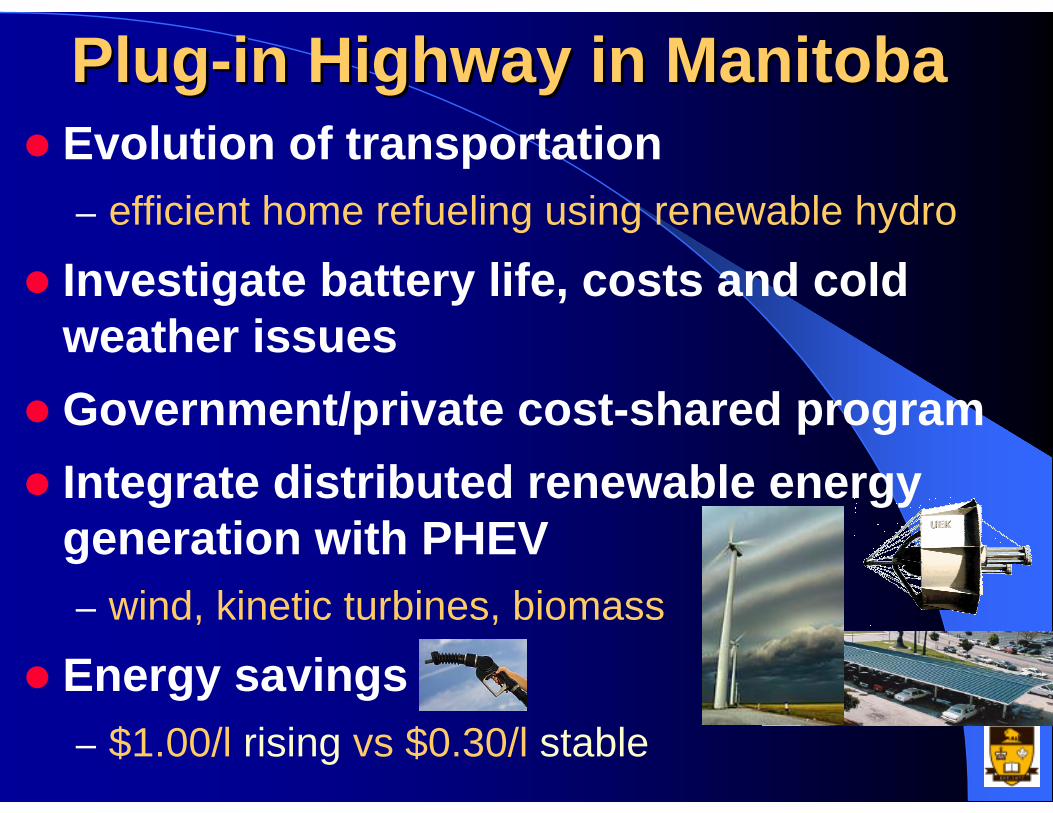
PlugPlug--in Highway in Manitobain Highway in ManitobaEvolution of transportation– efficient home refueling using renewable hydro
Investigate battery life, costs and cold weather issuesGovernment/private cost-shared programIntegrate distributed renewable energy generation with PHEV– wind, kinetic turbines, biomass
Energy savings– $1.00/l rising vs $0.30/l stable
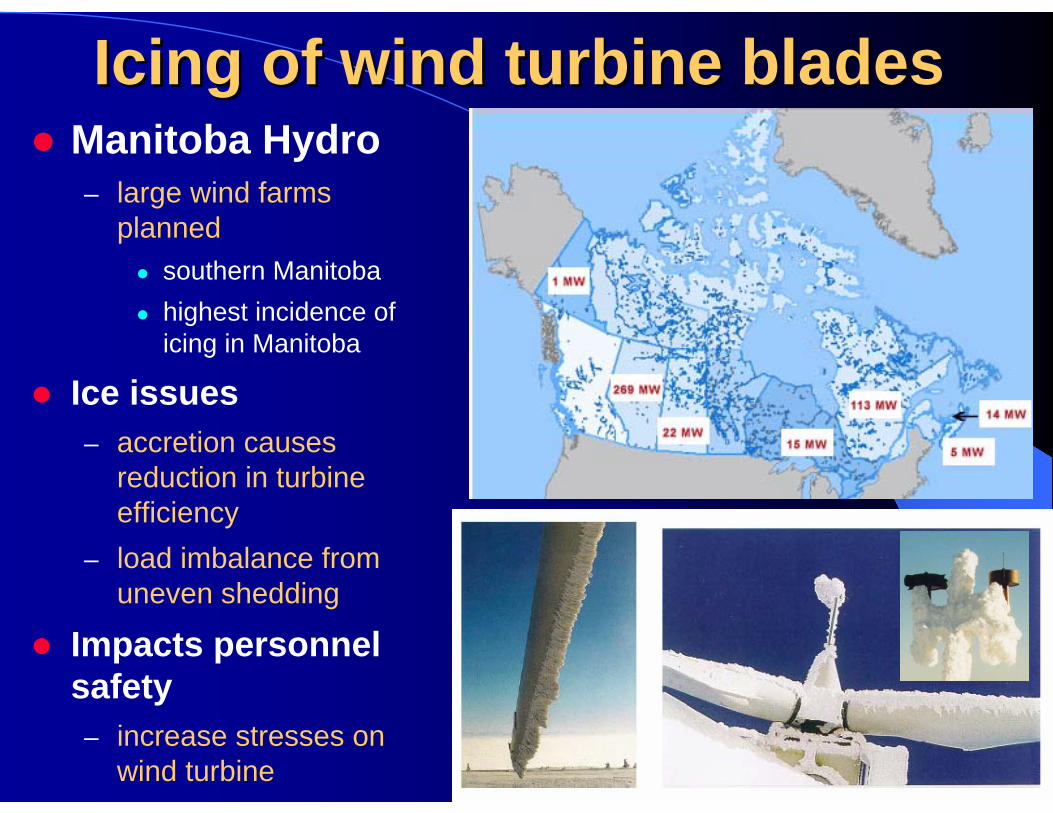
Icing of wind turbine bladesIcing of wind turbine bladesManitoba Hydro – large wind farms
plannedsouthern Manitoba highest incidence of icing in Manitoba
Ice issues– accretion causes
reduction in turbine efficiency
– load imbalance from uneven shedding
Impacts personnel safety– increase stresses on
wind turbine
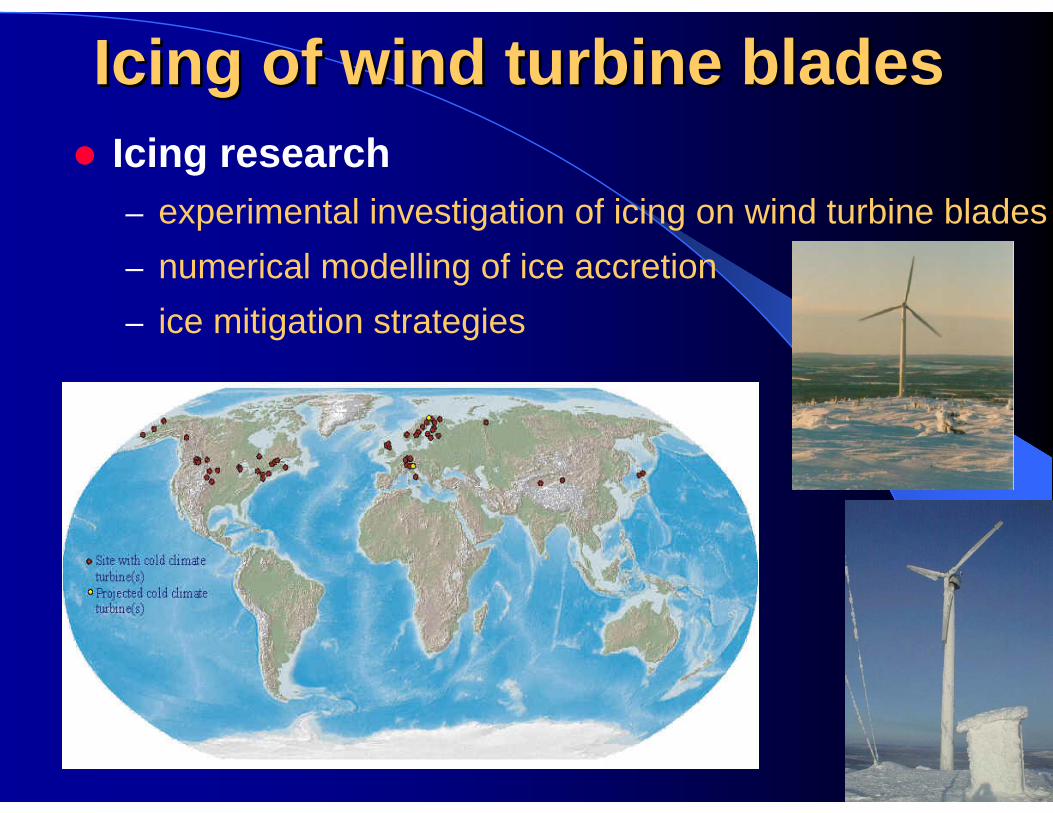
Icing of wind turbine bladesIcing of wind turbine bladesIcing research– experimental investigation of icing on wind turbine blades– numerical modelling of ice accretion– ice mitigation strategies

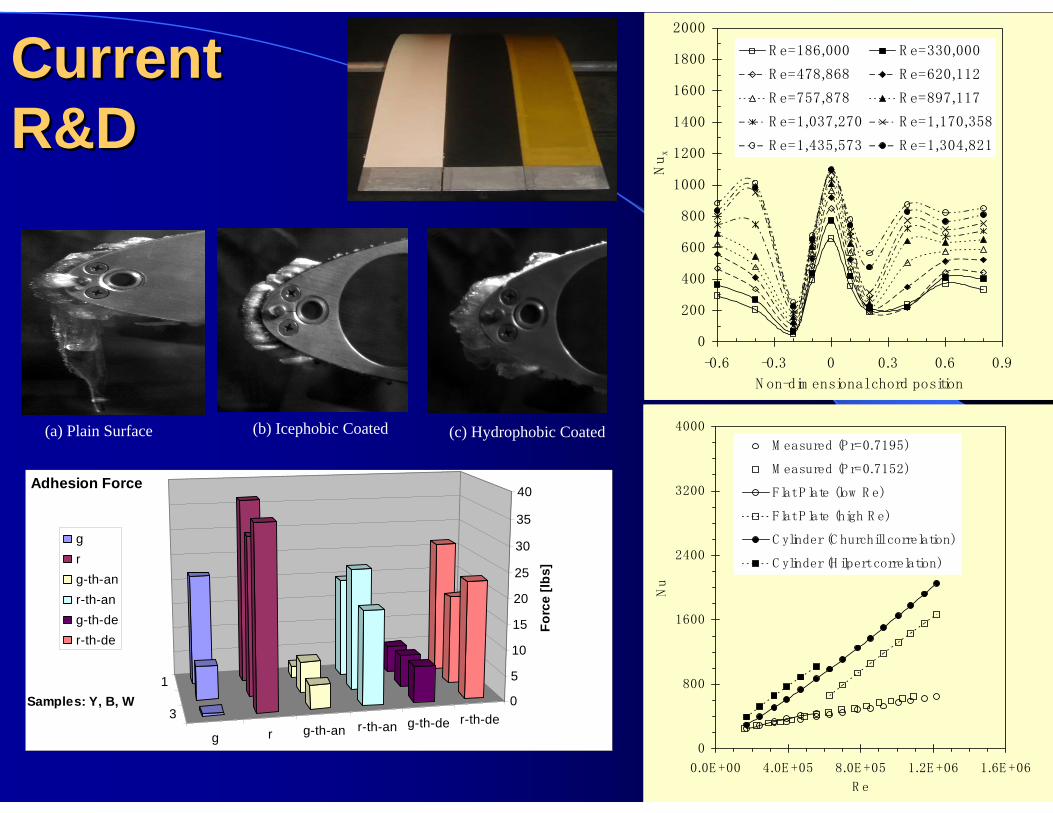
Icing of wind turbine bladesIcing of wind turbine bladesExperimental Work– test models
fixed wing3 blade rotating model
– test mitigation techniques
– instrumentationforce balancePIVheat transfer rates at interface
-60
-40
-20
0
20
40
60
80
0 100 200 300 400 500
T2
T8
T7
T4
T3
T1
T6
T5
T19
T11
T12
T10
T9
T1
T17
T16
T15
T14
T13
T20
h1
h10 h9 h8
h7
h6
h5
h4h3
h2
Current Current R&DR&D
0
200
400
600
800
1000
1200
1400
1600
1800
2000
-0.6 -0.3 0 0.3 0.6 0.9
N on-dim ensional chord position
Nux
R e=186,000 R e=330,000
R e=478,868 R e=620,112
R e=757,878 R e=897,117
R e=1,037,270 R e=1,170,358
R e=1,435,573 R e=1,304,821
0
800
1600
2400
3200
4000
0.0E +00 4.0E +05 8.0E +05 1.2E +06 1.6E +06
R e
Nu
M easured (P r=0.7195)
M easured (P r=0.7152)
Flat P late (low R e)
Flat P late (high R e)
C ylinder (C hurchill correlation)
C ylinder (H ilpert correlation)
1
3
g r g-th-an r-th-an g-th-de r-th-de0
5
10
15
20
25
30
35
40
Forc
e [lb
s]
Samples: Y, B, W
Adhesion Force
grg-th-anr-th-ang-th-der-th-de
(a) Plain Surface (b) Icephobic Coated (c) Hydrophobic Coated
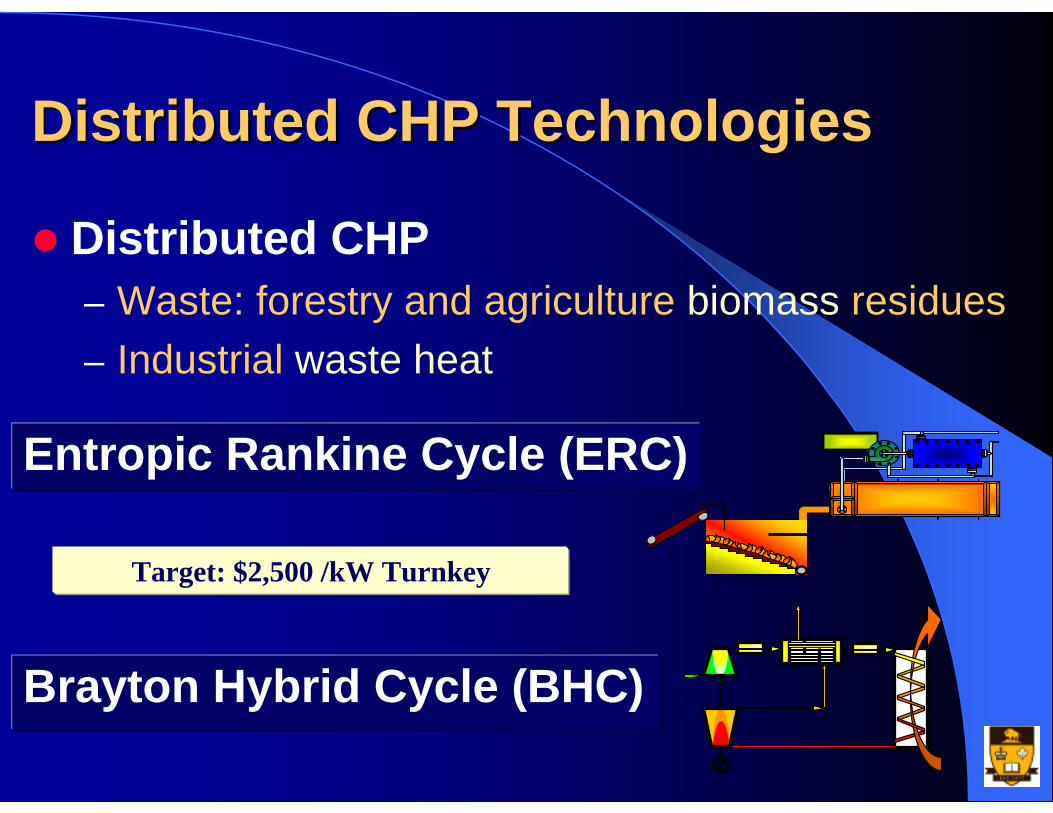
Distributed CHP TechnologiesDistributed CHP Technologies
Brayton Hybrid Cycle (BHC)
Entropic Rankine Cycle (ERC)
Distributed CHP– Waste: forestry and agriculture biomass residues– Industrial waste heat
Target: $2,500 /kW Turnkey
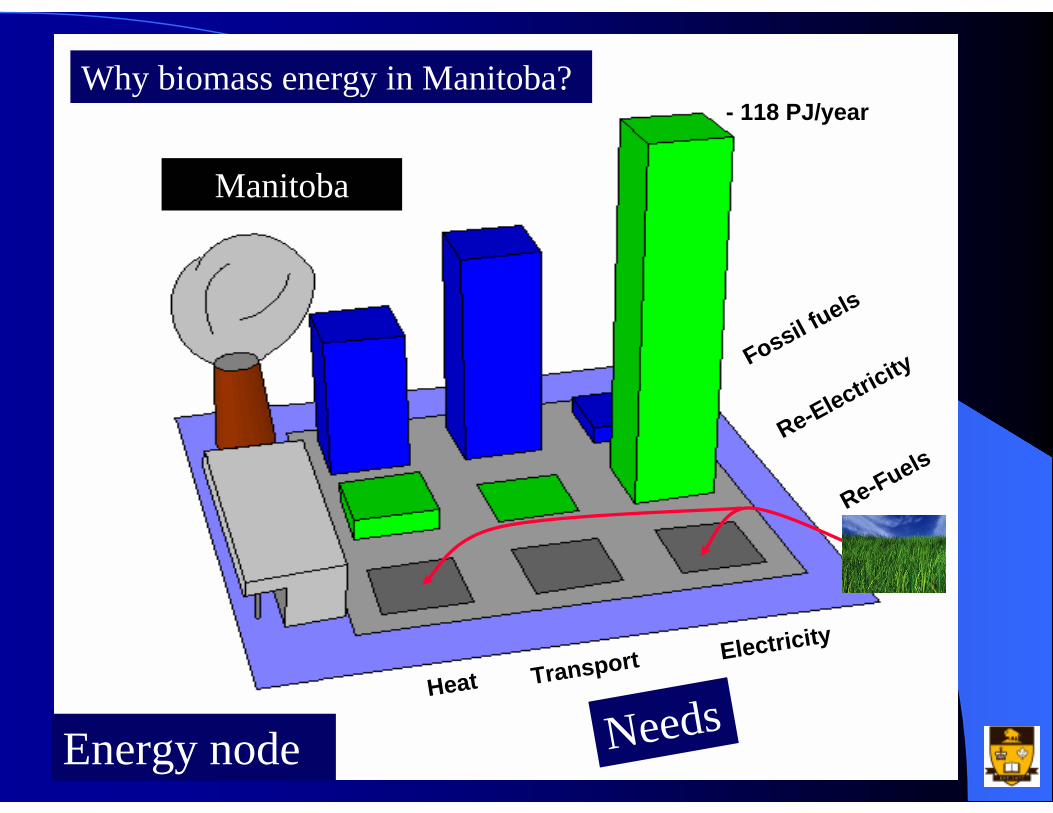
Manitoba
Heat
Fossil fuels
Re-Electricity
Re-Fuels
Transport Electricity
- 118 PJ/yearWhy biomass energy in Manitoba?
Energy node Needs
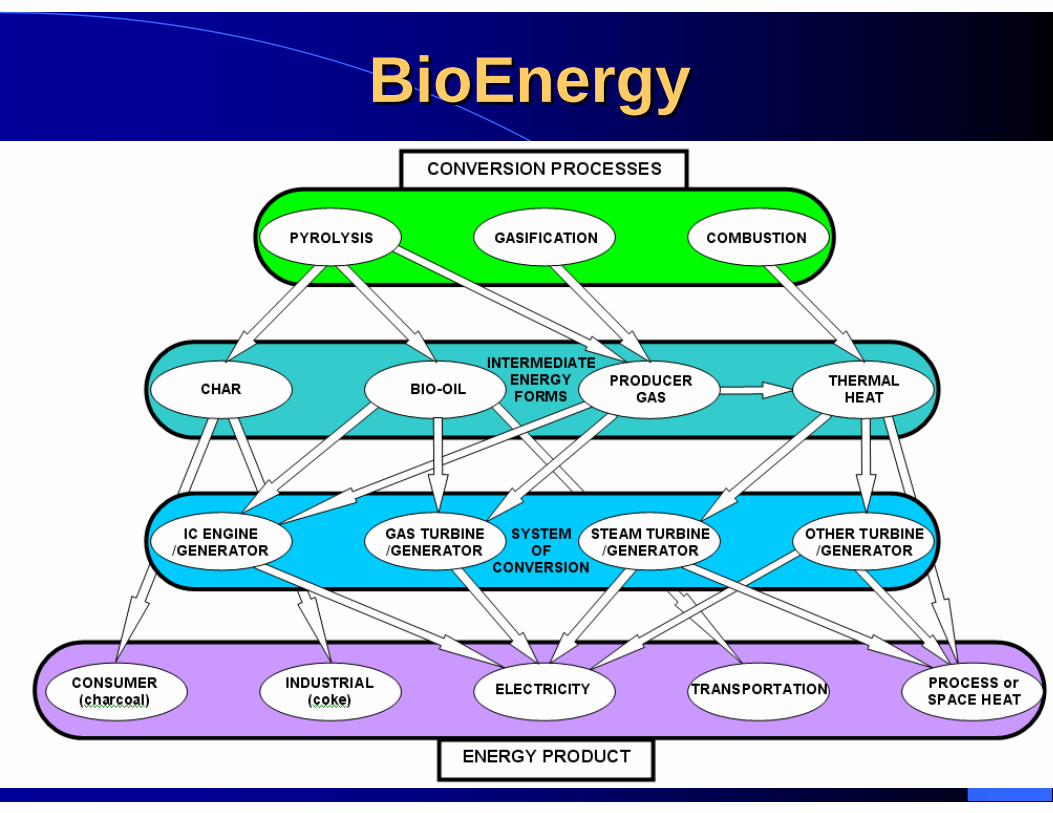
BioEnergyBioEnergy
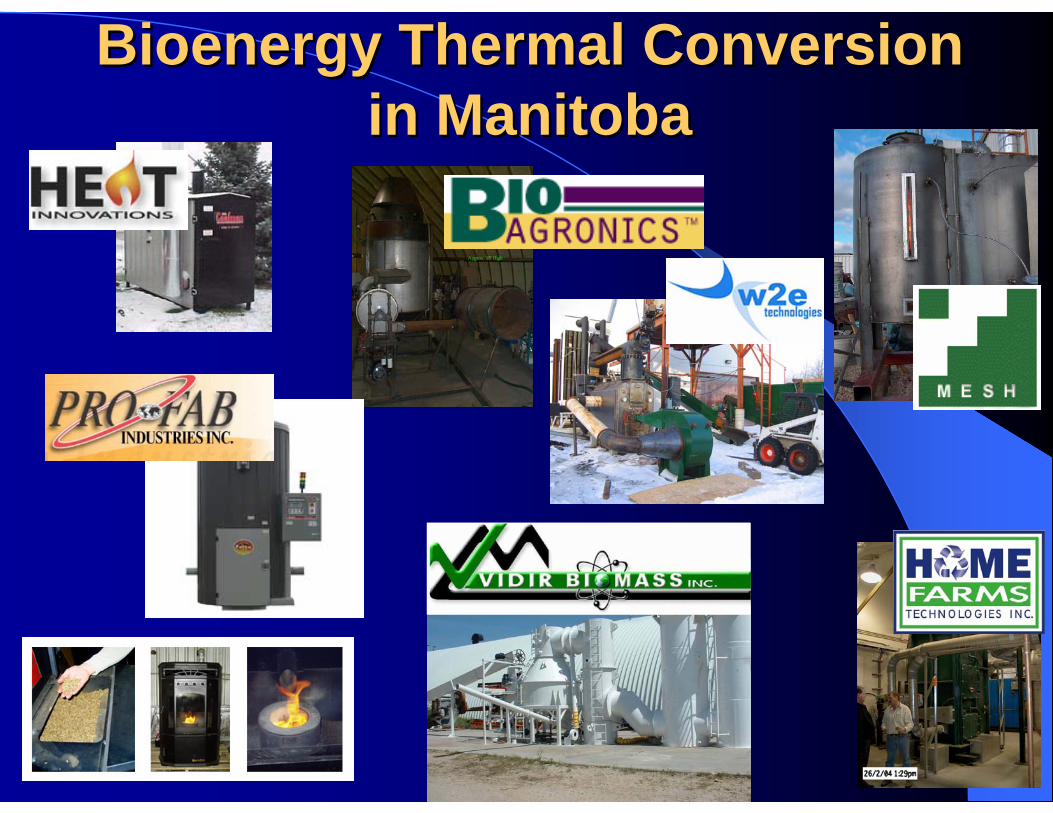
Bioenergy Thermal ConversionBioenergy Thermal Conversionin Manitobain Manitoba
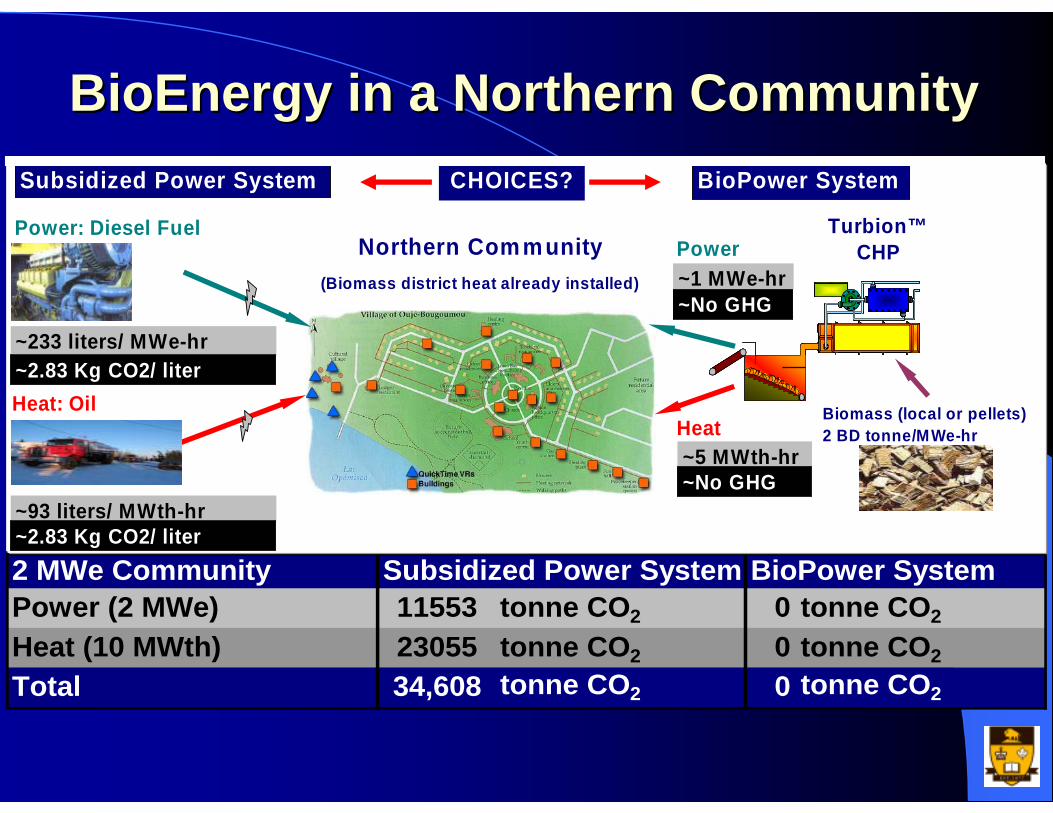
BioEnergy in a Northern CommunityBioEnergy in a Northern Community
2 MWe Community Subsidized Power System BioPower SystemPower (2 MWe) tonne CO2 0 tonne CO2
Heat (10 MWth) tonne CO2 0 tonne CO2
Total tonne CO2 0 tonne CO2
115532305534,608
Power: Diesel Fuel Turbion™ CHPNorthern Community
Heat: Oil Biomass (local or pellets)2 BD tonne/MWe-hr
Power
Heat
~233 liters/ MWe-hr~2.83 Kg CO2/ liter
~93 liters/ MWth-hr~2.83 Kg CO2/ liter
~1 MWe-hr~No GHG
~5 MWth-hr~No GHG
BioPower SystemSubsidized Power System
(Biomass district heat already installed)
CHOICES?
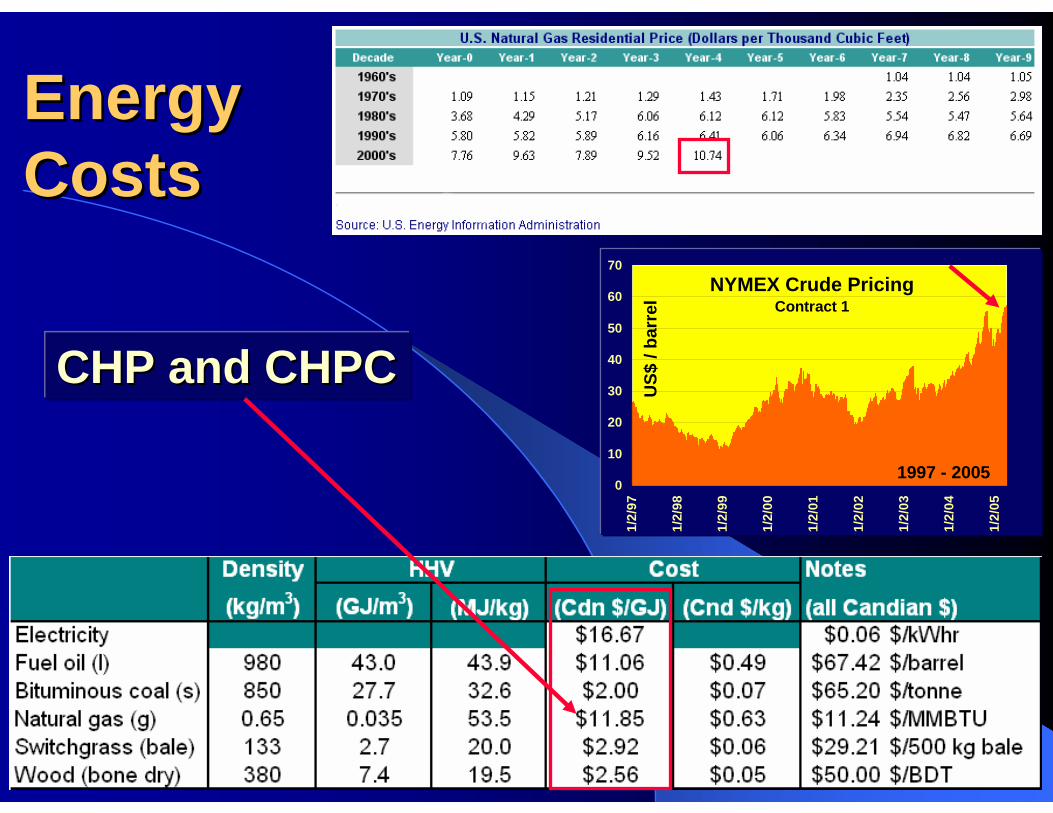
Energy Energy CostsCosts
NYMEX Crude PricingContract 1
0
10
20
30
40
50
60
70
1/2/
97
1/2/
98
1/2/
99
1/2/
00
1/2/
01
1/2/
02
1/2/
03
1/2/
04
1/2/
05
1997 - 2005
US$
/ ba
rrel
CHP and CHPCCHP and CHPC
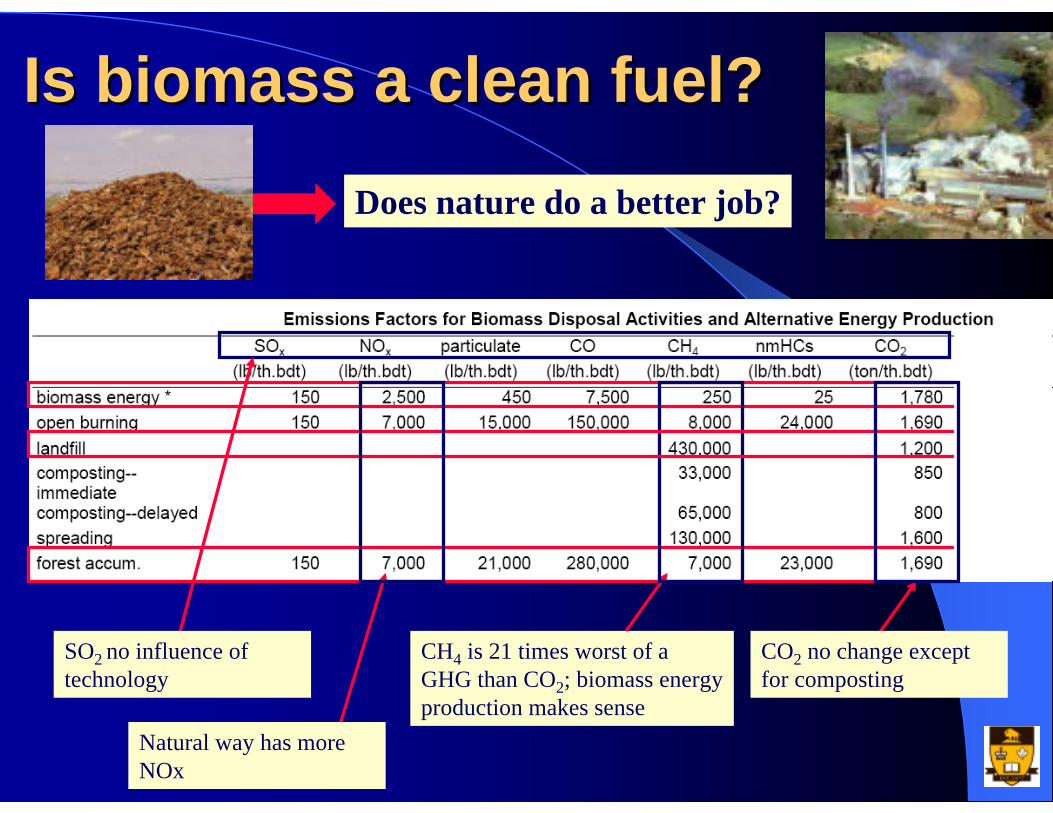
Is biomass a clean fuel?Is biomass a clean fuel?
CO2 no change except for composting
CH4 is 21 times worst of a GHG than CO2; biomass energy production makes sense
Natural way has more NOx
SO2 no influence of technology
Does nature do a better job?
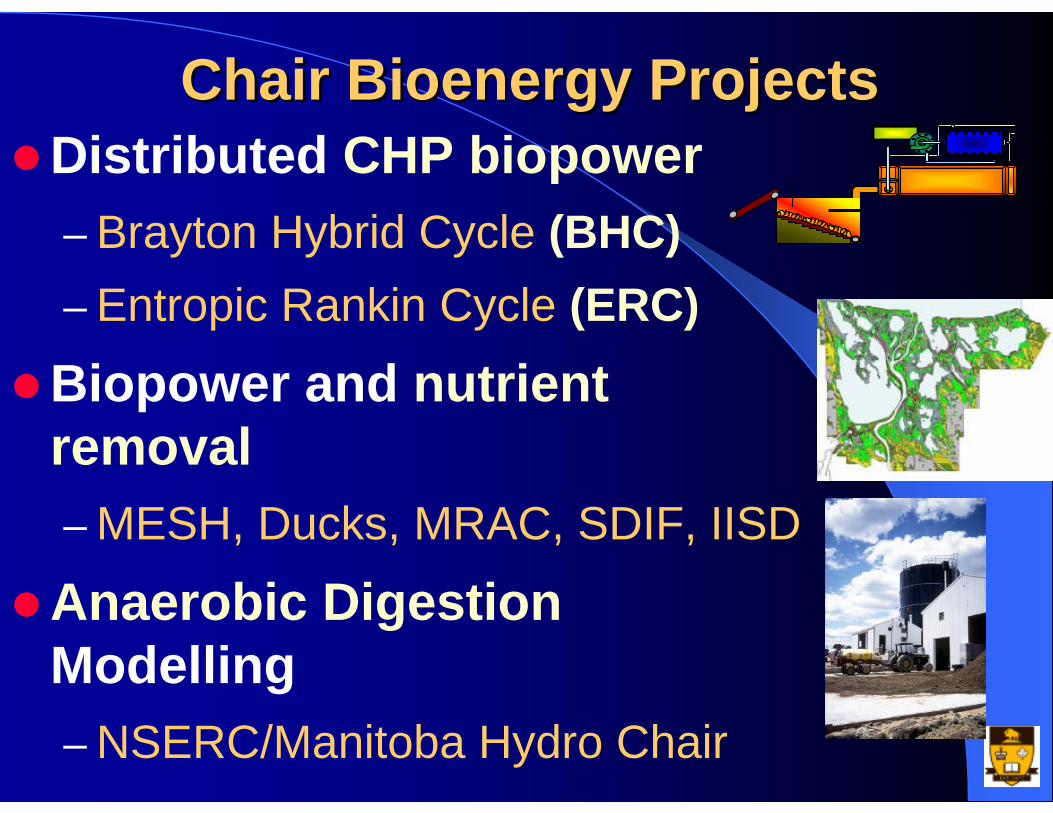
Chair Bioenergy ProjectsChair Bioenergy ProjectsDistributed CHP biopower– Brayton Hybrid Cycle (BHC)– Entropic Rankin Cycle (ERC)Biopower and nutrient removal– MESH, Ducks, MRAC, SDIF, IISD
Anaerobic DigestionModelling– NSERC/Manitoba Hydro Chair
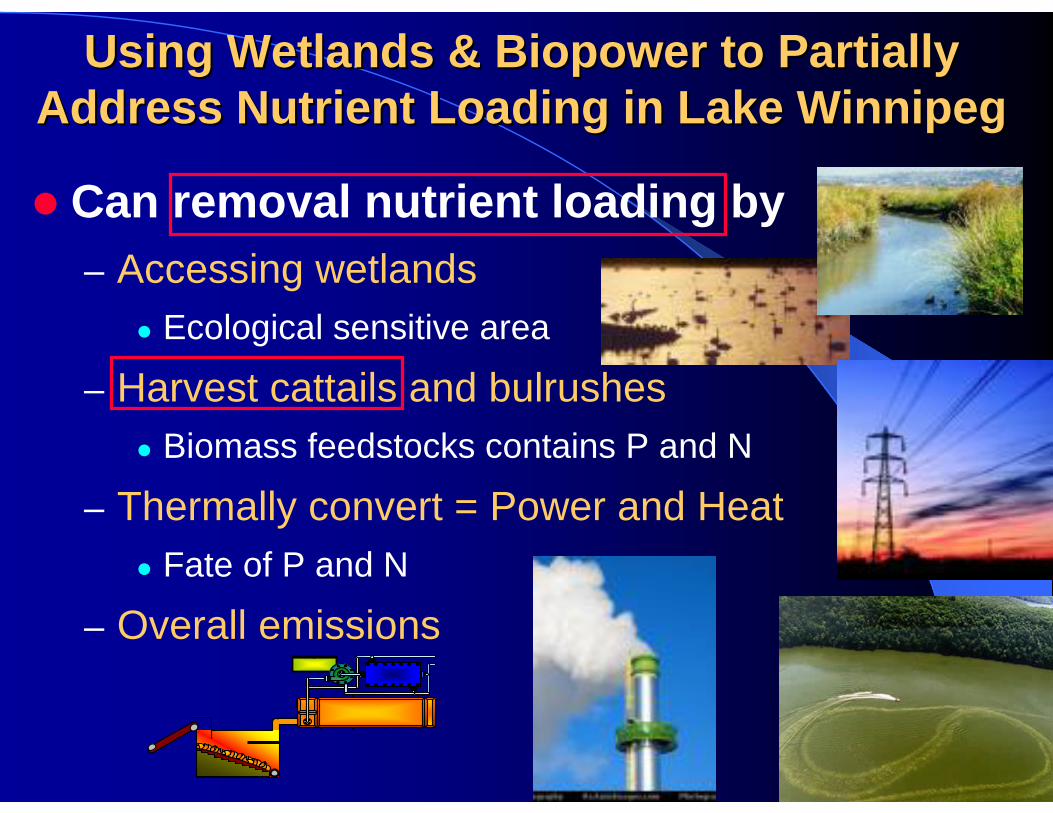
Using Wetlands & Biopower to Partially Using Wetlands & Biopower to Partially Address Nutrient Loading in Lake WinnipegAddress Nutrient Loading in Lake Winnipeg
Can removal nutrient loading by– Accessing wetlands
Ecological sensitive area
– Harvest cattails and bulrushesBiomass feedstocks contains P and N
– Thermally convert = Power and HeatFate of P and N
– Overall emissions
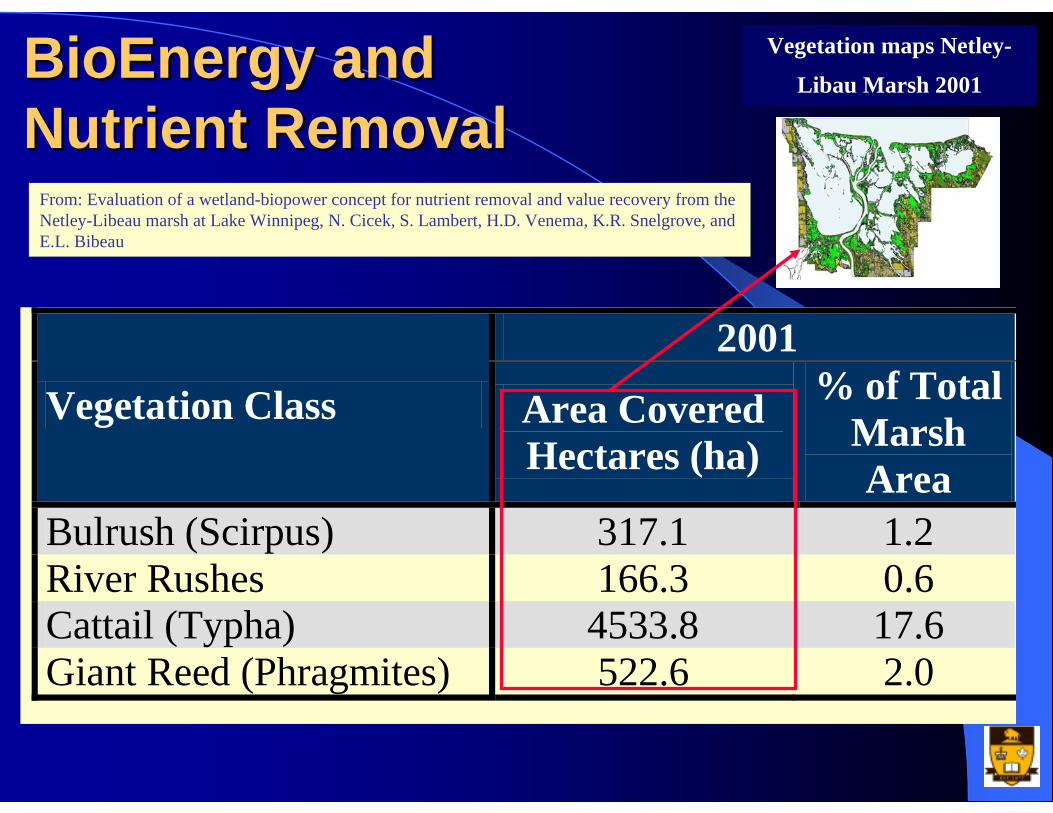
BioEnergy and BioEnergy and Nutrient RemovalNutrient Removal
2001
Vegetation Class Area Covered Hectares (ha)
% of Total Marsh Area
Bulrush (Scirpus) 317.1 1.2 River Rushes 166.3 0.6 Cattail (Typha) 4533.8 17.6 Giant Reed (Phragmites) 522.6 2.0
Vegetation maps Netley-
Libau Marsh 2001
From: Evaluation of a wetland-biopower concept for nutrient removal and value recovery from the Netley-Libeau marsh at Lake Winnipeg, N. Cicek, S. Lambert, H.D. Venema, K.R. Snelgrove, and E.L. Bibeau
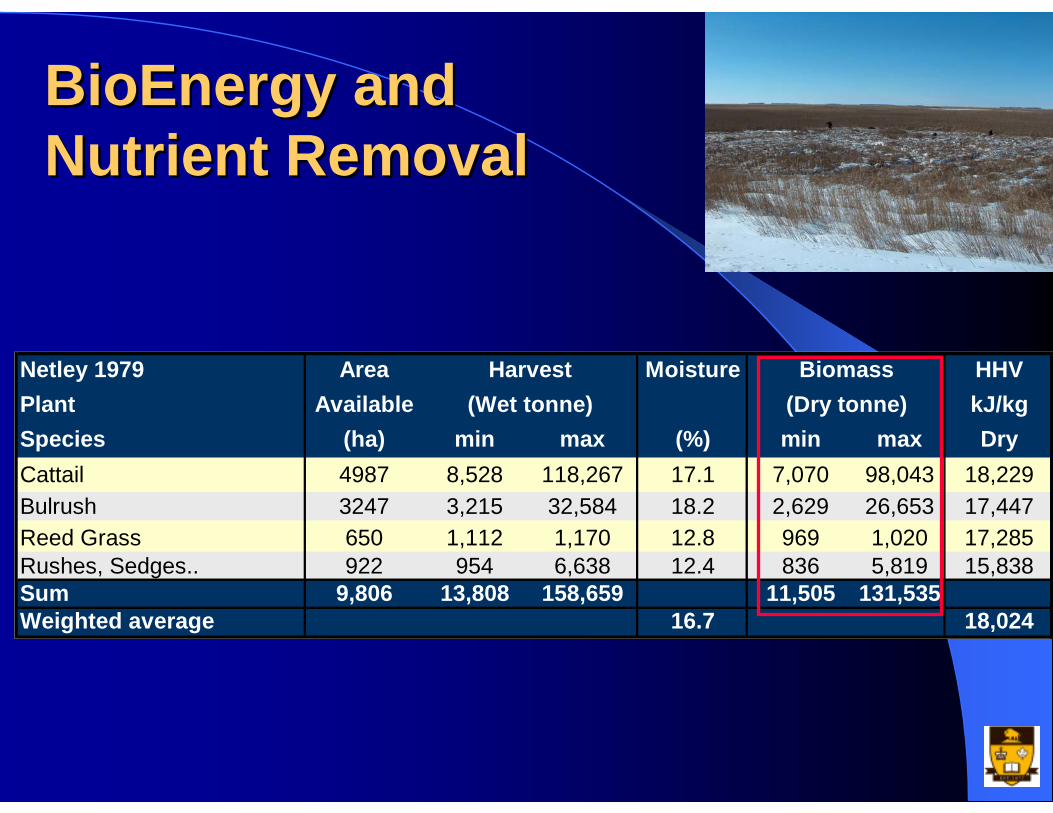
BioEnergy and BioEnergy and Nutrient RemovalNutrient Removal
Netley 1979 Area Moisture HHVPlant Available kJ/kgSpecies (ha) min max (%) min max DryCattail 4987 8,528 118,267 17.1 7,070 98,043 18,229Bulrush 3247 3,215 32,584 18.2 2,629 26,653 17,447Reed Grass 650 1,112 1,170 12.8 969 1,020 17,285Rushes, Sedges.. 922 954 6,638 12.4 836 5,819 15,838Sum 9,806 13,808 158,659 11,505 131,535Weighted average 16.7 18,024
Harvest Biomass(Wet tonne) (Dry tonne)
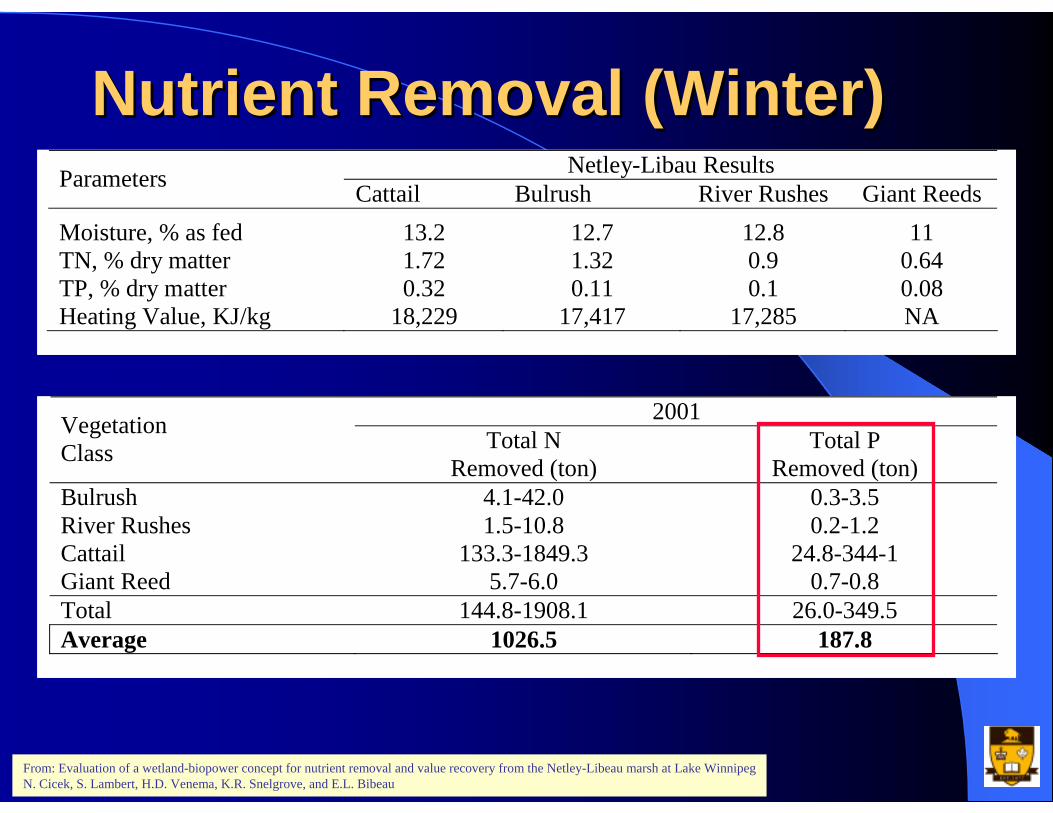
Nutrient Removal (Winter)Nutrient Removal (Winter)Netley-Libau Results Parameters Cattail Bulrush River Rushes Giant Reeds
Moisture, % as fed 13.2 12.7 12.8 11 TN, % dry matter 1.72 1.32 0.9 0.64 TP, % dry matter 0.32 0.11 0.1 0.08 Heating Value, KJ/kg 18,229 17,417 17,285 NA
2001 Vegetation Class Total N
Removed (ton) Total P
Removed (ton) Bulrush 4.1-42.0 0.3-3.5 River Rushes 1.5-10.8 0.2-1.2 Cattail 133.3-1849.3 24.8-344-1 Giant Reed 5.7-6.0 0.7-0.8 Total 144.8-1908.1 26.0-349.5 Average 1026.5 187.8
From: Evaluation of a wetland-biopower concept for nutrient removal and value recovery from the Netley-Libeau marsh at Lake WinnipegN. Cicek, S. Lambert, H.D. Venema, K.R. Snelgrove, and E.L. Bibeau
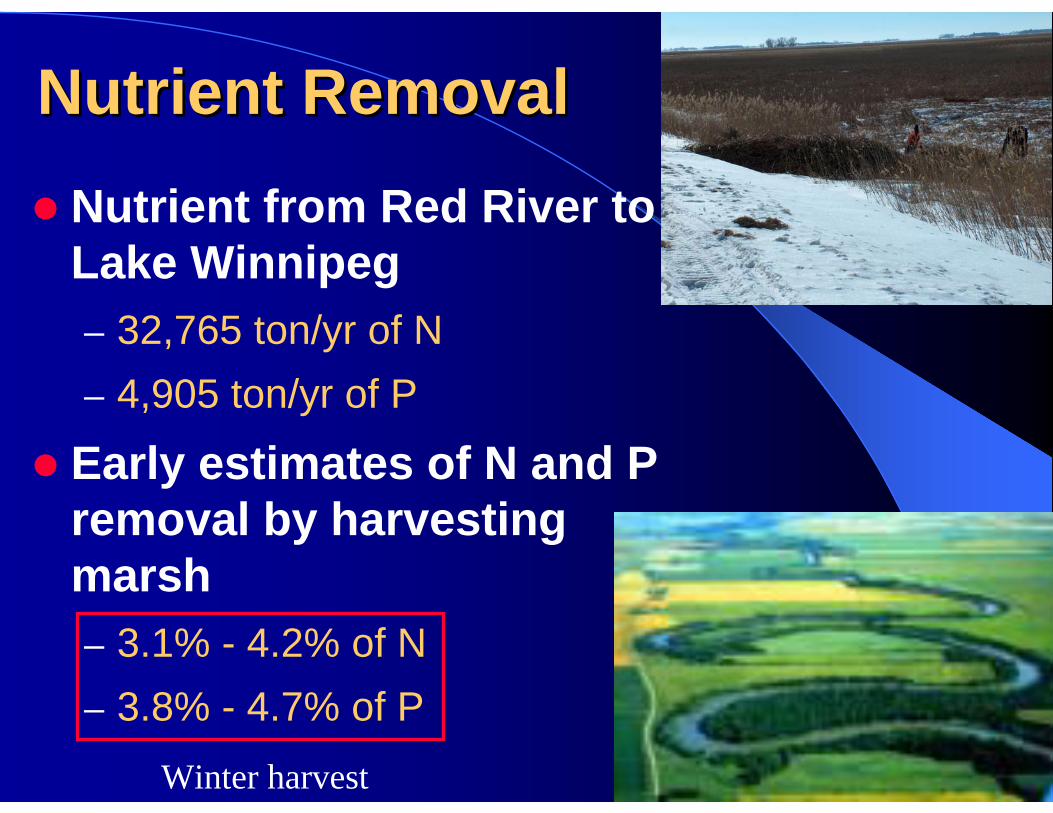
Nutrient RemovalNutrient RemovalNutrient from Red River to Lake Winnipeg– 32,765 ton/yr of N– 4,905 ton/yr of P
Early estimates of N and P removal by harvesting marsh– 3.1% - 4.2% of N– 3.8% - 4.7% of P
Winter harvest
BioEnergy and Nutrient BioEnergy and Nutrient Removal R&DRemoval R&D
Develop harvest methodsDetermine best time for harvest versus practical time Fate of N and P during thermal conversionBiomass feedstock costsOptimal use of feedstock for bioenergy for cost recovery
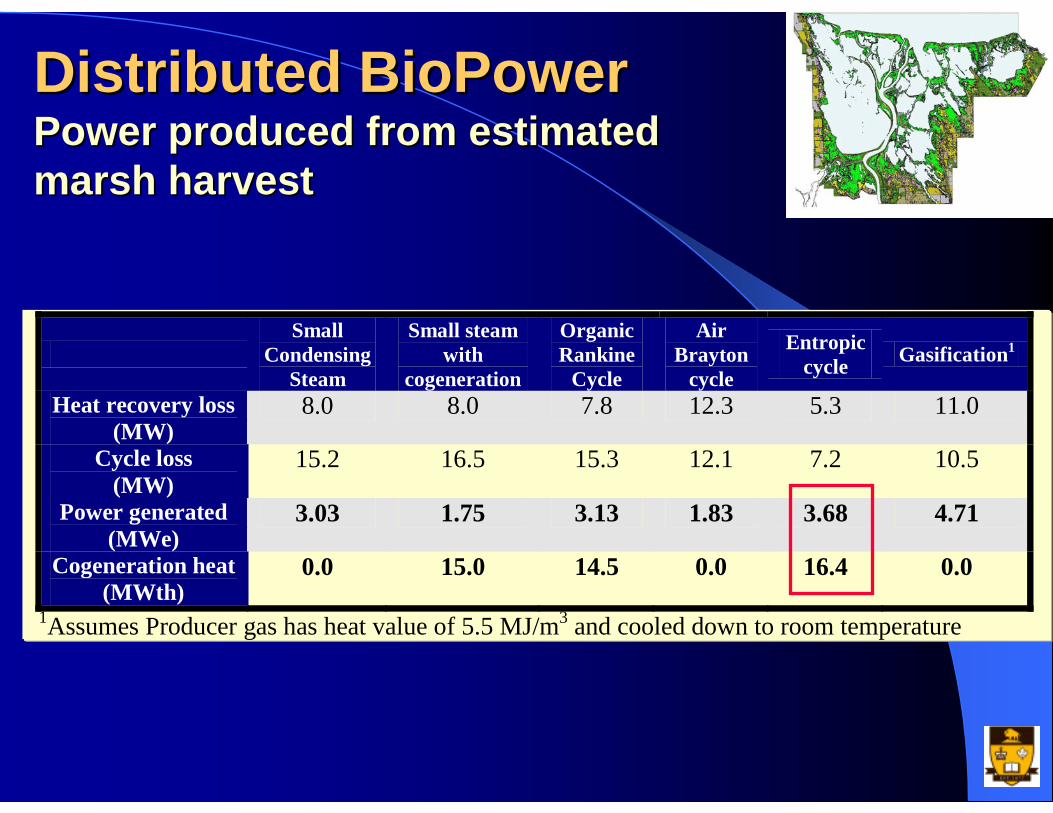
1
Distributed BioPowerDistributed BioPowerPower produced from estimated Power produced from estimated marsh harvestmarsh harvest
Small
Condensing Steam
Small steam with
cogeneration
Organic Rankine
Cycle
Air Brayton
cycle
Entropic cycle Gasification1
Heat recovery loss (MW)
8.0 8.0 7.8 12.3 5.3 11.0
Cycle loss (MW)
15.2 16.5 15.3 12.1 7.2 10.5
Power generated (MWe)
3.03 1.75 3.13 1.83 3.68 4.71
Cogeneration heat (MWth)
0.0 15.0 14.5 0.0 16.4 0.0
1Assumes Producer gas has heat value of 5.5 MJ/m3 and cooled down to room temperature
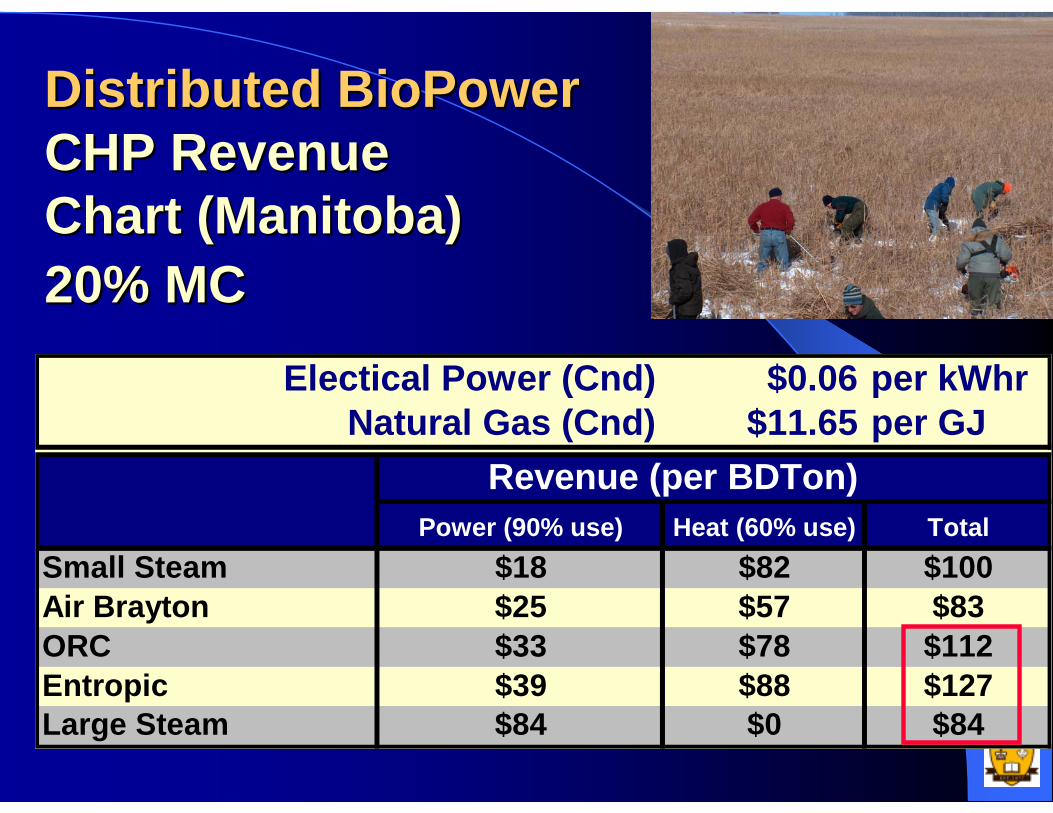
1
Distributed BioPowerDistributed BioPowerCHP Revenue CHP Revenue Chart (Manitoba)Chart (Manitoba)20% MC20% MC
$0.06 per kWhr$11.65 per GJ
Power (90% use) Heat (60% use) TotalSmall Steam $18 $82 $100Air Brayton $25 $57 $83ORC $33 $78 $112Entropic $39 $88 $127Large Steam $84 $0 $84
Electical Power (Cnd)Natural Gas (Cnd)
Revenue (per BDTon)

Anaerobic DigestersAnaerobic DigestersBiological degradation– Mesophilic bacteria (25oC-38oC)
Bio-Gas CH4 & CO2
Heat and powerReduction in – CH4 from manure & heating– N20 from manure & heating– CO2 from displaced electricity and heating– Water usage– Odour from barn, lagoons & land
Can address phosphates soil build-upOrganic fertilizer
Slurry In
Heat In
Heat InHeat In
Slurry In
Slurry In
Slurry In
Covered Lagoon
TPAD
Plug Flow
Complete Mix
Effluent Out Effluent Out
Effluent Out
Effluent Out
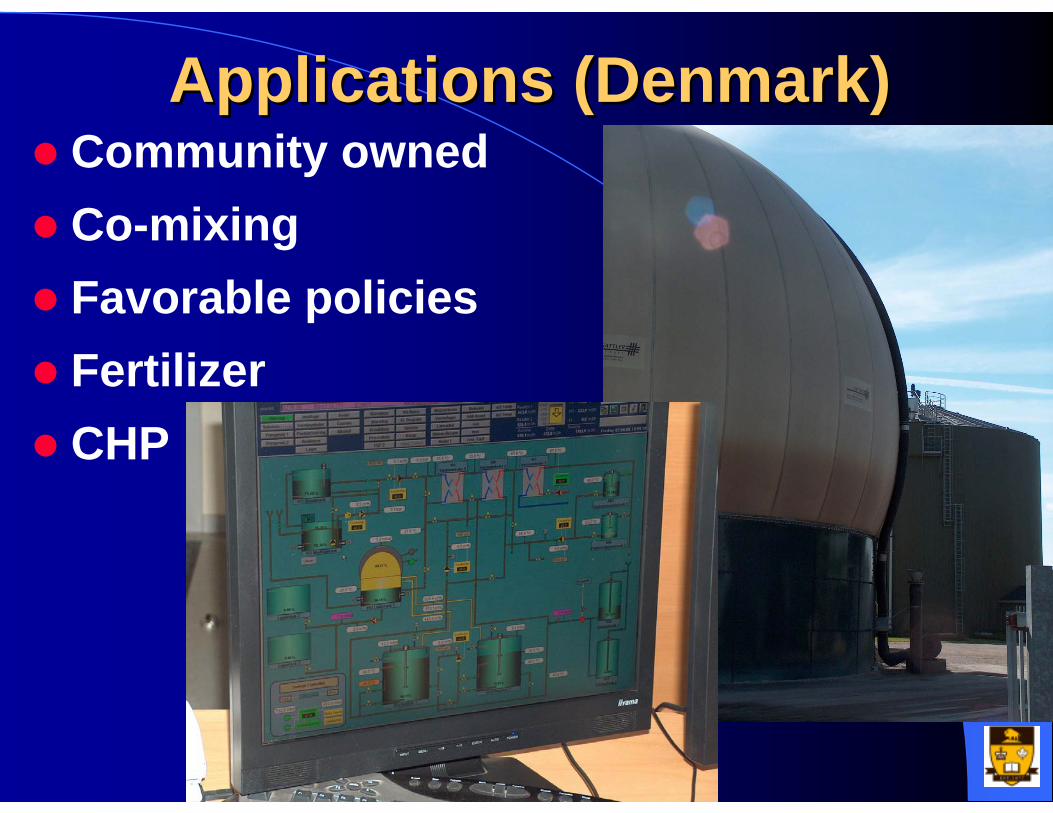
Applications (Denmark)Applications (Denmark)Community ownedCo-mixingFavorable policiesFertilizerCHP
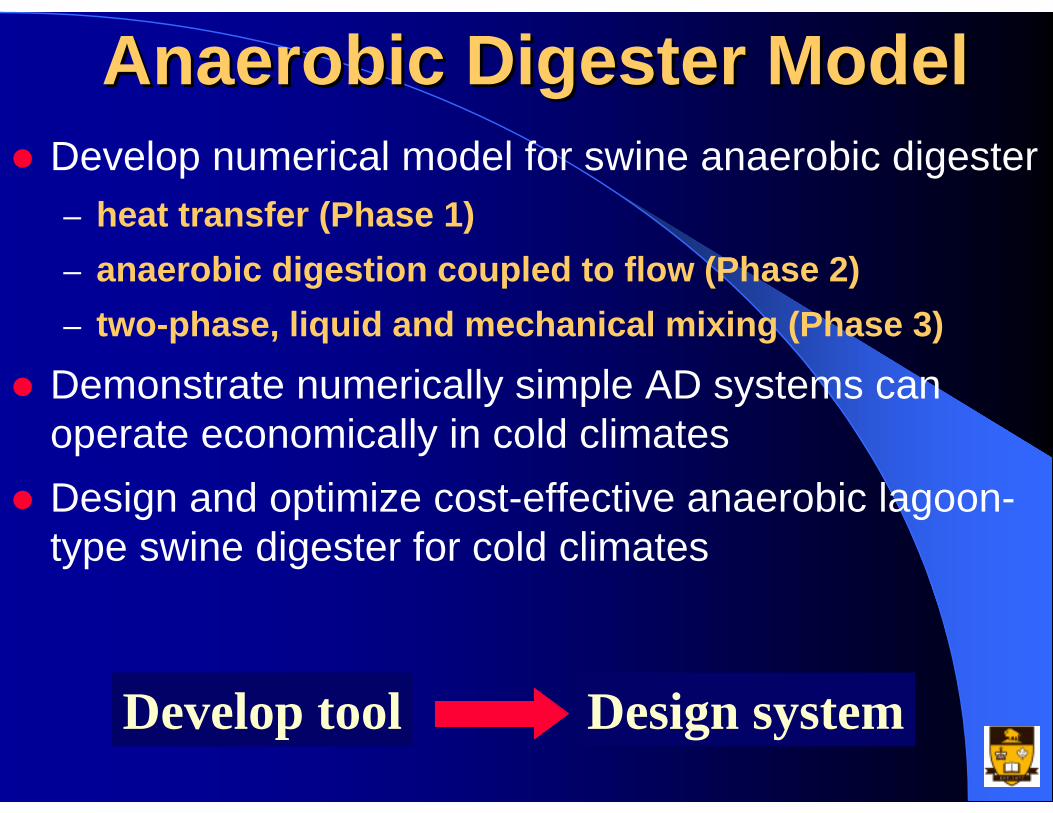
Anaerobic Digester ModelAnaerobic Digester ModelDevelop numerical model for swine anaerobic digester– heat transfer (Phase 1)– anaerobic digestion coupled to flow (Phase 2)– two-phase, liquid and mechanical mixing (Phase 3)
Demonstrate numerically simple AD systems can operate economically in cold climatesDesign and optimize cost-effective anaerobic lagoon-type swine digester for cold climates
Develop tool Design system
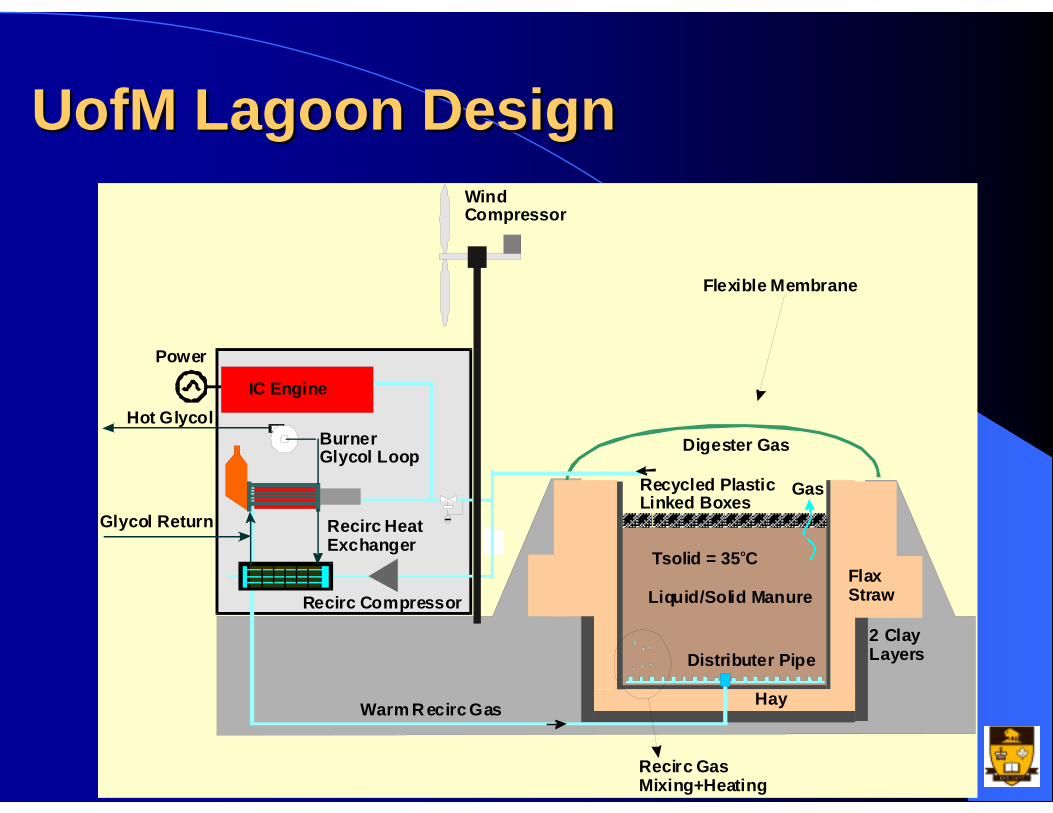
UofM Lagoon DesignUofM Lagoon Design
Power
Gas
Digester Gas
Recycled Plastic Linked Boxes
Tsolid = 35 Co
Recirc Compressor
Flexible Membrane
Hay
Distributer Pipe2 Clay Layers
Flax Straw
Recirc GasMixing+Heating
Liquid/Solid Manure
Warm Recirc Gas
Wind Compressor
BurnerGlycol Loop
Hot Glycol
Glycol Return Recirc Heat Exchanger
IC Engine
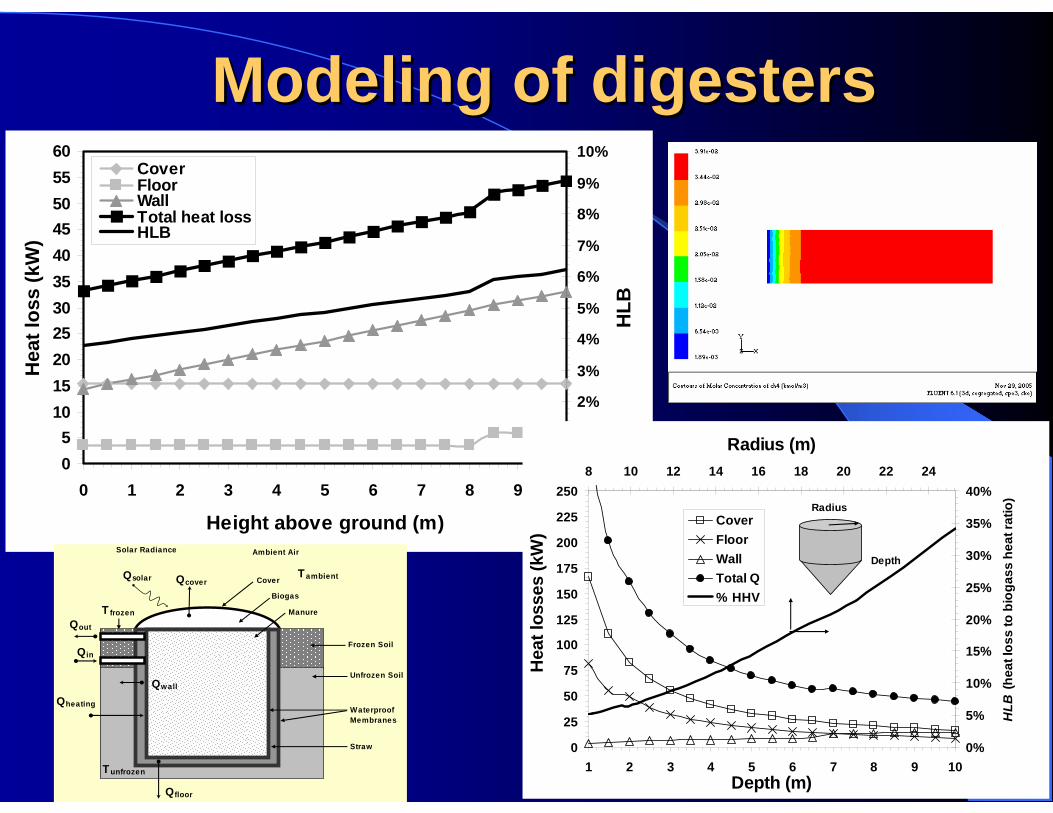
Modeling of digestersModeling of digesters
05
1015202530354045505560
0 1 2 3 4 5 6 7 8 9 10
Height above ground (m)
Hea
t los
s (k
W)
0%
1%
2%
3%
4%
5%
6%
7%
8%
9%
10%
HLB
CoverFloorWallTotal heat lossHLB
0
25
50
75
100
125
150
175
200
225
250
1 2 3 4 5 6 7 8 9 10Depth (m)
Hea
t los
ses
(kW
)
0%
5%
10%
15%
20%
25%
30%
35%
40%8 10 12 14 16 18 20 22 24
Radius (m)
HLB
(hea
t los
s to
bio
gass
hea
t rat
io)
CoverFloorWallTotal Q% HHV
Depth
Radius
Biogas
Unfrozen Soil
Cover
Frozen Soil
Manure
Straw
Waterproof Membranes
Ambient AirSolar Radiance
Qcover
Qwall
Qfloor
Qsolar
Qin
Qout
Qheating
T frozen
Tunfrozen
Tambient
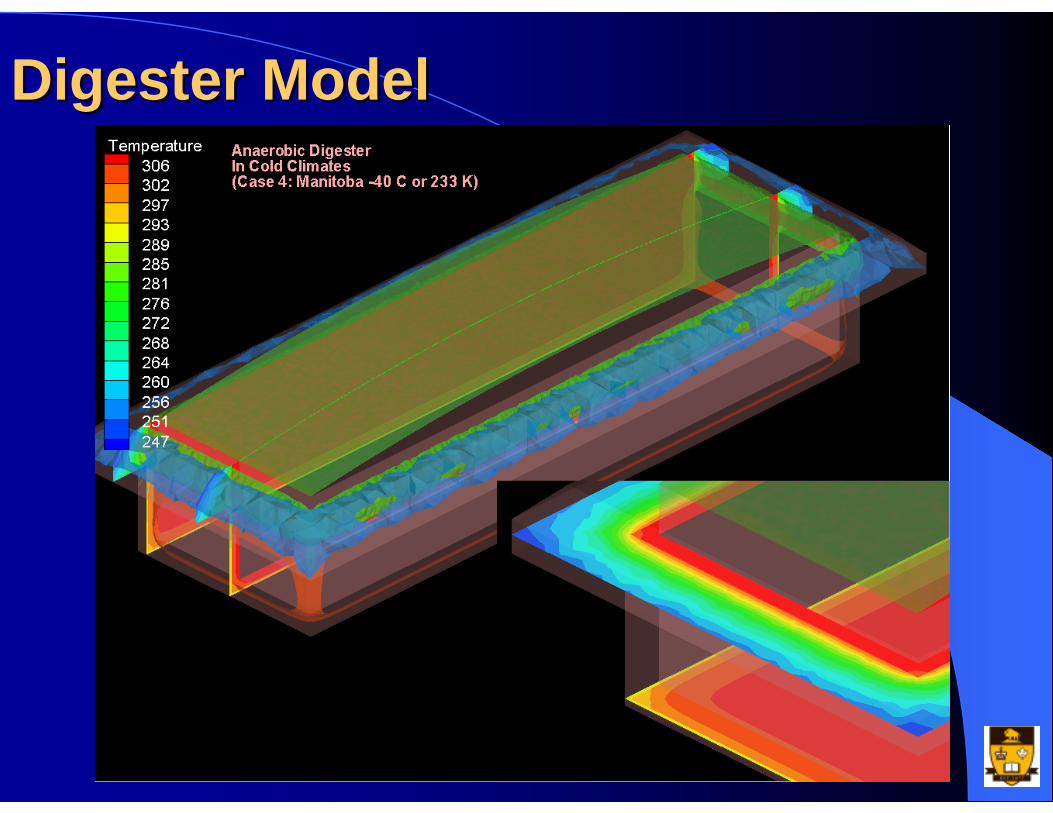
Digester ModelDigester Model
NSERC/Manitoba Hydro Chair in Alternative Energy
AcknowledgementAcknowledgement
Presentations on alternative energyPresentations on alternative energyhttp://www.umanitoba.ca/engineering/mech_and_ind/prof/bibeau/