NREL/CP-500-41606 and Prospects for Active … turbine aerodynamics remains a challenging and...
15
A national laboratory of the U.S. Department of Energy Office of Energy Efficiency & Renewable Energy National Renewable Energy Laboratory Innovation for Our Energy Future Wind Turbine Blade Flow Fields and Prospects for Active Aerodynamic Control Preprint S. Schreck and M. Robinson To be presented at the ASME 2007 Fluids Engineering Division Summer Meeting San Diego, California July 30–August 2, 2007 Conference Paper NREL/CP-500-41606 August 2007 NREL is operated by Midwest Research Institute ● Battelle Contract No. DE-AC36-99-GO10337
Transcript of NREL/CP-500-41606 and Prospects for Active … turbine aerodynamics remains a challenging and...
A national laboratory of the U.S. Department of EnergyOffice of Energy Efficiency & Renewable Energy
National Renewable Energy Laboratory Innovation for Our Energy Future
Wind Turbine Blade Flow Fields and Prospects for Active Aerodynamic Control Preprint S. Schreck and M. Robinson To be presented at the ASME 2007 Fluids Engineering Division Summer Meeting San Diego, California July 30–August 2, 2007
Conference Paper NREL/CP-500-41606 August 2007
NREL is operated by Midwest Research Institute ● Battelle Contract No. DE-AC36-99-GO10337

NOTICE
The submitted manuscript has been offered by an employee of the Midwest Research Institute (MRI), a contractor of the US Government under Contract No. DE-AC36-99GO10337. Accordingly, the US Government and MRI retain a nonexclusive royalty-free license to publish or reproduce the published form of this contribution, or allow others to do so, for US Government purposes.
This report was prepared as an account of work sponsored by an agency of the United States government. Neither the United States government nor any agency thereof, nor any of their employees, makes any warranty, express or implied, or assumes any legal liability or responsibility for the accuracy, completeness, or usefulness of any information, apparatus, product, or process disclosed, or represents that its use would not infringe privately owned rights. Reference herein to any specific commercial product, process, or service by trade name, trademark, manufacturer, or otherwise does not necessarily constitute or imply its endorsement, recommendation, or favoring by the United States government or any agency thereof. The views and opinions of authors expressed herein do not necessarily state or reflect those of the United States government or any agency thereof.
Available electronically at http://www.osti.gov/bridge
Available for a processing fee to U.S. Department of Energy and its contractors, in paper, from:
U.S. Department of Energy Office of Scientific and Technical Information P.O. Box 62 Oak Ridge, TN 37831-0062 phone: 865.576.8401 fax: 865.576.5728 email: mailto:[email protected]
Available for sale to the public, in paper, from: U.S. Department of Commerce National Technical Information Service 5285 Port Royal Road Springfield, VA 22161 phone: 800.553.6847 fax: 703.605.6900 email: [email protected] online ordering: http://www.ntis.gov/ordering.htm
Printed on paper containing at least 50% wastepaper, including 20% postconsumer waste
WIND TURBINE BLADE FLOW FIELDS AND
PROSPECTS FOR ACTIVE AERODYNAMIC CONTROL
S. Schreck and M. Robinson Applied Research Division
NREL’s National Wind Technology Center Golden, CO 80401
ABSTRACT
As wind turbines continue to grow larger, problems associated with adverse aerodynamic loads will grow more critical. Thus, the wind energy technical community has begun to seriously consider the potential of aerodynamic control methodologies for mitigating adverse aerodynamic loading. Spatial and temporal attributes of the structures and processes present in these flow fields hold important implications for active aerodynamic control methodologies currently being contemplated for wind turbine applications. The current work uses complementary experimental and computational methodologies, to isolate and characterize key attributes of blade flow fields associated with axisymmetric and yawed turbine operation. During axisymmetric operation, a highly three-dimensional, shear layer dominated flow field yields rotational augmentation of both mean and standard deviation levels of aerodynamic forces. Under yawed operating conditions, pseudo-sinusoidal inflow angle oscillations elicit dynamic stall, which significantly intensifies aerodynamic load production. Both rotationally augmented and dynamically stalled flows possess attributes likely to pose central challenges for turbine flow control. Whether active control of turbine aerodynamics can help alleviate adverse aerodynamic loads will depend on comprehension and command of the issues documented herein. NOMENCLATURE Cn normal force coefficient c chord length (m) cp pressure coefficient ((p-p∞)/q) Hz Hertz LFA local inflow angle (deg) Employees of the Midwest Research Institute under Contract No. DE-AC36-99GO10337 with the U.S. Dept. of Energy have authored this work. The U.S. Government retains, and the publisher, by accepting the article for publication, acknowledges that the U.S. Government retains a non-exclusive, paid-up, irrevocable, worldwide license to publish or reproduce the published form of this work, or allow others to do so, for U.S. Government purposes.
m meter msec millisecond p static pressure (Pa) p∞ freestream static pressure (Pa) q dynamic pressure (Pa) r radial distance from hub (m) R blade length (m) RPM revolutions/minute s second U∞ test section speed (m/s) Uloc local inflow velocity (m/s) x chord location (m) Ψ blade azimuth angle (deg) Ω blade rotation rate (rad/s) γ rotor yaw angle (deg) INTRODUCTION
Wind turbine aerodynamics remains a challenging and crucial research area for wind energy. Clearly, steady-state aerodynamic performance is essential to turbine energy capture, since blade aerodynamic forces produce mechanical energy that is subsequently converted to electrical energy. However, more recent inquiry has focused on adverse time varying aerodynamic loads that wind turbines frequently suffer during routine service. These undesirable aerodynamic loads impose excessive stresses on turbine blades and gear boxes, and appreciably shorten machine service life. At present, the wind energy technical community is contemplating the utility of various aerodynamic control methodologies for mitigating adverse aerodynamic loading.
Wind turbine blade aerodynamic phenomena can be broadly categorized according to the operating state of the machine, and two particular aerodynamic phenomena assume crucial importance. At zero and low rotor yaw angles, rotational augmentation determines blade aerodynamic response. At moderate to high yaw angles, dynamic stall dominates blade aerodynamics. As described herein, the spatial and temporal attributes of the structures and processes present
1
in these flow fields hold important implications for active aerodynamic control methodologies currently being considered for wind turbine applications. Rotational Augmentation
Augmentation of rotating blade aerodynamic properties, including stall delay and lift enhancement, was first observed for airplane propellers and qualitatively explained in terms of centrifugal and Coriolis accelerations.[1] Some time later, analytical modeling quantitatively accounted for key elements of the rotating blade flow field.[2]
Subsequent rotational augmentation research was carried out for helicopter rotors. Analytical modeling determined that rotationally induced cross flows played an important role in blade lift production.[3] Experimental research [4] suggested that centrifugal forces are important in the presence of flow separation, but of limited influence otherwise.
Prior research concerning rotational augmentation of airplane propeller and helicopter rotor aerodynamics aided later work aimed at wind turbines. However, wind turbines extract energy from flowing air, while propellers and rotors inject energy. This key distinction pointed out the need for rotational augmentation research specific to wind turbines.
Early wind turbine field testing aimed at rotational augmentation affirmed the importance of blade geometry with respect to rotational influences.[5] A wind tunnel experiment showed that blade geometry coupled with blade rotation maintained blade lift under conditions in which lift otherwise would significantly decline.[6] Subsequent wind tunnel research determined that rotational augmentation was most active at the inboard portion of the turbine blade.[7] Concurrent analytical modeling of rotational augmentation has furnished better comprehension of the aerodynamics underlying this phenomenon, and provided foundational predictive capabilities for design and analysis.[8-13]
More recently, analysis of turbine aerodynamics measurements acquired during controlled wind tunnel experiments, in conjunction with validated computational results, have provided key physical insights regarding rotationally augmented flow fields.[14-17] Dynamic Stall
Viewed simplistically as a two-dimensional process, dynamic stall initiates when aerodynamic surface angle of attack (α) dynamically exceeds the static stall α. Soon thereafter, unsteady boundary layer separation gives rise to a small but energetic dynamic stall vortex, which appears near the leading edge. This vortex quickly grows, convects rapidly downstream, and soon sheds from the lifting surface.
During this process, the dynamic stall vortex generates a region of low pressure on the lifting surface, causing dramatic lift amplification beyond static levels, followed by abrupt deep stall at vortex shedding. [18,19] Surface pressure signatures confirm that dynamic stall occurs on horizontal axis wind turbine blades [20-24], and contributes significantly to wind turbine rotor loads and yaw dynamics. [25]
The complexity of dynamic stall is compounded by three-dimensionality, which corresponds to nonunformity of the vortex structure along the length of the vortex tube. Dynamic stall vortex three-dimensionality has been visualized for a rectangular wing pitching in a wind tunnel.[26] These and other visualizations have been corroborated with time varying surface pressure measurements, which also were acquired using rectangular wings pitching in wind tunnels.[27-31]
More recently, dynamic stall vortex three-dimensionality was observed clearly and analyzed in detail for wind turbine blades during yawed turbine operation. This was accomplished via analysis of time varying surface pressure data acquired from the NREL Unsteady Aerodynamics Experiment field test [32] and wind tunnel experiment [33,34] EXPERIMENTAL PROCEDURES
All surface pressure data used in the current work were acquired during wind tunnel testing of the NREL UAE (National Renewable Energy Laboratory Unsteady Aerodynamics Experiment) horizontal axis wind turbine. This machine was documented in detail for earlier field testing phases of the experiment.[35-38] Subsequently, several UAE configurations were tested in the NASA Ames 80 ft x 120 ft wind tunnel, all of which are described by Hand, et al.[39]
Wind Turbine
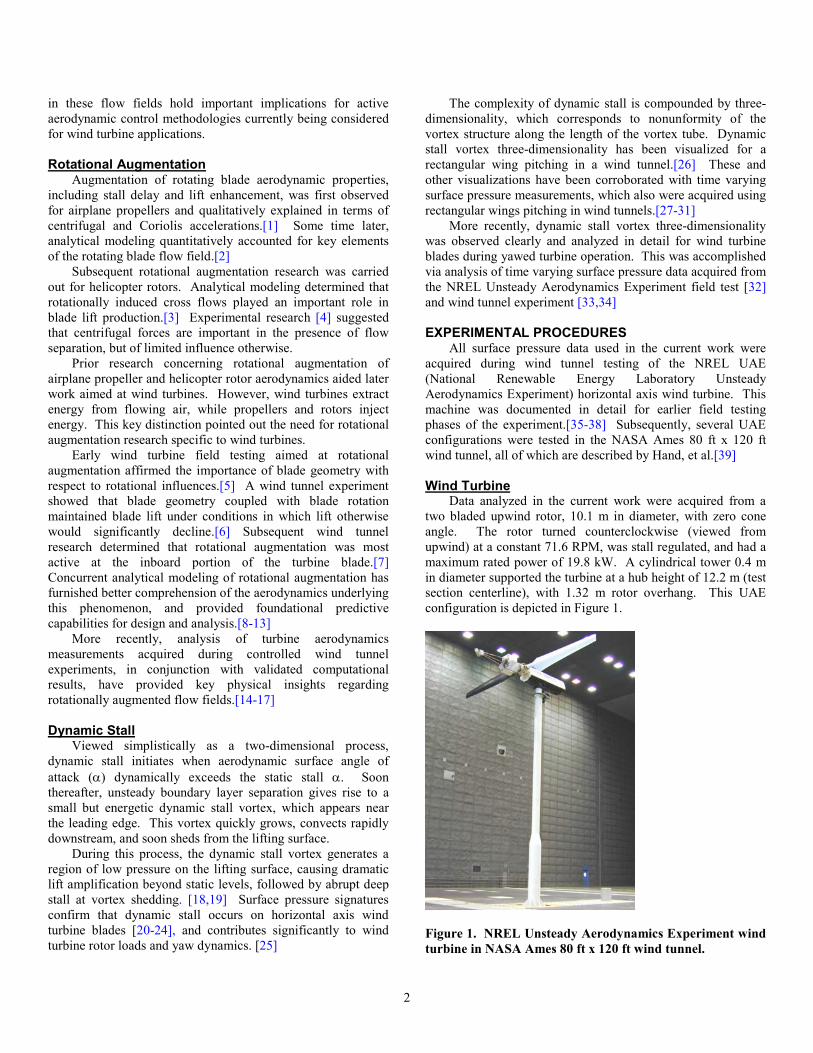
Data analyzed in the current work were acquired from a two bladed upwind rotor, 10.1 m in diameter, with zero cone angle. The rotor turned counterclockwise (viewed from upwind) at a constant 71.6 RPM, was stall regulated, and had a maximum rated power of 19.8 kW. A cylindrical tower 0.4 m in diameter supported the turbine at a hub height of 12.2 m (test section centerline), with 1.32 m rotor overhang. This UAE configuration is depicted in Figure 1.
Figure 1. NREL Unsteady Aerodynamics Experiment wind turbine in NASA Ames 80 ft x 120 ft wind tunnel.
2

Blade Geometry
The blades used throughout the NASA Ames wind tunnel test were both twisted and tapered. Blade taper distribution is apparent in Figure 2, with chord tapering from 0.737 m at 0.25R to 0.356 m at the tip. Blade section twist decreased from 22.1° at 0.25R to 0.0° at the tip. Between 0.25R and the tip, blade cross-section was uniform, corresponding to the S809 airfoil. The airfoil section at 0.25R was joined to the pitch shaft section at 0.12R using linear segments to yield an uninterrupted transition between these two disparate contours. The blade pitched about an axis located 0.30c aft of the leading edge, and centered between the blade upper and lower surfaces at that chord location. Design procedures, constraints, and measures of merit for this blade have been documented in detail.[39,40]
Figure 2. Blade cross-section and planform, showing pressure tap locations.
Pressure Instrumentation
The black blade shown in Figure 1 was equipped with pressure taps at the locations indicated in Figure 2 to acquire detailed surface pressure data. A full pressure tap distribution
consisted of 22 taps distributed on the airfoil section as shown in the upper portion of Figure 2. At the full distributions, taps were more densely distributed near the blade leading edge to better resolve the steep gradients typically present there, as well as the small structures that initiate there during dynamic stall.
Pressure taps were flush mounted at the blade surface, and had inside diameters of 0.69 mm. From the taps, stainless steel hypodermic tubes having inside diameters of 0.69 mm transmitted the surface pressures to the pressure transducers. Hypodermic tubing lengths were minimized to mitigate pressure delay and dispersion effects. Pressures were measured by five Pressure Systems Incorporated ESP-32 electronically scanned pressure transducers located inside the blade near the five full pressure tap distributions. Each of the transducer pressure inputs was scanned at 520.8 Hz. In conjunction with the tubing frequency response, this provided antialiased digitization and minimal gain variation out to 55 Hz.[35] Test section flow speed and air properties were measured using the NASA Ames 80 ft x 120 ft wind tunnel air data system described by Zell.[41]
Time records of cp were integrated over the sectional chord to obtain time records of Cn. Then, time records of cp and Cn were processed to obtain means and standard deviations for cp and Cn. For the zero yaw measurements, only those data corresponding to the upper half of the rotor disk were extracted and analyzed in the current study. This was done to eliminate tower influences from rotational flow modifications. Local Inflow Measurement
Inflow angles were measured near the five full pressure tap distributions using five-hole probes. Probes were mounted on cylindrical stalks at 0.34R, 0.51R, 0.67R, 0.84R, and 0.91R, with the probe tip 0.80c upstream of the blade leading edge. Probes were angled 20° downward relative to the local chord line, allowing measurement of local inflow angles between –20° and 60°. Five-hole probe pressures were measured using the ESP-32 transducers described above, and local inflow angle (LFA) was derived from these measurements. LFA was defined as the angle between the local inflow vector (Uloc) and the local blade chord line, measured at the probe tip, as depicted in Figure 3. LFA was defined in a plane parallel to the local chord line and orthogonal to the blade axis.
Figure 3. Definition of local inflow angle (LFA) and normal force (N).
3
Data Acquisition Protocol
Data acquisition procedures were designed to decouple the principal physical phenomena that govern blade aerodynamics, and thus were structured in an incremental manner. First, blade aerodynamics were characterized for nonrotating conditions. Then, data were acquired with the blades rotating at zero yaw, for a range of wind speeds. Finally, with the rotor still turning, yawed conditions were characterized for a matrix of wind speeds and yaw angles.
To isolate the effects of rotational influences, a baseline was needed that excluded rotational effects. This was accomplished by halting turbine blade rotation and acquiring pressure data for the stationary (parked) blade. To achieve stationary blade conditions, the instrumented turbine blade was first fixed at the 12 o’clock azimuth position. Then, for U∞ = 20 m/s, turbine blade pitch was incremented in 5° steps, from 90° to -15° and -15° to 90°. Blade pitch was incremented in both negative and positive directions to disclose any hysteresis in blade aerodynamic force response. At each pitch angle, one 13 second data record was acquired, and cp data from each record were integrated over the sectional chord to obtain time records of Cn. Finally, these 13 second time records of cp and Cn were time averaged to yield mean values for each blade pitch angle. Prior to acquiring data at each pitch angle, appropriate delays were included to allow time for pitching, blade flow field equilibration, and wake relaxation.
To quantify the effects of rotational influences, data were collected with the rotor turning at 71.6 RPM. Turbine blade plane of rotation was maintained orthogonal to the test section centerline, yielding γ = 0°. Blade pitch angle was held constant at 3.0°. U∞ was varied between 5 m/s and 25 m/s, in nominal 1 m/s increments. At each U∞, a data record of 30 seconds duration was acquired, corresponding to 36 blade rotations.
Characterizations of yawed conditions also were carried out with the rotor turning at 71.6 RPM. Again, U∞ was varied between 5 m/s and 25 m/s, in increments of approximately 1 m/s. At each U∞, turbine blade plane of rotation was yawed through the range 10° ≤ γ ≤ 60°, in increments of 10°. At each combination of U∞ and γ, a 30 second data set corresponding to 36 blade rotations was acquired.
The zero yaw experiments were carried out using two blade configurations. Initially, the five-hole probes and stalks were mounted on the blade, and LFA was measured concurrently with other blade aerodynamic properties. Later, the probes and stalks were removed, yielding a 'clean' blade with a flow field free of any disruptions due to the stalks or probes. Measurements then were repeated using this otherwise identical machine configuration and virtually identical inflow conditions. This approach allowed accurate measurement of LFA, provided a blade flow field free of intrusions, and allowed for assessment of flow field stability and repeatability. Because of the greater robustness of dynamically stalled flow fields, yawed rotor experiments were carried out with the five-hole probes and stalks mounted on the blade during surface pressure data acquisition.
Inflow Angle and Force Nondimensionalization Derivation of angle of attack and lift coefficient for
rotating blades using measurements on or near the blade remains a challenging and essential area of inquiry [5,7,42-46]. However, in the current work, these dependencies were excluded in order to simplify physical relationships and concentrate analyses on the blade flow field. This was accomplished by analyzing measured LFA and Cn in lieu of derived α and Cl.
Normalization of aerodynamic forces also presents challenges. In the current work, normal force was nondimensionalized by local dynamic pressure. Local dynamic pressure was computed as the difference between test section static pressure (p∞) and local total pressure. Local total pressure was sensed at each full pressure tap distribution as the highest pressure in the tap distribution. This methodology for quantifying dynamic pressure has been analyzed previously, and found to induce average errors in dynamic pressure of approximately 1.0 percent.[14] RESULTS AND DISCUSSION
Results and discussion below are divided according to turbine operating state into two sections, axisymmetric operation and yawed operation. As summarized above, these two operating states produced flow fields dominated by rotational augmentation and by dynamic stall, respectively. Within each of these two sections, results and discussion follow the same progression. First, inflow relationships are described. Then, typical data for mean and standard deviation of normal force are presented. Finally, representative two-dimensional flow field sections are shown, followed by three-dimensional planform representations.
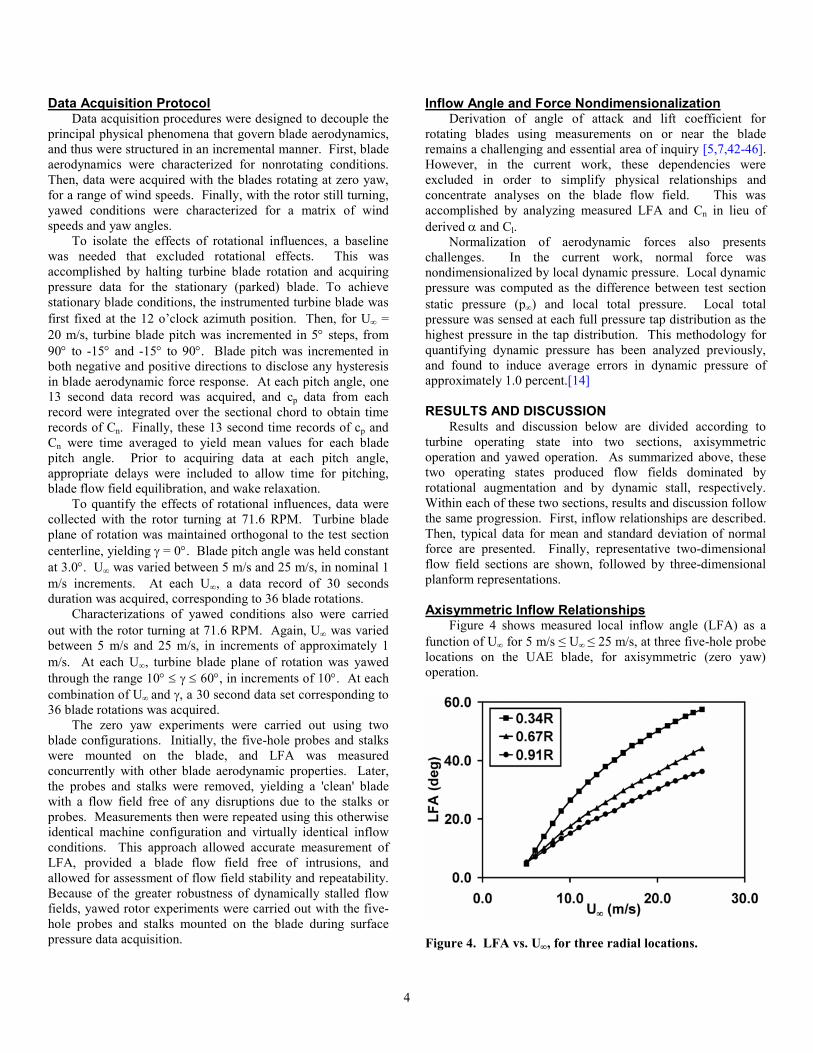
Axisymmetric Inflow Relationships
Figure 4 shows measured local inflow angle (LFA) as a function of U∞ for 5 m/s ≤ U∞ ≤ 25 m/s, at three five-hole probe locations on the UAE blade, for axisymmetric (zero yaw) operation.
Figure 4. LFA vs. U∞, for three radial locations.
4
At U∞ = 5 m/s, LFA began at approximately 5° for all three
radial locations. As U∞ increased, plots corresponding to all three radial locations rose smoothly, but diverged with increasing U∞. Divergence was prompted by differing LFA sensitivities to U∞, which was greatest at 0.34R and declined progressively for radial stations farther outboard on the blade. LFA data acquired at 0.51R and 0.84R were consistent with these trends, but are not presented here for plot clarity. Data in Figure 4 correspond to a fixed blade pitch angle of 3°.
These LFA-U∞ relationships are governed by a velocity vector triangle that describes local inflow relationships for zero yaw operation. In general (neglecting axial and rotational induction), LFA is proportional to tan-1(U∞/Ωr). Thus, assuming that local blade section orientation (pitch) and rotation rate (Ω) both remain constant, higher U∞ will prompt higher LFA. Clearly, this statement applies directly to constant speed, stall controlled turbines. However, the same remains applicable to variable speed, pitch controlled machines, within the bandwidth constraints imposed by component inertia, drive system authority, control parameter settings. Axisymmetric Mean Cn Augmentation
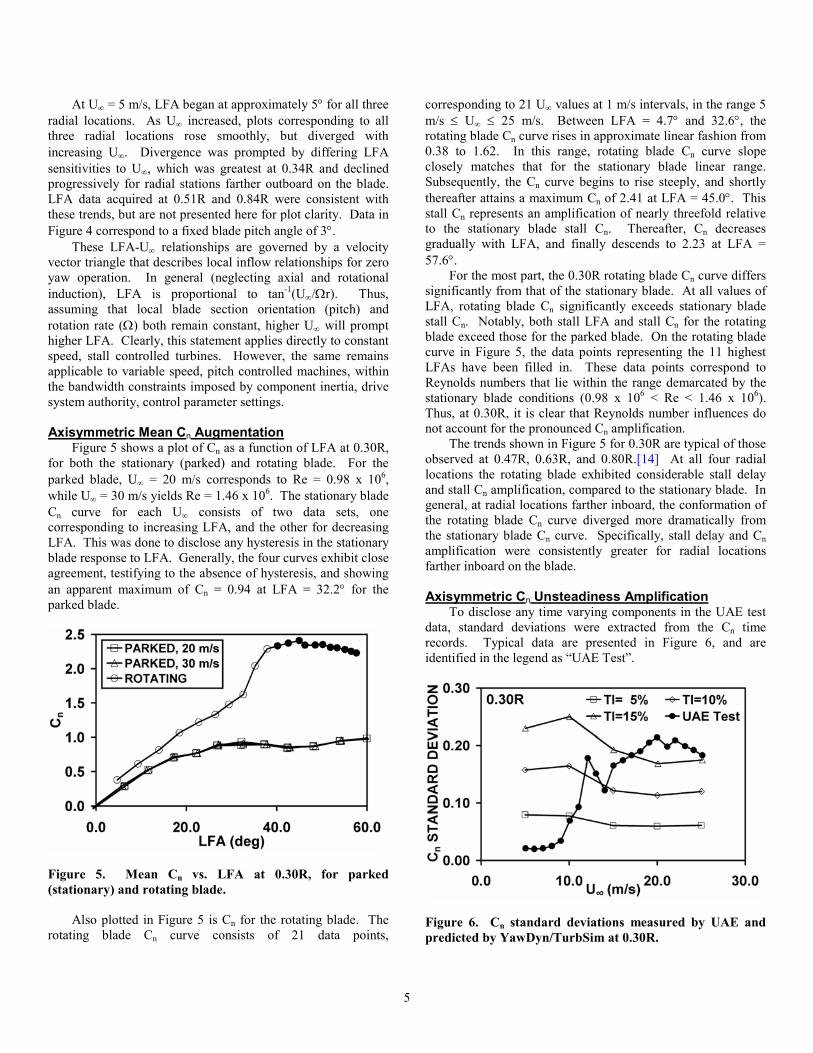
Figure 5 shows a plot of Cn as a function of LFA at 0.30R, for both the stationary (parked) and rotating blade. For the parked blade, U∞ = 20 m/s corresponds to Re = 0.98 x 10⁶, while U∞ = 30 m/s yields Re = 1.46 x 10⁶. The stationary blade Cn curve for each U∞ consists of two data sets, one corresponding to increasing LFA, and the other for decreasing LFA. This was done to disclose any hysteresis in the stationary blade response to LFA. Generally, the four curves exhibit close agreement, testifying to the absence of hysteresis, and showing an apparent maximum of Cn = 0.94 at LFA = 32.2° for the parked blade.
Figure 5. Mean Cn vs. LFA at 0.30R, for parked (stationary) and rotating blade.
Also plotted in Figure 5 is Cn for the rotating blade. The rotating blade Cn curve consists of 21 data points,
corresponding to 21 U∞ values at 1 m/s intervals, in the range 5 m/s ≤ U∞ ≤ 25 m/s. Between LFA = 4.7° and 32.6°, the rotating blade Cn curve rises in approximate linear fashion from 0.38 to 1.62. In this range, rotating blade Cn curve slope closely matches that for the stationary blade linear range. Subsequently, the Cn curve begins to rise steeply, and shortly thereafter attains a maximum Cn of 2.41 at LFA = 45.0°. This stall Cn represents an amplification of nearly threefold relative to the stationary blade stall Cn. Thereafter, Cn decreases gradually with LFA, and finally descends to 2.23 at LFA = 57.6°.
For the most part, the 0.30R rotating blade Cn curve differs significantly from that of the stationary blade. At all values of LFA, rotating blade Cn significantly exceeds stationary blade stall Cn. Notably, both stall LFA and stall Cn for the rotating blade exceed those for the parked blade. On the rotating blade curve in Figure 5, the data points representing the 11 highest LFAs have been filled in. These data points correspond to Reynolds numbers that lie within the range demarcated by the stationary blade conditions (0.98 x 10⁶ < Re < 1.46 x 10⁶). Thus, at 0.30R, it is clear that Reynolds number influences do not account for the pronounced Cn amplification.
The trends shown in Figure 5 for 0.30R are typical of those observed at 0.47R, 0.63R, and 0.80R.[14] At all four radial locations the rotating blade exhibited considerable stall delay and stall Cn amplification, compared to the stationary blade. In general, at radial locations farther inboard, the conformation of the rotating blade Cn curve diverged more dramatically from the stationary blade Cn curve. Specifically, stall delay and Cn amplification were consistently greater for radial locations farther inboard on the blade.
Axisymmetric Cn Unsteadiness Amplification
To disclose any time varying components in the UAE test data, standard deviations were extracted from the Cn time records. Typical data are presented in Figure 6, and are identified in the legend as “UAE Test”.
Figure 6. Cn standard deviations measured by UAE and predicted by YawDyn/TurbSim at 0.30R.
5
It should be noted that Cn standard deviations extracted
from UAE test data were caused solely by interactions originating in the blade flow field. This exclusion applies because of two factors. First, as stated above, data were analyzed in a manner that excluded tower influence and any associated time variations due to blade passage through it. Second, the NASA Ames 80 ft x 120 ft wind tunnel provided an inflow environment free of significant inflow turbulence or velocity gradients.[41]
To quantify Cn standard deviations that would occur in response to turbulent atmospheric inflow, UAE operation was simulated using YawDyn[47] with AeroDyn[48]. Turbulent inflow input files were generated using TurbSim[49]. YawDyn/TurbSim simulations were carried out for three turbulence intensities (5, 10, and 15 percent) and five mean wind speeds (U∞ = 5, 10, 15, 20, and 25 m/s). These data are designated in the Figure 6 legend as TI = 5%, TI = 10%, and TI = 15%. All data shown in Figure 6 apply to the 0.30R radial location.
In Figure 6, Cn standard deviations for the UAE test data exhibited subdued levels in the range 5 m/s ≤ U∞ ≤ 9 m/s. Thereafter, Cn standard deviation rose rapidly with increasing U∞, and soon attained substantial magnitudes. Ultimately, Cn standard deviation for the UAE test data reached a maximum of 0.214 at U∞ = 20 m/s, and declined only slightly for higher values of U∞. It should be noted that the turbulence intensity range of 5 to 15 percent in Figure 6 approximates the turbulence intensity range of 13 to 20 percent encompassed by various wind turbine design standards.[50]
UAE Cn standard deviation behaviors seen in Figure 6 for 0.30R are representative of those at 0.47R, 0.63R, and 0.80R.[51] At all four radial locations for the rotating blade, U∞ values below 9 or 10 m/s were accompanied by attenuated Cn standard deviation levels, which remained well below Cn standard deviation levels predicted for 5 percent inflow turbulence intensity. However, modest increases in U∞ elicited a rapid and substantial rise in UAE Cn standard deviation, which peaked in the range 15 ≤ U∞ ≤ 20 m/s. These elevated Cn standard deviation levels exceeded those predicted for 15 percent turbulence intensity, and did so over a broad U∞ range.
Overall, Cn time variations due to spontaneous blade flow field interactions were comparable to those prompted by elevated turbulent inflow intensities. Adverse structural impacts, including fatigue life expenditure, need to be considered comparable, as well. Axisymmetric Flow Field Structure
The dramatic rise in Cn mean and standard deviation levels during rotational augmentation has been conclusively linked to abrupt transformation of the flow field from a conventional separating topology to one dominated by an impinging shear layer.[16] Figure 7 shows a two-dimensional section of the mean flow field on the rotating UAE blade, for U∞ = 15 m/s and r/R = 0.30. This two-dimensional section was extracted from a three-dimensional Ellipsis3D computation.[17]
Figure 7. Two-dimensional section of computed flow field, showing typical shear layer impingement (U∞ = 15 m/s, r/R = 0.30). Courtesy of N. Sørensen, Risø National Laboratory.
In Figure 7, separation at the leading edge near the left border of the frame gives rise to a shear layer that arches over the blade suction surface. This shear layer impinges farther aft on the chord, over an extended region approximately 0.25c in length and centered near 0.70c. As the shear layer arches over the blade, it surrounds a region of intense recirculation reminiscent of a vortical structure. This structure produces low surface pressures over the extended chordwise region beneath it, thus accounting for augmented mean Cn levels. Recent research has shown that Cn standard deviation levels correlate with the chord length enveloped by the shear layer.[51]
The image shown in Figure 7 is a two-dimensional section extracted from a strongly three-dimensional flow field. To gain an appreciation for the complex three-dimensional character, Figure 8 shows computed surface limiting streamlines on the suction surface of the UAE blade, for U∞ = 15 m/s. These limiting streamlines were derived from the same three-dimensional Ellipsis3D solution described in connection with Figure 7.[52]
Figure 8. Computed boundary layer topology on blade suction surface for U∞ = 15 m/s and γ = 0°. Courtesy of N. Sørensen, Risø National Laboratory.
6
In Figure 8, the computed separation line extends along the
blade leading edge from 0.20R to 0.85R. From 0.85R, the separation line travels outboard and aft, demarcating a small triangular region containing chordwise streamlines and two-dimensional flow. Impingement is prominent on the blade surface, signified by an aggregation of limiting streamlines that crosses the blade from 0.30R at midchord to 0.65R at the leading edge. Within the triangular region between separation and impingement, the streamlines proceed outboard and forward toward the leading edge, suggesting the presence of a recirculating region over this blade surface area.
The boundary layer topology shown in Figure 8 corresponds to near-peak augmentation of mean Cn and amplification of Cn standard deviation. Topology shifts substantially with U∞, and attached flow areas may expand somewhat for lower U∞. However, the topology always remains strongly three-dimensional with extended regions of spanwise flow, and thus must be considered highly complex in general. These and related computational results have been corroborated through detailed comparisons with UAE wind tunnel measurements.[17,52] Yawed Inflow Relationships
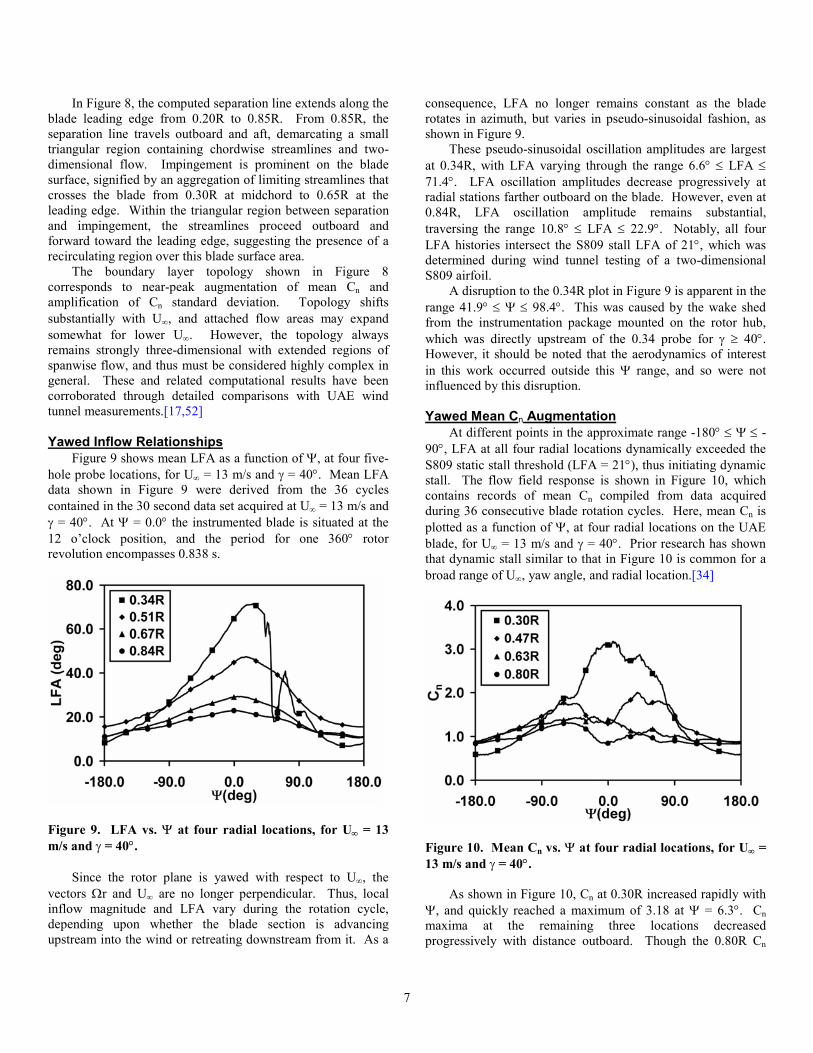
Figure 9 shows mean LFA as a function of Ψ, at four five-hole probe locations, for U∞ = 13 m/s and γ = 40°. Mean LFA data shown in Figure 9 were derived from the 36 cycles contained in the 30 second data set acquired at U∞ = 13 m/s and γ = 40°. At Ψ = 0.0° the instrumented blade is situated at the 12 o’clock position, and the period for one 360° rotor revolution encompasses 0.838 s.
Figure 9. LFA vs. Ψ at four radial locations, for U∞ = 13 m/s and γ = 40°.
Since the rotor plane is yawed with respect to U∞, the
vectors Ωr and U∞ are no longer perpendicular. Thus, local inflow magnitude and LFA vary during the rotation cycle, depending upon whether the blade section is advancing upstream into the wind or retreating downstream from it. As a
consequence, LFA no longer remains constant as the blade rotates in azimuth, but varies in pseudo-sinusoidal fashion, as shown in Figure 9.
These pseudo-sinusoidal oscillation amplitudes are largest at 0.34R, with LFA varying through the range 6.6° ≤ LFA ≤ 71.4°. LFA oscillation amplitudes decrease progressively at radial stations farther outboard on the blade. However, even at 0.84R, LFA oscillation amplitude remains substantial, traversing the range 10.8° ≤ LFA ≤ 22.9°. Notably, all four LFA histories intersect the S809 stall LFA of 21°, which was determined during wind tunnel testing of a two-dimensional S809 airfoil.
A disruption to the 0.34R plot in Figure 9 is apparent in the range 41.9° ≤ Ψ ≤ 98.4°. This was caused by the wake shed from the instrumentation package mounted on the rotor hub, which was directly upstream of the 0.34 probe for γ ≥ 40°. However, it should be noted that the aerodynamics of interest in this work occurred outside this Ψ range, and so were not influenced by this disruption.
Yawed Mean Cn Augmentation
At different points in the approximate range -180° ≤ Ψ ≤ -90°, LFA at all four radial locations dynamically exceeded the S809 static stall threshold (LFA = 21°), thus initiating dynamic stall. The flow field response is shown in Figure 10, which contains records of mean Cn compiled from data acquired during 36 consecutive blade rotation cycles. Here, mean Cn is plotted as a function of Ψ, at four radial locations on the UAE blade, for U∞ = 13 m/s and γ = 40°. Prior research has shown that dynamic stall similar to that in Figure 10 is common for a broad range of U∞, yaw angle, and radial location.[34]
Figure 10. Mean Cn vs. Ψ at four radial locations, for U∞ = 13 m/s and γ = 40°.
As shown in Figure 10, Cn at 0.30R increased rapidly with Ψ, and quickly reached a maximum of 3.18 at Ψ = 6.3°. Cn maxima at the remaining three locations decreased progressively with distance outboard. Though the 0.80R Cn
7

maximum of 1.31 was substantially lower than those farther inboard, it still significantly exceeded the S809 stall Cn of 1.00 for static, two-dimensional conditions, testifying to the presence and influence of dynamic stall.
Spectral components predominant in the mean Cn records occurred once per revolution, which corresponded to 1.2 Hz for the experiments analyzed in the current work. Features suggesting higher frequency content, which occurred approximately twice per revolution can be seen in Figure 10. However, these features reside in the approximate range 0.0° ≤ Ψ ≤ 90°, and thus may be artifacts associated with the LFA disruption apparent in Figure 9, in the range 41.9° ≤ Ψ ≤ 98.4°. Rise times for Cn in Figure 10 ranged from 0.39 s at 0.30R to 0.29 s at 0.80R.
Yawed Cn Unsteadiness Amplification
Figure 11 shows a superposition of Cn records for all 36 blade rotation cycles, at 0.30R and 0.80R, for U∞ = 13 m/s and γ = 40°. The mean Cn data for these two radial locations also are plotted, as thin white traces in the approximate center of the multiple overlapping black traces.
Figure 11. Instantaneous Cn vs. Ψ for 36 blade rotation cycles at two radial locations, for U∞ = 13 m/s and γ = 40°.
These plots confirm that the principal dynamic stall Cn features, which occur once per revolution, are sufficiently repeatable from cycle to cycle to confer statistical significance on the mean data. At the same time, Figure 11 reveals the presence of Cn oscillations having higher frequencies of approximately 30 to 50 Hz. Peak-to-peak amplitudes of these higher frequency components correspond to approximately 50 to 70 percent of mean levels. In Figure 11, data for 0.47R and 0.63R have been omitted for plot clarity. However, these two intermediate radial locations exhibit behaviors consistent with those shown by the 0.30R and 0.80R data.
Both the once per revolution and the higher frequency Cn time variations associated with dynamic stall constitute significant components of the aerodynamic load spectrum. Amplitude of the higher frequency components varies with Ψ,
attaining largest magnitudes in the approximate range -90° ≤ Ψ ≤ -90°, simultaneous with dynamic stall. Outside this Ψ range, these higher frequency Cn components are virtually absent, convincingly linking them to dynamic stall rather than to some artifact. Yawed Flow Field Structure
Visualization of dynamically stalled flow fields can reveal flow field structures responsible for the dramatic Cn amplification. Unfortunately, dynamic stall visualization is extremely difficult on rotating turbine blades and has not yet been accomplished. However, analogous dynamically stalled flow fields occur on nonrotating aerodynamic surfaces subjected to dynamic pitching, and are readily visualized.
Figure 12 shows smoke flow visualization of a two-dimensional airfoil with c = 0.15 m, pitching from 0° to 60° at a constant rate of 115°/s. The airfoil pitch axis is located at 0.25c. Air flows from left to right at 6.1 m/s. The three panels show instantaneous angles of attack of 20°, 25°, and 30°. The upper surface of the airfoil is visible in each panel as a brightly lit arc inclined with respect to the panel borders.
Figure 12. Smoke flow visualization of dynamic stall on an airfoil pitching in a wind tunnel.
8
In the upper panel, the diffuse smoke filaments
immediately above the airfoil indicate that separation has enveloped the entire upper surface. However, the smoke line emanating from the leading edge is well defined, curves back toward the airfoil, and impinges on the surface at approximately 0.20c. Subsequent panels will show this structure to be an energetic dynamic stall vortex. The dynamic stall vortex produces a surface pressure minimum of significant magnitude on the airfoil surface beneath the vortex. This surface pressure minimum is responsible for the strongly amplified Cn levels observed during dynamic stall.
The middle panel shows that the dynamic stall vortex has grown substantially and has convected aft on the airfoil chord, residing approximately over midchord. The smoke line defining the outer perimeter of the vortex almost completely encircles the vortex, indicating the strongly rotational and energetic nature of the vortex. Consistent with vortex size, surface pressure minimum has grown and Cn has increased.
In the lower panel, the vortex has grown still larger, and continues to exhibit a strongly rotational appearance, indicative of the energy contained in the vortex. However, the dynamic stall vortex has reached the airfoil trailing edge, and has begun to lift away from the airfoil surface. As the vortex sheds from the airfoil surface, the surface pressure minimum weakens and Cn undergoes a catastrophic decrease, or stall.
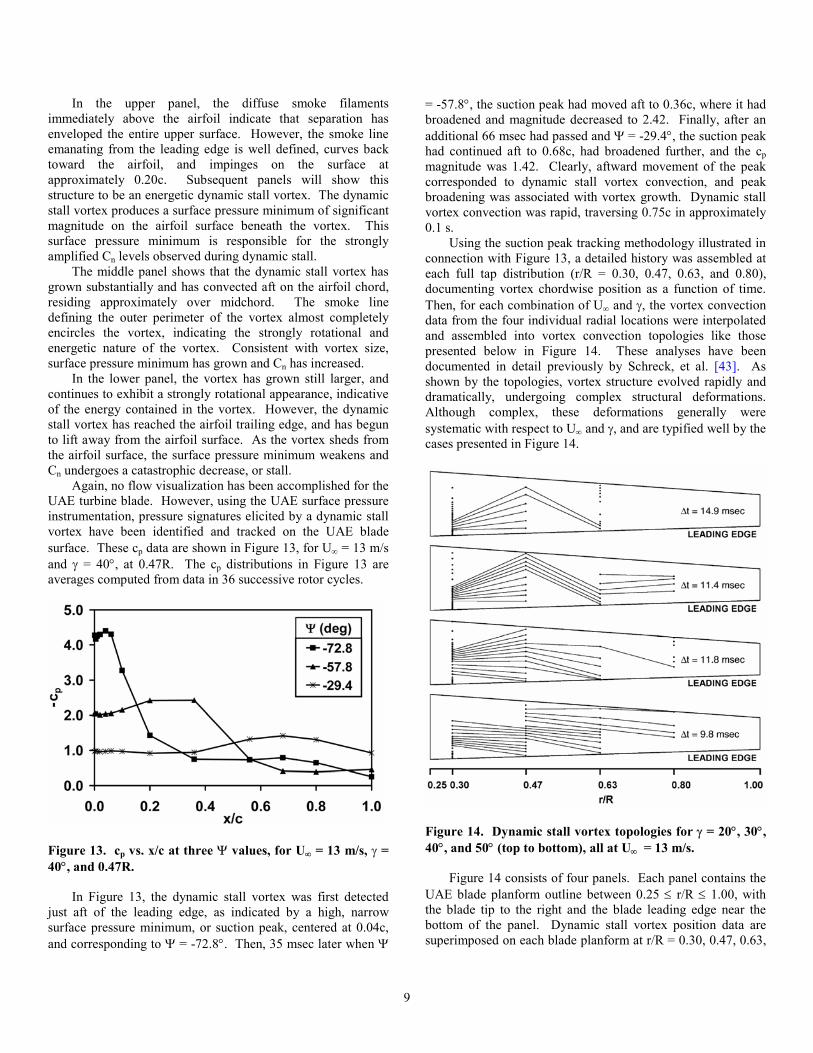
Again, no flow visualization has been accomplished for the UAE turbine blade. However, using the UAE surface pressure instrumentation, pressure signatures elicited by a dynamic stall vortex have been identified and tracked on the UAE blade surface. These cp data are shown in Figure 13, for U∞ = 13 m/s and γ = 40°, at 0.47R. The cp distributions in Figure 13 are averages computed from data in 36 successive rotor cycles.
Figure 13. cp vs. x/c at three Ψ values, for U∞ = 13 m/s, γ = 40°, and 0.47R.
In Figure 13, the dynamic stall vortex was first detected just aft of the leading edge, as indicated by a high, narrow surface pressure minimum, or suction peak, centered at 0.04c, and corresponding to Ψ = -72.8°. Then, 35 msec later when Ψ
= -57.8°, the suction peak had moved aft to 0.36c, where it had broadened and magnitude decreased to 2.42. Finally, after an additional 66 msec had passed and Ψ = -29.4°, the suction peak had continued aft to 0.68c, had broadened further, and the cp magnitude was 1.42. Clearly, aftward movement of the peak corresponded to dynamic stall vortex convection, and peak broadening was associated with vortex growth. Dynamic stall vortex convection was rapid, traversing 0.75c in approximately 0.1 s.
Using the suction peak tracking methodology illustrated in connection with Figure 13, a detailed history was assembled at each full tap distribution (r/R = 0.30, 0.47, 0.63, and 0.80), documenting vortex chordwise position as a function of time. Then, for each combination of U∞ and γ, the vortex convection data from the four individual radial locations were interpolated and assembled into vortex convection topologies like those presented below in Figure 14. These analyses have been documented in detail previously by Schreck, et al. [43]. As shown by the topologies, vortex structure evolved rapidly and dramatically, undergoing complex structural deformations. Although complex, these deformations generally were systematic with respect to U∞ and γ, and are typified well by the cases presented in Figure 14.
Figure 14. Dynamic stall vortex topologies for γ = 20°, 30°, 40°, and 50° (top to bottom), all at U∞ = 13 m/s.
Figure 14 consists of four panels. Each panel contains the UAE blade planform outline between 0.25 ≤ r/R ≤ 1.00, with the blade tip to the right and the blade leading edge near the bottom of the panel. Dynamic stall vortex position data are superimposed on each blade planform at r/R = 0.30, 0.47, 0.63,
9
and 0.80, consistent with the radial locations of the full tap distributions. At these radial locations, measured suction peak position data are represented by dot symbols. Symbols at adjacent radial locations corresponding to simultaneous times are connected by linear segments, depicting vortex topology evolution with time. Symbols not connected by linear segments indicate that the dynamic stall vortex was not observed at the adjacent radial location. Near the blade tip, the time interval between successive topologies is annotated as Δt. Time intervals vary, having been chosen to yield easiest viewing and clearest interpretation of the data shown in the figure.
Proceeding down from the top panel in Figure 14, the four panels represent γ = 20°, 30°, 40°, and 50°, all for U∞ = 13 m/s. At all yaw angles, the dynamic stall vortex was observed at 0.30R, reaching progressively farther outboard across the blade radius as γ increased. For the experimental range of U∞ and γ, dynamic stall vortices were not observed outboard of the 0.80R location. At 0.30R, 0.47R, and 0.63R, the dynamic stall vortex was first observed at the blade leading edge. In contrast, at 0.80R, the dynamic stall vortex was first detected aft of the leading edge.
In Figure 14, dynamic stall initiation time varied considerably with radial location. Accordingly, initiation phasing played a prominent role in shaping the dynamic stall vortex. For the experimental range of U∞ and γ, vortex initiation always was detected first at 0.30R, and subsequently progressed outboard. This progression produced vortices initially skewed with respect to the leading edge, with the inboard part of the vortex situated farther aft on the blade surface.
After initiation, dynamic stall vortex convection was least dynamic at 0.30R, implying the existence of pinning influences at the inboard vicinity of the vortex [26-30,33,53-56]. Depending on γ, convection was most active at 0.47R or 0.63R. At γ = 20° and γ = 30°, dynamic stall vortex convection speed was fastest at 0.47R, where the vortex initially arrived at the trailing edge. At γ = 40°, convection speed was highest at 0.63R, where the vortex first passed the trailing edge, and at γ = 50°, convection speed was highest at 0.80R. Although not true for γ = 50°, convection rates at the outboard end of the vortex generally were lower than those observed at locations farther inboard, consistent with pinning interactions functioning near the outboard end of the vortex [26-30,33,53-56].
In general, disparities in convection rate between radial locations were large enough to drive the vortex downstream of the trailing edge at 0.47R or 0.63R, while the vortex remained over the blade surface at the inboard and outboard vortex ends, at 0.30R and 0.80R.
Observations in conjunction with Figures 13 and 14 regarding dynamic stall vortex convection kinematics are consistent with those noted in previous efforts employing rotating wind turbine blades [33,34], and pitching rectangular wings [26-30,53,56]. In addition, analogous structures have been observed over stationary lifting surfaces [57] and bluff
bodies [58]. All such flow fields are known to be consistent with the vortex theorems of Helmholtz.[59] Frequency of Occurrence
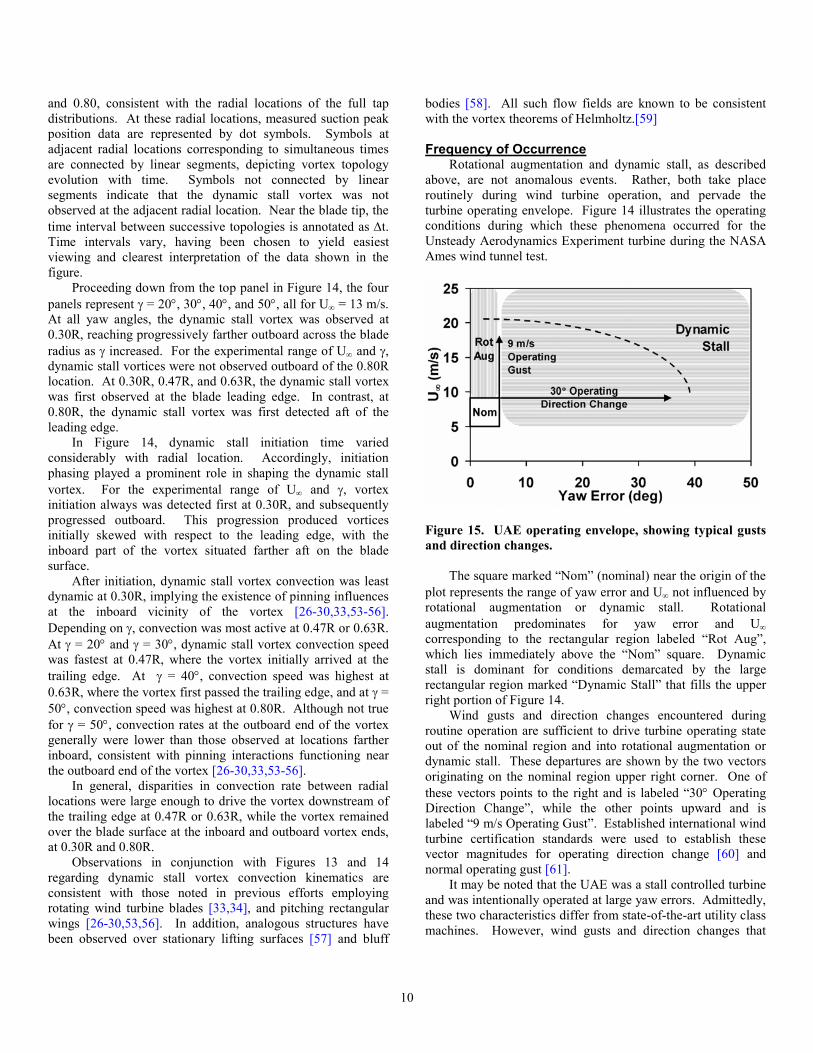
Rotational augmentation and dynamic stall, as described above, are not anomalous events. Rather, both take place routinely during wind turbine operation, and pervade the turbine operating envelope. Figure 14 illustrates the operating conditions during which these phenomena occurred for the Unsteady Aerodynamics Experiment turbine during the NASA Ames wind tunnel test.
Figure 15. UAE operating envelope, showing typical gusts and direction changes.
The square marked “Nom” (nominal) near the origin of the plot represents the range of yaw error and U∞ not influenced by rotational augmentation or dynamic stall. Rotational augmentation predominates for yaw error and U∞ corresponding to the rectangular region labeled “Rot Aug”, which lies immediately above the “Nom” square. Dynamic stall is dominant for conditions demarcated by the large rectangular region marked “Dynamic Stall” that fills the upper right portion of Figure 14.
Wind gusts and direction changes encountered during routine operation are sufficient to drive turbine operating state out of the nominal region and into rotational augmentation or dynamic stall. These departures are shown by the two vectors originating on the nominal region upper right corner. One of these vectors points to the right and is labeled “30° Operating Direction Change”, while the other points upward and is labeled “9 m/s Operating Gust”. Established international wind turbine certification standards were used to establish these vector magnitudes for operating direction change [60] and normal operating gust [61].
It may be noted that the UAE was a stall controlled turbine and was intentionally operated at large yaw errors. Admittedly, these two characteristics differ from state-of-the-art utility class machines. However, wind gusts and direction changes that
10

outpace turbine pitch and yaw actuation rates are likely to lead to analogous circumstances.
It also is important to remember that the current work relies on wind tunnel measurements and computational predictions that purposely exclude turbulent inflow. Thus, the current work cannot quantify the extent to which turbulent inflow may compound the adverse effects documented herein. Implications for Control
The results and discussion above show conclusively that rotational augmentation and dynamic stall occurring on wind turbine blades can be accurately characterized as follows.
• Amplified aerodynamic loads • Pronounced unsteady content • Extensive frequency spectrum • Large scale vortical structures • Leading edge vorticity production • Three-dimensional flow fields • Pervasive across operating regime
These attributes are likely to pose difficult challenges for wind turbine flow control, specifically with respect to the following considerations that typically impact sensors, actuators, and controllers.
• Bandwidth • Nonlinearity • Sensor/actuator placement • Flow state identification • Actuator authority
CONCLUSIONS
Using complementary experimental and computational methodologies, key attributes of blade flow fields were isolated and characterized for axisymmetric and yawed turbine operation. These characteristics are likely to have strong implications for control of turbine blade flow fields.
For axisymmetric operation, elevated inflow angles drive Cn to mean and standard deviation levels that are significantly augmented relative to two-dimensional non-rotating conditions. Both mean and standard deviation levels are substantial, and are caused by a highly three-dimensional, shear layer dominated flow field.
Under yawed operating conditions, pseudo-sinusoidal inflow angle oscillations elicit dynamic stall. The dynamic stall flow field is strongly unsteady, driven by rapid vortex growth and convection. Mean Cn levels are strongly amplified compared to static conditions. In addition, The highly energetic vortices undergo complex three-dimensional modifications and are associated with broad frequency content.
Rotationally augmented and dynamically stalled flows possess attributes likely to pose central challenges for turbine flow control. Specifically, stringent demands will be imposed
on flow state identification, actuator effectiveness, controller nonlinearity, and system bandwidth.
As wind turbines continue to grow larger, problems associated with adverse aerodynamic loads will be exacerbated. Whether active control of turbine aerodynamics can help solve this problem will depend on comprehension and command of the issues documented herein. ACKNOWLEDGMENT
The experimental data used in this investigation were acquired from the National Wind Technology Center (NWTC) Unsteady Aerodynamics Experiment (UAE). The wind turbine and instrumentation were designed, fabricated, installed, and maintained by Mr. Jason Cotrell, Mr. Lee Jay Fingersh, and Mr. David Jager. The UAE was installed and tested in the NASA Ames 80 ft x 120 ft National Full-Scale Aerodynamics Complex by these NWTC personnel, with the assistance, advice, and encouragement of numerous NASA Ames engineers, scientists, and technicians.
BIBLIOGRAPHY [1] Himmelskamp, H, "Profiluntersuchungen an einem umlaufenden
Propeller" ("Profile Investigations on a Rotating Airscrew"), Dissertation, Gottingen 1945; Mitt. Max-Planck-Institut fur Stromungsforschung Gottingen Nr. 2, 1950.
[2] Banks, W., and G. Gadd, “Delaying Effect of Rotation on Laminar Separation,” AIAA J., v. 1, n. 4, Apr. 1963, pp. 941-942.
[3] McCroskey, W., and P. Yaggy, “Laminar Boundary Layers on Helicopter Rotors in Forward Flight,” AIAA J., v. 6, n. 10, Oct. 1968, pp. 1919-1926.
[4] McCroskey, W. J., “Measurements of Boundary Layer Transition, Separation and Streamline Direction on Rotating Blades,” NASA TN D-6321, Apr. 1971.
[5] Madsen, H., and H. Christensen, “On the Relative Importance of Rotational, Unsteady and Three-Dimensional Effects on the HAWT Rotor Aerodynamics,” Wind Engineering, v. 14, n. 6, 1990, pp. 405-415.
[6] Barnsley, M., and Wellicome, J., “Wind Tunnel Investigation of Stall Aerodynamics for a 1.0 m Horizontal Axis Rotor,” J. of Wind Engineering and Industrial Aerodynamics, v. 39, 1992, pp. 11-21.
[7] Ronsten, G., “Static Pressure Measurements on a Rotating and a Non-Rotating 2.375 m Wind Turbine Blade. Comparison with 2D Calculations,” J. of Wind Engineering and Industrial Aerodynamics, v. 39, 1992, pp. 105-118.
[8] Eggers, A., and R. Digumarthi, “Approximate Scaling of Rotational Effects on Mean Aerodynamic Moments and Power Generated by CER Blades Operating in Deep-Stalled Flow,” 11th ASME Wind Energy Symposium, Jan. 1992.
[9] Snel, H., R. Houwink, and W. Piers, “Sectional Prediction of 3D Effects for Separated Flow on Rotating Blades,” 18th European Rotorcraft Forum, Sept. 1992.
[10] Du, Z., and Selig, M., “A 3-D Stall-Delay Model for Horizontal Axis Wind Turbine Performance Prediction,” AIAA-98-0021, Jan. 2001.
[11] Corten, G., “Inviscid Stall Model,” Proceedings of the European Wind Energy Conference, July 2001, pp. 466-469.
[12] Tangler, J., and M. Selig, “An Evaluation of an Empirical Model for Stall Delay due to Rotation for HAWTS,” NREL/CP 440-23258, Golden, CO: National Renewable Energy Laboratory.
[13] Corrigan, J., and J. Schillings, “Empirical Model for Stall Delay Due to Rotation,” American Helicopter Society Aeromechanics Specialist Conf., Jan. 1994.
[14] Schreck, S., and Robinson, M., "Rotational Augmentation of Horizontal Axis Wind Turbine Blade Aerodynamic Response," Wind Energy, v. 5, n. 2/3, pp. 133-150, Apr.-Sep. 2002.
[15] Schreck, S., and Robinson, M., "Structures and Interactions Underlying Rotational Augmentation of Blade Aerodynamic Response," AIAA Paper 2003-0520, 2003.
[16] Schreck, S., and Robinson, M., " Boundary Layer State and Flow Field Structure Underlying Rotational Augmentation of Blade Aerodynamic Response," J. of Solar Energy Engineering, v. 125, pp. 448-456, Nov. 2003.
11
[17] Schreck, S., Sørensen, N., and Robinson, M., “Aerodynamic Structures
and Processes in Rotationally Augmented Flow Fields,” Wind Energy, v. 10, n. 2, March/April 2007, pp. 159-178.
[18] McCroskey, W. J., “Some Current Research in Unsteady Fluid Dynamics – The 1976 Freeman Scholar Lecture,” Transactions of the ASME, J. of Fluids Engineering, Mar. 1977, pp. 8-39.
[19] Carr, L. W., “Progress in Analysis and Prediction of Dynamic Stall”, J. of Aircraft, v. 25, n. 1, Jan. 1988, pp. 6-17.
[20] Butterfield, C., A. Hansen, D. Simms, and G. Scott, “Dynamic Stall on Wind Turbine Blades,” NREL/TP-257-4510, Dec. 1991. Golden, CO: National Renewable Energy Laboratory.
[21] Shipley, D., M. Miller, M. Robinson, M. Luttges, and D. Simms, “Evidence that Aerodynamic Effects, Including Dynamic Stall, Dictate HAWT Structure Loads and Power Generation in Highly Transient Time Frames,” NREL/TP-441-7080, Aug. 1994. Golden, CO: National Renewable Energy Laboratory.
[22] Shipley, D., M. Miller, and M. Robinson, “Dynamic Stall Occurrence on a Horizontal Axis Wind Turbine Blade,” NREL/TP-442-6912, Jul. 1995. Golden, CO: National Renewable Energy Laboratory.
[23] Robinson, M., R. Galbraith, D. Shipley, and M. Miller, “Unsteady Aerodynamics of Wind Turbines,” AIAA 95-0526, 33rd Aerospace Sciences Meeting and Exhibit, Jan 1995.
[24] Huyer, S., D. Simms, and M. Robinson, “Unsteady Aerodynamics Associated with a Horizontal Axis Wind Turbine,” AIAA J., v. 34, n. 7, Jul. 96, pp. 1410-1419.
[25] Hansen, A., C. Butterfield, and X. Cui, “Yaw Loads and Motions of a Horizontal Axis Wind Turbine,” J. of Solar Energy Engineering, v. 112, Nov. 1990, pp. 310-314.
[26] Freymuth, P. “Three-Dimensional Vortex Systems of Finite Wings,” J. of Aircraft, v. 25, n. 10, Oct. 1988, pp. 971-972.
[27] Robinson, M., and J. Wissler, “Unsteady Surface Pressure Measurements on a Pitching Wing,”AIAA 88-0328, AIAA 26th Aerospace Sciences Meeting, Jan. 1988.
[28] Lorber, P., F. Carta, and A. Covino, “An Oscillating Three-Dimensional Wing Experiment: Compressibility, Sweep, Rate, Waveform, and Geometry Effects on Unsteady Separation and Dynamic Stall,” UTRC Report R92-958325-6, Nov. 1992.
[29] Schreck, S., G. Addington, and M. Luttges, “Flow Field Structure and Development Near the Root of a Straight Wing Pitching at Constant Rate,” AIAA 91-1793, AIAA 22nd Fluid Dynamics, Plasma Dynamics and Lasers Conference, Jun. 1991.
[30] Schreck, S., and H. Helin, “Unsteady Vortex Dynamics and Surface Pressure Topologies on a Finite Pitching Wing,” J. of Aircraft, v. 31, n. 4, Jul.-Aug. 1994, pp. 899-907.
[31] Piziali, R., “2-D and 3-D Oscillating Wing Aerodynamics for a Range of Angles of Attack Including Stall,” NASA TM 4632, Sep. 1994.
[32] Schreck, S., M. Robinson, M. Hand, and D. Simms, "HAWT Dynamic Stall Response Asymmetries Under Yawed Flow Conditions," Wind Energy, Vol. 3, No. 4, 2000, pp. 215-232.
[33] Schreck, S., Robinson, M., Hand, M., and Simms, D., “Blade Dynamic Stall Vortex Kinematics for a Horizontal Axis Wind Turbine in Yawed Conditions," J. of Solar Energy Eng., v. 123, Nov. 2001, pp. 272-281.
[34] Schreck, S., and Robinson, M., “Blade Three-Dimensional Dynamic Stall Response to Wind Turbine Operating Condition,” J. of Solar Energy Engineering, v. 127, n. 4, pp. 488-495, November 2005.
[35] Butterfield, C., W. Musial, and D. Simms, (1992). “Combined Experiment Phase I Final Report.” NREL/TP-257-4655. Golden, CO: National Renewable Energy Laboratory.
[36] Miller, M., D. Shipley, T. Young, M. Robinson, M. Luttges, and D. Simms (1995), “Combined Experiment Phase II Data Characterization.” NREL/TP 442-6916, Golden, CO: National Renewable Energy Laboratory.
[37] Fingersh, L., D. Simms, C. Butterfield, and M. Jenks, “An Overview of the Unsteady Aerodynamics Experiment Phase III Data Acquisition System and Instrumentation,” ASME Energy and Environment Expo ’95, Houston, TX, Jan.-Feb. 1995.
[38] Acker, T., “Further Analysis of Data from the Unsteady Aerodynamics Experiment, Phase III and Phase IV,” Task 2 Report, Subcontr. XAT-8-18211-01, Golden, CO: National Renewable Energy Laboratory.
[39] Hand, M., D. Simms, L. Fingersh, D. Jager, J. Cotrell, S. Schreck, and S. Larwood (2001), “Unsteady Aerodynamics Experiment Phase VI: Wind Tunnel Test Configurations and Available Data Campaigns,” NREL/TP-500-29955, Dec. 2001, Golden, CO: National Renewable Energy Laboratory.
[40] Giguere, P., and M. Selig,"Design of a Tapered and Twisted Blade for the NREL Combined Experiment Rotor," NREL/SR 500-26173, Apr. 1999, Golden, CO: National Renewable Energy Laboratory.
[41] Zell, P., “Performance and Test Section Flow Characteristics of the National Full-Scale Aerodynamics Complex 80- by 120-Foot Wind Tunnel,” NASA TM 103920, Jan 1993.
[42] Brand, A., “To Estimate the Angle of Attack of an Airfoil from the Pressure Distribution,” ECN Technical Report, ECN-R-94-002, January 1994.
[43] Schepers, J., “Angle of Attack in Aerodynamic Field Measurements on Wind Turbines,” ECN Technical Report, December 1995.
[44] Shipley, D., Miller, M., Robinson, M., and Luttges, M., “Techniques for the Determination of Local Dynamic Pressure and Angle of Attack on a Horizontal Axis Wind Turbine,” NREL Technical Report TP-442-7393, May 1995.
[45] Whale, J., Fisichella, C., and Selig, M., “Correcting Inflow Measurements from HAWTs Using a Lifting-Surface Code,” AIAA 99-0040, 1999 ASME Wind Energy Symposium, January 1999.
[46] van Bussel, G., “The Aerodynamics of Horizontal Axis Wind Turbine Rotors Explored with Asymptotic Expansion Methods,” Thesis Technische Universiteit Delft, The Netherlands, 1995.
[47] Laino, D., and Hansen, A. C., “YawDyn User’s Guide,” available at http://wind/designcodes/simulators/yawdyn/YawDyn.pdf, April 2003.
[48] Laino, D., and Hansen, A. C., “AeroDyn User’s Guide,” available at http://wind/designcodes/simulators/aerodyn/AeroDyn.pdf, Dec. 2002.
[49] Jonkman, B., and Buhl, M., “TurbSim User’s Guide,” NREL/TP-500-39797, September 2006, Golden, CO: National Renewable Energy Laboratory.
[50] Burton, T., Sharpe, D., Jenkins, N., and Bossanyi, E., Wind Energy Handbook, John Wiley and Sons Ltd., Chichester, 2001, p. 22.
[51] Schreck, S., and Robinson, M., “Rotationally Augmented Flow Structures and Time Varying Loads on Turbine Blades,” AIAA-2007-0627, January 2007.
[52] Sørensen, N., Michelsen, J., and Schreck, S., “Navier-Stokes Predictions of the NREL Phase VI Rotor in the NASA Ames 80 ft x 120 ft Wind Tunnel,” Wind Energy, v. 5, n. 2/3, Apr-Sep 2002, pp. 151-169.
[53] Schreck, S., 1989, “Experimental Investigation of the Mechanisms Underlying Vortex Kinematics in Unsteady Separated Flows,” (Dissertation) Graduate School, Univ. of Colorado, Boulder, CO.
[54] Horner, M., Addington, G., Young, J., and Luttges, M., “Controlled Three-Dimensionality in Unsteady Separated Flow About a Sinusoidally Oscillating Flat Plate,” AIAA 90-0689, January 1990.
[55] Galbraith, R., Coton, F., Jiang, D., and Gilmour, R., 1995, “Preliminary Results from a Three-Dimensional Dynamic Stall Experiment of a Finite Wing,” Paper No. 2-3, 21st European Rotorcraft Forum.
[56] Coton, F., and Galbraith, R., 1999, “An Experimental Study of Dynamic Stall on a Finite Wing,” The Aeronautical Journal, v. 103, no. 1023, pp. 229-236.
[57] Winkelmann, A. and Barlow, J., “Flowfield Model for a Rectangular Planform Wing Beyond Stall,” AIAA Journal, v. 18, pp. 1006-1007, 1980.
[58] Schewe, G., “Reynolds-Number Effects in Flow Around More-or-Less Bluff Bodies,” J. of Wind Engineering and Industrial Aerodynamics, v. 89, n. 14-15, pp. 1267-1289, December 2001.
[59] Prandtl, L., and Tietjens, O., Fundamentals of Hydro- and Aeromechanics. Dover: New York, 1957, 197-200.
[60] Germanischer-Lloyd, Rules and Regulations, IV-Non-Marine Technology, Part 1-Wind Energy Converters, Chapter 4, p. 2-3, Edition 1998.
[61] Germanischer-Lloyd, Rules and Regulations, IV-Non-Marine Technology, Part 1-Wind Energy Converters, Chapter 4, pp. 2-3, B-2, Edition 1998.
12

F1147-E(12/2004)
REPORT DOCUMENTATION PAGE Form Approved OMB No. 0704-0188
The public reporting burden for this collection of information is estimated to average 1 hour per response, including the time for reviewing instructions, searching existing data sources, gathering and maintaining the data needed, and completing and reviewing the collection of information. Send comments regarding this burden estimate or any other aspect of this collection of information, including suggestions for reducing the burden, to Department of Defense, Executive Services and Communications Directorate (0704-0188). Respondents should be aware that notwithstanding any other provision of law, no person shall be subject to any penalty for failing to comply with a collection of information if it does not display a currently valid OMB control number. PLEASE DO NOT RETURN YOUR FORM TO THE ABOVE ORGANIZATION. 1. REPORT DATE (DD-MM-YYYY)
August 2007 2. REPORT TYPE
Conference paper 3. DATES COVERED (From - To)
July 30 - August 2, 2007 5a. CONTRACT NUMBER
DE-AC36-99-GO10337
5b. GRANT NUMBER
4. TITLE AND SUBTITLE Wind Turbine Blade Flow Fields and Prospects for Active Aerodynamic Control: Preprint
5c. PROGRAM ELEMENT NUMBER
5d. PROJECT NUMBER NREL/CP-500-41606
5e. TASK NUMBER WER7.2601
6. AUTHOR(S) S. Schreck and M. Robinson
5f. WORK UNIT NUMBER
7. PERFORMING ORGANIZATION NAME(S) AND ADDRESS(ES) National Renewable Energy Laboratory 1617 Cole Blvd. Golden, CO 80401-3393
8. PERFORMING ORGANIZATION REPORT NUMBER NREL/CP-500-41606
10. SPONSOR/MONITOR'S ACRONYM(S) NREL
9. SPONSORING/MONITORING AGENCY NAME(S) AND ADDRESS(ES)
11. SPONSORING/MONITORING AGENCY REPORT NUMBER
12. DISTRIBUTION AVAILABILITY STATEMENT National Technical Information Service U.S. Department of Commerce 5285 Port Royal Road Springfield, VA 22161
13. SUPPLEMENTARY NOTES
14. ABSTRACT (Maximum 200 Words) This paper describes wind turbine flow fields that can cause adverse aerodynamic loading and can impact active aerodynamic control methodologies currently contemplated for wind turbine applications.
15. SUBJECT TERMS wind turbine design; wind turbine flow fields; wind turbine aerodynamic; wind energy
16. SECURITY CLASSIFICATION OF: 19a. NAME OF RESPONSIBLE PERSON a. REPORT
Unclassified b. ABSTRACT Unclassified
c. THIS PAGE Unclassified
17. LIMITATION OF ABSTRACT
UL
18. NUMBER OF PAGES
19b. TELEPHONE NUMBER (Include area code)
Standard Form 298 (Rev. 8/98) Prescribed by ANSI Std. Z39.18

![State-of-the-art model for the LIFES50+ OO-Star Wind Floater … · [10]. FAST (Fatigue, Aerodynamics, Structures and Turbulence), developed at NREL, is an open-source multi-physics](https://static.fdocuments.net/doc/165x107/5e35b5bc01660a666e727564/state-of-the-art-model-for-the-lifes50-oo-star-wind-floater-10-fast-fatigue.jpg)