NP'S-OC-91-006 NAVAL POSTGRADUATE SCHOOL … NP'S-OC-91-006POSTGRADUATE SCHOOL Monterey, California...
160
NP'S-OC-91-006 NAVAL POSTGRADUATE SCHOOL Monterey, California AD-A246 818 , lll l It A 1Wii DTIC S ELECTE MAR 0 4 THESIS EVALUATION OF ABSOLUTE POSITIONING US- ING THE DEFENSE MAPPING AGENCY'S GASP PROGRAM by Dennis Bredthauer September 1991 Thesis Advisor J.R. Clynch Approved ror public release; distribution is unlimited. Prepared for: Naval Postgraduate Sctwol lkntr, C&ifornia 93943-5000 3 0o2 0o46 92-05302 S• a o • o 4 /11|•1!14
Transcript of NP'S-OC-91-006 NAVAL POSTGRADUATE SCHOOL … NP'S-OC-91-006POSTGRADUATE SCHOOL Monterey, California...

NP'S-OC-91-006
NAVAL POSTGRADUATE SCHOOLMonterey, California
AD-A246 818, �lll l It A 1Wii
DTICS ELECTEMAR 0 4 THESIS
EVALUATION OF ABSOLUTE POSITIONING US-ING THE
DEFENSE MAPPING AGENCY'S GASP PROGRAM
by
Dennis Bredthauer
September 1991
Thesis Advisor J.R. Clynch
Approved ror public release; distribution is unlimited.
Prepared for:Naval Postgraduate Sctwollkntr, C&ifornia 93943-5000
3 0o2 0o46 92-05302
S• a o • o 4 /11|•1!14
NAVAL POSTGRADUATE SCHOOLMonterty, CaUfomia
Rear Admiral R. W. West, Jr. H. ShullSuperintendent Provost
This thesis is prepared in conjunction with research sponsored and funded by the Naval PostgraduateSchool (NPS).
Reproduction of all or part of this report is authorized.
Released by:.Pau jfartoDean Research
Accesion ForNTIS 1,:r% • -
J - -Z3b I . .............. .............. ..
Di;t

Unclassifiedsecurity classification of this page
REPORT DOCUMENTATION PAGEI a Report Security Classification Unclassified lb Restictve Markings
2a Security Classification Authority 3 Distribution Availability of Report2b Declassificauon'Downgrading Schedule Approved for public release; distribution is unlimited.4 Performing Organization Report Number(s) 5 Monitoring Organization Report Number(s)
6. Name of Performing Organizauon 6b Office Symbol 7a Name of Monitoring OrganizationNaval Postgraduate School 7(; appl!cable) 35 Naval Postgraduate School6c Address (dry. state, and ZIP code) 7b Address (dry, state. and ZIP code)Monterey, CA 93943-5000 Monterey, CA 93943-5000Ia Name of FwidingSponsoring Organization 8b Office Symbol 9 Procurement Instrument Identificatioa Numbtr
(Vf applicable) (•ZW8c Address (city, sta:i, and ZIP code) 10 Source of Funding Numbers
Program Element No I Project No Task No Work Unit Accession No
II Title (Indude securty classtlcation) EVALUATION OF ABSOLUTE POSITIONING USING THE DEFENSE MAPPINGAGENCY'S GASP PROGRAM12 Personal Author(s) Dennis Bredthauer13a Type of Report 13b Time Covered 14 Date of Report (year, month, day) 15 Page CountMaster's Thesis From To September 1991 116116 Supplemenury Notation The views expressed in this thesis are those of the author and do not reflect the official policy or po-sition of the Department of Defense or the U.S. Government.17 Cosati Codes 11 Subject Terms (continue on reverse ([necessary and ldentiy by block number)Field oroup [-Subgroup GPS, GASP, Absolute Positioning
19 Abstract (consinue on reverse i(necessary and Ident* by block numbe)The Geodetic Absolute Sequential Positioning (GASP) program, as utilized by the Defense Mapping Agency (DMA),
processes static GPS measurements collected with the TI 4100 GPS receiver to estimate geodetic point (absolute) positions.In this thesis, the GASP program is modified to accept data from different receiver types, the estimated point positions arecompared to positions produced by the Transit Doppler positioning system, the between-receiver estimates are compared, thedifference between estimates using the broadcast and the precise are examined, and the effects of Selective Availability as-sessed.
During the Monterey Bay Precision Positioning Experiment (MBPPE), condu:cted in the Winter of 1990-91, a large setof static GPS positioning data was collected with four types of GPS receiver; the TI 4100, the Trimble 4000ST, the AshtechLD XII, and the Magnavox MX420J. Additional static GPS measurements were obtained with the TI 4100 receiver at areference site established !o support 'he experiment. A third data set was collected after activation of Selective Availability.Measurements collected with the TI 4100, Trimble, and Ashtech receivers were subsequently processed with GASP usingbroadcast and precise ephemerides to produce point position estimates. In order for GASP to accept the data from theAshtech and Trimble receivers, the program had to be modified.
The positioning results obtained are analyzed for accuracy and precision. The accuracy of the GASP GPS estimates isdetermined by comparison to independent estimates obtained by the Transit Doppler positioning system. Precision or re-peatabifit;' (i.e., consistency of the estimated positions) is also examined.
Analysis of the accuracy and repeatability reveals little difference between the positions computed for the three receiversusing the precise ephemeris and that all three provide good agreement to the Transit Doppler positions. All three receiversare capable of providing geodetic-quality point positions. It is also clearly demonstrated that the precise ephemeris doesproduce a more accurate, higher precision solution than the broadcast ephemeris. The activation of Selective Availability hassubstantially degraded position solutions available from the broadcast ephemeris.
20 Distribution/Availability of Abstract 21 Abstract Security ClIsification8 unclassified/unlimited 0 same as report 0 DTIC users Unclassified22& Name of Responsible Individual 22b Telephone (include Area code) 22c Ofince Symbol
J.R. Clynch (408) 646-3268 OC/CIDD FORM 1473,84 MAR 83 APR edition may be used untl exhausted security classification of this page
All other editions are obsolete . _,
Unclassified
•- . ..!..... . •: .. .'•j....... l ...... T .. ..I "1 '' I.. .... °• • ° - i ... i.. ...... : i ..... . .... ; .... . ; ; ... ..; ... .. . .. ... .. .. . . . .. . . . . . .

Approved for public release; distribution is unlimited.
EVALUATION OF ABSOLUTE POSITIONING USING THEDEFENSE MAPPING AGENCY'S GASP PROGRAM
by
Dennis BredthauerCivilian, Defense Mapping AgencyB.S., Worcester State College, 1982
Submitted in partial fulfillment of therequirements for the degree of
MASTER OF SCIENCE IN HYDROGRAPHIC SCIENCE
from the
NAVAL POSTGRADUATE SCHOOL
September 1991
Author:. _•••._ - -,,• .-
Dennis Bredthauer
Approved by: -a.. ,
J.R. Ciynch, Thesis Add sor
H. Titus, Second Reader
C.A. Collins, Chairman,
Department of Oceanography
ii
ABSTRACT
The Geodetic Absolute Sequential Positioning (GASP) program, as utilized by theDefense Mapping Agency (DMA), processes static GPS measurements collected withthe TI 4100 GPS receiver to estimate geodetic point (absolute) positions. In this thesis,
the GASP program is modified to accept data from different receiver types, the estimated
point positions are compared to positions produced by the Transit Doppler positioningsystem, the between-receiver estimates are compared, the difference between estimatesusing the broadcast and the precise are examined, and the effects of Selective Avail.ability assessed.
During the Monterey Bay Precision Positioning Experimernt (MBPPE), conductedin the Winter of 1990-91, a large set of static GPS positioning data was collected withfour types of GPS receiver; the TI 4100, the Trimble 4000ST, the Ashtech LD XII, andthe Magnavox MX4200. Additional static GPS measurements were obtained with theTI 4100 receiver at a reference site established to support the experiment. A third dataset was collected after activation of Selective Availability. Measurements collected with
the TI 4100, Trimble, and Ashtech receivers were subsequently processed with GASPusing broadcast and precise ephemerides to produce point position estimates. In order
for GASP to accept the data from the Ashtech and Trimble receivers, the program hadto be modified.
The positioning rnsults obtained are analyzed for accuracy and precision. The ac-curacy of the GASP GPS estimates is determined by comparison to independent esti-mates obtained by the Transit Doppler positioning system. Precision or repeatability(i.e., consistency of the estimated positions) is also examined.
Analysis of the accuracy and repeatability reveals little difTercnce between the posi-tions computed for the three receivers using the precise ephemeris and that all threeprovide good agreement to the Transit Doppler positions. All three receivers are capable
of providing geodetic.quality point positions. It is also clcarly demonstrated that theprecise ephemeris does pioduce a more accurate, higher precision solution than the
broadcast ephemeris. The activation of Selective Availability has substantially degradedposition solutions available from the broadcast ephemeris.
Iiii

THESIS DISCLAIMER
The reader is cautioned that computer programs developed in this research may nothave been exercised for all cases of interest. While every effort has been made, withinthe time available, to ensure that the programs are free of computational and logic er-rors, they cannot be considered validated. Any application of these programs withoutadditional verification is at the risk of the user.
iv

C. DATA FILE EDITS AND RUNSTREAM GENERATION ........... 40D. STARPREP ............................................... 44
1. Input ................................................. 442. Error M odels ........................................... 44
a. Time of Transmission ................................. 44b. Satellite Clock ....................................... 44
c. Receiver Frequency Offset ............................ 45
d. Ionosphere ......................................... 45e. Troposphere ........................................ 46
f. General Relativity .................................... 47
g. Earth Rotation ...................................... 47h. Satellite Antenna Offset ................................ 48
3. O utput ................................................ 48
E. G A SP .................................................... 49I. GASP Runstrezn Generation ............................... 492. Automatic Data Editing ................................... 503. The GASP Observable .................................... 51
4. Batch Least Squares and Sequential Estimation .................. 54
5. O utput ................................................ 55F. PROGRAM MODIFICATIONS ............................... 56
IV. RESULTS AND ANALYSIS .................................... 59A. BEACH LAB RESULTS ..................................... 59
B. LOBOS3 RESULTS ......................................... 77C. REGIONAL AGREEMENT BETWEEN GPS AND TRANSIT DOPPLER 81D. POSITIONING RESULTS - SELECTIVE AVAILABILITY ACTIVATED 85
V. CONCLUSIONS .............................................. 89
APPENDIX A. KEPLERIAN ELEMENTS ............................ 92
APPENDIX B. LEAST SQUARES IN GPS ............................ 95A. THE MATHEMATICAL MODEL ............................. 95
B. OBSERVATION EQUATIONS ................................ 95C. MINIMUM VARIANCE SOLUTION ........................... 96
vi

D. A POSTERIORI VARIANCE OF UNIT WEIGHT ................. 98
E. VARIANCE-COVARIANCE MATRIX OF ADJUSTED PARAMETERS 98
F. VARIANCE-COVARIANCE MATRIX OF THE ADJUSTED, OB-SERVED QUANTITIES ........................................ 98
G. SUM M ARY .............................................. 98
APPENDIX C. CONSTANTS USED IN GASP ....................... 100
APPENDIX D. TABLES OF RESULTS IN CT COORDINATES .......... 101
A. BEACH LAB RESULTS .................................... 101
B. LOBOS3 RESULTS ........................................ 104
C. BLDG 224.3 RESULTS ..................................... 106
APPENDIX E. SUMMARIES OF POSITIONING RESULTS ............ 107
A. SUMMARY OF TRANSIT POSITION RESULTS ................ 107
B. SUMMARY OF GPS POSITION RESULTS ..................... 110
1. Beach Lab Sites ........................................ 110
2. LOBOS3 Site .......................................... 134
LIST OF REFERENCES .......................................... 140
BIBLIOGRAPHY ............................................... 142
INITIAL DISTRIBUTION LIST ................................... 144
ivii
I!
"il"

LIST OF TABLES
Table 1. ASHTECH RECEIVER FEATURES ......................... 30Table 2. TRIMBLE RECEIVER FEATURES .......................... 30Table 3. TI 4100 RECEIVER FEATURES ............................ 31Table 4. BEACH LAB DATA SET IDENTIFICATION AND TIME SPANS .. 41Table 5. LOBOS3 DATA SEF IDENTIFICATION AND TIME SPANS ..... 42Table 6. BLDG 224.3 DATA SET IDENTIFICATION AND TIME SPANS ... 42Table 7. GASP RUNSTREAM PROCESSING OPTIONS AND STANDARD
VALUES OR FEATURES .................................. 50
Table 8. BEACH LAB COMPONENT DIFFERENCES (AE, AN, AU) USINGBROADCAST EPHEMERIS ................................ 61
Table 9. BEACH LAB COMPONENT DIFFERENCES (AE, AN, AU) USINGPRECISE EPHEMERIS ................................. 65
Table 10. BEACH LAB REPEATABILITY (AE, AN, AU): AVERAGE OVERDAYS BY RECEIVER ..................................... 70
Table 11. BEACH LAB REPEATABILITY (AE, AN, AU': AVERAGE OVER
RECEIVERS BY DAY ..................................... 74Table 12. LOBOS3 COMPONENT DIFFERENCES (AE, AN, AU) ........... 78Table 13. LOBOS3 REPEATABILITY (AE, AN, AU) AVERAGE OVER DAYS
FOR TI 4100 RECEIVER .................................. 82
Table 14. BLDG 224.3 COMPONENT DfFFERENCES (AE, AN, AU) ........ 86Table 15. CONSTANTS USED IN GASP ............................. 100Table 16. BEACH LAB COMPONENT DIFFERENCES (AX, AY, AZ) USING
BROADCAST EPHEMERIS ............................... 101Table 17. BEACH LAB COMPONENT DIFFERENCES (AX, AY, AZ) USING
PRECISE EPHEMERIS ................................... 102Table 18. BEACH LAB REPEATABILITY (AX, AY, AZ): AVERAGE OVER
DAYS BY RECEIVER .................................... 103Table 19. LOBOS3 COMPONENT DIFFERENCES (AX, AY, AZ) .......... 104Table 20. LOBOS3 REPEATABILITY (AX, AY, AZ): AVERAGE OVER DAYS 105Table 21. BLDG 224.3 COMPONENT DIFFERENCES (AX, AY, AZ) ....... 106
iiii via..,
S. .... ..... ..... .. .. ... . .. .. ..... . . + . .. ... . . .• . . .. . .. , . .. .. ... .+ ... ... . .+ ... . .. . .T . . . .. . . .. . .. . . . .. . .. .. .. . .. . . ....• .. . ... . . ..i- .... .. . . . . .. .. ....i. . . .

LIST OF FIGURES
Figure 1. The Conventional Terrestrial Coordinate System .................. 3Figure 2. Code M odulation ........................................ 7Figure 3. GPS Control Stations ...................................... 9Figure 4. Squaring Channel ....................................... I I"Figure S. Components of Carrier Phase Measurements .................. 15Figure 6. Between-Epoch Single Differences ............................ 21Figure 7. Between-Satellite Single Differences ........................... 22Figure 8. The Transit System ....................................... 25Figure 9. Map of Experiment Area .................................. 29Figure 10. The Doppler Array ....................................... 32Figure 11. The Lobos Array ...................... ................. 34Figure 12. GASP Processing Flow .................................... 37Figure 13. Sample STARPREP Meteorological File Contents and Record
Description ............................................. 39Figure 14. Sample STARPREP Station File Contents and Record Description ... 40
Figure 15. Sample STARPREP Runstream for Precise Ephemeris ............. 43Figure 16. STARPREP Processing .................................... 49Figure 17. The GASP Observable .................................... 52Figure 18. GASP Processing ........................................ 56Figure 19. A&ast versus ANorth for Beach Lab, Broadcast Ephemeris Data ..... 62Figure 20. AHor versus AUp for Beach Lab, Broadcast Ephemeris Data ........ 63Figure 21. &East versus ANorth for Beach Lab, Precise Ephemeris Data ........ 66Figure 22. AHor versus AUp for Beach Lab, Precise Ephemeris Data .......... 67Figure 23. Mean AEast versus Mean ANorth for Beach Lab Repeatability: Average
Over Days by Receiver .................................... 71Figure 24. Mean AHor versus Mean AUp for Beach Lab Repeatability: Average
Over Days by Receiver .................................... 72Figure 25. Mean AEast versus Mean 4North for Beach Lab Repeatability: Average
Over Receivers by Day .................................... 75Figure 26. Mean AHor versus Mean AUp for Beach Lab Repeatability: Average
Over Receivers by Day .................................... 76
ix

Figure 27. AEast versus &North for LOBOS3 ............................ 79
Figure 28. AHor versus AUp for LOBOS3 .............................. 80
Figure 29. Mean AEast versus Mean ANorth for LOBOS3 Repeatability: Average
O ver D ays ............................................. 83
Figure 30. Mean AHor versus Mean AUp for LOBOS3 Repeatability: Average Over
D ays ................................................. 84
Figure 31. AEast versus ANorth for BLDG 224.3, Broadcast Ephemeris Data .... 87
Figure 32. dHor versus ,Up for BLDG 224.3, Broadcast Ephemeris Data ...... 88
Figure 33. The Keplerian Orbital Elements ............................. 93
ia
x

LIST OF ABBREVIATIONS
BEPP ................................. Basic External Processing Program
C/A Code ............. Coarse/Acquisition Code
CT .......................................... Conventional Terrestrial Coordinate System
DMA....................................... Defense Mapping Agency
DoD .................................. Department of Defense
DOP ...................... Dilution of Precision
FIC............................................ Floating Point, Integer, Character
FICA ..................................... Floating Point, Integer, Character, ASCII
GASP ................ Geodetic Absolute Sequential Positioning Program
GDOP ............... Geometric Dilution of Precision
PS ....................................... Global Positioning System
MBPPE ............... Monterey Bay Precision Positioning Experiment
NAVSTAR ............ Global Positioning System
NGS ................. National Geodetic Service
P Code....................................... Precise Code
PRN .................................... Pseudo Random Noise or Number
ii

RINEX ...................................... Receiver INdependent EXchange Format
RMS .......................................... Root-Mean-Square
SA ............................................. Selective Availability
STARPREP .............................. GeoSTAR PREProcessor
TI 4100 ...................................... Texas Instruments Model 4100 GPS Receiver
UT/ARL ................................... University of Texas/Applied Research Laboratory
VAX .......................................... Digital Equipment Corporation VAX Computer
WGS 84 .................................... World Geodetic System 1984
xli

ACKNOWLEDGEMENTS
The following individuals and organizations are gratefully acknowledged for their
contributions to this project. Thanks to the Ashtec, Trimble, and Magnavox Corpo-
rations for providing GPS receivers used in the experiment and for providing valuable
technical assistance and advice. Also deserving recognition, the Texas Department of
Highways and Public Transportation for supplying the TI 4100 GPS receivers. Thanks
to the Defense Mapping Agency for furnishing the GASP programs and related doc-
umentation, and for providing the precise satellite ephemerides and clock states, the MX
1502 Transit Doppler receiver and the Transit positions. Special thanks to Steve Malys
of the Defense Mapping Agency for graciously answering any questions related to
GASP processing. Thanks to Dr. Hal Titus for taking the time to serve as second reader
and for his much appreciated input.
This list of acknowledgements would not be complete without thanking the exper-
iment participants themselves. To Commander Kurt Schnebele, Mr. James Cherry, Dr.
Stevens Tucker, LCDR. Barry Grinker, LCDR. Manuel Pardo, Mr. Arnold Steed, and
to LCDP. RQbert Wilson, thank you for committing extensive time and effort to mak-
ing the Monterey Bay Precision Positioning Experiment a success and for making the
long, cold nights at sea and at the Beach Lab tolerable. Also, thanks to Dr. Clynch for
his guidance, direction, and, in the end, patience in proofreading numerous revisions. I
would also like to thank my wife Elizabeth, and daughter Jennifer, for their support and
understanding in uncomplainingly enduring the many hours I spent staring at a com-
puter terminal.
xifi

1. INTRODUCTION
A. THESIS DESCRIPTION AND OBJECTIVES
I. Monterey Bay Precision Positioning Experiment OverviewThe Monterey Bay Precision Positioning Experiment (MBPPE) was designed to
assess the performance of some commercially available Global Positioning System
(GPS) receivers and the processing software developed to support the receivers. In
particular, the static and dynamic positioning solutions of the Trimble 4000ST, AshtechLD XII, Magnavox MX4200, and Texas Instruments TI 4100 receivers were examined.
All but the MX4200 are geodetic quality receivers. The Trimble, Ashtech andMagnavox models exhibit some of the latest developments currently available in GPS
receiver technology. The TI 4100 is an older model but is still widely used throughoutthe geodetic community.
The overall objective of the experiment was to acquire a large data set of GPSmeasurements in both static and kinematic modes with the different receivers, to processthe data by utilizing processing techniques and software relevant to a given application,
to interpret the results from a position accuracy and error analysis perspective, and toevalute the receivers and processing techniques based on these results.
2. Thesis OverviewThe purpose of this investigation is to determine whether meter level point po-
sition accuracy is attainable with the TI 4100, Trimble, and Ashtech receivers. The
Magnavox receiver is not considered in this study because it is a single frequency re-ceiver, whereas the other receivers operate on dual frequencies. This is a serious limita-
tion in determination of point positions since the dual frequency correction cannot beapplied to correct for ionospheric refraction.
This study is concerned with one aspect of geodetic positioning, the absolutedetermination of a point position in some commonly used reference frame. There aretwo general categories of positioning, static and kinematic. As may be inferred, static
positioning involves determining the positions of stationary objects and kinematic posi-
tioning the positions of moving objects. Static positioning may be divided into relativeand absolute positioning subclasses. Relative positioning is described as the estimationof the vector (baseline) connecting a known station to an unknown station. Absolute
or point positioning may be described as the estimation of the vector connecting the
,• w • ----'• "T •- • i •i•-i°i•i-i• i"T ~ • •-"• 7i -] • i• "i-° i l*•i--T i" i•]- i"- "i•" "i"i................• ...... ...... .....

origin of a global reference frame with an unknown station (Ref. I: p. 11. It then follows
that relative kinematic positioning may be described as the estimation of a vector con.necting a known static station to an unknown moving object. Station positions deter-
mined by absolute positioning methods may be used as mapping control points, datumtransformation ties or in other mapping related applications. Once the absolute position
of a station is determined it may be subsequently used as a known station in a relative
positioning survey to establish the positions of additional stations.
The tool used to produce the absolute position solutions was the Geodetic Ab-solute Sequential Positioning (GASP) System of programs developed by the Defense
Mapping Agency (DMA) [Ref. I: p. 1, Ref. 2: p. 487). GASP estimates the absolute
position of a point in the geocentric, earth-flxed, cartesian, Conventional Terrestrial(CT) coordinate system in the World Geodetic System 1984 (WGS 84) reference frame
(See Figure 1). One axis of the CT system passes through the intersection of theGreenwich meridian and the equatorial plane. The third axis passes through the Con-
ventional International Origin (CIO) which is the average position of the earth's rota-tional pole for the years 1900 to 1905. The second axis is orthogonal to the first and
third axes in a right-hand sense. [Ref. 3: Sec.5,6J
2

POINT POSITIONING
ioCmworm a
TIE C"WMIOCNAL TEPESTRIAL COOF:DINATE SYSTEM
Figure 1. The Conventional Terrestrial Coordinate System
3

DMA has been processing GPS data collected with the TI 4100 with GASP for
the last few years and it has demonstrated that geodetic quality point positions are rou-
tinely achievable. This means that a position solution with a standard deviation on each
component of less than one meter can be expected, usually with data collected over a
span of about four hours at a data collection rate of 30 seconds. Because accuracy re-
sults using the TI 4100 data with GASP are well documented, a benchmark had already
been established that would provide a reference for the results we would obtain. [Ref.
I: p. 5J
a. Thesis Objectives
Before this project, GASP had the ability to process data collected with the
TI 4100 receiver, using the Floating point, Integer, Character, ASCII (or FICA) format
as the input format. One of the goals of this thesis was to modify GASP such that the
programs would accept the measurements of any GPS receiver type. The Receiver
INdependent EXchange (RINEX) format was chosen as a second data format through
which receiver measurements could be entered into the program (Ref. 41. The RINEX
format was selected because it is one of the more widely recognized and accepted of the
exchange formats currently in use and because both the Trimble and Ashtech data
processing packages have programs that will convert their data to the RINEX format.
It was also desired that the GASP programs retain the capability to process data in the
FICA format for which GASP was originally written.
In addition to modifying the GASP program to accept the data ftrom the
Trimble and Ashtech receivers other objectives o" this thesis are:
", To compare GPS position solutions produced for the TI 4100, Trimble 4000ST,and Ashtech LD XII OPS receivers to the solutions obtained from an independentmethod.1
"* To compare the receiver position solutions for the broadcast ephemeris versus theprecise ephemeris
"* To examine repeatability (i.e., consistency) of results
"* To examine the effects of Selective Availability on the position solution when usingthe broadcast ephemeris
1 The Transit Doppler positioning system was the independent method used in this compar.ison and the positions derived from this method are taken as the 'true* positions.
4

B. BACKGROUND
1. The Global Positioning System (GPS) - Fundamental Concepts
There are a number of satellite based positioning systems being used to establish
the position of an observer on or near the surface of the earth. The Global PositionLig
System (GPS) is one such system [Ref 3: Sec. 3.01. The NAVSTAR Global Positioning
System is a passive navigation and satellite positioning system operated by the Depart-
ment of Defense (DoD). It was developed to afford the user instantaneous three-
dimensional position information anywhere in the world. GPS exploits simultaneouslyreceived radio frequency signals to determine range measurements between satellites and
earth based receivers. These measurements along with a knowledge of the satellite posi-
tions can be used to solve for the receiver coordinates.
Through recent advances and upgrades in hardware, software and the develop-
ment of new techniques in data processing, the systems applications have expanded
dramatically. Particularly in the areas of high precision surveying and crustal deforma-tion studies, GPS has rapidly become competitive with other positioning systems and
techniques (Ref. 51.
The strength of the GPS system in geodetic work lies in its relative affordability,portabilty, ease of operation, and high accuracy in comparison to other high precision
positioning systems (Ref. 61. For example, the Transit Doppler satellite based position-
ing system requires two to four days of data collection to produce a geodetic quality
point position. GPS, on the other hand, is able to produce a geodetic quality point po-
sition in only four hours of data collection (Ref. 1: p. 51. From a mapping and chartingperspective, the fact that it provides posi:ion determinations in a unified coordinate
system may be its most important feature.
a. GPS System Components
GPS consists of three primary segments: the satellites, the ground control,
and the users.(1) The Satellite Segment. The GPS satellite constellation, as of mid
1991, consists of 16 satellites deployed in high earth orbit (about 20000 km altitude)
configured such that a minimum of four satellites are visible to the user at a given timewith from five to seven satellites typically available. The satellites are arranged in six
orbital planes and have an orbital period of about 12 hours. It is proposed that 24 sat-
ellites eventually be deployed to ensure that a minimum of six satellites will be visible to
the observer.
•"T T F i ............ ............ ............... ... ... ...

Each satellite transnits two radio frequency signals in the L-band,
one at a frequency of 1575 MHz (termed LI) the other at 1227 MHz (L2). The LI fre-
quency is modulated by the Coarse/Acquisition (C/A) code, the Precise (P) code and the
Navigation Message. The L2 frequency is modulated only by the P-code and the Navi.
gation Message.
The C/A and P-codes are binary, pseudo-random noise (PRN) codes.
Pseudo-random noise codes resemble true random noise except that random noise car-
ries no information whereas PRN codes are generated to be predictable and carry in-
formation. In this case, the information is used to determine the time of signal transit
from satellite to receiver. Identical codes are generated by both the satellites and the
receiver and cross-correlations (determination of the scalar product of the code sequence
with a time delayed copy of itself) of the incoming satellite codes with the receiver gen-
erated replicas are performed to determine the time reading of the transmitter clock.
The C/A and P-code modulations shift the phase of the carrier L-
band frequencies by 180 degrees. They are essentially a sequence of positive and negative
ones superimposed onto the carriers at frequencies of 1.023 MHz and 10.23 MHz re-
spectively. If the code value is minus one the carrier phase is shifted, if plus one there
is no efect on the carrier signal (See Figure 2).
The C/A-code sequence repeats every millisecond yielding a C/A code
cycle of 300 kilometers. There are 210 C/A code chips in one code cycle so that the length
of one code chip corresponds to about 300 meters. Since it is possible for receivers to
measure fractions of chips, the C/A code may be used as a medium accuracy navigation
signal. C/A codes are exclusive to a particular satellite making it possible to distinguish
between signals received simultaneously from the satellites.
The P-code sequence repeats every 267 days and is subdivided into
38 seven day segments. Each satellite is assigned a one week segment of the code. Thus
all satellites can transmit on the same frequency and still be distinguished from each
other. This weekly subdivision creates an identification system based on the PRN seg-
ment assigned to a particular satellite. If, for example, a satellite is assigned the seventh
weekly segment of the code sequence, it is identified as PRN 7. Codes are initialized
once per week at Saturday midnight. Since the length of a P-code chip corresponds to
about 30 meters, the P-code supplies a more precise measurement than the C/A-code.
Critical satellite hardware components are the on-board atomic
oscillators (highly stable and precise cesium and rubidium clocks) which control the
generation of the carrier frequencies and code modulations. The signals are coherently
6

Code Modulation
Figure 2. Code Modulation
generated from the same fundamental frequency, designated f, - 10.23 MHz. The twocarrier frequencies are multiples of the fundamental withfL, - 154/e and fu-- 120f. The
C/A-code modulation has a chip rate one-tenth the fundamental frequency (/'d 10) andthe P-code a chip rate equal to the fundamental frequency (f.).
The Navigation Message is a low data rate message (broadcast at 50bits per second) that contains information on satellite health, satellite clocks and theBroadcast Ephemerides. The contents of the navigation message are updated hourly.
Before the receiver position can be determined, the positions of theorbiting satellites must be known. The broadcast ephemerides are a set of predicted or
extrapolated orbital parameters which define the satellites position with time and are
used principally in real-time positioning. Satellite tracking information, received by five

ground tracking stations (identified in the next section), is used in a least squares ad-
justment to estimate the satellite positions. The positions of the ground tracking stations
are held fixed in the estimation process. The broadcast ephemeris information is valid
only over a specified time interval (about six hours), not over the entire orbit. The main
reason the navigation message is updated hourly is so the broadcast ephemeris remains
current.
The Keplerian orbit description contained in the broadcast ephemeris
is the means by which the conventional terrestrial coordinates of the satellites are com-
puted. Six Keplerian elements and a reference time are needed to completely describe the
satellites orbit in the CT coordinate system. Five of these elements define the satellite
orbit and the other describes the position of the satellite in the orbit as a function of
time. The other broadcast ephemeris parameters transmitted in the Navigation Message
describe the deviations or perturbations of the satellite motion from the smooth ellipse
defined by the six Keplerian elements refered to above. For the complete list of the
broadcast parameters and the computations required to convert the Keplerian orbital
parameters to coordinates in the conventional terrestrial system, see Appendix A.If more accurately determined satellite orbits are required than are
provided in the broadcast ephemeris, a post-computed or precise ephemeris may be ob-
tained. The Defense Mapping Agency and the U.S. National Geodetic Service are the
agencies responsible for generating and distributing this information to the user upon
request. Because the precise ephemeris is computed after satellite observations are made
and is an interpolation of satellite position based on a least squares adjustment using ten
ground stations rather than five, much better accuracies for the satellite position are at-
tainable. The precise ephemerides, as supplied by either DMA or NGS, difTer from the
broadcast ephemerides in both data presentation and in the frequency with which satel-
lite positions are estimated. The precise ephemeris furnishes satellite positions already
computed in the CT coordinate system and gives the satellite velocities in the directions
of the coordinate axes. The CT satellite positions and velocities are determined every
15 minutes in contrast to the hourly updates of the broadcast ephemerides.
(2) The Ground Control Segment. This segment consists of five globally
distributed monitoring stations that track the satellites and transmit tracking informa-tion to the master control station in Colorado Springs, Colorado. It is here that com-
putations are performed to provide the broadcast ephemeris contained in the updated
navigation message. The updated navigation message is then uploaded to the satellites
for broadcast to the user. The navigation message, as previously stated, contains infor-
L8

mation on the health status of the satellites, and information on the satellites orbits and
atomic clocks. The five monitoring stations are located at Diego Garcia, Ascension Is.
land, Kwajalein, Hawaii, and Colorado Springs (See Figure 3).
-VC,
Figure 3. GPS Control Stations
(3) The User Segment. The user segment is composed of civilian and
military users exploiting some type of GPS receiver and receiving antenna system. GPS
receivers have the ability to receive the LI and L2 signals from a number of satellites
simultaneously by devoting specific channels to each satellite signal. Once the signals are
channeled they can be individually processed. The three most commonly used types of
GPS receiver are the code-correlating receivers, squaring channel receivers, and receivers
that incorporate elements of both of these techniques. The code-correlating technique
is normally employed to decode the broadcast message and also to provide pseudorange
9

measurements from either the C/A or P-codes. The TI 4100 provides pseudorange
measurements from the P-code while the Trimble and Ashtech pseudoranges are derived
from the C/A-code. Once the carrier signal has been demodulated (i.e. the navigation
message and PRN codes removed), the carrier frequencies may be processed to provide
carrier phase measurements. The squaring channel technique provides carrier phase
measurements but cannot be used to extract the broadcast message (satellite position
and clock information must be supplied externally) nor provide pseudoranges (for details
on the pseudorange and carrier phase measurements see the next section).
Essentially, code-correlating receivers operate by internally generating
a replica of the incoming code modulated satellite signal. The start of the code replica
will be offset due to the propagation delay between satellite and receiver. The replica is
then incrementally shifted or cross-correlated with the incoming coded signal and the
clock controlling the generation of the replica signal is corrected to reflect the shifts.
Once the replica is aligned to the incoming signal, it stays locked to it. At this point, the
replica code generator clock reads identically to the sateUite clock and the signal trans-
mission time is determined by differencing this time from the time recorded on a receiver
clock on GPS time. This time difference multiplied by the speed of signal propagation
gives the pseudorange. Once code lock is attained, the code may be removed from the
incoming signal and the satellite navigation message extracted. The signal, now demod-
ulated, may at this point be used for processing carrier phase measurements.
Squaring channel receivers operate by squaring the incoming satellite
signal effectively removing any phase reversals resulting from code modulations im-
pressed on the signal at the satellite. This produces a signal that is double the frequency
of the incoming signal (See Figure 4). The phase difference between this squared signal
and an internally generated replica is still easily determined however. The accumulated
phase difference (whole and fractional cycles) is continuously counted and from this the
carrier based change in range is determined by multiplying by the wavelength of the
squared signal.
10
-~I0

Squaring Channel
MocUst~d otts\
Figure 4. Squaring Channel
GPS receivers are equipped with quartz crystal oscillators rather thanthe more precise, stable, and expensive atomic oscillators used aboard the satellites.These oscillators do however provide more than sufficient precision and short term sta-bility for the typical length of a surveying session. Like the satellite clocks, the receiverclocks control signal generation.
Internal receiver software estimates the receiver position by employ-ing least squares or Kalman filtering algorithms using the broadcast ephemeris satellitepositions and pseudorange or carrier phase measurements. All receivers estimate the
receiver clock bias in addition to the postion parameters and then use this value to reset
the receiver clock to GPS time.
11

b. GPS Operating Principles - Emphasis on Point Positioning
(1) GPS Observables and Observation Equations. There are two types of
observation that may be exploited to determine positions, the pseudorange measurement
and the carrier phase measurement. For point positioning particularly with GASP, the
carrier phase is of primary interest and so is emphasized here. Pseudorange measure-
ments to the extent they are used by GASP, serve only to monitor the validity of the
carrier phase measurements and are not used in the actual position estimation. The
fundamentals of pseudorange positioning are briefly touched on, however, in an effort
to convey some general concepts and introduce some common terms.
(2) Pseudorange. Under ideal conditions (i.e., precisely known satellite
location, signal propagation speed, and perfectly synchronized satellite and receiver
clocks) the travel time of the signal would be given by
T = t,- tZ
where t, is the time of signal reception at the receiver and t, is the time of satellite signal
transmission. This time difference would then be converted to distance units (p) by
multiplying by the appropriate speed of signal propagation (c), where p- c T. This
range measurement, along with the range measurements of two additional satellites and
the known locations of the three satellites, could then produce a system of equations
that can be solved to uniquely determine the receiver positions.
In the real world, we must be concerned with error sources and their
effects. A major source of error in any GPS measurement is the inability of the receiver
and satellite clocks to maintain alignment with the refert ice time standard (GPS time).
Of these two types of clock error, that associated with the receiver dominates due to the
lower precision and stability of these clocks. The Allan variance is often cited as an in-
dication of oscillator stability. The Allan variance values for receiver crystal quartz
oscillators are typically several orders of magnitude larger than the satellite atomic
oscillators. Satellite clocks take longer to warm-up and to stabilize initially but they
maintain stability much longer than do receiver clocks.
To address the problem of clock errors, we introduce a combined
satellite and receiver, first order clock correction term as a fourth parameter in our sys-
tem of equations. Expressing the receiver clock offset from GPS time as
r- t, - t
12

where,t, is the receiver clock timet is GPS time
and the satcllite clock offset from GPS time as
x- Ix- I
where,t. is the satellite clock time
the combined clock correction term becomes
dr - Tp - x
Because of clock and other types of errors, the measured range between satellite andreceiver is not the true range but is rather a biased range referred to as the pseudorange.Designating the pseudorange as p, the system of observation equations is representedby:
P,,- P + C dr,
with i greater than or equal to 4,
where p,, the true range from the ith satellite, is given by
p,-_ j(xI,-X,)2 + (y, _ye)1 + (z,,- z,) 2] 112 = IX,,-.XrI
In this equation,
x,, is the x coordinate of the ith satellitey,, is the y coordinate of the ith satellite
z,, is the z coordinate of the ith satellite andx,,y,, z, are the unknown receiver coordinates.
The addition of this fourth parameter requires a minimum of four observation equationsto solve for the receiver coordinates and the clock correction. If T, is now introduced to
13

express the time delay associated with other error sources the pseudorange equation
becomes:
P,, - Pg + c (dr, + Tp)
The pseudorange is the observable most often used to obtain a navi-
gation solution where submeter level accuracy is not required. Three dimensional navi-
gation solutions currently offer best case positional accuracy at 16 meters. While
certainly suitable for navigating a vessel, a position in error by 16 meters could not be
used as a reference for establishing or extending mapping control. For high precision
relative or point positioning, phase observables are needed. Because the carrier phase
wavelength is shorter than the code modulations to the carrier signal (20 centimeters for
LI as opposed to 30 meters for the P-code), the carrier signal may be used to provide a
more precise distance measurement.
(3) Carrier Phase. It is possible to obtain distance (or more exactly
change of distance) information by measuring the phase of the carrier signal. The dif-
ference between the phase of a receiver generated carrier signal and the incoming,
Doppler shifted, satellite carrier signal gives the carrier beat phase observable
4m P +fdF -fp
where, 4 is in cycles andfis the signal frequency.
The total continuous carrier beat phase measurement consists of an
accumulating count of the whole and fractional difference in cycles since the time of
signal acquisition. What is not recorded is an unknown number of integer cycles at initial
signal reception (the whole number of cycles between the receiver and satellite). Theunknown number of cycles is referred to as the cycle or integer ambiguity. The totalcontinuous carrier phase can be expressed
),ot01", -,O, + N(to)
where N(t,) is the integer ambiguity. A carrier phase equation comparable to the
pseudorange equation can be written,
ol- A O' muS,- p - c (dT, + Tp) + A N(to),
14

where, p. is the phase biased pseudorange,
T, is the signal time delay associated with other error sources and
A - cf is the signal wavelength.
Sec Figure 5 for a graphic representation of the carrier phase concept.
estoe".
CWr
I * I I I I
o. a o Fraction, o 0 o 0 o 0 of CycleSp I I Of
• a -- ----- ---- ---- ----
t - (0)
Figure S. Components of Carrier Phase Measurements
c. Measurement Errors and Error Models
There are two types of errors that effect oPS measurements and degrade the
accuracy of the estimated position, systematic errors itnd random errors. Systematic
41
errors are errors resulting from a predictable source. These errors are typically of con-
stant magnitude under a set of given conditions. When the cause is understood, these
I , ca in n
S-.-X~*..-. ~- in me-- -.-- - ~ --. - . -- - - - -

Measurement biases resulting from systematic errors produce offsets between the values
that are observed and the 'true- value. After systematic errors are eliminated from
measurements, random errors remain. These errors are defined by repeated measure-
ments. A repeated measurement will not yield identical values each time due to the oc.
currence of random errors. They indicate how well a measurement may be repeated and
characterize the precision of a measurement. If they are the only error source, they are
a measure of accuracy. Random errors are usually small and the probability of a positive
or negative error of a given magnitude are the same. Random errors are dealt with in a
least squares adjustment. [Ref. 7, 8)
GPS systematic errors can be divided into three general categories: satellite
errors, station errors, and observation dependent errors. Satellite errors include errors inthe computed satellite ephemeris or in the model for the satellite clock provided in the
navigation message. Station errors occur as a result of errors in the receiver clock. Ob-
servation dependent errors are related to factors that influence the speed of signal
propagation, ambiguities in phase observables, etc.
(1) Satellite and Receiver Clock Errors. Inability to perfectly synchro-
nize the receiver clock and the more tightly controlled satellite clock to a standard ref-erence (or GPS) time produces time offsets. If, for instance, there exists a one
microsecond timing misalignment between satellite time and receiver time, a 300 meter
range bias will result. Additionally, the clocks may be misaligned in frequency (a.fre.
quency bias) or the frequencies may change over time (frequency drift). Any of these
will produce clock errors. Random error (or noise) also effects the time measurements.
The timing behavior of the satellite clocks is carefully monitored bythe ground stations and the drift of the clocks from standard GPS time determined. The
amount of the satellite time offset, frequency offset, and frequency drift are then ex-
pressed as coefficients of a secvnd-order polynomial that are transmitted in the naviga-
tion message. The polynomial coefficients are determined via a least squares adjustment
performed at the master control station in Colorado Springs. The polynomial has the
form,
Tr - ao + a, (t - to) + a2 (t - to)2
where, 4 is some reference epoch,
a, is the satellite clock time offset,
a, is the frequency offset, and
16
• •' • •i-+-=•... -•-;'•i•i. . "i. . . I- I I~ it- i • , . . . . . . ..f

ai is the frequency drift. In this manner, satellite clock synchronization to GPS
time is typically maintained to within 20 nanoseconds.
GPS receiver clock errors must be modeled if the user desires a high
accuracy solution. Receiver clock errors may be treated in a fashion similiar to that for
the satellite clocks. The polynomial coefficients may be estimated as additional param-
eters in a least squares adjustment along with the receiver coordinates.
(2) Orbit Errors. The positions of the satellites with time are well known
but, due to forces acting on the satellites that may not be adequately modeled, are not
perfectly determined. The error in satellite position propagates to contribute to error in
the receiver position. The magnitude of this error depends on whether the broadcast
(predicted) ephemeris or the precise (post-fit) ephemeris is used to determine the satellite
positions.
Improving the models used to describe the forces acting on the satel-
lite is one approach to obtaining more accurate satellite positions. Another is to include
parametric models for the forces as part of the orbit estimation process performed by the
control segment. Depending on the application, the effects of orbit errors may be ig-nored altogether or the data may be differenced to reduce or eliminate these effects.
(3) Observation Dependent Errors. The speed of signal propagation is
influenced by many factors including; signal interaction with the ionosphere and
troposphere, relativistic effects on the signal, etc.(a) Signal Interaction with the Ionosphere- Signal interaction
with the free electrons found in the ionosphere produces a change in path length that
may be on the order of tens of meters. The free electrons are released from gas molecules
ionized by incoming solar ultra-violet radiation. Any condition that acts to release more
electrons, such as increasing the amount of incoming solar radiation (midday or during
increased sunspot activity), will correspondingly lengthen the signal path. Satellite-
receiver geometry also plays a role as the total number of free electrons along the path
is a function of the distance that the signal travels through the ionosphere. Thus when
a satellite is near the horizon the signal encounters more electrons than when near the
zenith. This ionospheric effect is frequency dependent and is inversely proportional to
the square of the signal frequency. A comparison of measurements on LI and L2 may
be used to derive a dual frequency correction given by
[PL I r PL,- )dp~l., E'L
F
1'7

where r is defined by
For single frequency receivers, an ionospheric model must be used in place of the dual
frequency correction or ignored altogether. [Ref 2: p. 489j
(b) Tropospheric Interaction- Tropospheric effects are a result
of refraction in the neutral atmosphere and are not frequency dependent. This effect may
be separated into two components: the dry component, and the wet component. The drycomponent comprises about 90% of the total effect and is a function of the surface at.
mospheric pressure. It is approximated in the vertical by
DTC - 2.27 x l0-3(m/mb) Po
where P. (the atmospheric pressure) is in millibars and DTC (the dry term range con-tribution) is in meters. In the zenith direction, this corresponds to a maximum range
bias of about 2.5 meters. The DTC increases with decreasing satellite elevation angle and
at five degrees above the horizon it ranges from 20-30 meters.Estimating the effects of the wet component is a more compli-
cated proposition. It depends on the total water vapor content along the signal path and
hence on the temperature, pressure, and humidity. Surface temperature, pressure and
humidity values are used to estimate the magnitude of the integrated effect by employingan atmospheric model such as the Hopfield or Chao models [Ref. 2: p. 4901. If obser-vations from water vapor radiometers are available, they will most accurately profile
atmospheric conditions along the path.(c) Integer Ambiguity- In differential positioning applications,
missing whole cycles (refered to as integer ambiguities) in the carrier phase measure-
ments must be resolved if we are to fhlly exploit the more precise nature of phasemeasurements. Efforts must be made to account for any whole cycles not recorded inthe observations. This may be the result of a loss of phase lock between receiver and
satellite due to some obstruction to the signal. Also the initial number of whole cycles
between satellite and receiver (the integer ambiguity) must be determined. Many tech-
niques have been developed to resolve the absense of any cycles from the measurements.
In point positioning with GASP, resolution of the integer ambiguity is not a problem
as we shall see.
1m

Other effects that must be accounted for include: relativisticeffects, earth rotation (i.e., receiver position in motion) during time of signal trans-mission, and offset of the satellite transmitting antenna position from the position of thesatellite center of mass (the position given by the ephemeris). Corrections to account forthe effects of these error sources are applied to the phase biased pseudorange and thepseudorange observables before the GASP model is formed and the estimation algorithmis executed. Details on the models employed to compute these corrections are given inthe chapter on GASP processing.
(4) Comments on Selective Availability. Selective Availability (SA) is theintentional degradation of the position solution available to a select segment of the usercommunity (i.e., most civilians and unfriendly military) operating in a real-time naviga-tion mode. It may be implemented by the DoD at their discretion. The solution degra-dation is accomplished by broadcasting inaccurate positions for the orbiting satellitesor by dithering the satellite clock so that an inaccurate signal transmission time is ob-tained. This will not greatly effect relative positioning applications since receiver differ-encing schemes remove these errors. For point positioning applications that rely on thepost-computed precise ephemeris, only the clock dither will effect the solutions.
d. Geometric EffectsIn addition to the errors just presented, the configmuation of the satellites
relative to the receiver also has an effect on the determination of the receiver position.This geometric influence is referred to as the Dilution of Precision or DOP factor. It isroughly represented by the ratio of the positioning accuracy (a,) to the measurementaccuracy (u.) or
DOPz VP
00
Actually there are a number of DOP factors. The most commonly referred to of these,the Geometric Dilution of Precision (GDOP), is more precisely defined as the squareroot of the trace of the covariance matrix (the trace being the sum of the four diagonalelements; the three position variances and the time variance). The DOP is a measureof the geometric strength of the satellite configuration that changes with time. The timeof most favorable observation for obtaining a user position is when the DOP is small(with a DOP of less than five preferred) and falling. Since the number and the positionsof the satellites visible to the observer changes over time, many possible geometric sce-narios are available over a tracking session. A GPS survey should be planned to take
19

best advantage of changing geometric scenarios. For point positioning, a geodetic
quality position solution can usually be obtained with approximately four hours of data
collection. During times of very favorable geometry, a geodetic quality point position
may be obtained in a shorter time.
e. Djferencing TechniqaesBy forming linear combinations of the basic pseudorange or carrier phase
equations, a number of error sources common to the measurements being differenced
will cancel or be greatly reduced. The accuracy of the computed position can be signif-
icantly improved by employing differencing because many sources of measurement error
are removed or reduced. The three types of differencing combinations often used are:
differencing between two satellites, differencing between two receivers, and differencing
between two epochs (time periods). These are referred to as single differences. The dif.
ferencing schemes involving the carrier phase equations are the only ones presented here
since they are used to form the GASP model Differencing schemes that involve the
pseudorange equation are ignored since pseudorange observations do not contribute to
the position estimation except as a means of screening the carrier phase observations.
Also, diftrencing techniques involving multiple receivers are neglected in this treatment
except to state what types exist and the what errors they effect.
Between.epoch single differencing involves differencing two equations of the
instantaneous carrier phase for one satellite and one receiver. The carrier phase
equation at epoch I is described by
p - P, - C (dij + Tpj) + A N(40)
The carrier phase equation at epoch 2 is given by
P43- P2 - C (dr2 + T)+ 1 N(10)
Differencing then yields
P,, - P#, - (PI - P2 )- c (dil - drV2 +rp -p,
Introducing 6 as the difference notation the equation may be written
apo - dp - C (6dr - 6hT)
See Figure 6 for a graphic depiction of between-epoch single differencing.
20

Between-Epoch Single Differencing
Satellite, of
Figure 6. Between-Epoch Single Differences: Differencing Range Equations ofOne Satellite Over Two Consecutive Measurement Epochs
The advantage of this scheme is that the initial integer ambiguity is removed.
Similiar manipulations can be performed to yield between-satellite single
differences (See Figure 7). For two satellites represented by the superscripts a and fl,
phase equations are given by,
21

- - c (dr' + •,) + A N(to)"
and,
pO - p - c (d. + 4) + A N(o)?
The between-satellite single difference equation 'or the carrier phase is
p; - P - p e - $ - c (d• - do + T; - 4) + A (N(•r - N(toj0)
or,
dp# - dP + c (dtr - dP) + A dN
Between-Satellite Single Differencing
Seit Stmt
titi
Figure 7. Between-Satellte Single Differences: DifTerencing Range Equations of
Two Satellites Over One Measurement Epoch
22

For between-satellite single differencing, receiver clock errors are removed or reduced.It is also possible to form between-receiver single difference equations to
remove satellite clock and orbit errors. This is important in relative positioning but
cannot be used in point positioning.We can now form double difference equations from the single difference
equations. For example, a satellite-receiver double difference may be formed by differ-
encing two between-satellite single differences (involving the same pair of satellites) overJo, two receivers. This scheme removes or reduces the effects of errors associated with sat.
ellite and receiver clocks.
Receiver-time double differences and satellite-time double differences may
be formed in a similiar manner. Receiver-time double differencing removes or reduces the
effects of errors associated with satellite clocks and eliminates integer ambiguities.
Satellite-time double differencing (essentially the GASP model, see Chap. II1 for moredetails) removes or reduces the effects of errors associated the receiver clock and elimi-
nates integer ambiguities.
It is also possible to construct an equation for a receiver-satellite-time tripledifference observable. This gives the change in the receiver-satellite double difference
from one epoch to the following epoch. With triple differencing, in addition to the can-
cellation of integer ambiguities for carrier phase measurements, all clock and satellite
orbit errors are removed. Triple differencing is widely used in relative positioning appli-
cations [Ref. 91. This technique cannot be employed in point positioning.
The disadvantages to differencing are that the number of observations hasbeen reduced and mathematical correlations are introduced as a product of the differ-
encing process. This produces a weaker solution than that provided by not differencing.
Correlation matrices should be computed to equate the differenced data to the undiffer-
enced data but generally differenced observables are treated as uncorrelated.
Now that systematic errors have been reduced or removed by error model-
ing (i.e., applying measurement corrections) or by differencing and the mathematical
model has been defined by forming the undifferenced or differenced observationequation, the receiver coordinates and other parameters may be estimated by invoking
the method of least squares. For a more complete explanation of the use of the least
squares method in GPS, see Appendix B. I''
23

2. Positioning with Transit Doppler
The method of Transit Doppler positioning is briefly reviewed here. Since this
method was used to provide the independent reference positions to which the GPS de.
rived point positions were compared, some insight into Transit Doppler positioning is
necessary.
The U.S. Navy Navigation Satellite System or Transit has been in continuous
operation since the mid 1960's. Transit can be regarded as the forerunner of GPS in
many respects. Many of the ideas and techniques developed during the era of Transit
positioning have been refined and employed in GPS. It is anticipated that Transit will
be replaced by OPS in the near future. Like GPS, Transit consists of three segments: the
satellites, the ground control, and the users.
Six active Transit satellites are deployed in circular polar orbit at an altitude of
approximately 1100 kilometers. This height was selected because excessive orbital height
would provide too low a rate of change of Doppler frequency. If the orbit were too low,
the Doppler frequency rate of change, ionospheric refraction, and especially the effects
of atmospheric drag become too great. The orbital period of the satellites is about 107
minutes. See Figure 8 for a general representation of the Transit Positioning System.
2
24
-7= ' "+•-'i+i' -° .. .. l |'-i i I i -

Tranit atellte Poiinn
UN
* mentsandPFuntions
25OD

Each satellite transmits two separate frequencies at 400 MHz and 150 MHz.
The frequency generation is controlled by a single highly stable crystal oscillator. The
use of two frequencies permits the determination of an ionospheric refraction correction.
A broadcast message containing orbital information is superimposed on the two carrier
frequencies by phase modulation.
Three major differences between GPS and Transit may already be noted; th!
differences in satellite height, the use of only six satellites as opposed to 24 GPS sate!-
lites, and the use of crystal oscillators rather than the more precise atomic oscillators
on-board the satellites. By having only six satellites available with fewer than this actu-
ally visible, it takes much more time to acquire an equivalent number of Transit obser-
vations.
Tracking stations record the Doppler measurements (i.e., the Doppler shift in
the frequency transmitted by the satellite) on each satellite pass. This information is re-
layed to the central processing or control station where the satellite orbits are determined
and extrapolated, then this ephemeris data is updated and uploaded to the satellites(about every 12 hours) for subsequent rebroadcast to the user. In addition, a timing
station is responsible for monitoring the time signals received from the satellites andadjusting the satellite clocks as needed.
a. The Basic Principle of Doppler Positioning
The received frequency will differ from the transmitted frequency due the
Doppler effect because the receiver and satellite are moving relative to each other. If the
satellite transmits a stable frequency f, then the frequency at the receiver is given by
where,
r - A is the range ratedtr is the distance or range between receiver and satellite
c is the speed of signal propagation.
The Doppler frequencies (or Doppler shifts) are measured by subtracting
the received shifted frequenciesf, from a constant receiver reference frequencyf, (the 400
and 150 MHz frequencies alluded to earlier). The time of closest approach of the satel-
lite is the time whenf, equals f,. Integrated Doppler measurement techniques that count
the number of accumulated cycles of Doppler shift are utilized in most Transit Doppler
26

receivers. The reason for this is that counting cycles can be performed more preciselythan instantaneously measuring the frequency.
The receiver position may be determined by continuously counting the
number of cycles of the Doppler frequency. Referred to as the Continuously IntegratedDoppler (CID) measurement mode, these observations along with accurate positions for
the satellite can be used to establish the receiver position in two dimensions. For three.dimensional positioning, multiple satellite passes must be observed.
The Doppler counts must be corrected for the effects of atmospheric re-fraction in both the ionosphere and the troposphere. In this respect, all other errors
(relativity, earth rotation, etc.) that effected the GPS measurements will be present in the
Transit Doppler measurements as well. Attempts, such as error modeling, should bemade to minimize their impact.
For the point positioning mode, the one of interest in this study, the ob.servations from multiple satellite passes were collected with a single Doppler receiverover about a four day period. Precise ephemerides were used to compute the satellite
positions from which the CT coordinates of the site were determined. The estimated ac-curacies for a position solution achievable under this type of scenario is believed to beon the order of one meter.
27

11. EXPERIMENTAL PROCEDURE
A. GENERALThe Monterey Bay Precision Positioning Experiment was conducted in early De.
cember 1990. Aspects of the experiment relevant to point positioning will be emphasizedin this and following sections. A large data set of static and kinematic GPS measure-ments was collected over four consecutive nights, from December 4 through December7, with four commercially available GPS receivers. Each night's collection session lastedabout six hours, from 11:00 p.m to 5:00 a.m. local time. This time window was selected
because it was the period of maximum satellite visibility for the week of the experiment.This would permit the tracking of at least four satellites simultaneously, a crucial con-sideration from the standpoint of kinematic operations (at least four satellites are neededto solve for a three. dimensional position and clock bias). Fortunately, this was also thetime when ionospheric effects on the measurements were minimal. All GPS measure-
ments were recorded at a rate of one per second.The MBPPE static GPS positioning data was collected at the Naval Postgraduate
School's Beach Lab in Monterey, California. An array of five marks, refered to as theDoppler Array, was established to serve as the receiver reference points. In order to in-itialize the kinematic operations, a reference array (the Lobos Array) was established atthe Monterey Bay Aquarium Research Institute's pier in Moss Landing, California. Oneof the points in this array would provide additional static GPS measurements that wouldbe utilized in this thesis. Another site, established on the roof of the NPS Mapping,Charting, and Geodesy building (in Monterey), would supply static GPS measurements
for the Selective Availability test. See Figure 9 for a map of the experiment area.
28

122 W 50, ± 37 N
MONTEREY BAY
50,
Area of OPestkYOr 40*
MBARISeasied
Monterey cww kmoo
Carmel
0
36 N
____ ____ ___ ____ ____ ___30,
Figure 9. Map of Experiment Area
29

B. EQUIPMENTI. Acquisition and FamilIarization
The four models of GPS receiver used in the experiment were the TI 4100, theTrimble 4000ST, the Ashtech LD XII, and the Magnavox MX 4200. Two rubidiumoscillators accompanied the TI 4100 receivers. For a summary of some of the featuresavailable on each, see the following tables (the Magnavox is excluded since it was notused in point positioning).
Table I. ASHTECH RECEIVER FEATURESStandard Features Comments
No. of Channels 12 dual frequency chan-nels
Internal RAM Capacity 6 MB-internal______________datalog inmg
Recording Interval I second or moreFrequencies Dual Frequency LI/L2
Measurements Ll/L2 Carrier Phase, C/A_.. . .__ Code Pseudorange on L I
Table 2. TRIMBLE RECEIVER FEATURESStandard Features Comments
No. of Channels 8 dual frequency channelsInternal RAM Capacity I MB - used externalI n M adatalogger (PC)
Recording Interval I second or moreFrequencies Dual Frequency LI/L2
Measurements LI/L2 Carrier Phase, C/Acode Pseudorange on LlI
Two of each type of receiver was acquired either from the vendors themselvesor from some other source. The Ashtech, Trimble, and Magnavox models were bor-rowed from the respective vendors, while the TI 4100s were on loan from the TexasDepartment of Highways and Public Transportation. The receivers were obtained a fewweeks prior to the data collection target dates so that the experiment participants could
30

Table 3. TI 4100 RECEIVER FEATURESStandard Features Comments
No. of Channels 4 dual frequency channels
Internal RAM Capacity external datalogging viaPC only
Recording Interval I second or more
Frequencies Dual Frequency LI/L2
LI/L2 Carrier Phase, PMeasurements code Pseudoranges on
LI/L2
become properly familiarized with the equipment. One person was assigned the respon-
sibility of learning the operational aspects of a particular receiver (as applicable to ex-
periment requirements). Once acquainted with the equipment, a document describing the
essential details of the receiver operation was drafted by each individual. Then all other
participants were cross-trained on the different receivers. This would ensure that every-
one would be able to start-up operations and trouble shoot if the situation arose,
2. Equipment Set-Up and Data Collection
One of each type of receiver was located at a static shore site, the Naval Post.
graduate School's Beach Lab. The others were located aboard the Research Vessel
POINT SUR where the kinematic segment of the experiment was conducted.
a. Beach Lab
Before the commencement of data collection, the locations of the stations
over which the individual receiver antennas would be set-up had to be established. At
the Beach Lab shore site, the absolute position of a pre-existing mark (identified as
DOP) had previously been established by the Transit Doppler method. This was used
as the reference mark from which the positions of five new marks would be established
(designated DOPI - DOPS). This configuration of closely spaced shore marks (about five
meters separation between marks) was refered to as the Doppler Array. The monuments
were set and the positions of the marks were determined by employing conventional
terrestrial survey techniques using a steel measuring tape to to obtain distances and a
Wild T2000 theodolite to observe horizontal and vertical angles.
31

After the conclusion of the experiment data collection stage, the Transit
Doppler station position for the mark DOP3 was resurveyed using a MX 1502 Transit
Doppler receiver furnished by the DMA. Because the position for the mark had been
established prior to the October 1989 Loma Prieta earthquake, a post-earthquake posi-
tion for the mark was required. The Transit Doppler data was collected over four days
and was submitted to DMA for the determination of the J)OP3 position solution. The
positions of DOP3 and the other stations comprising the shore site array were then up-
dated based on the new information produced by this Transit Doppler survey. These
were the independent position solutions to which the GPS solutions were compared.
Each receiver-antenna was assigned to an individual monument. The
Ashtech antenna was set up over DOPN, the Trimble over DOP2, the Magnavox over
DOP4, and the T14100 over DOP5. Except for the second night of data collection, when
two antenna cables were inadvertantly attached to the wrong receivers (affecting the
Ashtech and TI receivers), this configuration remained intact throughout the exper-
iment. See Figure 10 for the Doppler Array layout.
|I
-OOP 5
,O K / / /
// /I /\ I / / /
4 \I /
- RORIWNTAL DI3EcTom
-- - TAPED DISTA"ICZ
DOPPLER I tm a a2m in(IW)
Figure 10. The Doppler Array: The NPS Beach Lab Receiver Monument Sites,
Ashtech Set-up Over DOPI, Trimble Over DOP2, TI 4100 Over DOP5
32

The Krupp Atlas _!"oartrack range and azimuth laser positioning system was set up over
mark DOP3. This was used to determine the reference trajectory of the ship in thekinematic operations,
The heights of the receiver antennas from their marks were measured bothat the start and end of nightly operations. These measurements are necessary to adjust
the solution from the antenna electrical center to the mark.Meteorological data (i.e., temperature, pressure, and relative humidity) was
not recorded on site but was obtained from the NPS Meteorology Departmenf for thenights of the experiment. Because the iocation of the School's meteorology recordingstation is in close proximity to the Beach Lab site (less than 1000 meters), the weatherdata should closely reflect conditions at the Beach Lab.
b. The Lobos SiteIn order to initialize the kinematic operations, the pre-departure and post.
arrival positions of the POINT SUR, GPS antenna array (located atop the mast in thecrows nest) had to be established. The positions of four reference points located in thevicinity of the POINT SUR's dock were determined for tH's purpose. This station groupis refered to as the Lobos array (See Figure 11).
33
33

Li,0U0S Y1'^TiN AIMIAY
I ---- u u-wcIpJl
am DWI&I,III
I tCpss 2Ime,+ I,.o,,oon,,w
O
LOBOS
Figure 11. Tb. Lobos Array: The Moss Landing Monument Sites, TI 4100 Re-
ceiver Set.up Over LOBOS3
Following the experiment, the position of one or the points, LOBOS3, was
resurveyed with both GPS and Transit Doppler. The TI 4100 receiver was used for the
GPS survey. The OPS data was collected continously over a three day period (February
5.7, 1991) at a measurement collection rate of 30 seconds. This supplied three inde-
pendent data sets, one for each day of the survey. The Transit Doppler survey, con-
ducted from January 31 - February 4, 1991, established the Transit Doppler position for
the mark. The independent GPS solutions are compared to the Transit Doppler solution
in later sections.
34

The height of the TI 4100 antenna above the mark was measured at at the
beginning and at the completion of the three day collection session. Weather data wasagain obtained from the NPS Meterology Station. Although the degree to which this
data accurately represents conditions at Moss Landing is not known, it was felt it shouldadequately reflect LOBOS3 weather conditions.
In determining the point positions for the Beach Lab and Moss Landingsites, the precise satellite ephemerides and clock models were obtained from DMA forthe time of applicability. This provided a comparison of the solutions estimated with this
information versus the solutions estimated with the broadcast ephemeris and clock datacollected during the surveys.
c. Building 224
As of early July 1991, Selective Availability (SA) had been activated by theDoD. GPS data was collected for two days (July 16 and 17) at a site that had beenpreviouly established on the roof of the NPS Mapping, Charting, and Geodesy center(site: BLDG 224.3). The data was collected with two different TI 4100 receivers at ameasurement rate of 30 seconds. The antenna height above the mark was recorded. Noweather data was obtained for this test. The data was then processed with GASP usingthe broadcast ephemeris only and the site position solution was compared to the knownsite position in order to evalute the effect of SA on the computed position.
3S
35
- -- - - - -

III. DATA PROCESSING WITH GASP
A. PROCESSING FLOW OVERVIEWBefore the raw receiver data could be processed, some preliminary operations had
to be performed to convert the data into a format suitable to the GASP program. Theraw data was translated on a PC into a GASP compatible ASCII format (i.e., FICA orRINEX). The actual procedures and programs involved depend upon the particular re-ceiver and are covered in more detail in the next section. Once the data had been con-verted and all other required data assembled in the proper formats, the processing wasinitiated.
GASP consists of two major program units. The first, called the GeoSTARPREProcessor or STARPREP, accepts input from a FICA or RINEX data file and fromfiles containing satellite ephemeris and clock information, meteorological data, and sta.tion information (such as antenna height above mark and a priori station coordinates).STARPREP then computes and applies a series of measurement corrections to the LIphase biased pseudorange and pseudorange measurements. Once corrected, these meas-urements are referred to as two-frequency corrected measurements. Also, measurementtime tags are adjusted to reflect the correct GPS time of signal transmission and thesatellite positions are interpolated to correspond to the corrected time tags. This infor-mation, along with the corrected observations and the values computed for the meas-urement corrections, is output to a 'point' file. A station information file is alsogenerated containing the a priori station position, antenna height, and other relevantdata. These files are subsequently used as the input to the second major program unit,GASP.
The GASP unit accepts input from the point and station riles, forms the GASP ob-servable, and performs the estimation for the point position in CT coordinates. SeeFigure 12 for a general depiction of the processing flow.
36

A--L.
GASPProcssin Flowiio
Figure 12. GASP Processing Flow
B. PERSONAL COMPUTER (PC) OPERATIONSThe operations required to convert the receiver data into a GJASP acceptable format
varied for each receiver. An outline or the general procedure for each receiver is pre-
sented.
1. TI 4100 Receiver Data Conversion
The raw tracking data collected with the T14 100 Basic External Processor Pro-
gram (or BEPP) operating system had to be converted to the Floating point, Integer,Character, ASCII (FICA) format. This involved the use of utilty programs developed
by the University of Texas, Applied Research Laboratory (UT/ARL). The raw trackingdata was converted to the Floating point, Integer, Character (FGC) binary format by the
program GS2F(C. This format was then converted to the FICA format by the FpCFICA
37

program. Because the Beach Lab data was collected at a one second measurement rate,it was necessary to decimate the data to 30 seconds in order to alleviate fle storage
problems. Also, GASP documentation suggests a 30 second measurement rate and overour collection periods it would provide more than a sufficient number of observationsto produce meter level position solutions.
2. Trimble Receiver Data Conversion
The first step in the conversion of the Trimble raw tracking data to the RINEX
format was to download the data collected by the receiver into a restructured binaryformat. TRIMVEC (Trimble supplied processing software) accomplished this task. Thenthe TRRINEX programs, developed by the creators of the RINEX format (a team from
the University of Bern, Switzerland), were utilized to convert the Trimble binary formatto the RINEX format. The Beach Lab, Trimble data was also decimated to 30 seconds.
One difference between the FICA and RINEX formats should be noted at this point, the
broadcast ephemeris and clock information obtained by the receivers from the Naviga-tion Message is presented as separate data blocks in a single FICA data file. In the
RINEX format, this information is presented as a separate tile altogether. This fact be.came important when considering the RINEX modifications to GASP.
3. Ashtech Receiver Data Conversion
The Ashtech raw data also had to be downloaded before RINEX conversioncould be implemented. The Ashtech GPPS processing software performed both thedownloading and the RINEX conversion. ASHTORIN was the program used to per-
form the conversion. It too permitted the Ashtech Beach Lab measurements to be
decimated to 30 seconds.4. PC to VAX Data Transfer
The observation and broadcast ephemeris data, now in either the FICA or
RINEX format, had to be transferred to the NPS Digital VAX computer. This is where
the GASP programs and program code resided and where processing would be done.
The data was transferred to the VAX via 9-track tape using the Overland Data TapeSoftware, DEPOT program. The precise ephemerides and clock information, furnishedby the DMA for the weeks of applicability, were also transfered to the VAX.
Meteorological and station data files were created in the GASP specified formats for thedifferent days and receiver stations, See Figures 13 and 14 for examples of the
meteorological and station files.
38

91 570 352000.0 1017.012.3 93.091 578 356400.0 101U.011.1 93.091 578 360000.0 1018.010.0 92.091 570 363600.0 1010.010.0 92.091 570 367200.0 1018.5 8.6 92.091 570 370000.0 1081.5 8.6 91.091 578 374400.0 1018:0 8.2 91.091 570 318000.0 1018.0 0.2 91.091 570 301600.0 1018.0 7.8 90.0,91 570 305200.0 1017.5 7.2 90.091 578 300000.0 1017.5 6.6 90.091 570 392400.0 1017.5 6.6 90.0
ricid I - 2-digit year ideitification
Ficld 2 - GIIS week numberFicld 3 - GI'S time of wcck
Field 4 - larometric pressure in millibarsField 5 - Tcmpcraturc in Celsius
Ficld 6 - Rclative humidity in percent
Figure 13. Sample STARPREP Meteorological FOe Contents and Record De-
scription
Ii3,
39

Record I
Field I - Site I.D. (format 18)
Field 2 - Record type (format AI)
e'icld 3 - Station I.D. (format 1710.0)
Field 4 - Station type (format Al)
Field 5 - Station name (format A30)
Field 6 - Station Latitude in rads (format D 16.10)
Field 7 - Station Longitude in rads (fornmat DI6.10)
Field 8 - Station Latitude in degrecs (fornmt D15.9)
Field 9 - Station Longitudc in degrees (format D15.9)
Field 10 - Station height in mctcrs (format F10.6)
Record 2
Field I - Site I.D. 2 (format 18)
Field 2 - Record type (format Al)
Field 3 - Site type (format Al)
Field 4 - Antenna offset north of mark (format F8.6)
Field 5 - Antenna oIfset cast of mark (format F8.6)
Field 6 - Antenna height offsct (format F8.6)
Field 7. Year, day of antenna set up (format 15)
Field 8 - Elevation angic cutoff for 16 sv's (format 16F4.1)
Figure 14. Sample STARPREP Station File Contents and Record
Description: Sv's, referred to in record 2, field 8, is another term for
satellites.
C. DATA FILE EDITS AND RUNSTREAM GENERATION
Prior to STARPREP processing, the following information contained in the FICA
or RINEX observation files was validated:
* the a priori station coordinates
* the antenna height
* the year, month, and day of session
Ill # week-crossovers ,
40

* the PRN numbers of the satellites tracked
* the measurement record interval (or rate)
Special attention had to be paid to the last item since the decimation process did notautomatically update the measurement rate in the header block for the TI 4100 data.
Much of the data collected at the LOBOS3 site, corresponding to periods whenfewer than three satellites were available, was discarded. This still provided three inde-
pendent data sets (one for each day of site occupation) of between eight and I I hours
duration at a 30 second recording rate. The BLDG 224.3 data set, collected contin-uously over two days at 30 seconds, was divided into five independent subsets rangingfrom about four to nine hours. The data sets and subsets, time spans, and the numberof satellites used from the individual data sets are identified in the following tables.
Table 4. BEACH LAB DATA SET IDENTIFICATION ANDTIME SPANS
Day Receiver Time Span No. of Satellites(hours) Use
TI 4100 6.2 8338 Ashtech 5.6 9
Trimble 6 9
TI 4100 6.2 8339 Ashtech 6 9
Trimble 6 9
TI 4100 7.1 8340 Ashtech 6.8 9
Trimble 7/.3 9
T1 4100 6.5 8341 Ashtech 6.9 9
Trimble 6.7 9
41

Table 5. LOBOS3 DATA SET IDENTIFICATIONAND TIME SPANSr No. of Satellites
Day Time Span (hours) U s
36 8.6 8
37 10.8 838 10.8 8
Tablp. I 3LDG 224.3 DATA SET IDENTIFICATION AND TIMESPANS
aTime San No. of SatellitesDp 7 Subset (hours) Used
197 A 4.8 6B 8.4 6C 3.8 5
198 D 7.0 6E 9.2 6
A runstream on the VAX was generated that signified what data files were to beused as input, output or temporarily created, the unit numbers assigned to each file,
which of the available satellites were to be used as the source of observations, whetherbroadcast or precise ephemeris and clock states were to be used, the corrections to be
applied, etc. The runstream is a VAX batch file that begins execution of the STARPREProutine, deletes temporary files at the completion of processing and, in general, controls
the processing operations. See Figure 15 for a sample precise ephemeris runstream.
42

:I cow"" ptoot"Ove to ,w 81*1168 (PRIC11 t8138 *111 1 An LS)
~I Th. 68S date file .FieA 4ovt)me t be $*adsd IsiI Tb. diteteiroti I MALT. IT&AFILS 1. Tb. tortose. 1la oidso*I one 1,5.15. Clock file@ met &I". be Satjiaed io NAb8T.111AflL8181
I situ stewirw - I AN AUAI16 SaUhV. TAuMr. IT VsWf last L=.'set d.Iellt lbiredthet.sto1.eltho I,
'.della.e oyalvelpat otal4litt.9of
4861L118 04 S6AISI)4 IA.
aM6IL88 so OSUS*O41A.t16*16181* Is 61lo8*O)41t.18N
SASWILh8IS 1il01SAG3841T.11U14*618S1*858 1181S*if411.11ml
AuSWII is 8e*)110,31.1111*361SO11* 1511168 i40346.110*861is* t 19 1911144341.111*36111.3 TO11 189031.11111£SuIFLSS 31 8t11219334.111,1ANI* 4911188f 1i0336.0111*8611186 It BF111103SM.91uU*88131.1 IS 3F"1381 4.318"WILMS It1 Srift02)8.130-
*81186.88 ft td6ism itJ*?ASWILS1 3 W1993d~384.111S*481118*8 N6 11114241F.DA?
*861318 40 PC"0)34.8131
*11158*41 8119.0*?*56V1118 82 NUT.S*?A8I13lM 44 f1*)A41.SI?A*iI. $I to686.116
A9WIS 92 9101`9.1111*81100,1641 $I UII.WI*8116*8 S H WN12.131Amiga8* 91 TSMlS.?16*861ILAS Of 1016118.11ml"08,140u 5 1110,1.111
OVWS MIT IS U 11 86 SA 81 8**ttL.? S to so In 86 so a *
11081TM, oISw 18 O U 8 .6 1
pomm- lulls ALL to i T I
85686- me "wi n8 To 11115r11pottO435o fielbve16o1lel
do"* *or3181892
Figure 15. Sample STARPREP Runstream for Precise Ephemerisa
43

D. STARPREP
I. Input
Much of the information presented in the following sections on STARPREP
and GASP processing is found in Malys, et al [Ref. 1).STARPREP accepts input data from an observation file (pseudorange and car-
rier phase measurements in either FICA or RINEX format), broadcast or precise
ephemeris and clock data from file input (or in the case of the FICA broadcast
ephemeris data as part of the FICA observatiorn file), a meteorological fde, and a station
file. The carrier beat phase measurements are converted to kilometers by multiplying
by the nominal LI or L2 wavelength. In the TI 4100 FICA observation file, the time of
signal transit between satellite and receiver is given rather than the actual pseudorange.
This is converted to the pseudorange by multiplying by the speed of light in a vacuum.
RINEX presents this as the pseudorange originally so that no conversion to distanceunits is necessary.
2. Error ModelsThe time and data corrections applied during the course of STARPREP proc-
essing will be briefly discussed and the error models used to compute the corrections
presented& This material is originally presented by Malys, et al [Ref. 2: pages 489-491].a. ZTne of Tranmisskon
Measurement time tags are adjusted from time of reception (Q,) to time or
transmission (tJ by,
Pt
where, p, is the pseudorange observation at t, and
c, the speed of light in a vacuum, equals 299792.458 kilometers per second. See
Appendix C for a list of the constants used in the GASP programs.b. Satellite Clock
For the broadcast ephemeris, the predicted satellite clock parameters avail.
able in the navigation message are used to compute the satellite clock offset from GPStime by,
TZ W a0 + a• (tg - t4) + a2 (t, - 10)'
where, 4 is the time of applicability of a., A, a,
a. is the predicted satellite clock time offset
44

a, is the predicted frequency ofeta2 is the predicted frequency drift.
For the precise ephemeris, the precise clock states are used to compute the satellite clock
correction at the observation epochs.
c. Receiver Frequency Offset
The TI 4100 receiver LI and L2 reference signals are offset from the LI and
L2 carrier frequencies by -6000 Hz and + 7600 Hz respectively. A correction is computed
which removes the number of cycles in the data due to these biases. The epoch of the
initial recorded carrier beat phase measurement for a satellite is used as the reference for
subsequent carrier phase measurements. For example, the correction for LI phase data
in cycles is given by,
- - 6000 (t - )
where, N,. is the number of cycle countst is some affected epoch, in seconds, and
tj is the initial epoch recorded for the satellite, in seconds.
The Trimble and Ashtech receivers do not have offsets in their reference signals so the
values assigned to the offsets were set equal to zero for RINEX processing runs with
these receivers.
d. Ioeosphere
Signal interaction with the free electrons found in the ionosphere produces
a change in signal path length. This ionospheric refraction index is frequency dependent
so a comparison of measurements on L I and L2 may be used to derive a dual frequency
correction. Defining the quantity r as
r. [ (Li21 )2
a dual frequency ionospheric correction for the pseudorange is given by,
dap,L, - (P'r -
45
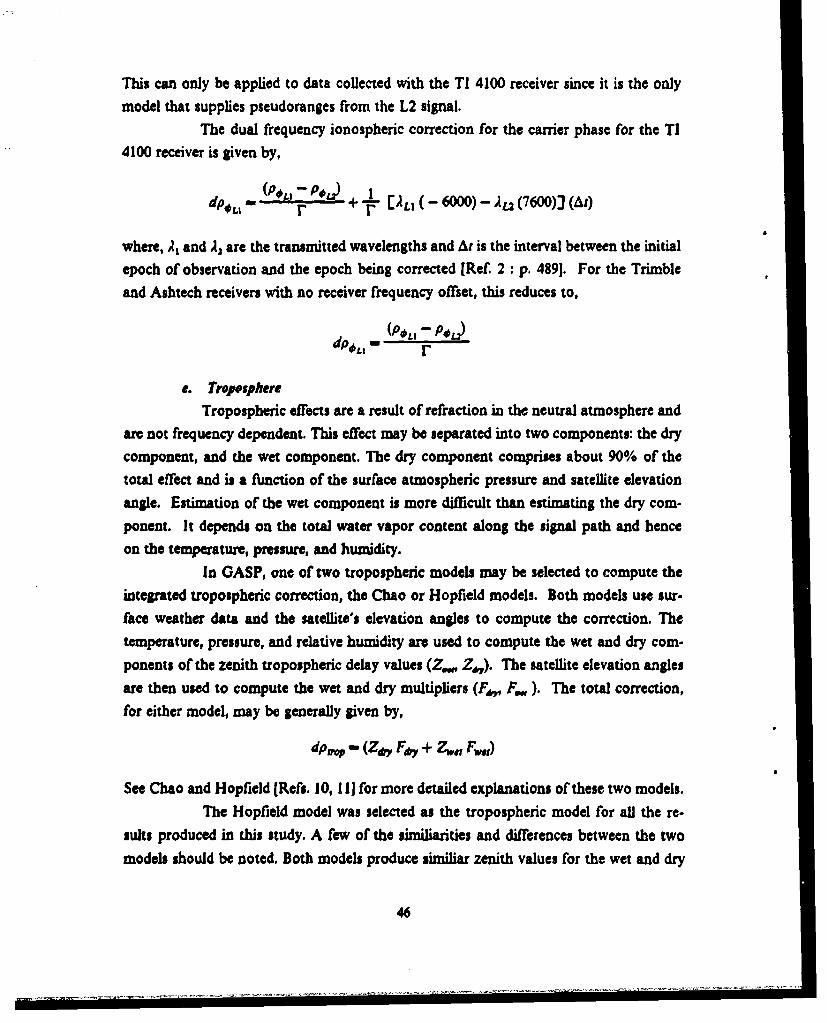
This can only be applied to data collected with the TI 4100 receiver since it is the only
model that supplies pseudoranges from the L2 signal.The dual frequency ionospheric correction for the carrier phase for the TI
4100 receiver is given by,
dp, -(PL ) +. EL (- 6000) - Ag (76M0)) (At)
where, A, and A2 are the transmitted wavelengths and At is the interval between the initialepoch of observation and the epoch being corrected [Ref. 2 : p. 4891. For the Trimble
and Ashtech receivers with no receiver frequency offset, this reduces to,
dPOL, - rO
e. TroposphereTropospheric effects are a result of refraction in the neutral atmosphere and
are not frequency dependent. This effect may be separated into two components: the drycomponent, and the wet component. The dry component comprises about 90% of thetotal effect and is a function of the surface atmospheric pressure and satellite elevation
angle. Estimation of the wet component is more difficult than estimating the dry com-
ponent. It depends on the total water vapor content along the signal path and henceon the temperature, pressure, and humidity.
In GASP, one of two tropospheric models may be selected to compute the
integrated tropospheric correction, the Chao or Hopfield models. Both models use sur.face weather data and the satellite's elevation angles to compute the correction. Thetemperature, pressure, and relative humidity are used to compute the wet and dry com-ponents of the zenith tropospheric delay values (Z.., Z,,). The satellite elevation angles
are then used to compute the wet and dry multipliers (F,,, F..). The total correction,for either model, way be generally given by,
dpvp - (Z,, Fe. + Zw., Fw,)
See Chao and Hopfield (Refs. 10, 1I1 for more detailed explanations of these two models.
The Hopfield model was selected as the tropospheric model for all the re-suilts produced in this study. A few of the similiarities and differences between the twomodels should be noted. Both models produce similiar zenith values for the wet and dry
46

components. The major difference is the dependency of the correction on the satellite
elevation angles. The Chao model, originally developed for use in arid locations, is not
as accurate as the Hopfield model in estimating the wet tropospheric component off the
zenith [Ref. 12].
f. General Relativity
If using the broadcast ephemeris, the general relativity correction is com-
puted as a function of the broadcast orbital elements and is given by,
dp,,1 - -2.0 [ GM' 12 ] (e) (a'1 2) E sin(E.)]
where, GM, the product of the universal gravitational constant and the Earth's mass,
equals 3.986005 x lfkmO/ sec2, and
e is the eccentricity of the satellite orbit
a is the semi-major axis of the satellite orbit
E, is the eccentric anomaly at the observation epoch.
For a more thorough description of the broadcast orbital elements see Appendix A.
If the precise ephemeris is used, the correction is given by,
dp,11 =-2.o P
where, I is the satellite position vector and
P is the satellite velocity vector at the observation epoch. See (Ref. 13J for a full
explanation of this effect.
g. Earth Rotation
To account for the fact that the Earth is rotating while the signal is traveling
from satellite to receiver, the Earth rotation correction is given by,
dd - _ ( x2 - X2X1- Ax - xO X21
where, ws, the WGS 84 value for the Earth's rotation rate, equals 7.2921151467 x 10-s
radians per second,
A' is the interpolated satellite position vector
A', is the receiver's a priori position vector
47

1, 2 are the vector components along the X and Y axes of the WGS 84 reference
frame.h. Satellte Antenna Offset
The precise ephemeris contains the positions of a satellites center of mass.
To adjust this position to the electrical center of the satellites transmitting antenna, thissatellite antenna offset is approximated as,
dp,a - R
where, R is the range vector from the a priori receiv.,r position to the satellite and
S is the scaled vector from the satellite's center of mass to the satellite sub-point.
S is given by,
where, SAO is the L-band satellite antenna offset in the nadir direction (0.88m) and
,, is the unit vector from the center of mass of the Earth to the satellite.
The broadcast ephemeris gives the position for the phase center of the sat-ef1ite transmitting antenna [Ref 14: p. 831. This would make application of this adjust-
ment unnecessary when using the broadcast ephemeris. The GASP program does notdistinguish between the precise and broadcast ephemeris in this regard. This results in a
range error that is common to all satellites when the broadcast ephemeris is used. Be-
cause this error is common to all satellites, the GASP algorithm will effectively removethis error.
The data sets were originally processed with this correction applied for both
ephemerides. Two of the previously processed data sets were reprocessed using thebroadcast ephemeris, this time without the satellite antenna correction applied. The
maximum difference for any component over the two data sets was on the order of two
centimeters. It can be reasonably concluded that the GASP diffierencing scheme has
eliminated this source of error.
3. OutputThe STARPREP preprocessor generates three main files; the point file, the sta-
tion file, and the output file. GASP accepts the point and station files as input. Theoutput file contains plots of all the applied data corrections for each satellite over time,
plots of the uncorrected range and carrier phase measurements over time, and a sum.
mary of file information. This file is helpful in identifying problems that may have arisen
48
_ _• -• = • •-

during the course of processing. The point file contains the two-frequency corrected
observations, the values computed for the individual corrections, the corrected meas-urement time tags, and the interpolated satellite positions (in CT coordinates) corre-
sponding to the corrected time tag. The station file contains the a priori station
coordinates and the height of the antenna above the mark. See Figure 16 for a general
summary of STARPREP processing.
sto eram %tomee~
I''VA armd AMOY~
SAcdjmt T•m T• p
aAWft .. 7-.M
Figure 16. STARPREP Processing
E. GASP
1. GASP Runstream GenerationPrior to GASP processing, a GASP runstream was created. This runstream
specifies the station and point rdes to be used as input, assigns a Mdenamne to the GASP
output rile, and if desired, permits the selection of non-standard GASP processing
options. Standard options preset certain processing values or features but these may be
overridden by the operator. See Table 7 ror a list of the available processing options and
standard values and features. _I_
49
i ... ....... I I -

Table 7. GASP RUNSTREAM PROCESSING OPTIONS ANDSTANDARD VALUES OR FEATURES
StandardProcessing Options Values or
FeaturesPlot to Printer PElevation Angle Cutoff (Degrees) 15RMS Screening Multiplier 3.00Pseudorange Editing Tolerance (meters) 5.00Estimate Fourth Parameter N
Minimum of 'N' Satellites Per Epoch Pair 2Use Offset to A Priori Station Position NStandard Deviation on GASP Observables (cm) 20.0
Standard Deviation on A Priori Position Components 0.05(km)PRN Number as 'Base' Sat, Default is 00 for Sequenc- 00ingNumber of Batch Least Squares Iteration 3
Number of Sequential Estimation Iterations I
2. Automatic Data EditingAfter the point and station files have been entered into GASP, two kinds of data
editing are performed to ensure consistency between the pseudoranges and phase biasedpseudoranges observed from each satellite. First, the corrected pseudoranges over twosuccessive epochs are subtracted and the corrected phase biased pseudoranges corre-
sponding to the same epochs are also subtracted. If these "delta' ranges differ by more
than some user specified tolerance, the GASP observables (i.e., the two carrier based
phase biased pseudoranges) are rejected from the data set. This is referred to as
pseudorange editing. Note that this is the only use of the corrected pseudoranges. Theyserve only to monitor the phase biased pseudoranges for outliers and are not used in the
estimation process.For the processing runs performed for this study, the standard pseudorange ed-
iting tolerance of five meters was initially selected. After a few runs with the Trimbleand Ashtech receiver data, it became apparent that a significant percentage of the data
was being rejected from the data set (on the order of 35% or more). In order to avoid
so

this, the pseudorange editing tolerance was relaxed to ten meters. This held down the
amount of data rejected to under 20 percent in most cases. There are two possible ex-planations for why such a large amount of data was rejected. The first, and most prob-
able, an ionospheric correction could not be computed for the Trimble and Ashtechpseudorange data since no pseudorange measurements were supplied on the L2 signalfor these receivers. This would produce some discrepancy between the corrected
pseudorange and the phase biased pseudorange where an ionospheric correction wasapplied. A second possible explanation is that the pseudoranges are observed from the
C/A-code modulations rather than the more precise P-code modulations. The increasedmeasurement noise on the C/A-code observations may also have contributed to the
higher rejection figures.
The second edit test performed on the data uses the Root-Mean-Square (RMS)
of the residuals of the previous iteration as the rejection criterion. The RMS is initialized
before the first iteration. Any phase biased pseudorange observables with a residual
greater than three times the RMS ofthe previous iteration are rejected from the data set.These editing schemes are executed prior to the formation of the GASP observable.
3. The GASP Observable
The between-epoch single difference equation is used to form what is known asthe GASP observable. Two consecutive carrier based phase biased ranges from the same
satellite are differenced. Recall that this between.epoch single difference equation.was
given by,
6po - 6p - c (6dr - 6T.)
This between-epoch difference is then differenced with the corresponding between-epoch
difference from another satellite. The resulting equation is given by
"- - 64P
- (6 p - 6R) - c (64- - 64 + 6,; -R)
where a and f signifies the two satellites. It may be expressed more conveniently as,
U#- tsdp - c (A6r." - SP
Since the satellite clock errors and the errors associated with various other sources have
been modeled, the equation becomes,
51SII

AWp - ti~p, + c (A6-r, -66-r.)
The value AUp is the GASP observable. See Figure 17 for a conceptual representation
of the GASP observable.
The GASP Observable
SatelliteSatellite 0(
Figure 17. The GASP Observable: Differencing Over Satellites Over Two Con.
secutive Measurement Epochs
52

This type of differencing scheme reduces the effects of errors in satellite clocks
and orbits, and removes receiver clock errors and integer ambiguities. For a four chan-
nel receiver with all channels simultaneously tracking satellites, three GASP observables
can be formed for a given epoch pair. At least two satellites per epoch pair are required
to form an observable for that epoch pair. For each epoch pair, one satellite is used as
the reference from which the others are differenced. The reference satellite is selected
sequentially, so that for every new epoch pair processed, the next higher satellite PRN
number is used as the reference. The selection sequence cycles back to the lowest PRN
number once the list of tracked satellites is exhausted. Individual epochs are used only
once to form an observable.
Reference satellite sequencing reduces correlation among the observables. Pre-
cision, the RMS of the residuals, and the variance-covariance matrices of the estimated
parameters are all improved using this type of satellite selection rather than selecting the
satellite with the most stable clock as the reference. [Ref. 1: p. 241
For example, if the LI phase biased pseudoranges are represented by p, , four
satellites simultaneously tracked signified by superscripts a, P, y, and t (in order of as-
cending PRN number), and four consecutive epochs represented by subscripts 1, 2, 3,
and 4, a between-epoch difference can be formed for each satellite given by
P4, PT02 -45P;
P, 1 - 42 - 6p1 2
The three GASP observables formed by satellite sequencing for this first epoch pair are
given by,
6sP, - 6612 M=,,6p&*,hP~641 2 ia4Poy
6p;,- 6Pq-,,6p"
53

Then using P as the reference satellite for the next epoch pair at 3 and 4, the GASPobservables are given by,
F412 U #U
- -6y.a84'y
zip# - -P?.A ,
The next epoch pair at 5 and 6 would use satellite y as the reference and epoch pair 7and 8 would use satellite 1. Reference selection would then return to satellite a for epoch
pair 9 and 10.
4. Batch Least Squares and Sequenial E-tlmatlonAfter the GASP observables have been formed, a least squares technique is used
to estimate the station position components in the CT coordinate system. These are theonly parameters estimated. A clock correction parameter is not estimated. It is assumedthat the modeled satellite clock states have sufficiently aligned the satellite clocks to GPStime and that the receiver clock error has been removed by differencing. The interpo-lated satellite positions are held fixed in the estimation providing the reference frame inwhich estimation takes place. After three iterations of a batch least squares, the esti-
mated parameters, the variance-covariance matrix for the parameters, and the RMS ofthe residuals provide the input to the second estimation step (for more on the least
squares method see Appendix B).
This is a sequential estimation algorithm based on a Kalman filtering routine.The Kalman state is the receiver position vector. It does not include any clock states.Fundamentally, a Kalman filter updates measurements from one observation epoch to
the next. This allows the parameter estimates and covariances to be updated at eachmeasurement epoch. The batch method provides a measure of data noise to the se-quential processor. The fmal RMS of the residuals from the bat.uh processor is taken as
the variance of one GASP observable processed through the sequential processor. Sincethe sequential processor updates the station coordinates for each new observable proc-essed, the estimated station coordinates can be plotted as a function of time. Plots ofthe covariances and convergence in CT coordinates as a function of time may also sup-
plied.
For the processing runs performed in this study, a comparison was made be-tween the final batch least squares component estimates and the final component esti-
54

mates that had passed through the sequential processor. The magnitude of the mean
component differences, averaged for all processing runs using the precise ephemeris, was
about 15 centimeters.
5. outputThe most important information contained in the output fMle generated by
GASP is the estimated station position. This is presented as the X, Y, and Z coordinates
of the CT coordinate system and in geodetic coordinates; latitude, longitude, and height
(4., A, h) relative to the WGS-84 ellipsoid. Estimates for the uncertainty in the coordi.
nates is obtained from the variance-covariance matrix for the estimated parameters. A
correlation matrix is computed that expresses the linear independence among the esti-
mated parameters from the parameter variance-covariance matrix. A posteriori standard
deviations for the estimated station coordinates are obtained by taking the square root
of the diagonal elements (i.e., the variances) of the vaiance-covariance matrix. These
provide estimates for the precision of the estimated point position components. The
GASP processing sequence i3 graphically depicted in Figure 18.
55
,- r l-rr ° ............... -- - -- " -- . .-- ---- -

,__ Ott.sDula Thm Talijatl an /M
\4v~t~v~jW~e. PaOUw
Figure 18. GASP Processing
F. PROGRAM MODIFICATIONSIn order for GASP to accept the data collected with the Trimble and Ashtech re-
ceivers, it was necessary to modify the program to allow the introduction of data pre-
sented in the RINEX format.2 This meant altering some existing program units andcreating two new program modules for STARPREP. The first reads the RINEX obser-
vation Mle. The STARPREP subroutines BLK006 and BLK124 that read the FICA
measurement and station data blocks were used as models in building the RINEX sub-
routine. The second module, called RINNAV, reads the RINEX navigation fide that
contains the broadcast ephemeris information. It was modeled after the STARPREP
2 RINEX data may be presented in one of two possible forms; the original RINEX formatand the RINEX 2 (version 2) format. GASP processing runs utilized data presented in the oriinalRINEX format. Progam code designed to process data in the RINEX 2 format, although present,is untested. [Ref. 151
56

subroutine BLK009 that reads the FICA data blocks containing the broadcast ephemeris
data.
To differentiate between FICA format and RINEX format input, a file naming
convention was implemented. The program path to read either format is keyed to the
first four characters of the input observation filename. For the RINEX data collected
with the Ashtech receiver, the first four characters of the filename must be RINA. For
the RINEX Trimble data, the first three characters must be RIN and the fourth char-
A- acter anything other than A. For FICA data collected with the TI 4100, the first three
characters may be anything except RIN. The reason for distinguishing between the
RINEX Ashtech and Trimble data is due to a problem that occurred during processing.
A wavelength factor of one was specified for the LI signal and a wavelength factor of
two specified for the L2 signal in the RINEX observation file for both the Ashtech and
Trimble receivers. Using these wavelength factors with the Ashtech receiver caused all
the observables to be rejected by the pseudorange edit. This was because of an incom-
patibility between the internal receiver software and the receiver hardware. Apparently,
the receiver software had not been updated to reflect changes in the hardware. To cir.
cumvent this problem, the L2 wavelength factor for the Ashtech receiver is reset to one
based on the RINEX filename. Once the receiver software is updated, the program
statement that resets the wavelength factor will need to be deleted.
Also keyed to the filenames are values assigned to the receiver frequency biases. The
TI 4100 receiver incorporates receiver frequency biases of -6000 Hz on the LI signal and
7600 Hz on the L2 signal. The Ashtech and Trimble receivers do not incorporate these
biases.
Because the Trimble and Ashtech receivers possess more tracking channels than the
TI 4100 and could thus supply simultaneous observations from more satellites, we felt
we should take advantage of this feature by modifying GASP to accomodate data col.
lected on these additional channels. The Trimble receiver records observations on eight
dual frequency channels and the Ashtech receiver on twelve. Because increasing the di-
mensions of the program arrays might cause space problems and adversely affect proc-
essing, a cautious approach was taken and storage expanded to accomodate eight
channels per epoch. Basically, this was accomplished by simply redimensioning the ar-
rays that stored the input measurements, two-frequency corrected observations, time
tags, and interpolated satellite positions.
The program revisions to include more channels led to modifications to expand the
maximum number of satellites that could supply observations over the course of a col-
57
, • ..... i•T -'•7 "•i-............ l •"i .... ..- i- i-' i i , , .. . . .

lection session. The previous limit of eight was changed to twelve. Thus, the number
of satellites allowed per collection session should not be a limiting factor to the potential
benefits of using more receiver channels. If twelve satellites per session were to be uti.
lized, allowances for additional files associated with the extra satellites (and the RINEX
broadcast ephemeris file) would be necessary. The maximum number of permissible
program files was reset from 60 to 62 and program statements assigning unit numbers
to particular files or setting limits on the unit numbers for certain file groups (such as
the precise ephemeris and temporary files) were respecified. Specifically, the unit number
assigned to the RINEX broadcast ephemeris file is 11, the upper and lower limits on the
unit numbers for the first set of temporary satellite files changed to 12 and 23, limits on
the precise ephmeris files changed to 24 and 35, limits on the output data files changed
to 36 and 39, and the limits on the last group of temporary files changed to 51 and 62.
SBI
- U- ------

IV. RESULTS AND ANALYSIS
In order to provide some measure Cor the accuracy of the computed positions, theknown station position components are differenced from the GPS CT estimated positioncomponents for the various receivers and collection sessions. The known station posi-tions are the Transit Doppler positions. This supplies the AX, AY, and AZ offsets fromthe "true positions. Component differences AX, AY,and AZ are converted to AE, AN,and AU (in local, cartesian east, north, and up coordinates) because this is a more fa-miliar and easily comprehended reference frame. The following discussion and analysiswill concentrate on the tables and plots that present the results in the local east, north,and up coordinate system. For the reader interested in the results presented in CT co.ordinates (X, Y, and Z), see the tables in Appendix D.
The difference results are displayed in the form of tables and associated target plots.In the target plots, the Transit positions are represented by the origin and the symbolsdepict the values computed for the component differences. The GASP estimated formalerror (one sigma) standard deviations are presented as the ± terms in the difference ta-bles or as error bars in the difference plots.
The known station positions are the Transit Doppler derived positions. Mark BLDG224.3 was established by a GPS relative positioning survey using the Transit Dopplermark DOP3 as the reference. See Appendix E for a summary of the estimated positionsand estimated standard deviations on the positions for both the Transit Doppler andOPS point determinations.
Repeatability, also defined as precision, yields a measure for the consistency of agiven set of position results. The repeatability is determined by calculating the mean andthe standard deviations (i.e., the observed errors) on a set of position component differ-ences. Two types of repeatability were determined. One averages over days by receiveraccentuating the differences between the receivers. The other averages over receiver byday accentuating the difference between days. In the repeatability target plots, the meandifferences are represented by the target symbols and the standard deviations are re-presented by the error bars.
A. BEACH LAB RESULTSTable 8 presents the accuracy results of the Ashtech, Trimble, and TI 4100 receivers
for the Beach Lab collection sessions using the broadcast ephemeris for the satellite po-
59

sitions. It can be seen from this table and the corresponding target plots (figures 19 and
20) that the GASP estimated components give fairly good agreement with the Transit
Doppler estimates. The average Root-Sum-Square (RSS) of the component differences(i.e., the magnitude of the difference vector) is at about the two meter level. The originis within the ensemble of the position differences and formal errors. The estimates
produced with the TI 4100 receiver were slightly better overall than the Trimble and
Ashtech estimates but all were comparable. The Trimble results are the most widelydispersed and the Ashtech results slightly less scattered. The TI 4100 results exhibited
the least dispersion of the three receivers.
It also appears that, between the differences computed in the north and east di-
rections, the greatest dispersion is produced in the cast, i.e., the estimated east compo-
nents are less precise than the north. For all three components, the north componentshows the least dispersion i.e., the best agreement is between the GASP estimated northcomponent and the Transit Doppler north component. Comparison of the AH and AUcomponent differences shows more dispersion in the vertical than in the horizontal.
A lack of overlap between the GASP estimated formal errors, due to the scatter of
the component differences, is also conspicuous. This suggests that the GASP formal er-rors underestimate the actual observed errors. The GASP formal errors appear to
underestimate error in the cast component to a greater degree than the north compo-
nent. The dispersion of the vertical versus the horizontal differences suggests, overall,the GASP estimated errors were better at representing the horizontal errors than the
vertical. This visual interpretation is supported by the values computed for the bottom
line of the table which shows the mean component differences and standard deviations
on the means over all receivers and days. The numbers indicate that the east and upcomponents were underestimated by a factor of about three and the north by a factor
of approximately two.
Also, as compared to the differences computed for the other three days, the day 339
results seem 'ofFr. This may be due to poorer broadcast ephemeris satellite positions for
this day.
60

Table 8. BEACH LAB COMPONENT DIFFERENCES (AE, AN, AU) USING BROADCASTEPHEMERIS: Solution Differences Between GPS and Transit Doppler Methods, Sec-ond Term is GASP Estimated Formal Error, RSS is Magnitude of the Difference Vector
Day of -] H (in--1Year 1Receiver AE (m) AN (m) AU(m) AH (in) _RSS (W)
TI 4100 -0.6 ±.6 -1.4 ±.6 (0.3 ±.5 I.5•±.8 1.6338 IAshtech 0.3 ± .6 0.1 ±.4 j -1.8 ± .5 0.4 ± .7 1.9
[_ Trimble -0.6 ±.6 1.1 ±.4 .- 2.5 ±.5 1.3 ±.7 2.8
TI 4100 -0.4 ±.6 -1.5 ±.6 1.7 ±.5 1.6 ±.8 2.3
339 Ashtech 3.3 ± .7 1.0 ±.5 -3.5 ±.5 3.4 ±.8 "_4.9
Trimble 2.9 ±.6 1.2 .5 -3.9 ±.5 3.1 ±"_.7 5.0
T1 4100 -0.6 ±.5 [-0.6 .5 0.5 ±.5 0.9 ±.7 1 1.0340 Ashtech 0.8 ±.6 -0.1 .5 -1.9 ±.5 0.8 ± .6 2.1
_____ Trimble 0.4 ±.5 [0.8 ±.4 -1.5 ±.4 0.8 ±.6 1.7
TI 4100 1.44±.5 -0.84±.5 -0.54±.4 1.6 ±.7 1.7341 Ashtech -1.8 ±.5 0.3 ±.4 -0.5 ±.5 1.8± .6 1.9
__"l'__ Trimble 0.3 ± .5 -0.0 ± .4 0.2 ± .5 0.3 ± .6 0.4
Mean Component Differ- Ience and Standard Devi- 0.5 - 1.5 0.0 ±.9 -1.1 ± 1.7 1.5 - 1.0 2.2 ± 1.3
ation about Meanu_
61
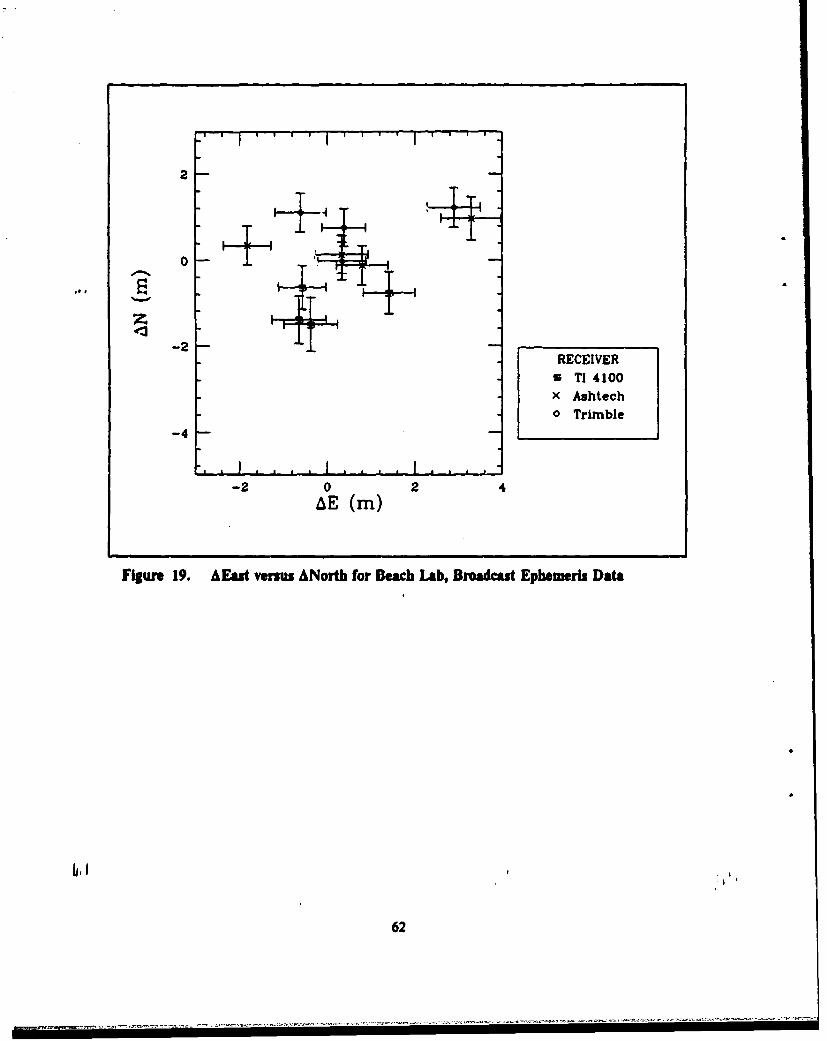
- * * I . . . I . . . 1 " '
2
0T"III '
-2 RECEIVER
5 TI 4100x Ashtecho Trimnble
-4
, , I . . . . I . .. . * . . . .
-2 0 2 4AE (M)
Figure 19. AEast venus ANorth for Beach Lab, Broadcast Ephemeris Data
62

, , I . . . I . . . i ,I
RECEIVER5 TI 4100* AshtechD Trimble
-4 I ',: ',
, , ,p I , , ,. I . . . .I
0 2 4 6AH (M)
Figure 20. AHor versus AUp for Beach Lab, Broadcast Ephemeris Data
I6,I
63

Table 9 and Figures 21 and 22 present the accuracy results of the three receivers
using the precise ephemeris. It can be seen that the position estimates produced with the
precise ephemeris give better agreement to the Transit Doppler positions than the
broadcast ephemeris. Overall, the precise ephemeris results are more accurate and pre-
cise in every component difference as demonstrated by comparison of the mean com-
ponent differences and the standard deviations computed about the mean differences.
The overall RSS is at about the 1.5 meter level. Again, the origin is within the ensemble
of all position differences and formal errors.
The estimates produced by the three receivers are all comparable, with the Ashtech
and Trimble giving somewhat better results than the TI 4100 receiver over the four days
of observations especially in terms of difference dispersion. The component differences
for the Ashtech receiver are all fairly tightly clustered about the origin while the Trimble
and TI 4100 receivers show greater dispersion especially in the east component. The
TI 4100 receiver also shows the greatest dispersion in the north and up directions.
As seen in the broadcast ephemeris results, comparisons of dispersion between the
north and the east reveal that dispersion is greater in the east than in the north direction.
Also conspicuous is the greater dispersion in the vertical than in the horizontal.
Again, we see that the GASP estimated formal errors have underestimated the ac-
tual error as determined by the dispersion of the differences. For the precise ephemeris
estimates, GASP formal error underestimates the actual error more in the east and up
components. It represents the error in the north component fairly well. The actual error
on the east and up components is underestimated by a factor of about two. The re-
lationship for the error in the north component is almost one-to-one.
64
• •r..... ..... "iT i f i i,[ J- i•-i T- •i-i•T ]-• ii i "°- :J-• '= :i" -- " -i"i'"

Table 9. BEACH LAD COMPONENT DIFFERENCES (AE, AN, AU) USING PRECISEEPHEMERIS: Solution Differences Between GPS and Transit Doppler Methods, Sec-ond Term is GASP Estimated Formal Error, RSS is Magnitude of the Difference Vector
Day of IYear 1990 Receiver AE W AN (i) AU (i) AH (M) RSS (i)
TI 4100 1.3 ±.6 1.3 ±.6 -1.6 ±.5 1.9 -. 8 2.4338 Ashtech -1.2 ±.6 -0.6 ±.4 -0.7 ±.5 l.4 ±.7 1.5
Trimble -1.9 ±.6 0.3 ±.4 -0.8 ±.4 1.9 ±.6 2.1
TI 4100 .- 0.5:t.6 -0.1 ± -0. .6 .5 0.5 ±.7 0.7339 Ashtech -0.3 ±.6 -0.6 ± .5 -0.021±.5 0.7 ±.7 0.7
Trimble -o.0 ±.6 -0.1±.4 -1.4 ±.4 0.1 ± .5 !.4
1-14100 -1.6 .5 -0.0 .5 -1.6 .5 1.6.±.6 2.3340 Ashtech -0.0 ±:.6 -0.4 ± .5 -2.3 ±..5 0.4 ±:.5 • 2.3
Trimble -0.4 ±.5 0.2 ±.4 -1.3 ±.4 0.4 ±.6 1.4
TI4100 2.1 ±.6 0.8 ±.5 1.6±.5 2.2 ±.7 2.8341 Ashtech -0.2 ± .6 0.6 ± .5 -0.1 ± .5 0.7 ±:.6 0.7
Trimble 1.4 ±.6 0.2 ±.4 0.5 ±.5 1.4 ±.6 1.5
Mean Component Differ- .ence and Standard Devi- -0.1 - 1.2 0.1 ± .6 -0.7 4 1.1 1.1 ±.7 1.6 ±.7
ation about Mean
Ii, I6
65

2
RECEIVER
s TI 4100x Ashtech
* Trimble
-4
. 1. L .i , L . . . 1 . ,
-2 0 2 4AE (M)
Figure 21. &East versus ANorth for Beach Lab, Precise Ephemeris Data
66

0
4-4 RECEIVER"S TI 4100x Ashtech0 Trimble
-4
0 2 4 6
Figure 22. AHor versus AUp for Beach Lab, Precise Ephemeris Data
67
67

Table 10 and Figures 23 and 24 display the Beach Lab repeatability results that av-erage over days by receiver for both the precise and broadcast ephemerides. The meansand standard deviations on the means show that geodetic-quality point positions areachieved using the precise ephemeris. This is especially true for the results produced with
the Ashtech and Trimble receivers. The standard deviations i.e., observed errors aretypically within or around one meter on all components for these receivers. The accura-cies, as determined by the RSS of the mean component differences, are within one meter
for all receivers demonstrating that agreement to the Transit Doppler estimates are
within the computed noise levels.The TI 4100 precise ephemeris results are less precise than either the Ashtech or
Trimble precise ephemeris results and, interestingly, are less precise than the TI 4100broadcast ephemeris results. The reason for this is not known. However, examinationof the RSS of the mean component differences reveals that the overall accuracy of the
TI 4100 precise phc - estimates is better than the broadcast ephemeris estimates.This is presumably due to increased systematic error associated with the broadcastephemeris satellite positions and clock states.
The broadcast ephernris estimates show that geodetic-quality point positions arenot obtained using the broadcast satellite positions and clock states. Higher valuescomputed for the RSS of the mean differences show reduced accuracy compared to the
precise ephemeris estimates. Also, the broadcast ephemeris esdmtes are generally morem se than the precise ephemeris estimates. As Onviowly mentioned, this was not
true for the TI 4100 receiver however.
It is also clear that averaging the component difFerences over days has significantlyimproved the accuracy and precision for all receivers for both ephemerides. The indi-vidual components show improvement and, as a consequence, the RSS of the averaged
components is also improved. This demonstrates the importance of averaging over many
independent position estimates to suppress the effects of random error.
66

The error bars, representing the actual observed error (the standard deviations aboutthe mean component differences), show significant asymmetry. This dramatically illus-trates the reduced precision in the east component as compared to the north componentand in the vertical component when compared to the horizontal. I also illustrates thatthe GASP estimated formal errors substantially underestimated the observed or true er-rors. For the precise ephemeris estimates, errors on the north component for all threereceivers displayed close agreement to the GASP estimated errors. The Ashtech receivershowed the best agreement in the east component and the Trimble receiver in the up.The broacast ephemeris estimates also displayed close agreement in the north for all re-ceivers, but the east and up components showed even poorer agreement than the preciseephemeris.
69

C -
Table 10. BEACH LAB REPEATABILITY (AE, AN, AU): AVERAGE OVER DAYS BY RE-CEIVER: Mean RSS is Magnitude of the Mean Difference Vector
Epeeris Receiver MeanAE Mean AN Mean AUI MeanAH "Mea RSSr (m) (i) () (n) (M)
TI 4100 0.0i1:1.0 -1.1 +t.4 0.5"1:.9 '1.1 + .5 1.2 +±.7 a
Broadcast Ashtech 0.7 ± 2.1 0.3 ± .5 -1.9 ± 1.2 0.7 ± 2.1 ± 1.9
Trimble 0.8 ±1.5 0.8 ±.6 -1.9 1.8 1.1_ ± 1.4 2.2 ± :.3
TY 4100 0.3 ±1.7 0.5 ±.7 -0.5± 1.5 0.6± 1.5 0.8 ± 2.0
Precise Ashtech -0.5 ±.5 -0.2±.6 -0.8± 1.1 0.5 ±.7 0.9 ± 1.4Trimble -0.2 ± 1.3 0.2 ±.2 -0.7±.9 0.3 ± 1.2 0.8 ± 1.2
70
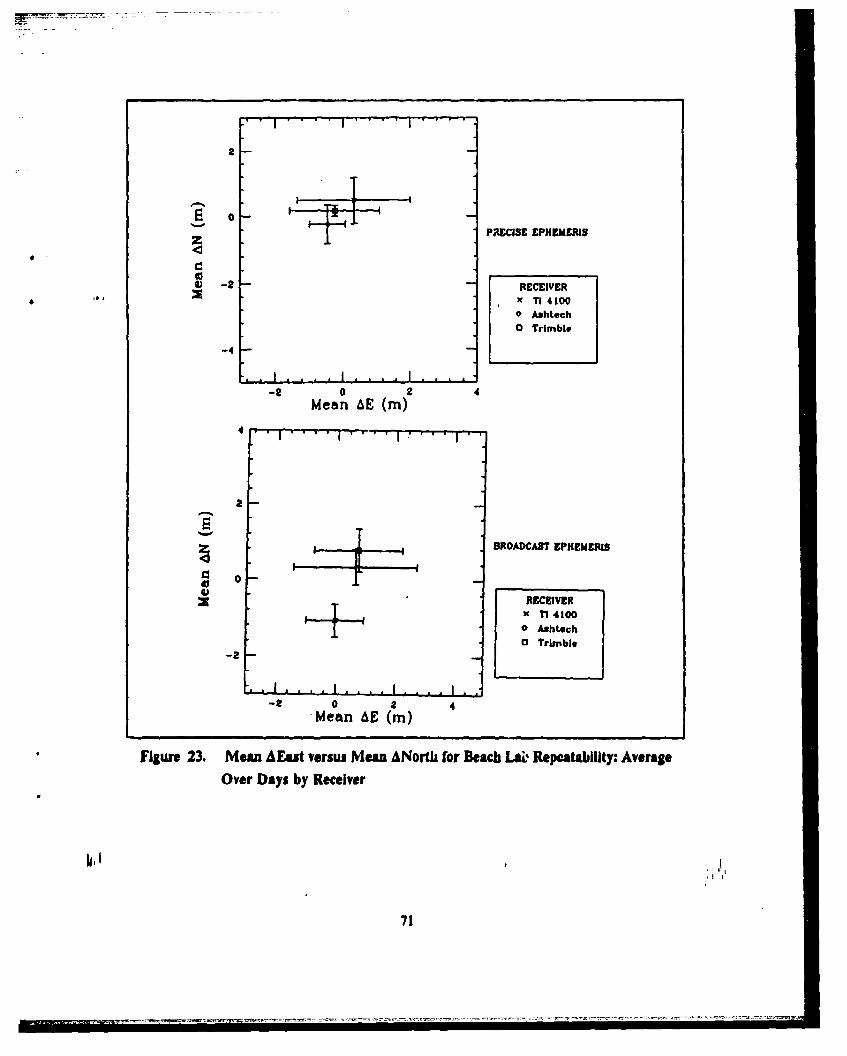
T 0
z P4ECISE EPHEMERIS
4) -2 RECEIVERI T x 34100
o Ashteoho Trimblo
-4
-2 0 2 4
Mean AE (in)
2
BROADCAST EPHEMERIS
930
RECEIVERx 1I 4100
I - 0 Auhtech0 Trimble
-2
S. . . . . .. I,-2 0 2 4
Mean 4E (m)
Figure 23. Mean AEust versus Mean ANorth for Beach LAt Repeatability: AverageOver Days by Receiver
71

o
PRECISE EPHEMERIS
V -2 RECEIVERx TI 4100o Ashleho Trimble
-4
O 4 6Mean AH (W)
" " '".I . .f i l 1 . . . 1 . .I" ,
2 -
BROADCAST EPHEUZRIB
-2 -- -RECEIVERx T1 41000 Ashtech
o Trimble
-4
0 2 4 6Mean AH (m)
Figure 24. Mean AHor versus Mean AUp for Beach Lab Repeatability: Average
Over Days by Receiver
.I ,.,,2
72

Table I I and Figures 25 and 26 display the Beach Lab repeatability results that av-
erage over receivers by day for both the precise and broadcast ephemerides. The tableand the plots show that the day 339 results, produced using the broadcast ephemeris,
were the most inaccurate and imprecise of all the daily estimates. Overall, the broadcastephemeris results showed much less precision than the precise ephemeris estimates. The
precision on the positions estimated with the precise ephemeris was roughly two times
better than those estimated with the broadcast ephemeris. This demonstrates the in-
* consistency of the broadcast ephemeris in estimating geodetic-quality point positions.
Again, the plots show asymmetry in the magnitudes of the error bars. The east* component displays greater imprecision than the north component. Comparison of the
vertical and horizontal components does not reveal any obvious overall asymmetry ex-cept in a few individual cases. This also shows that, again, the GASP estimated formalerrors underestimate the true errors. The computed values demonstrate, for the precise
ephemeris, the north and up formal errors best estimate the observed errors for all days.
73
___________________

Table 11. BEACH LAB REPEATABILITY (AE, AN, AU): AVERAGE OVER RECEIVERS BYDAY: Mean RSS is Magnitude of the Mean Difference VectorE i Day IMean AE Men AN Mean AU Mean A " Mean RSSEphemeris Dy(in) (mn) (ml) (mu) (mn)
338 -0.3±h.6 -0.1±1.3 - 1.4± 1.5 0.3 ±.8 1.4± 1.7Broadcast 339 1.9 ± 2.0 -0.2± 1.5 - 1.9± 3.1 1.9 ± 2.2 2.7 ± 3.7
340 0.2 ±.7 -0.0±.7 -1.0± 1.3 0.2 ±.7 1.0± 1.4341 -0.0± 1.6 -0.1±.6 -0.3±.4 0.2 ±.8 0.3 ±.6
338 - 0.6 ± 1.7 0.4 ± 1.0 -1.0 ± .5 0.7 ± 1.9 1.3 ± 1.5
Precise 339 -0.3 ± .2 -0.3 ± .3 -0.7 ± .7 0.4 ±.4 0.8 ± .8340 -0.7±.8 -0.1 ±.3 -1.8 ±.5 0.7 ±.8 1.9 ±.8341 1.1± 1.2 0.5 ±.3 0.7±.9 1.2 ± 1.2 1.4 ± 1.5
74

o|
PMECISE PNEMMIRS
4z
4) -2 DAYx 3380 3390 340* 341
-4
-2 0 24Mean AE (m)
2
9 o
BROADCAT EPHEMERISzIDAY
x x 330o 339O 340* 341
-8 0 24Mean AE (m)
Figure 25. Mean AEast versus Mean ANorth for Beach Lab Repeatability: Average
Over Receivers by Day
I5
75

0
PRSCISE EPHEMERIS
4} -3
03vDAYx 3380 339o 340S 341
0 2 4Mean AH (m)
2
0
BROADCAST ZPHEMERIS
4* DAYx 336
-4 0 339o 340+ 341
-6o 3 4 6
Mean AH (m)
Figure 26. Mean AHor versus Mean AUp for Beach LAb Repeatbility: Average
Over Receivers by Day
76

B. LOBOS3 RESULTS
The TI 4100 receiver was the only model used to collect data at the LOBOS3 site.
Independent data sets were created for each of the three days of site occupation. Resultsproduced by the broadcast and precise ephemeris are compared for each of the inde-
pendent data sets.
Table 12 and Figures 27 and 28 displaying the LOBOS3 component differences for
both ephemerides clearly demonstrate the advantage of using the precise ephemeris to
determine the point position. Accuracy is improved in every component. The broadcast
ephemeris estimates show much lower levels of accuracy and precision and there appears
to be a bias present in the south-east and up directions. Errors in the predicted satellite
positions or in the broadcast satellite clock models are the probable cause of this bias.
The precise ephemeris results show very good agreement with the Transit Doppler
estimates and can definitely be considered geodetic-quality. As with the Beach Lab re-
sults, the precise ephemeris estimates show greater dispersion in the east component
than in the north. Any difference in dispersion between the vertical and the horizontaldoes not appear to be significant for either ephemeris. Also noteworthy, the TI 4100
gave much better precise ephemeris results at this site than at the Beach Lab and the
broadcast ephemeris results are much worse overaIl.
Because of the peculiar TI 4100, precise ephemeris results obtained at the BeachLab, it would be desirable to compare the precise ephemeris results obtained with the
TI 4100 receiver at LOBOS3 to those obtained by the other two receivers at the BeachLab. Direct comparison of the results requires some caution, however, because of thelonger lengths of the data sets processed for LOBOS3. With this caveat in mind, com-
parison of the LOBOS3 TI 4100 estimates to the Ashtec and Trimble Beach Lab esti-mates reveals that better results, in terms of both accuracy and precision, were producedwith the TI 4100 receiver for all components at LOBOS3. This may be due to better
precise ephemeris satellite positions provided for this particular week. Again, it should
be stressed, although the LOBOS3 precise ephemeris results with the TI 4100 were best
overall, all three receivers produced geodetic-quality point positions with the preciseephemeris.
77

Table 12. LOBOS3 COMPONENT DIFFERENCES (AE, AN, AU): Solution Differences Be-tween GPS and Transit Doppler Methods for Broadcast and Precise Ephemerides, Sec-ond Term is GASP Estimated Formal Error, RSS is Magnitude of the Difference Vector
Ephemeris Day of AE W AN (m) AU (m) AI1 (m) RSS ()Year 1991 _I I
36 1.4 ±.6 -1.6±.5 1.7±.5 2.1 *.8 2.7Broadcast 37 3.4 ±.8 -4.6 .6 4.9 ±.6 5.7±1.0 7.5
' 38 1.3 ±.7 -3.3 ±.5 5.8 ±.5 3.6:±.7 6.836 -0.4±.6 -0.4±.5 0.6±.5 0.6±.8 0.9
Precise 37 0.4:±.6 -0.2 ±.4 -0.6 ±.4 0.5 ±.8 0.738 1.3 ±.6 0.1 ±.5 0.2±1.5 1.3 ±.7 1.3
78

4 7
PRECISt EPHEMERIS
*0
DAY0-2 x 38
o 37
o38-4
a2 0 2 4 6AE (n
a D~ROADCAUT SPHUMERS
S 0
-2 i.{. ~DAY* 37o 38
-4
-2 0 a 4 8A~E (in)
Figure 27. AEast versus ANorth for LOIJOS3
79

7
S ~~PREcIE EI4muERIS
S 0
DAY-2
* 370 38
-4
-6 ..o 2 4 6 a
6H (mn)
__ 2 DBROADCAT EPI4EMZRI
~, 0
DAY-2 x 38
* 370 38
6H (mn)
Figure X8 AHor versus AUp for LOBOS3
so'

The LOBOS3 repeatability results averaging over days, displayed in Table 13 and
Figures 29 and 30, clearly shows the inaccuracy and imprecision of the broadcastephemeris results. The south-east-up bias alluded to earlier can also be clearly seen in
the broadcast ephemeris estimates. Comparison of the error bars on the averaged preciseephemeris estimates shows the characteristic east versus north asymmetry. No signiI'
icant vertical versus horizontal asymmetry is evident, however. The magnitudes of the
error bars on the precise ephemeris estimates show that, in this case, the GASP esti-
mated formal errors more closely represented the true errors. However, the formal errorestimates produced for the broadcast ephemeris results underestimated the true errorsby a factor of approximately two for the east component, three for the north, and four
in the vertical. The precise ephemeris statistics demonstrate that by averaging over in.
dependent estimates, the accuracy and precision can be significantly improved.
C. REGIONAL AGREEMENT BETWEEN GPS AND TRANSIT DOPPLER
In order to establish a regional reference for the expected agrcement between GPSand Transit Doppler position estimates in the Central California area, the overall accu-
racy and precision of the position differences using the precise ephemeris are evaluated.
The precise ephemeris mean component differences and standard deviations over all
Beach Lab and LOBOS3 data sets were computed to provide values for this expectedagreement. These values, obtained by averaging over I data sets, are mean AE
-0.21 ± 1.1, mean AN -0.09 ± .52, and mean AU - -0.54 ± 1.03.
81

Table 13. LOBOS3 REPEATABILITY (AE, AN, AU) AVERAGE OVER DAYS FOR TI 4100RECEIVER: Mean RSS is Magnitude of the Mean Difference VectorEphemeris I M eaE nA (m) Mean AN (in) Fj MaA-(] Mean RSS ]
______I_] (in)- E~acast-I 2.0±1.2j -3.2± 1.5 4.1± 2.2- 3.8 ± 1.9 J 5.6± 2.9Prcs . . -0.2 ±.3 0J O±.6 0.5 ±.8 0.5 ±.9
82

EPHEMERISx Broadoast
oPrecis*
Za
*1 O z
-4
-6 . . . .I. . . .I-2 0 2 4 6
Mean AE (m)
Figure 29. Mean AEast versus Mean ANorth for LOBOS3 Repeatability: Average
Over Days
83
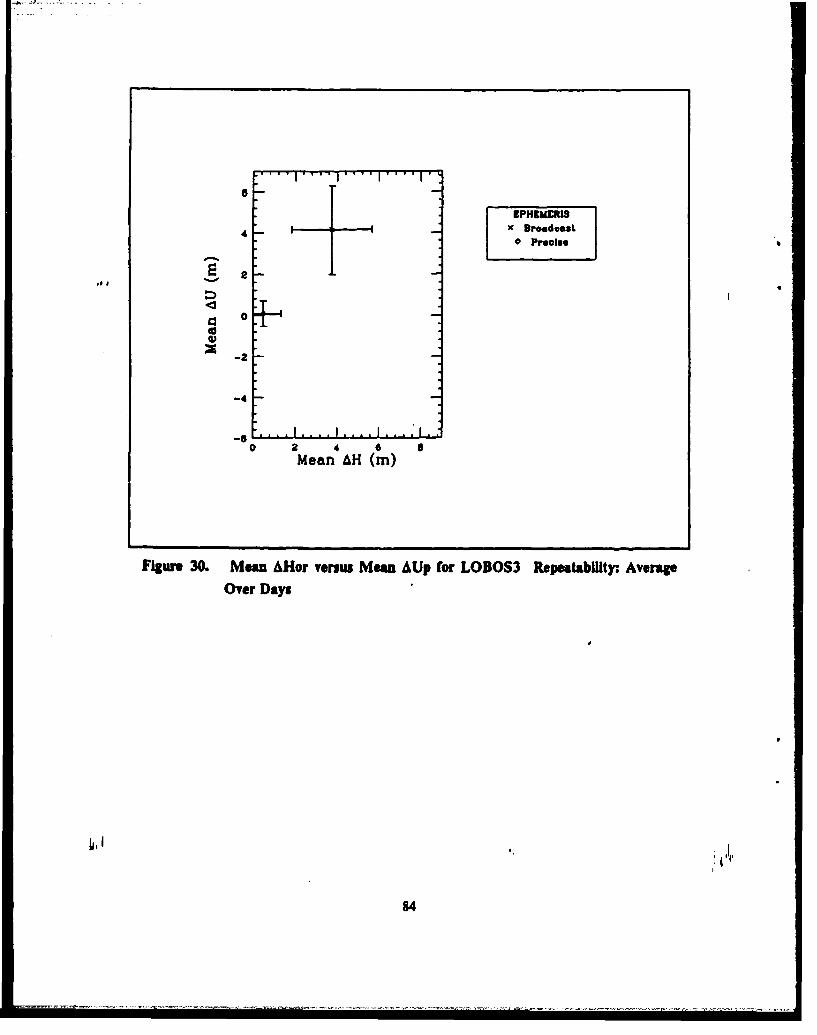
8
ZPHEMERIS,4,Ix Broadoast
SPrecise
-2
-s0 2 4 6 8
Mean AH (mn)
Figure 30. Mean AHor versus Mean AUp ror LOBOS3 Repeatability. AverageOver Days
84

D. POSITIONING RESULTS - SELECTIVE AVAILABILITY ACTIVATED
Table 14 and Figures 31 and 32 present the solution differences between the coor-
dinates previously established for mark BLDG 224.3 and the coordinates estimated forthe mark using the broadcast ephemeris after the activation of Selective Availability.
From comparison of the broadcast ephemeri., results obtained at the Beach Lab and
LOBOS3 sites to the results displayed here, it is quite obvious that the activation of SA
has severely impacted the position estimate. Both the accuracy and precision of the re-
or suits have been adversely affected.
The average RSS of the estimated positions over the five data sets is about 16 me-
ters. When contrasted to the approximately six meter average RSS computed for the
LOBOS3 site using the broadcast ephemeris, some indication of the magnitude of this
effect is realized. The east and up components are most affected. The north component
seems to be much less effected by SA than the other two components. Precise
ephemerides were not obtained for this survey period so a comparison of the broadcast
ephemeris results to the precise ephemeris estimated position cannot be performed.
85
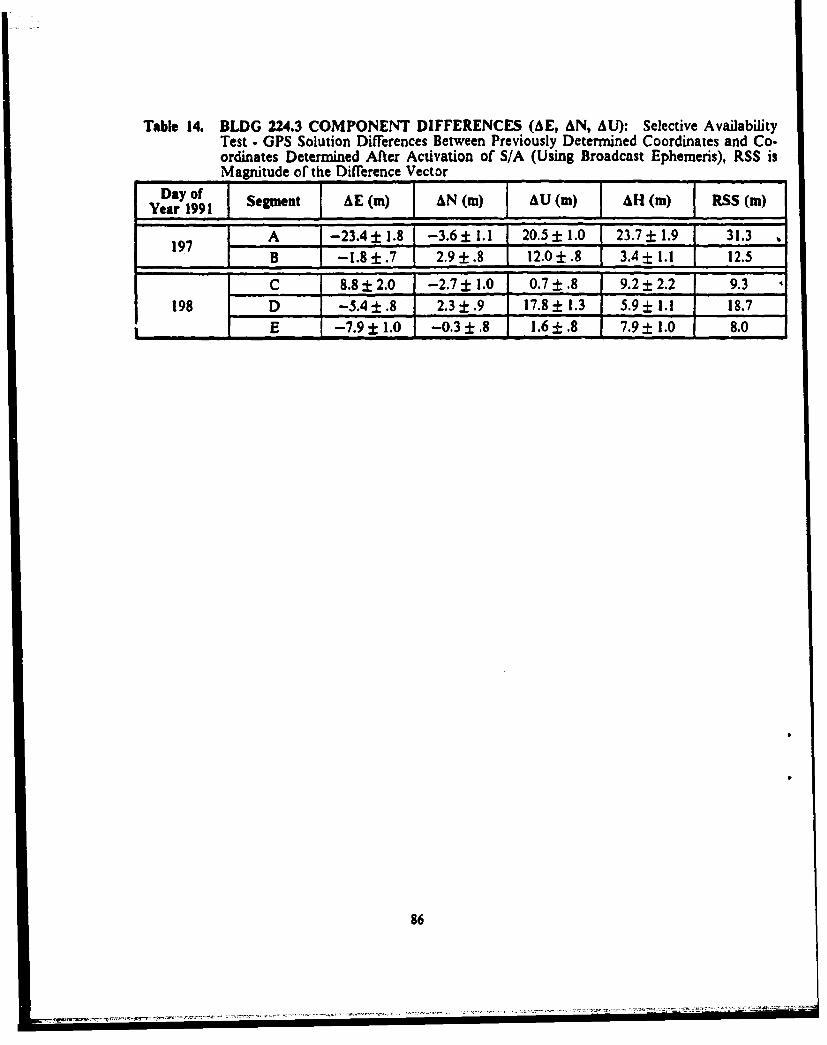
Table 14. BLDG 224.3 COMPONENT DIFFERENCES (AE, AN, AU): Selective AvailabilityTest. GPS Solution Differences Between Previously Determined Coordinates and Co-ordinates Determined After Activation of S/A (Using Broadcast Ephemeris), RSS isMagnitude of the Difference Vector
Day o Seg ment AE (m) AN (m) AU (m) AH (m) RSS (m)Year 1991
197 A -23.4± 1.8 -3.6± ±1.1 20.5± 1.0 23.7 ±1.9 - 31.3
197 B -1.8 ±.7 2.9 ±.8 _ 12.0 ±.8 3.4 ±1.1 "12.5
C 8.8 ± 2.0 -2.7 ± 1.0 0.7 ±.8 9.2 2.2 9.3198 D -5.4 ±.8 2.3 ±.9 17.8± 1.3 5.9± 1.1 18.7
_ _E -7.9 ±1.0 -0.3 ±.8 1.6±.8 7.9±_1.0 818.0
86

DAY - SESSION
20 0 197 -Ax 197 - ao 198-CO 198 - D
+ 198 - E
0
-20 -10 0 10 20
Figure 31. AEast versus ANorth for BLDG 224.3, Broadcast Ephemeris Data
87

20
E• 10 -
DAY - SESSI0N5 197- A
0 x 197- Bo 198- Co 98 -D+ 198 -E
-100 10 20 30 40 50
AH (m)
Figure 32. AHor venus AUp for BLDG 224.3, Broadcast Epbemeris Data
Ij.8I
88

V. CONCLUSIONS
GASP estimated point positions, produced with data collected from three GPS re-ceivers over seven days, are compared to independent Transit Doppler estimated posi-
tions. The differences between the positions provide a measure of accuracy for thecomputed GPS positions. Both broadcast and precise ephemerides were used to estimate
the GASP point positions. The precision for a group of estimated positions is deter-mined by calulating the mean of the differences and standard deviations on the meansfor the group. Major conclusions are:
1. GASP point position estimates generated with the precise ephemeris agree toTransit Doppler point position estimates to within one meter on each axis.
2. All three GPS receivers used in this study are capable of producing point positionswith observed errors on the RSS of less than 1.5 meters, when the precise ephemerisand clock states are utilized.
3. Point positions estimated with the precise ephemeris are more accurate and precisethan positions estimated with the broadcast ephemeris.
4. Selective Availability has had a dramatic effect on positions.
The OPS point positions estimated by GASP using the precise ephemeris and clockstates demonstrated good agreement with positions estimated by the Transit Dopplerpositioning system. The level of agreement was within the one meter noise level estab-lished for both systems. In general, the Transit Doppler positions were within the en-semble of corresponding GPS position estimates. This would seem to indicate that manyof the systematic errors that effect the GPS measurements had been successfully modeledor removed by the GASP algorithm. Of course, systematic errors common to both po-sitioning systems may remain.
Accuracy and precision indicate that all three GPS receivers examined in this studyare capable of producing geodetic-quality point positions. Between-receiver compar-
isons of the estimated positions using both the precise and broadcast ephemeris revealthat the Trimble and Ashtech receivers provide results that compare favorably to those
produced by the TI 4100 receiver. This is not surprising considering that all three re-ceivers record the carrier phase measurements essential to GASP processing and high-
precision point positioning. Although the carrier phase observable recorded by the three
receivers is th: same, the peudorange observable exhibits some important differences.
89
Pseudoranges are observed from the LI signal using the C/A-code for the Ashtech
and Trimble receivers. The TI 4100 receiver observes pseudoranges on both the Li and
L2 signals using the P-code. Consequently, a dual frequency ionospheric correction can
not be computed for pseudoranges observed with the Ashtech and Trimble receivers.
This, along with higher noise levels associated with C/A code measurements, caused a
high incidence of data rejection in preliminary processing runs. Relaxing the
pseudorange edit tolerance to ten meters allowed ti . a&,.eptance of a much higher per-centage of observations. Even so, rejection figures for these receivers were still higher
than the TI 4100 receiver.Though a higher percentage of observations were rejected with the Ashtech and
Trimble receivers, a high degree of accuracy and precision was maintained. The high
accuracy and precision levels observed with these receivers may be attributed to their
increased channel capacity. The ability to collect and subsequently to process more si-
multaneous satellite carrier phase measurements provides greater geometric diversity.
More measurements per epoch and the incorporation of more satellites into the proc-
essing run provides increased system redundancy. These two factors act to strengthen
the estimated position solution. Position solutions produced by the TI 4100 receivershould also be improved now that more satellites are allowed per processing run. The
benefits gained from these additional measurements will be nullified if too many obser-
vations are rejected in the data editing process. Thus, it may be desirable in future iests
to determine an optimal pseudorange edit tolerance.
Point positions estimated using precise ephemerides and clock states are superior to
the solutions produced with the broadcast ephemeris and clock states. The results ob-
tained with the three receivers at the Beach Lab demonstrate that, overall, better posi-
tions estimates were provided with the precise ephemeris and clock states. This is clearly
the case at the LOBOS3 site where significantly better results were achieved with the
precise ephemeris. These results, together with results produced in past studies, demon-
strate that positions produced with the precise ephemeris are generally more reliable,
accurate, and consistent than those produced with the broadcast ephemeris (Ref. 2: p.
497].
The recent reactivation of Selective Availabilty has accomplished its intended pur-
pose. For the results reported in this study, SA has severely degraded the accuracy and
repeatability of point position estimates that were produced with the broadcast
ephemeris. The effects of SA on position estimates using the precise ephemeris were not
assessed in this investigation. This may be a topic for future consideration.
90

The RINEX modifications to the GASP program now allow it to utilize data col.
lected with a greater variety or GPS receivers. This will permit point position determi-
nations from a multitude of additional sources and will enable DMA to augment its
point positioning data base. Only data that was converted to the original RINEX format
was used in these tests. Additional tests should be conducted with data presented in the
RINEX 2 format to ensure that the program code designed to process this data is free
of error.
Additional tests should be conducted to verify the validity of the conclusions pre-
sented here. Tests, siiniliar in design but extending over longer time periods (weeks as
opposed to days), would provide a more satisfactory indication of the long-term repeat-
ability for the different receivers.
I
91

APPENDIX A. KEPLERIAN ELEMENTS
Six Keplerian elements and a reference time are necessary to completely describe thesatellite orbit and the position of the satellite in the orbit. The six Keplerian elementsgiven in the broadcast ephemeris are:
0 Right ascension of the ascending node (Q)
* Inclination (i)
* Argument of perigee (w)* Semi-major axis of the elliptical orbit (a)
* Eccentricity of the orbit (e)
* An element describing the position of the satellite on the orbital ellipse (e.g., Meananomaly (M)) which is a function of time
The ephemeris reference time is designated (Q,). The five Keplerian elements that de-
scribe the orbit are 0, i, w, a, and e. M gives the position of the satellite in its orbit ata time t. See Figure 33 for a graphic representation.
92

KEPLEJAN OIBITALELEMENTS Z
Sitellit,
rV
Figure 33. The Keplerian Orbital Elements. Symbols are Explained in the Text
Other Broadcast Ephemeris parameters that are transmitted in the Navigation Message
describe the deviations of the satellite motion from the smooth ellipse dlefinedl by the six
Keplerian elements refered to above. These perturbing terms include:
* Mean motion difference (A•)* Rate of right ascension (•)
jE I t Rate of inclination (i)
93

* Corrections to argument of latitude (C,.C.,)
9 Corrections to orbital radius (C.C,C)
0 Corrections to inclination (C,.C,,)
In order to transform the Keplerian orbital parameters to coordinates in the con-
ventional terrestrial system, the following computations must be performed:
9 find time since reference epoch
tk -I o.
* solve for mean anomaly at t&
MA.t MO + [4J•+ An] tt
where the gravitational constant
it - 3.986005 x I0' sece* solve Kepler's equation iteratively for eccentric anomaly, E&
M, - Et - e sin Et
* compute true anomaly,
f,t = FFnT (sin Et)1Jkinta~v~l~ ( (cos Etk- e)
* compute the argument of latitude,uk, - w +ft + C. cos 2(w +kf) + C,,, sin 2(w +ft)
* compute the orbital radius,r, M a (I - e cos E) + C, cos 2(w, +f) + C,, sin 2(w +fa)
9 compute the orbital inclination,
ik - 1 + lt + Ck cos 2(w +ft) + C, sin 2(w +fk)
* compute the longitude of the ascending node,
At Q c + (b - we) It - we to*where the mean earth rotation rate isw,- 7.292115147 x 10secad
* then compute the CT (earth-fixed) coordinates,,k - rt cos uk cos At - rk sin u cos it sin Ati
Yj - rk cos ut sin lA + r& sin uk cos it cos 4kZ- rt sinUsin iU
94

APPENDIX B. LEAST SQUARES IN GPS
The contents of this appendix follow the development in Uotila [Ref 16). This de-velopment focuses on the general, nonlinear, observation equation model. This is themodel utilized by GASP in performing its batch least squares adjustment.
A. THE MATHEMATICAL MODEL
Using matrix notation the mathematical model is given by,
La Fm')Lf F(,r)
L' - - F(X*)
where, L, - Theoretical values of the observed quantities
X- Theoretical values of the paramtersA
L - Estimates or adjusted values of the observed quantitiesI - Estimates or adjusted values of the parameters
L* - Observed values of the observablesa = "True' errors
B. OBSERVATION EQUATIONSPrior to employing the least squares method, a nonlinear function is linearized by
expanding in a Taylor series and eliminating terms second order and higher. For a set
of nonlinear functions in matrix form we get,
L b F(I(X - AA + 6FIX. +..L•~ ~ ~ ~e e.- W" (") (o+"• I x (- X0) + """FX0) + 8X4
where, P are approximate values for the parameters and is the point about which ex-
pansion is done, and
A is called the design matrix and it has the form
95

ax, a f, 8e,
Am-X-I TX2 " axi,
afn afn afA- 8x1 ax2 "" x.
jX1 ax2 " Ox,
where, n is the number of observations, and
u is the number of equation parameters:. We will assume that redundancy exists,
Le., the number of observations is greater than the number of unknown parameters.
Using the relations:
VmAX+F(XO)-LbV - A X + F(.Y) - L'
where, V is a vector of differences between the observed values and the estimated values(V is refered to as the residual vector) and
X-X-X 0
and from,
RX(•) - L°
Lo- Lb - L
where, LO are the computed observations evaluated at 'r we get,A1
V-AX+L
These are the observation equations.
C. MINIMUM VARIANCE SOLUTIONTo find a unique set of parameter estimates some condition must be imposed on the
residuals. By minimizing the sum of the squares of the weighted residuals, we obtain a
best estimate for the parameters in a least squares sense,
96
-~ ~ . ~!

The weight matrix denoted P is given as,
p .o2 -1Z
where, Zz' is the inverse of the observation variance-covariance matrix and
Oa is the a priori variance of unit weight.
The weight matrix provides a way to assign relative importance to various observa-
tions. The observation variance-covariance matrix lets us express random errors or
noise associated with the observations as variances and relationships between observa-
tions as covariances. It is through the variance-covariance matrix that knowledge about
the observations is propagated. This allows the variances and covariances for the esti-
mated parameters to be determined (i.e., it gives an estimate of the noise in the solution).
The variances make up the diagonal elements of the matrix and the off-diagonal ele-
ments are the covariances. The variance-covariance matrix may be written,
2
27.2L o1 .. . OL2 L
2Lo Lt 0 Ln L2. . . *LA
where, a,, a a,, i.e., a symmetric matrix. The variance-covariance matrix is diagonal if
the observations are uncorrelated.
For the minimum variance solution, we want to minimize Vr P V which is the sum
of the squares of the weighted residuals in matrix notation. By some algebraic manipu-
lation we can show,
V'PV- 'ArPA +2 LrPA X+LTPL
Minimizing by partially differentiating with respect to I gives,
Th2 or Al =NA PAX+A wTPL ,
This is known as the normal equation. Now solving forlA we get,
97

A rXm.-(A PA)-IATPL
where, X is the adjustment vector that is applied to X1 giving an improved estimate for
the parameters. A number of iterations may be necessary before I reaches some ac-ceptable level, that is it sufficiently converges.
D. A POSTERIORI VARIANCE OF UNIT WEIGHT
The sum of the squares or the residuals Y" P V are found by,
VTP V- LTP L+XrT AT PL
The a posteriori variance of unit weight may be calculated,
^2 VTp V
where, n - u is the degree of freedom.
E. VARIANCE-COVARIANCE MATRIX OF ADJUSTED PARAMETERS
The variance-covar•ance matrix for the adjusted parameters is given by,
El. Z (AT PA)-' AT PZL PA (AT PA)-I
but with P- al Zz' this reduces to,
Z ý (A 7 P A-
F. VARIANCE-COVARIANCE MATRIX OF THE ADJUSTED, OBSERVED
QUANTITIESThis matrix is given by,
Z a.doA (Ar PA)-i AT
G. SUMMARY
To summarize the theoretical aspects of the least squares method using the nonlin-
ear, observation equation model,
* The nonlinear system of equations is linearized by expanding in a Taylor series andnonlinear terms are truncated (Note: the number of equations must be greater thanor equal to the number of parameters),
98

"* A suitable noise model is chosen as represented by the observation variance-covariance matrix and a priori variance of unit weight, and
"* the sum of the squares of the residuals are minimized to yield a minimum variancesolution
The operational procedures to estimate values for the unknown parameters are,
* Develop a mathematical model that expresses the observations as a function ofsome unknown parameters,
* select appropriate approximate values for the parameters A, (e.g., the receiver co-ordinates),
* Form the vector of computed observations V) by evaluating the mathematicalmodel at P',
* Determine L, which is the difference vector of the computed observations minusthe actual observations,
* Form the weight matnix P from the observation variance-covariance matrix and thea priori variance of unit weight
* take the partial derivatives of the mathematical model with respect to the un-knowns and evalute at AV to form the elements of the design matrix A,
* solve for the change in parameters, ,
* Compute the parameter variance-covariance matrix, a posteriori variance, the resi-dual vector, etc.,
* apply I to the initial approximations and stop if A' has sufficiently converged,otherwise repeat the process using X" as the new X (i.e., iterate)
99

APPENDIX C. CONSTANTS USED IN GASP
Table 21 presents the constants used in the GASP program. The constants areidentified; and the common symbols, the units (if applicable), and the values are given.
Table 15. CONSTANTS USED IN GASP
Constant Symbol Units ValueWGS-84 Earth's Semi-major Axis a km 6378.137WGS-84 Inverse Earth Flattening 4f 298.257223563Product of Gravitational Constant and GM kmsI sec' 3.986005 x 10⁵Earth's MassEarth's Rotation Rate _ road sec 7.2921 151,467 x 10-Pi _ 3.14159265358979324Speed of Light c k*i sec 299,792.458Satellite Base Frequency A Hz 10.23 x 10'LI Signal Frequency Al Hz 14fo.L2 Signal Frequency A2 Hz 120foLI Signal Wavelength AIL. cm 19.029
L2 Signal Wavelength A3, cm 24.421TI 4100 Receiver LI Frequency Offset .__ • Hz - 6000TI 4100 Receiver L2 Frequency Offset Hz 7600
100

APPENDIX D. TABLES OF RESULTS IN CT COORDINATES
A. BEACH LAB RESULTSThe results previously expressed in terms of local east, north, and up coordinates
are presented here as component differences in conventional terrestrial coordinates (X,
Y, and Z) for the reader more comfortable with this reference frame. Tables 15 through17 display these results. No corresponding target plots are shown.
Table 16. BEACH LAB COMPONENT DIFFERENCES (AX, AY, AZ) USING BROADCASTEPHEMERIS: Solution Differences Between GPS and Transit Doppler Methods,Second Term is GASP Estimated Formal Error
Day of Receiver AX (m) AY (M) AZ ()Year 1990
TI 4100 -1.1 ±.6 -0.6 ±.6 -1.0 ±.4338 Ashtech 1.1 ±.7 I.1 ±.4 -1.0 ± .4
Trimble 1.0 ±.6 2.6±.4 -0.6 ±.4
Ti 4100 -1.5 ±.6 -1.7 ±.7 -0.2 ±.4339 Ashtech 4.6 ± .7 1.1 .53 -1.3 ± .4
""Trimble 4.5S±.7 1.8 ±.4 -1.4 ±.4TI"4100 -0.9± .6 -0.4 ±.6 -0.2 ±.4
340 Ashtech 1.4 ±.6 0.8 ±.4 -1.2 ±.4Trimble 1.2 ±.6 1.2 ±.4 -0.3 ±.4TI 4100 1.2± .5 -0.9 ±.5 -0.9 ±.4
341 Ashtech -1.2 ±.6 1.5 ±.4 -0.0 ±.4
Trimble 0.2 ±.6 -0.4 ±.4 0. l±.4
l01
Lo

Table 17. BEACH LAB COMPONENT DIFFERENCES (AX, AY, AZ) USING PRECISEEPHEMERIS: Solution Differences Between GPS and Transit Doppler Methods,Second Term is GASP Estimated Formal Error
Day of Receiver AX(m) AY (m) AZ (m)Year 1990
TI 4100 2.2±+.6 1.1 ±.6 0.1±.4
338 Ashtech -0.9 ± .6 0.9 ± .4 -0.9 ± .4Trimble -1.2 ±.6 1.7±.4 -0.2 ±.4
TI 4100 -0.2 ± .6 0.6 ±1.6 -0.4 ± .4
339 Ashtech -0.5 ± .7 -0.1 ± .5 -0.5 ± .4
Trimble 0.6 ± .6 0.9 ± .4 -0.9 ±..4TI 4100 -0.7±.6 1.9±.6 -1.01.4
340 Ashtech 0.8 ±.6 1.4 ±.4 -1.7 ±.4Trimble 0.3 ±.6 1.2 ±.4 -0.6 ±.4TI 4100 1.3 ±.6 -1.8 ±.6 1.6±.4
341 Ashtech 0.1 ± .6 0.5 ± .5 0.5 ± .4Trimble 1.0±.6 -1.0±.4 0.5 ±-4
102

Table 18. BEACH LAB REPEATABILITY (AX, AY, AZ): AVERAGE OVER DAYS BY RE-CEIVER
Ephemeris Receiver Mean AX (m) Mean AY (m) Mean AZ (m)
TI 4100 -0.6 ± 1.2 -0.9 ± .6 -0.6 ± .4Broadcast Ashtech 1.5 ± 2.4 1.1 ± .3 -0.9 ± .6
Trimble 1.7 1.9 1.3 ±1.3 -0.5 ±.6"-T- T4100 "0.7± 1.3 0.4±11.6 0.1 + 1.1
Precise Ashtech -0.1 ±.7 0.7 ±.6 -0.7 ± .9Trimble 0.2 + .9 0.7 ± 1.2 -0.3 ± .6-
103

B. LOBOS3 RESULTSTables 18 and 19 display the LOBOS3 results in conventional terrestrial X, Y, and
Z coordinates. Associated target plots are not presented.
Table 19. LOBOS3 COMPONENT DIFFERENCES (AX, ,Y, AZ): Solution Differences Be-tween GPS and Transit Doppler Methods for Broadcast and Precise Ephemerides, Sec-ond Term is GASP Estimated Formal Error
Ephemeri Day of Year 199i RAX (m) " AY (.m) ', AZ (m)
36 -0.1 ±.7 -2.7:±.5 -0.2 ±.4
Broadcast 37 -0.6 ±.9 -7.5 ±.6 -0.8 ± .538 -2.4 ±.8 -6.4 ±.5 0.8 ±.4
36 -0.7 ±.7 -0.5 ±. 0.0 ±.4Precise 37 0.5 ±.7 0.1 ±.4 -0.5 ±.3
" 38 1.0 ±.7 -0.8 ±.5 0.2 ±.4
104

Table 20. LOBOS3 REPEATABILITY (AX, AY, AZ): AVERAGE
OVER DAYS
Ephemeris Mean AX (m) Mean AY ("m) 7Mean AZ (m)
Broadcast -1.0 ± 1.2 -5.5 ± 2.5 -0.1 ± .8Precise 0.3 ± .9 -0.4 ± .5 -0.1 ± .4
105
I i I i I i i i ' '

C. BLDG 224.3 RESULTS
Table 20 presents the solution differences for BLDG 224.3 in the CT coordinate
system.
Table 21. BLDG 224.3 COMPONENT DIFFERENCES (AX, AY, AZ): Selective AvailabilityTest - GPS Solution Differences Between Previously Determined Coordinates and Co-ordinates Determined After Activation of S/A (Using Broadcast E hemeris)
Day of Segment AX (in)Year 1991 I AY (W)_ ___W
197 A -29.7± 1.9 -4.5 ±- 1.21_ 5.8 ±-_.6
B -5.7 ±.8 -5.8 ±-_.9 9.5 ±-_.5
C 6.4 ± 2.1 -6.5 ±:_ _ _.9 _-1.7 ±__.7
198 D -11.4 1.0 -8.1 1.3 12.4 ±.7
L E -7.5 4-_1.0 2.9 -_1.1 0.7 ±-_.5
IM
10

APPENDIX E. SUMMARIES OF POSITIONING RESULTS
A. SUMMARY OF TRANSIT POSITION RESULTS
Station name: DOP5
Method: Transit Doppler Observations (@DOP3)
and Conventional Terrestrial Surveying
Period of Occupation: January 26-30, 1991
Transit Receiver. Magnavox MX-1502Satellites Observed: 77,105,115,124,126,128Passes Accepted: 57
RMS of Residuals: 8.0 cmWGS 84 Estimated Station Coordinates
Monument (X.Y.Z) (meters): -2707273.74 -4353292.80 3781989.36
Geodetic Coordinates (monument):
S- 36°36'06.2347 A - 238°07'22.404 h - -23.55 m eters
Standard Deviations (O,A,h) (meters):
1.0 1.0 1.0 -- 1 Sigma
107

Station name: DOPIMethod: Transit Doppler Observations (@DOP3)
and Conventional Terrestrial SurveyingPeriod of Occupation: January 26-30, 1991Transit Receiver. Magnavox MX-1502Satellites Observed: 77,105,115,124,126,128Passes Accepted: 57RMS of Residuals: 8.0 cmWGS 84 Estimated Station CoordinatesMonument (X.YZ) (meters): -2707255.23 -4353301.05 3781993.34Geodetic Coordinates (monument):
0-36"36'06.3917 A-238"07'23.211 h--23.40meter:
Standard Deviations (0,Abh) (meters):1.0 1.0 1.0 - I Sigma
Station name: DOP2Method: Transit Doppler Observations (@DOP3)
and Conventional Terrestrial SurveyingPeriod of Occupation: January 26-30, 1991Transit Receiver:. Magnavox MX.1302Satellites Observed. 77,105,115,124,126,128Passes Accepted: 57RMS of Residuals: 8.0 cmWGS 84 Estimated Station CoordinatesMonument (X.y.Z) (meters): -2707259.43 -4353297.54 3781994.29Geodetic Coordinates (monument):
0- 36"36'06.4311 A - 238"07'22.9936 h - -23.45 meters
Standard Deviations (0,AU) (meters):1.0 1.0 1.0 .- I Sigma
108

Station name: LOBOS3
Method: Transit Doppler ObservationsPeriod of Occupation: January 31- February 4, 1991
Transit Receiver. Magnavox MX-1502Satellites Observed: 77,105,115,124,126,128
Passes Accepted: 62
RMS of Residuals: 9.0 cm
WGS 84 Estimated Station Coordinates
Monument (X.Y.Z) (meters): .2693399.38 -4346211.98 3799864.81
Geodetic Coordinates (monument):
0- 36"48'09.683 A- 238°12'46.841 h - -30.45 meters
Standard Deviations (0,A,h) (meters):
1.0 1.0 1.0 -- 1 Sigma
109

B. SUMMARY OF GPS POSITION RESULTS
1. Beach Lab Sites
Station name: DOP5Method: GPS WGS 84 Absolute Point Positioning
Software: STARPREP (version 1.1), GASP (version 2.0
Ephemerides: Broadcast
Satellite Clock States: Broadcast
Date of Occupation: Day 338, 1990
GPS Receiver:. TI 4100 BEPP/CORE (versions 3.7/5.1)
Date of Point Position Estimation: June 1991
Data Collection Span: 6.2 Hours
PRN Numbers Tracked: 2,6,9,11,12,13,18,19
Final Number of GASP Observables: 1030
Percentage of Data Rejected: 2.2 %RMS of Residuals: 4.709 cm
WGS 84 Estimated Station Coordinates
Monument (X.Y.Z) (meters): -2707274.8418 -4353293.3659 3781988.4006
Standard Deviations (X,Y,Z) (meters):
0.6310 0.5967 0.4054
Geodetic Coordinates (monument):
0- 36"36'06.1889 A - 238"07'22.3782 A - -23.268 meters
Antenna height (monument to electrical center of antenna):
1.5403 meters
11
1|0

Station name: DOPI
Method: GPS WGS 84 Absolute Point Positioning
Software: STARPREP (version 1. 1D, GASP (version 2.0
Ephemerides: Broadcast
Satellite Clock States: BroadcastDate of Occupation: Day 339, 1990
GPS Receiver: TI 4100 BEPP/CORE (versions 3.7/5.1)
Date of Point Position Estimation: June 1991
Data Collection Span: 6.2 Hours
PRN Numbers Tracked: 2,6,9,11,12,13,18,19
Final Number of GASP Observables: 1017Percentage of Data Rejected: 1.2 %
RMS of Residuals: 4.794 cmWGS 84 Estimated Station Coordinates
Monument (X.Y.Z) (meters): -2707256.7432 -4353302.7647 3781993.1333Standard Deviations (X,YZ) (meters):
0.6480 0.6657 0.4016
Geodetic Coordinates (monument):
0 - 36"36'06,3426 A - 238"07'23.1963 h - -21.712 meters
Antenna height (monument to electrical center of antenna):
1.3673 meters
1111
- , 1 -

Station name: DOP5Method: GPS WGS 84 Absolute Point Positioning
Software: STARPREP (version 1.1), GASP (version 2.0Ephemerides: BroadcastSatellite Clock States: BroadcastDate of Occupation: Day 340, 1990GPS Receiver: TI 4100 BEPP/CORE (versions 3.7/5.1)Date of Point Position Estimation: June 1991Data Collection Span: 7.1 HoursPRN Numbers Tracked: 2,6,9,11,12,13,18,19Final Number of GASP Observables: 1185
Percentage of Data Rejected: 2.3 %RMS of Residuals: 4.584 cm
WGS 84 Estimated Station CoordinatesMonument (X.YZ) (meters): .2707276.6237 4353293.1626 3781989.1370Standard Deviations (X,YZ) (meters):
0.5496 0.5643 0.3848Geodetic Coordinates (monument):
0 - 36'36'06.1932 A - 238"07'22.3130 h - -22.212 meters
Antenna height (monument to electrical center of antenna):
1.5873 meters
112

Station name: DOP5Method: GPS WGS 84 Absolute Point PositioningSoftware: STARPREP (version 1.1), GASP (version 2.0Ephemerides: BroadcastSatellite Clock States: BroadcastDate of Occupation: Day 341, 1990
GPS Receiver:. TI 4100 BEPP/CORE (versions 3.7/5.1)Date of Point Position Estimation: June 1991Data Collection Span: 6.5 HoursPRN Numbers Tracked: 2,6,9,11,12,13,18,19Final Number of GASP Observables: 690Percentage of Data Rejected: 38.2 %RMS of Residuals: 3.306 cmWGS 84 Estimated Station Coordinates
Monument (X.YZ) (meters): -2707272.5806 -4353293.6093 3781988.4578Standard Deviations (X,YZ) (meters):
0.5463 0.5307 0.3803Geodetic Coordinates (monument):
0 - 36*36'06.2095 A - 238°07'22.4606 h - -24.027 meters
Antenna height (monument to electrical center of antenna):
1.5103 meters
113
n~~rjsrrr ~~rr r = - -I< n;-n )

Station name: DOPI
Method: GPS WGS 84 Absolute Point PositioningSoftware: STARPREP (version 1.1), GASP (version 2.0Ephemerides: BroadcastSatellite Clock States: BroadcastDate of Occupation: Day 338, 1990GPS Receiver: Ashtech LD XII
Receiver software versionDate of Point Position Estimation: June 1991Data Collection Span: 5.6 HoursPRN Numbers Tracked: 2,6,9,11,12,15,16,18,19Final Number of GASP Observables: 1733Percentage of Data Rejected: 9.3 %RMS of Residuals: 3.336 cmWCS 84 Estimated Station CoordinatesMonument (X.Y.Z) (meters): .27071.54.0 323 -4353299.9074 3781992.3652Standard Deviations (X,YZ) (meters):
0.6568 0.4494 0.4107Geodetic Coordinates (monument):
0 - 36"36'06.3962 A - 238"07'23.2248 h - -25.225 meters
Antenna height (monument to electrical center of antenna):
1.3313 meters
114

Station name: DOP5
Method: GPS WGS 84 Absolute Point PositioningSoftware: STARPREP (version 1.1), GASP (version 2.0
Ephemerides: BroadcastSatellite Clock States: Broadcast
Date of Occupation: Day 339, 1990
GPS Receiver. Ashtech LD XIIReceiver software version
Date of Point Position Estimation: June 1991
Data Collection Span: 6 Hours
PRN Numbers Tracked: 2,6,9,11,12,15,16,18,19
Final Number of GASP Observables: 1079
Percentage of Data Rejected: 19.8%
RMS of Residuals: 4.590 cmWGS 84 Estimated Station CoordinatesMonument (X.YZ) (meters): -2707269.1762 .4353291.6786 3781988.0816
Standard Deviations (X,YZ) (meters):
0.7447 0.4817 0.4241Geodetic Coordinates (monument):
0 - 36"36'06.2662 A - 238"07'22.5359 h - -27.011 meters
Antenna height (monument to electrical center of antenna):
1.3373 meters
115

Station name: DOPI
Method: GPS WGS 84 Absolute Point Positioning
Software: STARPREP (version 1.1), GASP (version 2.0
Ephemerides: Broadcast
Satellite Clock States: Broadcast
Date of Occupation: Day 340, 1990
GPS Receiver. Ashtech LD XII
Receiver software version
Date of Point Position Estimation: June 1991
Data Collection Span: 6.8 Hours
PRN Numbers Tracked: 2,6,9,11,12,15,16,18,19
Final Number of GASP Observables: 1297
Percentage of Data Rejected: 9.7 %
RMS of Residuals: 4.481 cm
WGS 84 Estimated Station Coordinates
Monument (X.YZ) (meters): .2707253.7859 .4353300.2267 3781992.1104
Standard Deviations (X,YZ) (meters):
0.6444 0.4487 0.4048Geodetic Coordinates (monument):
0 - 36"36'06.3879 A - 238"07'23.2434 h - -25.306 meters
Antenna height (monument to electrical center of antenna):
1.2483 meters
116
-I

Station name: DOPI
Method: GPS WGS 84 Absolute Point Positioning
Software: STARPREP (version 1.1), GASP (version 2.0
Ephemerides: BroadcastSatellite Clock States: Broadcast
Date of Occupation: Day 341, 1990
GPS Receiver: Ashtech LD XII
Receiver software version
Date of Point Position Estimation: June 1991
Data Collection Span: 6.9 Hours
PRlN Numbers Tracked: 2,6,9,11,12,15,16,18,19
Final Number of GASP Observables: 1255
Percentage of Data Rejected: 13.6%RMS of Residuals: 4.259 cm
WGS 84 Estimated Station CoordinatesMonument(X.Y.Z) (meters): -2707256.4461 -4353299.5540 3781993.3044
Standard Deviations (X,YZ) (meters):
0.6027 0.4345 0.3941
Geodetic Coordinates (monument):
0 - 36"36'06.4029 A = 238°07'23.1382 h - -23.925 meters
Antenna height (monument to electrical center of antenna):
1.4823 meters
117

Station name: DOP2Method: GPS WGS 84 Absolute Point PositioningSoftware: STARPREP (version 1.1), GASP (version 2.0Ephemerides: BroadcastSatellite Clock States: BroadcastDate of Occupation: Day 338, 1990GPS Receiver. Trimble 4000ST
Receiver software version 4.3XDate of Point Position Estimation: June 1991Data Collection Span: 6 HoursPRN Numbers Tracked: 2,6,9,11,12,15,16,18,19Final Number of GASP Observables: 1151Percentage of Data Rejected: 11.1%RMS or Residuals: 4.014 cmWGS 84 Estimated Station CoordinatesMonument (X.Y.2) (meters): -2707258.5156 -4353294.9312 3781993.6745
Standard Deviations (X,YZ) (meters):0.6452 0.4227 0.3927
Geodetic Coordinates (monument):
0- 36"36'06.4673 A - 238"07'22.9693 h - -25.978 meters
Antenna height (monument to electrical center of antenna):
1.33 13 meters
118

Station name: DOP2
Method: GPS WGS 84 Absolute Point Positioning
Software: STARPREP (version 1.1), GASP (version 2.0
Ephemerides: BroadcastSatellite Clock States: Broadcast
Date of Occupation: Day 339, 1990
OPS Receiver: Trimble 4000ST
Receiver software version 4.3X
Date of Point Position Estimation: June 1991Data Collection Span: 6 Hours
PRN Numbers Tracked: 2,6,9,11,12,15,16,18,19
Final Number of GASP Observables: 1073
Percentage of Data Rejected: 18.0%
RMS of Residuals: 3.929 cmWGS 84 Estimated Station Coordinates
Monument (X.Y.Z) (meters): -2707254.9181 .4353295.7659 3781992.9337Standard Deviations (X,YZ) (meters):
0.6625 0.4241 0.3944
Geodetic Coordinates (monument):
0) - 36"36'06.4710 A - 238"07'23.1099 h - -27.376 meters
Antenna height (monument to electrical center of antenna):
1.3023 meters
11
119

Station name: DOP2Method: GPS WGS 84 Absolute Point PositioningSoftware: STARPREP (version 1.1), GASP (version 2.0Ephemerides: BroadcastSatellite Clock States: Broadcast
Date of Occupation: Day 340, 1990GPS Receiver: Trimble 4000ST
Receiver software version 4.3XS.
Date of Point Position Estimation: June 1991Data Collection Span: 7.5 HoursPRN Numbers Tracked: 2,6,9,11,12,15,16,18,19Final Number of GASP Observables: 1282Percentage of Data Rejected: 18.8%
RMS of Residuals: 3.896 cmWGS 84 Estimated Station CoordinatesMonument (XY.Z) (meters): -2707258.2384 -4353296.3532 3781994.0224Standard Deviations (X,YZ) (meters):
0.5624 0.4229 0.3724Geodetic Coordinates (monument):
0) - 36"36'06.4558 A - 238"07'23.0090 h - -24.919 meters
Antenna height (monument to electrical center of antenna):
1.2743 meters
120

Station name: DOP2Method: GPS WGS 84 Absolute Point PositioningSoftware: STARPREP (version 1.1), GASP (version 2.0Ephemerides: Broadcast
Satellite Clock States: BroadcastDate of Occupation: Day 341, 1990GPS Receiver. Trimble 4000ST
Receiver software version 4.3X
Date of Point Position Estimation: June 1991Data Collection Span: 6.7 HoursPRN Numbers Tracked: 2,6,9,11,12,15,16,18,19Final Number of GASP Observables: 1280
Percentage of Data Rejected: 13.5%RMS of Residuals: 4.096 cm
WGS 84 Estimated Station CoordinatesMonument (X.Y.Z) (meters): -2707259.2464 A4353297.8957 3781994.4146Stau.dard Deviations (X,YZ) (meters):
0.6003 0.4309 0.3825Geodetic Coordinates (monument):
0 - 36"36'06.4304 A - 238"07'23.0073 h - -23.206 meters
Antenna height (monument to electrical center of antenna):
1.3933 meters
121

Station name: DOP5Method: GPS WGS 84 Absolute Point Positioning
Software: STARPREP (version 1.1), GASP (version 2.0
Ephemerides: Precise WGS 84 EF##90336
Satellite Clock States: Precise PC90336
Date of Occupation: Day 338, 1990
GPS Receiver. TI 4100 BEPP/CORE (versions 3.7/5.1)
Date of Point Position Estimation: June 1991
Data Collection Span: 6.2 Hours
PRN Numbers Tracked: 2,6,9,11,12,13,18,19
Final Number of GASP Observables: 1033
Percentage of Data Rejected: 1.9 %
RMS of Residuals: 4.717 cm
WGS 84 Estimated Station Coordinates
Monument (X.YZ) (meters): -2707271.5459 -4353291.7286 3781989.5013
Standard Deviations (X,YZ) (meters):
0.6306 0.5974 0.4060
Geodetic Coordinates (monument):
0 - 36"36'06.2781 A - 238*07'22.4560 h - -25.125 meters
Antenna height (monument to electrical center of antenna):
1.5403 meters
122
122

Station uame: DOPIMethod: GPS WGS 84 Absolute Point PositioningSoftware: STARPREP (version 1.1), GASP (version 2.0Ephemerides: Precise WGS84 EF##90336Satellite Clock States: Precise PC90336Date of Occupation: Day 339, 1990GPS Receiver: TI 4100 BEPP/CORE (versions 3.7/5.1)Date of Point Position Estimation: June 1991Data Collection Span: 6.2 HoursPRN Numbers Tracked: 2,6,9,11,12,13,18,19Final Number of GASP Observables: 1021Percentage of Data Rejected. 0.8 %RMS of Residuals: 4.361 cmWGS 84 Estimated Station CoordinatesMonument (X.YZ) (meters): .2707255.4509 .4353300.4770 3781992.9055Standard Deviations (X,YZ) (meters):
0.5886 0.6084 0.3707Geodetic Coordinates (monument):
0- 36"36'06.3875 A - 238"07'23.1918 h - -23.955 meters
Antenna height (monument to electrical center of antenna):
1.3673 meters
123
S. . .. ... .... .... .... ...... ... .. ...-- -: ....... . • ..... .. . -... -.. ... ....... ... .. .•.....- -... i--... ... ...-i -- .. ...... ' ..... -iT--r-

Station name: DOPS
Method: GPS WGS 84 Absolute Point Positioning
Software: STARPREP (version 1.1), GASP (version 2.0
Ephemerides: Precise WGS 84 EF##90336Satellite Clock States: Precise PC90336Date of Occupation: Day 340, 1990OPS Receiver. TI 4100 BEPP/CORE (versions 3.7/5.1)
Date of Point Position Estimation: June 1991
Data Collection Span: 7.1 Hours
PRN Numbers Tracked: 2,6,9,11,12,13,18,19
Final Numier of GASP Observables: 1182
Percentage of Data Rejected: 2.6 %
RMS of Residuals: 4.563 cmWGS 84 Estimated Station Coordinates
Monumet (X.Y.Z) (meters): .2707274.3957 .4353290.8606 3781988.3570
Standard Deviations (XY,Z) (meters):
0.5548 0.5665 0.3870
Geodetic Coordinates (monument):
0 - 36"36'06.2334 A - 238"07'22.3402 h - -25.191 meters
Antenna height (monument to electrical center or antenna):
1.5873 meters
124
~ ,~n --c,,r -r~fl--,<~'~!

Station name: DOPSMethod: GPS WGS 84 Absolute Point PositioningSoftware: STARPREP (version 1.1), GASP (version 2.0Ephemerides: Precise WGS 84 EF##90336
Satellite Clock States: Precise PC90336Date of Occupation: Day 341, 1990
GPS Receiver. TI 4100 BEPP/CORE (versions 3.7/5.1)Date of Point Position Estimation: June 1991
Data Collection Span: 6.5 HoursPRN Numbers Tracked: 2,6,9,11,12,13,18,19
Final Number of GASP Observables: 1090
Percentage of Data Rejected: 2.4 %RMS of Residuals: 4.506 cmWGS 84 Estimated Station Coordinates
Monument (X.Y.Z) (meters): -2707272.3968 -4353294.6322 3781990.9281Standard Deviations (X,YZ) (meters):
0.5813 0.5608 0.3847Geodetic Coordinates (monument):
0- 36"36'06.2589 A - 238"07'22.4886 h - -21.934 meters
Antenna height (monument to electrical center or antenna):
1.5103 meters
125

Station name: DOPIMethod: GPS WGS 84 Absolute Point PositioningSoftware: STARPREP (version 1. 1), GASP (version 2.0Ephemerides: Precise WGS 84 EF##90336Satellite Clock States: Precise PC90336
Date of Occupation: Day 338, 1990
GPS Receiver. Ashtech LD XIIReceiver software version
Date of Point Position Estimation: June 1991Data Collection Span: 5.6 HoursPRN Numbers Tracked: 2,6,9,11,12,15,16,18,19Final Number of GASP Observables: 1737
Percentage of Data Rejected: 9.1 %RMS of Residuals: 3.265 cmWGS 84 Estimated Station Coordinates
Monument (X.Y.Z) (meters): .2707256.1438 -4353300.1852 3781992.4439Standard Deviations (X,YZ) (meters):
0.6395 0.4393 0.4035Geodetic Coordinates (monument):
0- 36"36'06.3732 A - 238"07'23.1619 h - -24.136 meters
Antenna height (monument to electrical center of antenna):
1.3313 meters
126
--.' -' .- !

Station name: DOP5Method: GPS WGS 84 Absolute Point Positioning
Software: STARPREP (version 1.1), GASP (version 2.0
Ephemerides: Precise WGS 84 EF##90336
Satellite Clock States: Precies PC90336
Date of Occupation: Day 339, 1990
GPS Receiver. Ashtech LD XIIReceiver software version
Date of Point Position Estimation: June 1991Data Collection Span: 6 Hours
PRN Numbers Tracked: 2,6,9,11,12,15,16,18,19
Final Number of GASP Observables: 1092
Percentage of Data Rejected: 18.8%
RMS of Residuals: 4.347 cm
WGS 84 Estimated Station CoordinatesMonument (XY.Z) (meters): .2707274.2183 -4353292.9093 3781988.8495
Standard Deviations (X,YZ) (meters):
0.7005 0.4521 0.4073
Geodetic Coordinates (monument):
0 - 36"36'06.2144 A - 238"07'22.3898 h - -23.576 meters
Antenna height (monument to electrical center of antenna):
1.3373 meters
127
- -!

Station name: DOPI
Method: GPS WGS 84 Absolute Point Positioning
Software: STARPREP (version 1.1), GASP (version 2.0
Ephemerides: Precise WGS 84 EF##90336
Satellite Clock States: Precise PC90336
Date or Occupation: Day 340, 1990
GIS Receiver. Ashtech LD XIIReceiver software version
Date of Point Position Estimation: June 1991
Data Collection Span: 6.8 Hours
PRN Numbers Tracked: 2,6,9,11,12,15,16,18,19
Final Number of GASP Observables: 1297
Percentage of Data Rejected: 9.7 %RMS of Residuals: 4.338 cmWGS 84 Estimated Station Coordinates
Monument (XMY.Z) (meters): -2707254.4187 _4353299.6465 3781991.6860
Standard Deviations (X,YZ) (meters):
0.6276 0.4352 0.3971
Geodetic Coordinates (monument):
) - 36"36'06.3799 A - 238"07'23.2094 h - -25.686 meters
Antenna height (monument to electrical center of antenna):
1.2483 meters
128

Station name: DOPI
Method: GPS WGS 84 Absolute Point Positioning
Software: STARPREP (version 1.1), GASP (version 2.0Ephemerides: Precise WGS 84 EF##90336
Satellite Clock States: Precise PC90336
Date of Occupation: Day 341, 1990
GPS Receiver: Ashtech LD XIIReceiver software version
Date of Point Position Estimation: June 1991
Data Collection Span: 6.9 Hours
PRN Numbers Tracked: 2,6,9,11,12,15,16,18,19Final Number of GASP Observables: 1253
Percentage of Data Rejected: 13.1%
RMS of Residuals: 4.420 cmWGS 84 Estimated -Station Coordinates
Monument (X.Y.Z) (meters): .2707255.1764 -4353300.5816 37Rl993.8009Standard Deviations (X,YZ) (meters):
0.6308 0.4529 0.4070
Geodetic Coordinates (monument):
0 - 36"36'06.4119 A - 238"07'23.2034 h - -23.466 meters
Antenna height (monument to electrical center of antenna):
1.4823 meters
129

Station name: DOP2
Method: GPS WGS 84 Absolute Point Positioning
Software: STARPREP (version 1.1), GASP (version 2.0
Ephemerides: Precise WGS 84 EF##90336
Satellite Clock States: Precise PC90336
Date or Occupation: Day 338, 1990
GPS Receiver: Trimble 4000STReceiver software version 4.3X
Date of Point Position Estimation: June 1991
Data Collection Span: 6 Hours
PRN Numbers Tracked: 2,6,9,11,12,15,16,18,19Final Number of GASP Observables: 1164
Percentage of Data Rejected: 11.4%
RMS of Residuals: 3.807 cm
WGS 84 Estimated Station CoordinatesMonument (X.Y.Z) (meters): .2707260.5913 -4353295.8412 3781994.0927
Standard Deviations (X,YZ) (meters):0.6084 0.3998 0.3763
Geodetic Coordinates (monument):
0- 36"36'06.4420 A - 238"07'22.9177 h - -24.228 meters
Antenna height (monument to electrical center of antenna):
1.3313 meters
130

Station name: DOP2
Method: GPS WGS 84 Absolute Point Positioning
Software: STARPREP (version 1.1), GASP (version 2.0
Ephemerides: Precise WGS 84 EF##90336
Satellite Clock States: Precise PC90336
Date of Occupation: Day 339, 1990
GPS Receiver:. Trimble 4000ST
Receiver software version 4.3X
Date of Point Position Estimation: June 1991
Data Collection Span: 6 Hours
PRN Numbers Tracked: 2,6,9,11,12,15,16,18,19
Final Number of GASP Observables: 1089
Percentage of Data Rejected: 16.8%
RMS of Residuals: 3.715 cm
WGS 84 Estimated Station Coordinates
Monument (X.Y.Z) (meters): .2707258.8586 .4353296.6201 3781993.4158
Standard Deviations (X,YZ) (meters):
0.6186 0.3956 0.3804
Geodetic Coordinates (monument):
0 - 36"36'06.4293 A - 238"07'22.9934 h - -24.836 meters
Antenna height (monument to electrical center of antenna):
1.3023 meters
131

Station name: DOP2
Method: GPS WGS 84 Absolute Point Positioning
Software: STARPREP (version 1.1), GASP (version 2.0
Ephemerides: Precise WGS 84 EF##90336Satellite Clock States: Precise PC90336
Date of Occupation: Day 340, 1990
GPS Receiver. Trimble 4000ST
Receiver software version 4.3X
Date of Point Position Estimation: June 1991
Data Coliection Span: 7.5 Hours
PRN Numbers Tracked: 2,6,9,11,12,15,16,18,19Final Number of GASP Observables: 1281
Percentage of Data Rejected: 18.8%
RMS of Residuals: 3.793 cmWGS 84 Estimated Station Coordinates
Monument (XY.Z) (meters): .2707259.1230 -4353296.3184 3781993.6501
Standard Deviations (X,YZ) (meters):
0.5582 0.4141 0.3703
Geodetic Coordinates (monument):
0I - 36"36'06.4377 A - 238"07'22.9780 h - -24.789 meters
Antenna height (monument to electrical center of antenna):
1.2743 meters
132

Station name: DOP2
Method: GPS WGS 84 Absolute Point Positioning
Software: STARPREP (version I.I), GASP (version 2.0)
Ephemerides: Precise WGS 84 EF##90336
Satellite Clock States: Precise PC90336
Date of Occupation: Day 341, 1990
GPS Receiver. Trimble 4000ST
Receiver software version 4.3X
Date of Point Position Estimation: June 1991
Data Collection Span: 6.7 Hours
PRN Numbers Tracked: 2,6,9,11,12,15,16,18,19
Final Number of GASP Observables: 1285
Percentage of Data Rejected: 13.1%RMS of Residuals: 4.214 cm
WGS 84 Estimated Station CoordinatesMonument (X.Y.Z) (meters): -2707258.4303 -4353298.5061 3781994.7611
Standard Deviations (X,YZ) (meters):
0.6086 0.4354 0.3854
Geodetic Coordinates (monument):
4 - 36"36'06.4377 A - 238"07'23.0481 h - -22.929 meters
Antenna height (monument to electrical center of antenna):
1.3933 meters
133

2. LOBOS3 Site
Station name: LOBOS3
Method: GPS WGS 84 Absolute Point Positioning
Software: STARPREP (version 1.1), GASP (version 2.0
Ephemerides: Broadcast
Satellite Clock States: Broadcast
Date of Occupation: Day 36, 1991
GPS Receiver: TI 4100 BEPP/CORE (versions 3.7/5.1)
Date of Point Position Estimation: June 1991
Data Collection Span: 8.6 Hours
PRN Numbers Tracked: 3,6,11,12,13,16,17,20
Final Number of GASP Observables: 964
Percentage of Data Rejected: 2.0 %
RMS of Residuals: 4.847 cm
WGS 84 Estimated Station Coordinates
Monument (X.YZ) (meters): .2693399.4335 -4346214.6434 3799864.5746
Standard Deviations (X,YZ) (meters):
0.6637 0.5214 0.3612
Geodetic Coordinates (monument):
0- 36"48'09.6322 A- 238"12'46.8955 h -- 28.749 meters
Antenna height (monument to electrical center of antenna):
1.5673 meters
134

Station name: LOBOS3
Method: GPS WGS 84 Absolute Point Positioning
Software: STARPREP (version 1.1), GASP (version 2.0
Ephemerides: Broadcast
Satellite Clock States: Broadcast
Date of Occupation: Day 37, 1991
GPS Receiver: TI 4100 BEPP/CORE (versions 3.7/5.1)
Date of Point Position Estimation: June 1991
Data Collection Span: 10.8 Hours
PRN Numbers Tracked: 3,6,11,12,13,16,17,20
Final Number of GASP Observables: 1361
Percentage of Data Rejected: 0.9 %
RMS of Residuals: 6.786 cmWGS 84 Estimated Station Coordinates
Monument (XY.Z) (meters): -2693400.0239 -4346219.4479 3799864.0505Standard Deviations (X,YZ) (meters):
0.8974 0.6011 0.4497
Geodetic Coordinates (monument):
O w36"48'09.5332 A - 238"12'46.9773 h- -25.544 meters
Antenna height (monument to electrical center of antenna):
1.5673 meters
135

Station name: LOBOS3
Method: GPS WGS 84 Absolute Point Positioning
Software: STARPREP (version 1.1), GASP (version 2.0Ephemerides: Broadcast
Satellite Clock States: Broadcast
Date of Occupation: Day 38, 1991GPS Receiver. TJ 4100 BEPP/CORE (versions 3.7/5.1)Date of Point Position Estimation: June 1991Data Collection Span: 10.8 HoursPRN Numbers Tracked. 3,6,11,12,13,16,17,20
Final Number of GASP Observables: 1293
Percentage of Data Rejected: 0.8 %
RMS of Residuals: 5.733 cmWGS 84 Estimated Station Coordinates
Monument (X.YQ.) (meters): .2693401.7366 A4346218.3372 3799865.5840
Standard Deviations (X,YZ) (meters):
0.7575 0.5162 0.3880
Geodetic Coordinates (monument):
0- 36"48'09.5738 A - 238'12'46.8950 h - -24.659 meters
Antenna height (monument to electrical center of antenna):
1.5673 meters
1
136

Station name: LOBOS3
Method: GPS WGS 84 Absolute Point Positioning
Software: STARPREP (version 1.1), GASP (version 2,0
Ephemerides: Precise WGS 84 EF##91034
Satellite Clock States: Precise PC91034
Date of Occupation: Day 36, 1991
GPS Receiver. TI 4100 BEPP/CORE (versions 3.7/3.1)
Date of Point Position Estimation: June 1991
Data Collection Span: 8.6 Hours
PRN Numbers Tracked: 3,6,11,12,13,16,17,20
Final Number of GASP Observables: 970
Percentage of Data Rejected: 1.4%
RMS of Residuals: 4.947 cm
WGS 84 Estimated Station Coordinates
Monument (X.YZ) (meters): .2693400.0858 .4346212.4518 3799864.7808
Standard Deviations (X,YZ) (meters):
0.6707 0.5258 0.3626
Geodetic Coordinates (monument):
0- 36"48'09.6671 A - 238"12'46.8266 h - -29.842 meters
Antenna height (monument to electrical center of antenna):
1.5673 meters
137
~ .r~~r~ iS.V~ -. _.. --.---.. ~,-- rcz~-r ~!

Station name: LOBOS3
Method: GPS WGS 84 Absolute Point Positioning
Software: STARPREP (version 1.1), GASP (version 2.0
Ephemerides: Precise WGS 84 EF##91034
Satellite Clock States: Precise PC91034
Date of Occupation: Day 37, 1991
GPS Receiver. TI 4100 BEPP/CORE (versions 3.7/5.1) t
Date of Point Position Estimation: June 1991
Data Collection Spar.. 10.8 Hours
PRN Numbers Trad¢..,, 3,6,11,12,13,16,17,20
Final Number of GASi observables: 1364
Percentage of Data Rejected: 0.7%RMS of Residuals: 4.956 cm
WGS 84 Estimated Station Coordinates
Monument (X.Y.Z) (meters): .2693398.8698 A4346211.9262 3799864.2645
Standard Deviations (X,YZ) (meters):
0.6641 0.4467 0.3459
Geodetic Coordinates (monument):
0 - 36"48'09.6748 A - 238"12'46.8571 h - -31.022 meters
Antenna height (monument to electrical center of antenna):
1.5673 meters
138

Station name: LOBOS3
Method: GPS WGS 84 Absolute Point Positioning
Software: STARPREP (version 1.1), GASP (version 2.0Ephemerides: Precise WGS 84 EF##91034
Satellite Clock States; Precise PC91034
Date of Occupation: Day 38, 1991GPS Receiver. TI 4100 BEPP/CORE (versions 3.7/5.1)
Date of Point Position Estimation: June 1991
Data Collection Span: 10.8 Hours
PRN Numbers Tracked: 3,6,11,12,13,16,17,20
Final Number of GASP Observables: 1298
Percentage of Data Rejected: 0.4%
RMS of Residuals: 5.160 cm
WGS 84 Estimated Station Coordinates
Monument (X.Y.Z) (meters): -2693398.3618 .4346212.7487 3799864.9918Standard Deviations (X,YZ) (meters):
0.6893 0.4706 0.3577
Geodetic Coordinates (monument):
0- 36"48'09.6858 A - 238"12'46.8920 h - -30.241 meters
Antenna height (monument to electrical center of antenna):
1.5673 meters
46
139

LIST OF REFERENCES
I. Malys, S., Jensen, P.A., Guidelines, Operational Procedures, and Quality Control forthe Estimation of Geodetic Point Positions form GPS Data Collected with the TI 4100
Receiver. Defense Mapping Agency Technical Manual, 1990.
2. Malys, S., Ortiz, M., Geodetic Absolute Positioning with Di.ferenced GPS Carrier
Beat Phase Data, Proceedings of the Fifth International Symposium on SatellitePositioning, 1989.
3. Wells, D., Guide to GPS Positioning. Canadian GPS Associates, 1987.
4. Gurtner, W., Mader, G., MacArthur, D., A Common Exchange Format for GPS
Data, Proceedings of the Fifth International Symposium on Satellite Positioning,1989.
5. Dixon, T.H., An Introduction to the Global Positioning System and Some Geological
Applications, Reviews of Geophysics, May 1991.
6. King, R.W., Masters, E.G., Rizos, C., Stolz, A., Collins, J., Surveying with GPS,Monograph 9, School of Surveying, The University of New South Wales, Australia.
7. Ewing, C.E., Mitchell, M.M., Introduction to Geodesy, American Elsevier Publishing
Co. Inc., 1975.
8. Leick, A., GPS Satellite Surveying, John Wiley and Sons, 1990.
9. Grinker, B. Accuracy of Shipborne Kinematic GPS Surveying, Naval Postgraduate
School Master's Thesis, September 1991.
10. Chao, C.C., A New Method to Predict Wet Zenith Range Corrections from Surface
Measurements, Technical Report California Institute of Technology (JPL), 1973.
140
~a 72~rL -~ ..rrz/ r

11. Hopfield, H.S., Two-Quartic Tropospheric Rfractivity Profile for Correcting Satellite
Data. Journal of Geophysical Research, Vol. 74, No. 18, 1969.
12. Coco, D.S., Clynch, J.R., The Variability of the Tropospheric Range Correction Due
to Water Vapor Fluctuations. Proceedings of the Third International Symposium
on Satellite Positioning, 1982.
13. Gibson, L.R., A Derivation of Relativistic Fffec:s in Satellite Tracking. Naval Surface
Weapons Center, April 1983.
14. GPS Interface Control Document, GPS-ICD-200. Rockwell International Corpo-
ration, 1984.
15. Gurtner, W., Mader, G., Receiver Independent Exchange Format Version 2. Pro.
ceedings of the Second International Symposium on Precise Positioning with GPS,
1990.
16. Uotila, U.A., Notes on Adjustment Computations, Department of Geodetic Science
and Surveying, The Ohio State University, 1986.
14
141
it ,"-rTT T'F t -i II I II I II II I_

BIBLIOGRAPHY
Applied Research Laboratory, University of Texas at Austin, ARLIUT FIC Block
Descriptions for WMIOl. GESAR/CORE/ASDAP TI- Navigator, The University
of Texas at Austin, 1988.
Davis, R., Foote, F., Anderson, J., Mikhail, E., Surveying: Theory and Practice,
McGraw Hill, Inc., 1966.
Dixon, T.H., An Introduction to the Global Positioning System and Some Geological
Applications, Reviews of Geophysics, May 1991.
Ewing, C.E., MitcheU, M.M., Introduction to Geodesy, American Elsevier Publish-ing Co. Inc., 1975.
Gurner, W., Mader, G., MacArthur, D., A Common Exchange Format for GPS
Data, Proceedings of the Fifth International Symposium on Satellite Positioning,
1989.
Gunner, W., Mader, G., Receiver Independent Exchange Format Version 2, Pro-ceedings of the Second International Symposium on Precise Positioning with GPS,
1990.
Hoar, GJ., Satellite Surveying Theory and Application. Magnavox Advanced Pro-ducts and Systems Publication, 1982,
GPS Interface Control Document, GPS-ICD.200, Rockwell International Corpo-
ration, 1984.
King, L.W., Masters, E.G., Rizos, C., Stolz, A., Collins, J., Surveying with GPS,
Monograph 9, School of Surveying, The University of New South Wales, Australia.
142
Lachapelle, B., Beck, N., Heroux, P., NA VSTAR/GPS Single Point PositioningUsing Pseudorange and Doppler Observations. Proceedings of the Third Interna-
tional Symposium on Satellite Positioning, 1982.
Leick, A., GPS Satellite Surveying, John Wiley and Sons, 1990.
Malys, S., Jensen, PA., Geodetic Point Positioning with Carrier Beat Phase Data
from the CASA UNO Experiment, Geophysical Research Letters, 1990.
Malys, S., Jensen, P.A., Guidelines. Operational Procedures. and Quality Control for
the Estimation of Geodetic Point Positionsform GPS Data Collected with the TI 4100
Receiver, Defense Mapping Agency Technical Manual, 1990.
Malys, S., Ortiz, M., Geodetic Absolute Positioning with Differenced GPS Carrier
Beat Phase Data, Proceedings of the Fifth International Symposium on SatellitePositioning, 1989.
Meyer, T., Tennis, G., Slater, J., Denoyer, B., DMAHTC GPS Point Positioning
Software: Initial Results, Proceedings of the Fourth International Symposium onSatellite Positioning, 1986.
Uotila, U.A., Notes on Adjustment Computations. Department of Geodetic Science
and Surveying, The Ohio State University, 1986.
Wells, D., Guide to GPS Positioning, Canadian GPS Associates, 1987.
14
143

INITIAL DISTRIBUTION LIST
No. Copies
L Defense Technical Information Center 2Cameron StationAlexandria, VA 22304-6145
2. Library, Code 52 2Naval Postgraduate SchoolMonterey, CA 93943-5002
3. Chairman (Code OC/Co) IDepartment of OceanographyNaval Postgraduate SchoolMonterey, CA 93943-5000
4. Dr. James Clynch (Code OC/Co) IDepartment of OceanographyNaval Postgraduate SchoolMonterey, CA 93943-5000
5. Dennis Bredthauer 15819 Westwater CourtCentreville, VA 22020
6. Chief, Hydrographic Programs Division IDefense Mapping Agency (Code PPH)Bldg. 56, U.S. Naval ObservatoryWashington, DC 20305.3000
7. Director (Code HO)Defense Mapping Agency HydrographicTopographic Center6500 Brookes LaneWashington, DC 20315
8. Associate Deputy Director for HydrographyDefense Mapping Agency (Code DH)Building 56U.S. Naval ObservatoryWashington, DC 20305-3000
9. Director (Code PSD.MC)Defense Mapping SchoolFt. Belvoir, VA 22060
10. Defense Mapping Agency Systems Center 38613 Lee HighwayFairfax, VA 22031-2138
144

Attention: Mr. Stephen Malys,Mr. R. Ziegler, Mr. M. Kumar (Code EGS)
11. Defense Mapping Agency Headquarters8613 Lee HighwayFairfax, VA 22031-2138Attention: Mr. R. Russman,Mr. J. Slater, Mr. T. Meyer
12. Defense Mapping Agency HTCCommander Geodetic Survey Group 2
3 P.O. Box 9617F.E. Warren AFB, WY 92005.6300Attention: Mr. H. Heurman,Mr. J. Rees (Code GGPP)
13. Mr. Morris Glenn (Code MCPE)Defense Mapping Agency HydrographicTopographic Center6500 Brookes LaneWashington, DC 20315.0030
14. Prof. Harold A. Titus (Code EC/Ts)Department of Electricaland Computer EngineeringNaval Postgraduate SchoolMonterey, CA 93943-5000
I. LCDR. Manuel PardoPlaza de Arguelles, No. 611001 Cadiz, Spain
16. LCDR. Barry GrinkerMPOB 01068Israel
17. Applied Research Laboratories 3University of Texas at Austin
P.O. Box 8029Austin, TX 78713.8029Attention: Mr. D. Coco,Mr. M. Leach, Mr. B. Tolman
18. Ashtech Inc.390 Potrero Ave.Sunnyvale, CA 94086Attention: Mr. P. Heinmann
19. Trimble Navigation 2645 N. Mary Ave.
Sunnyvale, CA 94088.3642Attention: Mr. D. Young,
145

Mr. R. Kalifus
20. Texas State Department Of Public TransportationI I th and Brazos St.Austin, TX 78701Attention: Mr. F. Howard (D19)
21. National Geodetic Survey N/CG 11411400 Rockville PikeRockville, MD 20852Attention: Dr. G. Mader
22. USGSMenlo Park, CA 94025Aitention: Mr. W. Prescott
23. USNO34th and Massachusetts Ave. N.W.Washington, D.C. 20392-5100Attention: Mr. B. Klepezyuski
24. Naval Air Warfare Center 2Weapons DivisionPt. Mogo, CA 93042-5000Attention: Mr. B. Cohenour,Mr. R. Smith
25. Naval Oceanographic CenterStennis Space Center, MS 39922-5001Attention: Mr. P. Taylor (Code HS)
26. Naval Surface Weapons Center 3Dahlgren LaboratoryDahlgren, VA 22448Attention: Mr. R. Hill,Mr. A. Evans, Mr. B. Herman (K10)
27. Navy Space Systems Activity (Code 80) 1P.O. Box 92960Los Angeles Air Force StationLos Angeles, CA 90009-2960Attention: CMDR. J. K. McDermott
146
~, o