Nowcasting the poverty rate by microsimulation - oecd.org · 3 Nowcasting the poverty rate by...
22
Nowcasting the poverty rate by microsimulation 1 18/02/2016 Nowcasting the poverty rate by microsimulation Maëlle Fontaine and Michaël Sicsic INSEE 2 nd MEETING OF PROVIDERS OF OECD INCOME DISTRIBUTION DATA Paris, OECD, 18-19 February 2016
Transcript of Nowcasting the poverty rate by microsimulation - oecd.org · 3 Nowcasting the poverty rate by...

Nowcasting the poverty rate by microsimulation1 18/02/2016
Nowcasting the poverty rateby microsimulation
Maëlle Fontaine and Michaël SicsicINSEE
2nd MEETING OF PROVIDERS OF OECD INCOME DISTRIBUTION DATAParis, OECD, 18-19 February 2016

Nowcasting the poverty rate by microsimulation2 18/02/2016
Summary
1. Introduction
2. Method
3. Results
4. Conclusion

Nowcasting the poverty rate by microsimulation3 18/02/2016
IntroductionCurrent situation
• September N+2: Insee releases the final estimates of equivalised disposable income, poverty rate and the main inequality indicators, for year N
• Based on the Tax and Social Incomes Survey (ERFS)
� First results are disseminated 21 months after the end of the period under consideration
• This is a long delay considering the needs of users
Labour Force Survey for year N completed (basis for ERFS
N)
September N+2 : ERFS N finalised and poverty
rate N published
N N+1 N+2

Nowcasting the poverty rate by microsimulation4 18/02/2016
IntroductionThe Tax and Social Incomes survey (ERFS)
• ERFS results from the match between
– The Labour Force Survey (LFS)
– Administrative income tax and local residence tax records
(source: fiscal administration)
– Administrative data on social benefits
• Calendar for producing the ERFS explain the length of the delay
Delay mainly due to the specific features of the information system
– ¾: collecting tax and social data
– ¼: statistical matching + statistical processing to produce key indicators of poverty
Labour Force Survey for year N completed (basis for ERFS
N)
September N+2 : ERFS N finalised and poverty
rate N published
N N+1 N+2
Decembre N+1 : Tax files received
April N+2 : Social files received
Nowcasting the poverty rate by microsimulation5 18/02/2016
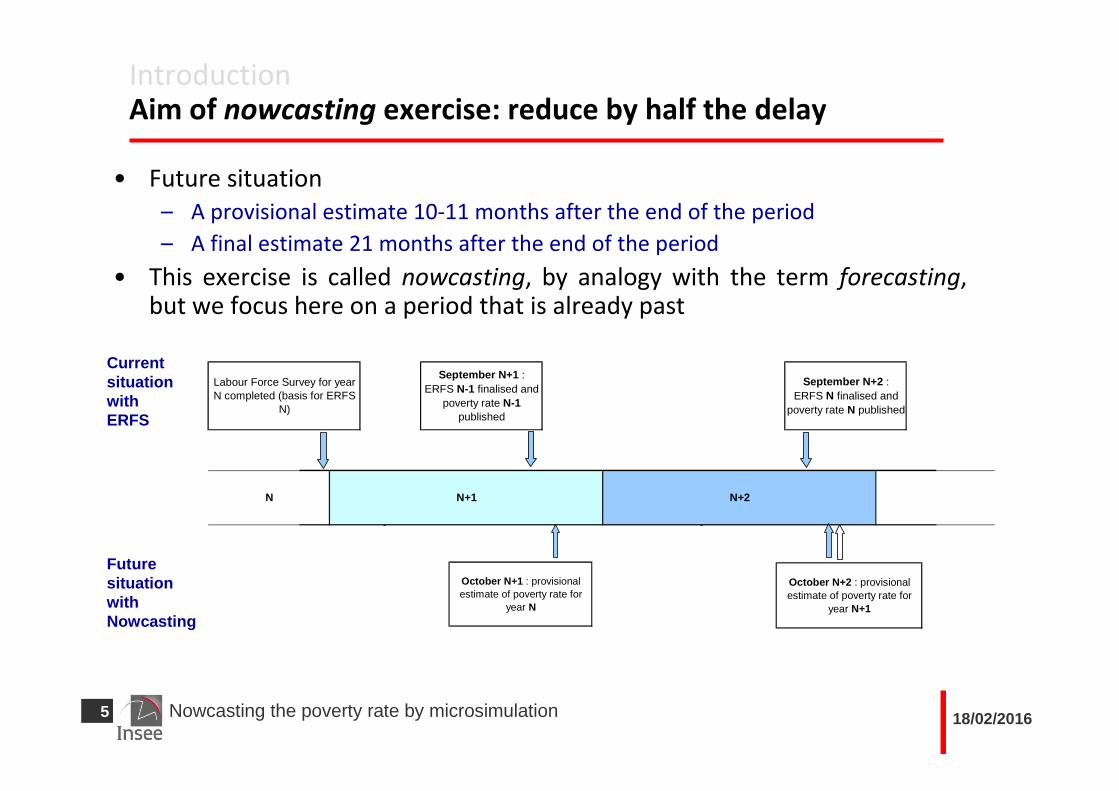
IntroductionAim of nowcasting exercise: reduce by half the delay
• Future situation
– A provisional estimate 10-11 months after the end of the period
– A final estimate 21 months after the end of the period
• This exercise is called nowcasting, by analogy with the term forecasting, but we focus here on a period that is already past
Current situation with ERFS
Future situation with Nowcasting
N N+1 N+2
Labour Force Survey for year N completed (basis for ERFS
N)
September N+1 : ERFS N-1 finalised and
poverty rate N-1 published
September N+2 : ERFS N finalised and
poverty rate N published
October N+1 : provisional estimate of poverty rate for
year N
October N+2 : provisional estimate of poverty rate for
year N+1

Nowcasting the poverty rate by microsimulation6 18/02/2016
Summary
1. Introduction
2. Method
3. Results
4. Conclusion

Nowcasting the poverty rate by microsimulation7 18/02/2016
MethodClassic use of the microsimulation model Ines
• We use microsimulation model Ines which simulate taxes and benefits in France
• Co-management of Ines : INSEE - DREES (Ministry of Health and Social Policy)
• Based on ERFS data set : sample of 50 000 households
• A specific feature of the French legislation which is taken into account in INES is that some taxes, benefits and contributions depend on past incomes (cf. appendix) .
� To deal with it, we need information on 3 consecutive years of income for each individual (N-2, N-1 and N) � ageing process

Nowcasting the poverty rate by microsimulation8 18/02/2016
MethodMain steps of model Ines
• Static ageing– Calibration weighting
using margins from LFS, census, etc…
– Individual income evolutionusing surveys about salaries, aggregated tax data, inflation, regulatory parameters…
– No behavioral response
• Applying social and tax legislationGross income
- Income taxes
- Social contributions
+ Benefits• Family allowances
• Social statutory minimum (RSA…)
• Housing allowances
= Household’s disposable income
→ Equivalised disposable income can be deduced

Nowcasting the poverty rate by microsimulation9 18/02/2016
MethodDiverting Ines for nowcasting
• The level of the poverty rate simulated with Ines is weaker than the “official” one
– Calculate an evolution between N-1 and N
– Report this evolution to the “official” N-1 poverty rate
• Importance of the sample bias relative to the database
� Use a single ERFS (N-1) to produce both evaluations for years N and N-1
– “Contemporary evaluation” : simulating N-1 with ERFS N-1
– “Forward evaluation” : simulating N with ERFS N-1
�
• [Consequence : “reverse ageing” to simulate the 3 consecutive years (cf. appendix)]
τ̂( N )( N �1)
^τ(N �1)(N �1)
∆̂ τnowcasting=^τ(N )
(N �1)�^τ( N �1 )
( N �1 )

Nowcasting the poverty rate by microsimulation10 18/02/2016
MethodNowcasting: a trade-off between precision and timeliness
Trade-off principle:
• In October N+1, information relative to N-1 is available but trends evolutions will be made for ageing N-1 -> N � we are able to release a reliable provisional indicator for year N
• In May N+2 more information relative to year N will be available: would improve quality of ageing in forward evaluation and thus of the estimation
Classic use
of Ines
Nowcasting
End of year NSeptember N+1 : ERFS of year N-1 received / poverty rate of year N-1 released
Rebasing Ines and simulation of
year N+1 with ERFS N-1
January to May N+1 : aggregated social and demographical data for
year N received, necessary to carry out provisional estimate for N
May N+2 : additional aggregated data (fiscal
records) for year N received
N N+1 N+2
October N+1 : forward and contemporary evaluations
(years N-1 and N)

Nowcasting the poverty rate by microsimulation11 18/02/2016
Summary
1. Introduction
2. Method
3. Results
4. Conclusion

Nowcasting the poverty rate by microsimulation12 18/02/2016
Results2010-2013: Comparison between observed and simulated evolutions
Evolution of 60% poverty rate Evolution of median living standard (real growth rate, %)
Evolution of Gini index Evolution of P90/P10 ratio
-1,5
-1,0
-0,5
0,0
0,5
1,0
2010 2011 2012 2013
observed evolution
simulated evolution
Real conditions
-1,5
-1,0
-0,5
0,0
0,5
1,0
2010 2011 2012 2013
observed evolution
simulated evolution
Real conditions
-0,015
-0,010
-0,005
0,000
0,005
0,010
2010 2011 2012 2013
observed evolution
simulated evolution
Real conditions
-0,15
-0,10
-0,05
0,00
0,05
0,10
0,15
2010 2011 2012 2013
observed evolution
simulated evolution
Real conditions

Nowcasting the poverty rate by microsimulation13 18/02/2016
Results2014: Recent results (poverty rate and some inequality indicators)
2013 2014Simulated Observed Difference Simulated
60% poverty rate -0,4 -0,3 0,1 0,2
Level (%) 13,9 14,0 0,1 14,2Median living standard
-1,2 -0,1 1,1 (points) -0,3Gini indexChange between N-1 and N -0,007 -0,014 -0,007 0,004Level (%) 0,298 0,291 -0,007 0,295P90/P10Change between N-1 and N -0,1 -0,1 0,0 0,0Level (%) 3,5 3,5 0,0 3,5
Change between N-1 and N (points of %)
Change between N-1 and N : real growth rate, %
INSEE decided to publish experimental results for 2014 in December 2015

Nowcasting the poverty rate by microsimulation14 18/02/2016
Summary
1. Introduction
2. Method
3. Results
4. Conclusion
Nowcasting the poverty rate by microsimulation15 18/02/2016
Conclusion
• Nowcasting using INES provides an estimate of the poverty rate 11 months earlier than at present.
• Between 2010 and 2013, nowcasting seems to have always predictedchanges in the 60% poverty rate along the same lines as those observed one year later with ERFS. The results of the exercise are also conclusive with regards to Gini index, P90/P10, and to a lesser extent median living standard. But less satisfactory results for 50% poverty rate and poverty gap at 60%.Some results remain hard to explain.
• Estimates would especially have to be considered with caution in times of crisis or recovery, as during these times the ageing applied to an ERFS dating back one year would not necessarily be relevant in representing reality.
• Next years: nowcasting could be finalised in October or November N+1.

Nowcasting the poverty rate by microsimulation16 18/02/2016
Nowcasting the poverty rate by microsimulation
Thank you for your attention !

Nowcasting the poverty rate by microsimulation17 18/02/2016
ANNEXE

Nowcasting the poverty rate by microsimulation18 18/02/2016
MethodClassic use of the microsimulation model Ines
• We use microsimulation model Ines which simulate taxes and benefits in France
• Co-management of Ines : INSEE - DREES (Ministry of Health and Social Policy)
• Based on ERFS data set : sample of 50 000 households
• A specific feature of the French legislation which is taken into account in INES is that some taxes, benefits and contributions depend on past incomes :
– Income tax paid in a given year (N) is calculated from the income and the situation of the previous year (N-1)
– Some benefits are calculated on the basis of the income earned 2 years ago (N-2)
� To deal with it, we need information on 3 consecutive years of income for each individual
Classic INES process
N-2Ageing no.1
N-1Ageing no.2
N
Year required to
calculate benefits
Year required to
calculate taxes
Simulated
legislation year

Nowcasting the poverty rate by microsimulation19 18/02/2016
MethodNowcasting: a trade-off between precision and timeliness
• Aggregated tax data for year N is not available in October N+1 but in May N+2
• Nowcasting exercise: in October N+1, information relative to N-1 is available but trends evolutions will be made for ageing N-1 -> N
• Trade-off principle: in October N+1, we are able to release a reliable provisional indicator for year N
• In May N+2 more information relative to year N will be available: would improve quality of ageing in forward evaluation
Classic use
of Ines
Nowcasting
End of year NSeptember N+1 : ERFS of year N-1 received / poverty rate of year N-1 released
Rebasing Ines and simulation of
year N+1 with ERFS N-1
January to May N+1 : aggregated social and demographical data for
year N received, necessary to carry out provisional estimate for N
May N+2 : additional aggregated data (fiscal
records) for year N received
N N+1 N+2
October N+1 : forward and contemporary evaluations
(years N-1 and N)

Nowcasting the poverty rate by microsimulation20 18/02/2016
MethodDiverting Ines for nowcasting
• The level of the poverty rate simulated with Ines is weaker than the “official” one
– Calculate an evolution between N-1 and N
– Report this evolution to the “official” N-1 poverty rate
• Importance of the sample bias relative to the database
� Use a single ERFS (N-1) to produce both evaluations for years N and N-1
– “Contemporary evaluation” : simulating N-1 with ERFS N-1
– “Forward evaluation” : simulating N with ERFS N-1
• Consequence : “reverse ageing” to simulate the 3 consecutive years
= Symetric of classic ageing ordinary implemented with Ines
Forward evaluation
N-2Reverse ageing
N-1Ageing
N
Contemporary evaluation
N-3Reverse ageing no.2
N-2Reverse ageing no.1
N-1
ERFS year
Year required to
calculate benefits
Year required to
calculate taxes
Simulated
legislation year
Nowcasting the poverty rate by microsimulation21 18/02/2016
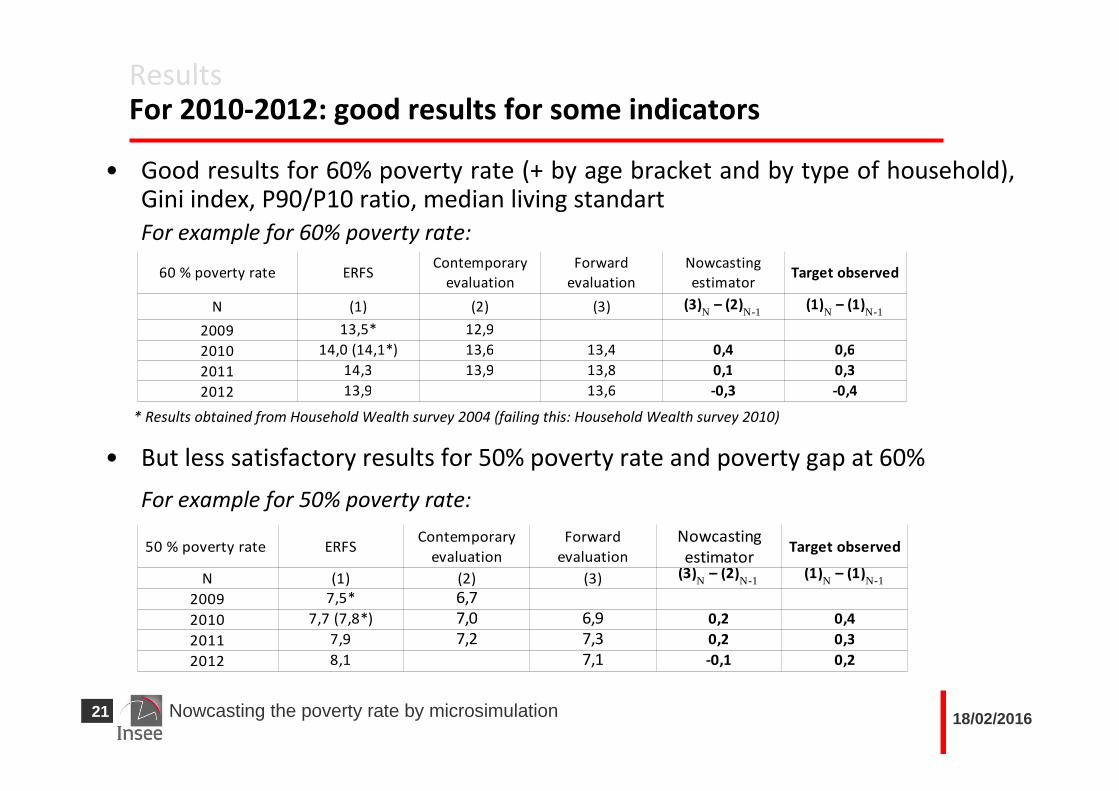
ResultsFor 2010-2012: good results for some indicators
• Good results for 60% poverty rate (+ by age bracket and by type of household), Gini index, P90/P10 ratio, median living standart
For example for 60% poverty rate:
ERFS Target observed
N (1) (2) (3)
2009 13,5* 12,9
2010 14,0 (14,1*) 13,6 13,4 0,4 0,6
2011 14,3 13,9 13,8 0,1 0,3
2012 13,9 13,6 -0,3 -0,4
60 % poverty rateContemporary
evaluation
Forward
evaluation
Nowcasting estimator
(3)N
– (2)N-1
(1)N
– (1)N-1
ERFS Target observed
N (1) (2) (3)
2009 7,5* 6,7
2010 7,7 (7,8*) 7,0 6,9 0,2 0,4
2011 7,9 7,2 7,3 0,2 0,3
2012 8,1 7,1 -0,1 0,2
50 % poverty rate Contemporary
evaluation
Forward
evaluation
Nowcasting estimator
(3)N
– (2)N-1
(1)N
– (1)N-1
* Results obtained from Household Wealth survey 2004 (failing this: Household Wealth survey 2010)
• But less satisfactory results for 50% poverty rate and poverty gap at 60%
For example for 50% poverty rate:

Nowcasting the poverty rate by microsimulation22 18/02/2016
ResultsLimited impact of «real» conditions for year 2013
• For the years 2010-2012, more recent information is available when performing the exercise in 2015 than what we would have had in real conditions� ageing is realized using the best information available, although in real conditions, we would have made assumptions concerning trend evolutions of few incomes (movable assets, property income and extra earnings for example)
• For year 2013, we test the impact of real conditions :
� no impact on poverty rate and P90/P10 ratio
� small impact on Gini index and significant impact on median living standard
Real conditions Not real conditions difference-0,4 -0,4 0,0 -0,3-1,2 -0,2 1,0 -0,1
-0,007 -0,009 -0,002 -0,014-0,1 -0,1 0,0 -0,1
Median living standard (real growth rate, %)
Deviation between 2012 and 2013Simuled by nowcasting
observed
Gini index
60% poverty rate (%)
P90/P10