November December 2015 CERI Commodity Report — Crude...
24
November-December 2015 CERI Commodity Report — Crude Oil Relevant • Independent • Objecve CERI Commodity Report – Crude Oil Editorial Commiee: Paul Kralovic, Dinara Millington, Megan Murphy, Jon Rozhon, Allan Fogwill About CERI The Canadian Energy Research Instute is an independent, not-for-profit research establishment created through a partnership of industry, academia, and government in 1975. Our mission is to provide relevant, independent, objecve economic research in energy and related environmental issues. For more informaon about CERI, please visit our website at www.ceri.ca or contact us at [email protected]. Figure 1: Saudi Arabia Relinquishes Role as Swing Producer Source: EIA, Oak Leaf Energy Training WTI has been sub-$50 since mid-summer 2015, and the world’s other main marker crude, Brent Blend, has been trading at comparable levels. There are no manifest signs of an upward swing anyme soon. Cheap crude oil is now plenful and available to all. Forty years ago, the story was much different. The 1973 Oil Crisis marked the beginning of a keen naonal awareness of oil’s importance in the daily lives of Americans. Arab naons, displeased with US and other naons’ support of Israel in the Yom Kippur War, announced an oil embargo on those countries. This energy restricon resulted in immediate, massive increases in oil prices, which in turn had resounding effects throughout the US economy. The US had reached a peak in oil producon three years earlier, and could not unilaterally make up for this sharp reducon in supply. Various domesc policy and diplomac efforts eventually eased the supply crisis, but the 1970s were a me of long line-ups at gasoline staons and persistent economic “stagflaon”. 3 In 1975, President Gerald Ford signed new legislaon to deal with the crisis, The Energy Policy and Conservaon Act. The Act established the Corporate Average Fuel Economy (CAFE) standards and the Strategic Petroleum Reserve, both of which are sll in place today. It also provided the President with power to control domesc Assessing the US Ban on Crude Oil Exports Jon Rozhon In his 2006 State of the Union address, US President George Bush dramacally announced, “America is addicted to oil”. Those remain perhaps the most memorable words of the enre speech. The next sentence, though, has turned out to be even more telling: “The best way to break this addicon is through technology”. 1 President Bush was certainly correct in stang technology had a role to play, but in the oil and gas industry, a decade of remarkable technological innovaon has so far not cured America of its oil dependency. It may well be argued that technology has only fed the addicon. Two rapidly developing technologies in parcular – horizontal drilling and hydraulic fracturing – have pried open previously uneconomic shale oil and gas plays throughout North America, flooding markets with domescally-produced hydrocarbons in volumes that would have been unthinkable during the Bush era. The price of West Texas Intermediate (WTI) crude oil stood at $67.86 on the day of the President’s speech, and there were some fluctuaons over the next few years. Since 2010 however, the oil price stayed uncharacteriscally stable, trading mostly within the $70-$100 range. Finally, in the summer of 2014, the crude oversupply caused global crude oil prices to collapse by more than 50 percent. The situaon was further exacerbated when Saudi Arabia made the decision not to adjust producon to support higher oil prices, thereby abandoning its tradional role as “Swing Producer,” 2 and the world witnessed the unfeered laws of supply and demand taking the price of oil straight down (see Figure 1).
-
Upload
duongkhanh -
Category
Documents
-
view
215 -
download
0
Transcript of November December 2015 CERI Commodity Report — Crude...
November-December 2015
CERI Commodity Report — Crude Oil
Relevant • Independent • Objective
CERI Commodity Report – Crude Oil Editorial Committee: Paul Kralovic, Dinara Millington, Megan Murphy, Jon Rozhon, Allan Fogwill About CERI The Canadian Energy Research Institute is an independent, not-for-profit research establishment created through a partnership of industry, academia, and government in 1975. Our mission is to provide relevant, independent, objective economic research in energy and related environmental issues. For more information about CERI, please visit our website at www.ceri.ca or contact us at [email protected].
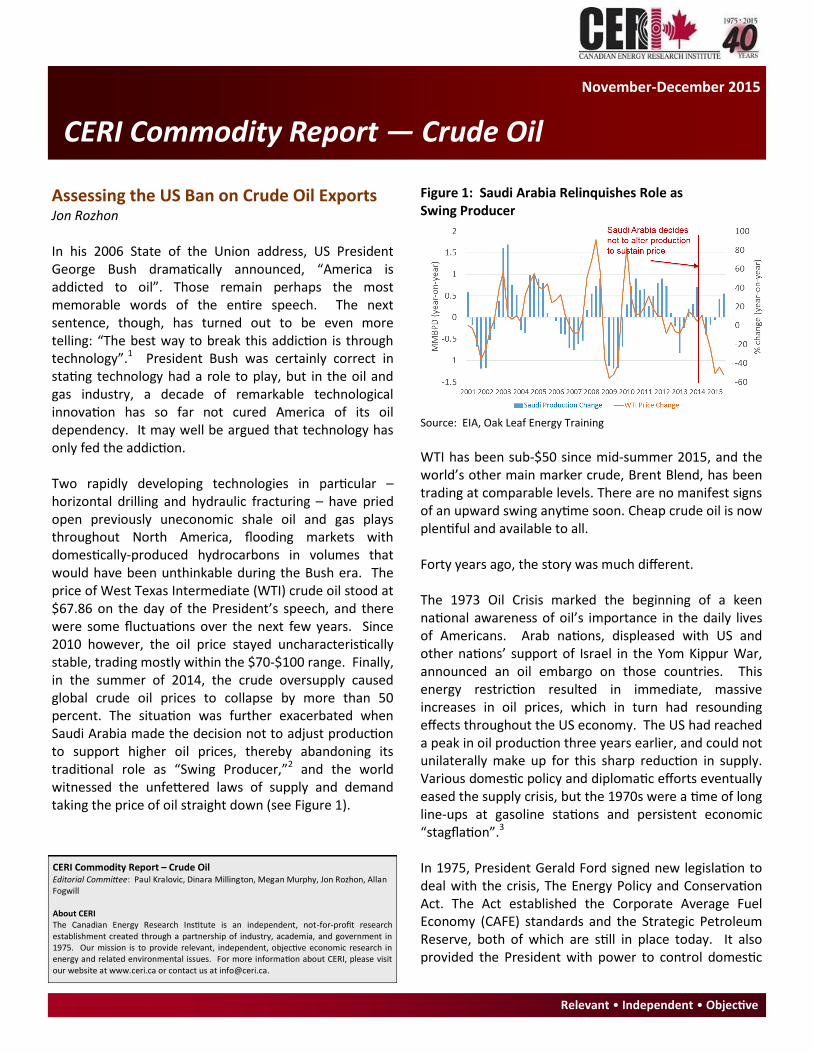
Figure 1: Saudi Arabia Relinquishes Role as Swing Producer
Source: EIA, Oak Leaf Energy Training
WTI has been sub-$50 since mid-summer 2015, and the world’s other main marker crude, Brent Blend, has been trading at comparable levels. There are no manifest signs of an upward swing anytime soon. Cheap crude oil is now plentiful and available to all. Forty years ago, the story was much different. The 1973 Oil Crisis marked the beginning of a keen national awareness of oil’s importance in the daily lives of Americans. Arab nations, displeased with US and other nations’ support of Israel in the Yom Kippur War, announced an oil embargo on those countries. This energy restriction resulted in immediate, massive increases in oil prices, which in turn had resounding effects throughout the US economy. The US had reached a peak in oil production three years earlier, and could not unilaterally make up for this sharp reduction in supply. Various domestic policy and diplomatic efforts eventually eased the supply crisis, but the 1970s were a time of long line-ups at gasoline stations and persistent economic “stagflation”.3 In 1975, President Gerald Ford signed new legislation to deal with the crisis, The Energy Policy and Conservation Act. The Act established the Corporate Average Fuel Economy (CAFE) standards and the Strategic Petroleum Reserve, both of which are still in place today. It also provided the President with power to control domestic
Assessing the US Ban on Crude Oil Exports Jon Rozhon In his 2006 State of the Union address, US President George Bush dramatically announced, “America is addicted to oil”. Those remain perhaps the most memorable words of the entire speech. The next sentence, though, has turned out to be even more telling: “The best way to break this addiction is through technology”.1 President Bush was certainly correct in stating technology had a role to play, but in the oil and gas industry, a decade of remarkable technological innovation has so far not cured America of its oil dependency. It may well be argued that technology has only fed the addiction. Two rapidly developing technologies in particular – horizontal drilling and hydraulic fracturing – have pried open previously uneconomic shale oil and gas plays throughout North America, flooding markets with domestically-produced hydrocarbons in volumes that would have been unthinkable during the Bush era. The price of West Texas Intermediate (WTI) crude oil stood at $67.86 on the day of the President’s speech, and there were some fluctuations over the next few years. Since 2010 however, the oil price stayed uncharacteristically stable, trading mostly within the $70-$100 range. Finally, in the summer of 2014, the crude oversupply caused global crude oil prices to collapse by more than 50 percent. The situation was further exacerbated when Saudi Arabia made the decision not to adjust production to support higher oil prices, thereby abandoning its traditional role as “Swing Producer,”2 and the world witnessed the unfettered laws of supply and demand taking the price of oil straight down (see Figure 1).
CERI Commodity Report - Crude Oil
Page 2
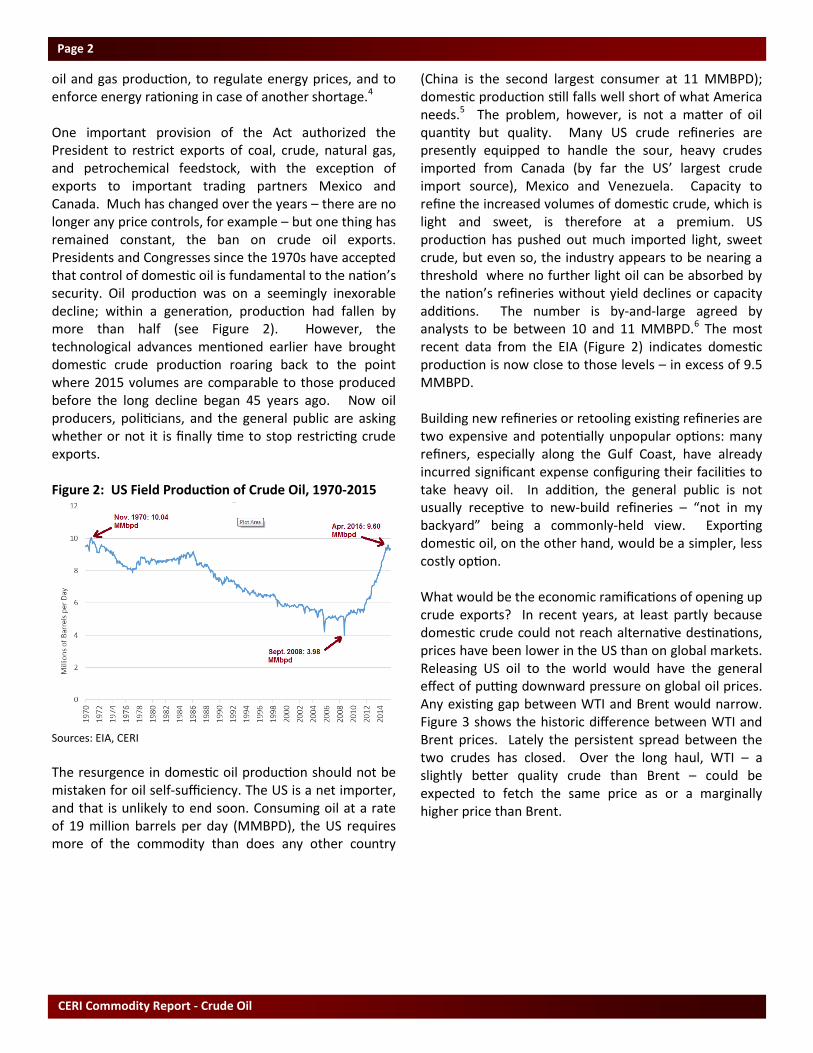
oil and gas production, to regulate energy prices, and to enforce energy rationing in case of another shortage.4 One important provision of the Act authorized the President to restrict exports of coal, crude, natural gas, and petrochemical feedstock, with the exception of exports to important trading partners Mexico and Canada. Much has changed over the years – there are no longer any price controls, for example – but one thing has remained constant, the ban on crude oil exports. Presidents and Congresses since the 1970s have accepted that control of domestic oil is fundamental to the nation’s security. Oil production was on a seemingly inexorable decline; within a generation, production had fallen by more than half (see Figure 2). However, the technological advances mentioned earlier have brought domestic crude production roaring back to the point where 2015 volumes are comparable to those produced before the long decline began 45 years ago. Now oil producers, politicians, and the general public are asking whether or not it is finally time to stop restricting crude exports. Figure 2: US Field Production of Crude Oil, 1970-2015
Sources: EIA, CERI
The resurgence in domestic oil production should not be mistaken for oil self-sufficiency. The US is a net importer, and that is unlikely to end soon. Consuming oil at a rate of 19 million barrels per day (MMBPD), the US requires more of the commodity than does any other country
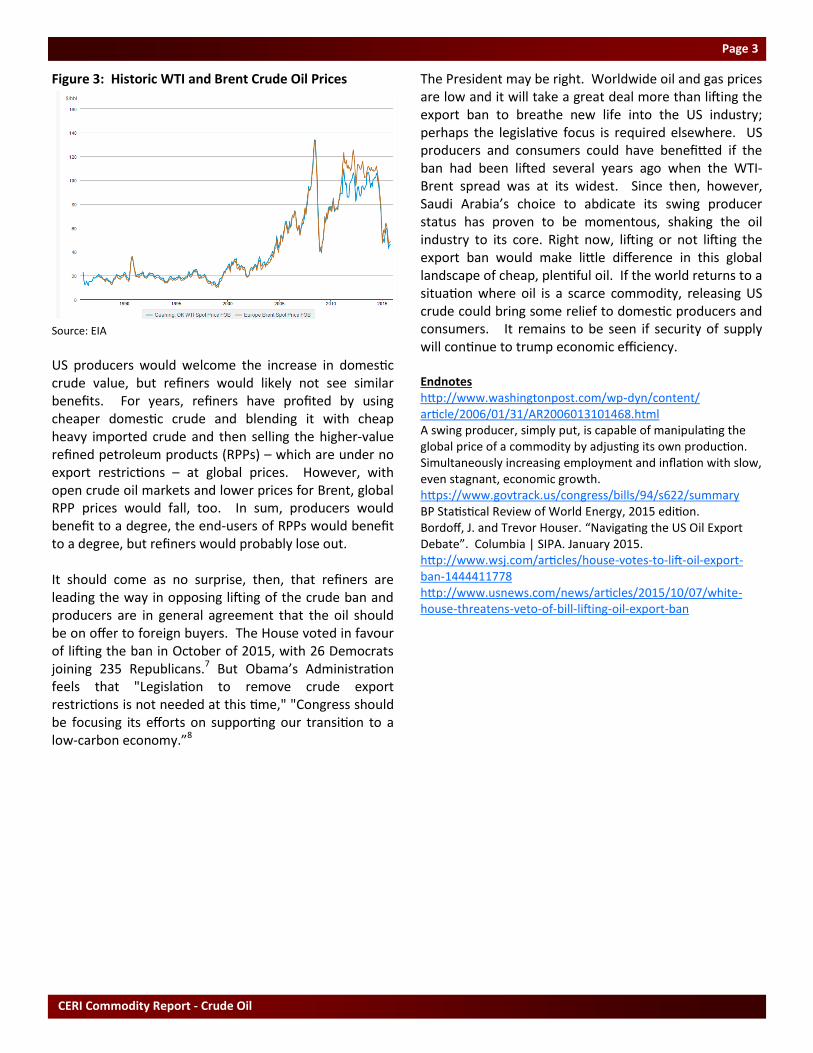
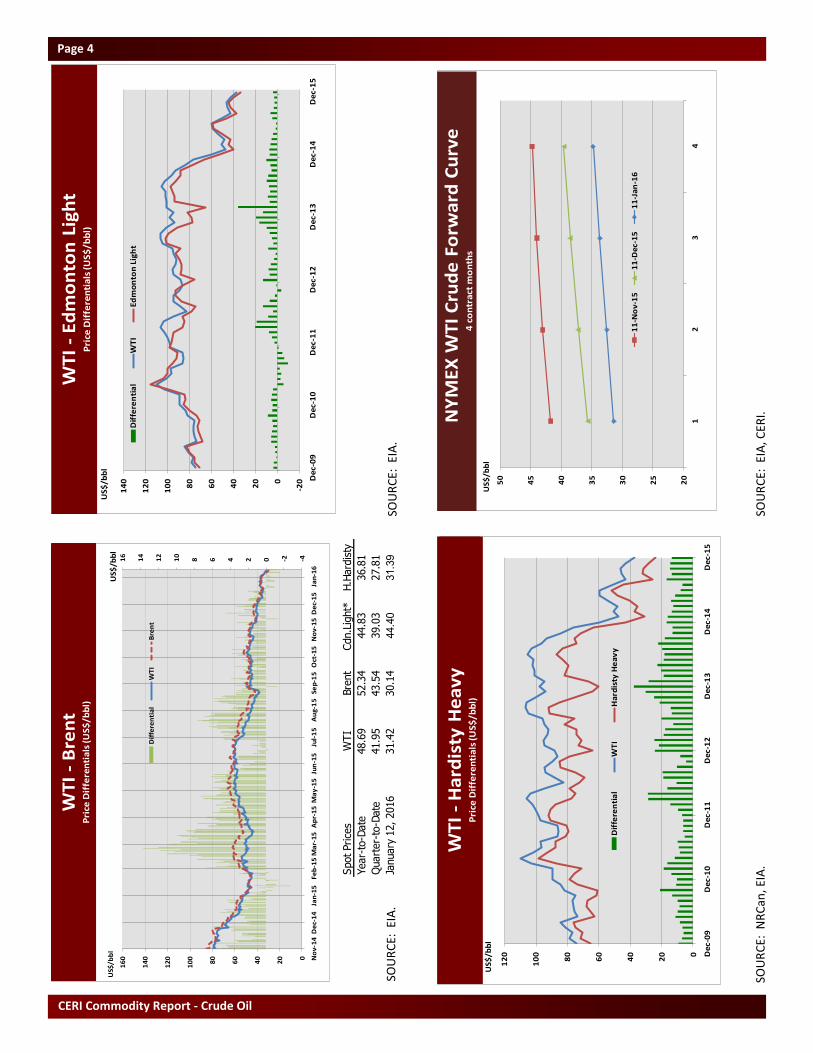
(China is the second largest consumer at 11 MMBPD); domestic production still falls well short of what America needs.5 The problem, however, is not a matter of oil quantity but quality. Many US crude refineries are presently equipped to handle the sour, heavy crudes imported from Canada (by far the US’ largest crude import source), Mexico and Venezuela. Capacity to refine the increased volumes of domestic crude, which is light and sweet, is therefore at a premium. US production has pushed out much imported light, sweet crude, but even so, the industry appears to be nearing a threshold where no further light oil can be absorbed by the nation’s refineries without yield declines or capacity additions. The number is by-and-large agreed by analysts to be between 10 and 11 MMBPD.6 The most recent data from the EIA (Figure 2) indicates domestic production is now close to those levels – in excess of 9.5 MMBPD. Building new refineries or retooling existing refineries are two expensive and potentially unpopular options: many refiners, especially along the Gulf Coast, have already incurred significant expense configuring their facilities to take heavy oil. In addition, the general public is not usually receptive to new-build refineries – “not in my backyard” being a commonly-held view. Exporting domestic oil, on the other hand, would be a simpler, less costly option. What would be the economic ramifications of opening up crude exports? In recent years, at least partly because domestic crude could not reach alternative destinations, prices have been lower in the US than on global markets. Releasing US oil to the world would have the general effect of putting downward pressure on global oil prices. Any existing gap between WTI and Brent would narrow. Figure 3 shows the historic difference between WTI and Brent prices. Lately the persistent spread between the two crudes has closed. Over the long haul, WTI – a slightly better quality crude than Brent – could be expected to fetch the same price as or a marginally higher price than Brent.
CERI Commodity Report - Crude Oil
Page 3
Figure 3: Historic WTI and Brent Crude Oil Prices
Source: EIA
US producers would welcome the increase in domestic crude value, but refiners would likely not see similar benefits. For years, refiners have profited by using cheaper domestic crude and blending it with cheap heavy imported crude and then selling the higher-value refined petroleum products (RPPs) – which are under no export restrictions – at global prices. However, with open crude oil markets and lower prices for Brent, global RPP prices would fall, too. In sum, producers would benefit to a degree, the end-users of RPPs would benefit to a degree, but refiners would probably lose out. It should come as no surprise, then, that refiners are leading the way in opposing lifting of the crude ban and producers are in general agreement that the oil should be on offer to foreign buyers. The House voted in favour of lifting the ban in October of 2015, with 26 Democrats joining 235 Republicans.7 But Obama’s Administration feels that "Legislation to remove crude export restrictions is not needed at this time," "Congress should be focusing its efforts on supporting our transition to a low-carbon economy.”8
The President may be right. Worldwide oil and gas prices are low and it will take a great deal more than lifting the export ban to breathe new life into the US industry; perhaps the legislative focus is required elsewhere. US producers and consumers could have benefitted if the ban had been lifted several years ago when the WTI-Brent spread was at its widest. Since then, however, Saudi Arabia’s choice to abdicate its swing producer status has proven to be momentous, shaking the oil industry to its core. Right now, lifting or not lifting the export ban would make little difference in this global landscape of cheap, plentiful oil. If the world returns to a situation where oil is a scarce commodity, releasing US crude could bring some relief to domestic producers and consumers. It remains to be seen if security of supply will continue to trump economic efficiency. Endnotes http://www.washingtonpost.com/wp-dyn/content/article/2006/01/31/AR2006013101468.html A swing producer, simply put, is capable of manipulating the global price of a commodity by adjusting its own production. Simultaneously increasing employment and inflation with slow, even stagnant, economic growth. https://www.govtrack.us/congress/bills/94/s622/summary BP Statistical Review of World Energy, 2015 edition. Bordoff, J. and Trevor Houser. “Navigating the US Oil Export Debate”. Columbia | SIPA. January 2015. http://www.wsj.com/articles/house-votes-to-lift-oil-export-ban-1444411778 http://www.usnews.com/news/articles/2015/10/07/white-house-threatens-veto-of-bill-lifting-oil-export-ban
CERI Commodity Report - Crude Oil
Page 4
SOU
RC
E: E
IA.
SOU
RC
E: E
IA.
SOU
RC
E: N
RC
an, E
IA.
SOU
RC
E: E
IA, C
ERI.
-4-20246810
12
14
16
0
20
40
60
80
10
0
12
0
14
0
16
0 No
v-1
4D
ec-
14
Jan
-15
Feb
-15
Ma
r-1
5A
pr-
15
Ma
y-1
5Ju
n-1
5Ju
l-1
5A
ug-
15
Sep
-15
Oct
-15
No
v-1
5D
ec-
15
Jan
-16
US$
/bb
l
Dif
fere
nti
al
WT
IB
ren
t
Sp
ot
Cru
de
Pri
ces
Sp
ot
Cru
de
Pri
ces
Sp
ot
Cru
de
Pri
ces
Sp
ot
Cru
de
Pri
ces
US
$/b
bl
WT
I -
Ed
mo
nto
n L
igh
tP
rice
Dif
fere
nti
als
WT
I -
Ed
mo
nto
n L
igh
tP
rice
Dif
fere
nti
als
WT
I -
Bre
nt
Pri
ce D
iffe
ren
tia
ls (U
S$
/bb
l)
Spot Price
sW
TI
Bre
nt
Cdn.L
ight*
H.H
ard
isty
Year-
to-D
ate
48.6
952.3
444.8
336.8
1
Quart
er-
to-D
ate
41.9
543.5
439.0
327.8
1
January
12, 2016
31.4
230.1
444.40
31.39
-200
20
40
60
80
10
0
12
0
14
0 De
c-0
9D
ec-
10
De
c-1
1D
ec-
12
De
c-1
3D
ec-
14
De
c-1
5
US
$/b
bl
Dif
fere
nti
al
WT
IE
dm
on
ton
Lig
ht
WT
I -
Ed
mo
nto
n L
igh
tP
rice
Dif
fere
nti
als
(US
$/b
bl)
0
20
40
60
80
10
0
12
0 De
c-0
9D
ec-
10
De
c-1
1D
ec-
12
De
c-1
3D
ec-
14
De
c-1
5
US
$/b
bl
Dif
fere
nti
al
WT
IH
ard
isty
He
av
y
WW
TI
-H
ard
isty
He
av
yP
rice
Dif
fere
nti
als
WT
I -
Ha
rdis
ty H
ea
vy
Pri
ce D
iffe
ren
tia
ls (U
S$
/bb
l)
20
25
30
35
40
45
50
12
34
US
$/b
bl
11
-No
v-1
51
1-D
ec-
15
11
-Ja
n-1
6
NN
YM
EX
WT
I C
rud
e F
orw
ard
Cu
rve
4
co
ntr
act
mo
nth
s
Relevant • Independent • Objective
Page 5
SOU
RC
E: E
IA, C
ERI.
SO
UR
CE:
NR
Can
.
SOU
RC
E: I
EA O
il M
arke
t R
epo
rt.
SOU
RC
E: E
IA W
eekl
y P
etro
leu
m S
tatu
s R
epo
rt.
0.5
0
0.7
5
1.0
0
1.2
5
1.5
0
1.7
5
2.0
0
2.2
5
2.5
0 De
c-1
4Ja
n-1
5Fe
b-1
5M
ar-
15
Ap
r-1
5M
ay
-15
Jun
-15
Jul-
15
Au
g-1
5Se
p-1
5O
ct-1
5N
ov-
15
De
c-1
5Ja
n-1
6
US
$/g
al
RB
OB
Ga
soli
ne
He
ati
ng
Oil
NY
ME
X P
etr
ole
um
Pro
du
cts
NYM
EX P
rice
sUnle
aded G
aso
line
Heating O
il
Year-
to-D
ate
1.6
339
1.6
615
Quart
er-
to-D
ate
1.3
106
1.3
637
January
12, 2016
1.1
130
1.0
150
0.6
0
0.7
0
0.8
0
0.9
0
1.0
0
1.1
0
1.2
0
1.3
0
1.4
0
1.5
0 De
c-0
9D
ec-
10
De
c-1
1D
ec-
12
De
c-1
3D
ec-
14
De
c-1
5
CD
N/U
S$
CD
N/U
S$
Exc
ha
ng
e R
ate
49
.0%
49
.5%
50
.0%
50
.5%
51
.0%
51
.5%
52
.0%
52
.5%
0
10
20
30
40
50
60
70
80
90
10
0
11
0
2Q
14
3Q
14
4Q
14
1Q
15
2Q
15
3Q
15
4Q
15
1Q
16
2Q
16
MM
bp
d
To
tal
OE
CD
To
tal
No
n-O
EC
Dn
on
-OE
CD
De
ma
nd
sh
are
Oil
Dem
an
d in
Se
lec
ted
Co
un
trie
sG
lob
al
Oil
De
ma
nd
-10
%
-8%
-6%
-4%
-2%
0%
2%
4%
6%
To
tal
Ga
soli
ne
Jet
Fu
el
Dis
till
ate
Re
sid
ua
lP
rop
an
eO
the
r
%
UU
S P
rod
uct
s D
em
an
dD
ece
mb
er
20
14
-D
ece
mb
er
20
15
Y-o
n-Y
ch
an
ge
CERI Commodity Report - Crude Oil
Page 6
SOU
RC
E: I
EA O
il M
arke
t R
epo
rt, C
ERI.
SO
UR
CE:
IEA
Oil
Mar
ket
Rep
ort
.
SOU
RC
E: I
EA O
il M
arke
t R
epo
rt.
SOU
RC
E: I
EA O
il M
arke
t R
epo
rt.
57
.0%
57
.5%
58
.0%
58
.5%
59
.0%
59
.5%
60
.0%
60
.5%
61
.0%
61
.5%
0
20
40
60
80
10
0
12
0
2Q
14
3Q
14
4Q
14
1Q
15
2Q
15
3Q
15
4Q
15
1Q
16
2Q
16
MM
bp
d
no
n-O
PE
C S
up
ply
OP
EC
Su
pp
lyn
on
-OP
EC
Sh
are
of
Glo
ba
l S
up
ply
SG
lob
al
Oil
Su
pp
ly
0
2,0
00
4,0
00
6,0
00
8,0
00
10
,00
0
12
,00
0
14
,00
0
2Q
15
3Q
15
4Q
15
1Q
16
2Q
16
Mb
pd
Ala
ska
Ca
lifo
rnia
Te
xa
sF
ed
era
l G
OM
Oth
er
Low
er
48
NG
LsO
the
r
US
Oil
Pro
du
ctio
nb
y r
eg
ion
0
50
0
1,0
00
1,5
00
2,0
00
2,5
00
3,0
00
3,5
00
4,0
00
4,5
00
5,0
00
2Q
15
3Q
15
4Q
15
1Q
16
2Q
16
Mb
pd
AB
L/M
/HA
B B
itu
me
nS
KO
the
rN
GLs
Sy
nth
eti
c
Ca
na
dia
n O
il P
rod
uct
ion
by
pro
du
ct
0
50
0
1,0
00
1,5
00
2,0
00
2,5
00
3,0
00
3,5
00
No
v-1
2N
ov
-13
No
v-1
4N
ov
-15
Mb
pd
OE
CD
No
rth
Am
eri
caO
EC
D E
uro
pe
OE
CD
Pa
cifi
c
OE
CD
Co
mm
erc
ial
Sto
cks
by
re
gio
n
Relevant • Independent • Objective
Page 7
SOU
RC
E: E
IA W
eekl
y P
etro
leu
m S
tatu
s R
epo
rt.
SOU
RC
E: I
EA O
il M
arke
t R
epo
rt.
-6.0
-4.0
-2.0
0.0
2.0
4.0
6.0
8.0
10
.0
Cru
de
Ga
soli
ne
Dis
till
ate
Pro
du
cts
To
tal
MM
b
US
Co
mm
erc
ial
Sto
cks
No
ve
mb
er
27
-D
ece
mb
er
25
, 20
15
M-o
n-M
Ch
an
ge
16
5
16
7.5
17
0
17
2.5
17
5
17
7.5
18
0
18
2.5
18
5
18
7.5
19
0
19
2.5
19
5
3Q
14
4Q
14
1Q
15
2Q
15
3Q
15
MM
b
Ca
na
dia
n S
tock
s o
n L
an
d
CERI Commodity Report - Crude Oil
Page 8
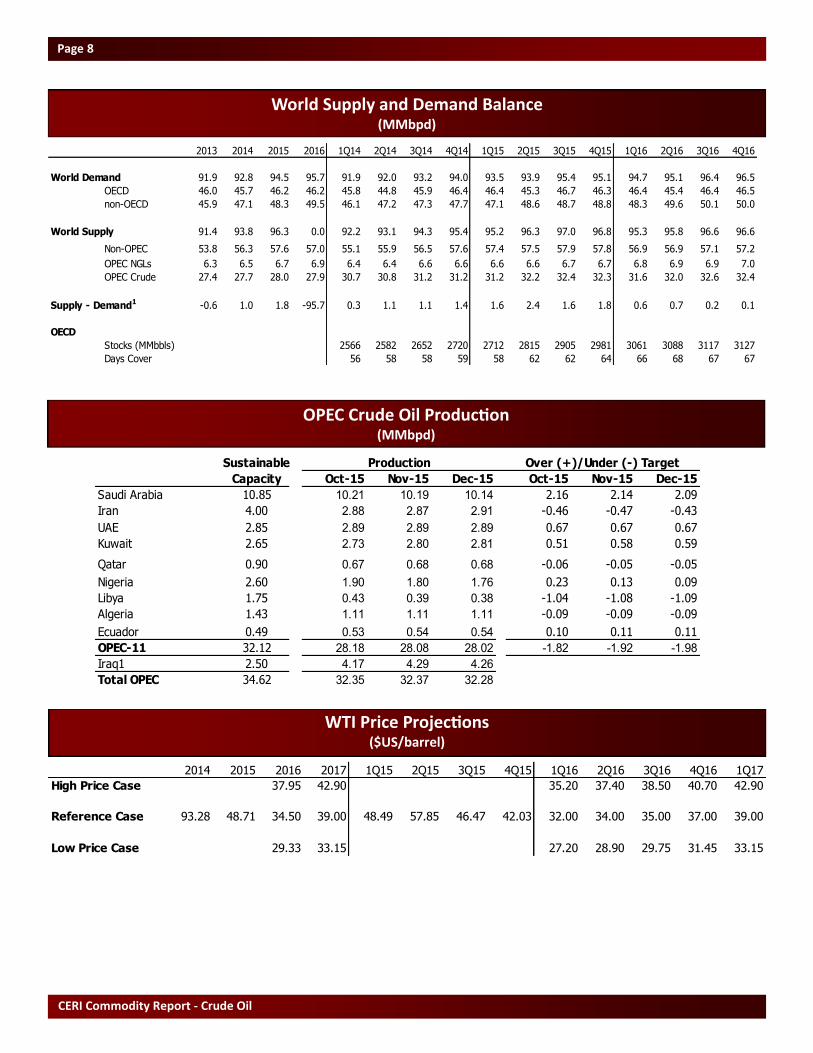
World Supply and Demand Balance (MMbpd)
OPEC Crude Oil Production (MMbpd)
WTI Price Projections ($US/barrel)
2013 2014 2015 2016 1Q14 2Q14 3Q14 4Q14 1Q15 2Q15 3Q15 4Q15 1Q16 2Q16 3Q16 4Q16
World Demand 91.9 92.8 94.5 95.7 91.9 92.0 93.2 94.0 93.5 93.9 95.4 95.1 94.7 95.1 96.4 96.5
OECD 46.0 45.7 46.2 46.2 45.8 44.8 45.9 46.4 46.4 45.3 46.7 46.3 46.4 45.4 46.4 46.5
non-OECD 45.9 47.1 48.3 49.5 46.1 47.2 47.3 47.7 47.1 48.6 48.7 48.8 48.3 49.6 50.1 50.0
World Supply 91.4 93.8 96.3 0.0 92.2 93.1 94.3 95.4 95.2 96.3 97.0 96.8 95.3 95.8 96.6 96.6
Non-OPEC 53.8 56.3 57.6 57.0 55.1 55.9 56.5 57.6 57.4 57.5 57.9 57.8 56.9 56.9 57.1 57.2
OPEC NGLs 6.3 6.5 6.7 6.9 6.4 6.4 6.6 6.6 6.6 6.6 6.7 6.7 6.8 6.9 6.9 7.0
OPEC Crude 27.4 27.7 28.0 27.9 30.7 30.8 31.2 31.2 31.2 32.2 32.4 32.3 31.6 32.0 32.6 32.4
Supply - Demand1 -0.6 1.0 1.8 -95.7 0.3 1.1 1.1 1.4 1.6 2.4 1.6 1.8 0.6 0.7 0.2 0.1
OECD
Stocks (MMbbls) 2566 2582 2652 2720 2712 2815 2905 2981 3061 3088 3117 3127
Days Cover 56 58 58 59 58 62 62 64 66 68 67 67
Sustainable
Capacity Oct-15 Nov-15 Dec-15 Oct-15 Nov-15 Dec-15
Saudi Arabia 10.85 10.21 10.19 10.14 2.16 2.14 2.09
Iran 4.00 2.88 2.87 2.91 -0.46 -0.47 -0.43
UAE 2.85 2.89 2.89 2.89 0.67 0.67 0.67
Kuwait 2.65 2.73 2.80 2.81 0.51 0.58 0.59
Qatar 0.90 0.67 0.68 0.68 -0.06 -0.05 -0.05
Nigeria 2.60 1.90 1.80 1.76 0.23 0.13 0.09
Libya 1.75 0.43 0.39 0.38 -1.04 -1.08 -1.09
Algeria 1.43 1.11 1.11 1.11 -0.09 -0.09 -0.09
Ecuador 0.49 0.53 0.54 0.54 0.10 0.11 0.11
OPEC-11 32.12 28.18 28.08 28.02 -1.82 -1.92 -1.98
Iraq1 2.50 4.17 4.29 4.26
Total OPEC 34.62 32.35 32.37 32.28
Production Over (+)/Under (-) Target
2014 2015 2016 2017 1Q15 2Q15 3Q15 4Q15 1Q16 2Q16 3Q16 4Q16 1Q17
High Price Case 37.95 42.90 35.20 37.40 38.50 40.70 42.90
Reference Case 93.28 48.71 34.50 39.00 48.49 57.85 46.47 42.03 32.00 34.00 35.00 37.00 39.00
Low Price Case 29.33 33.15 27.20 28.90 29.75 31.45 33.15

Relevant • Independent • Objective
Page 9
Data Appendix
CERI Commodity Report - Crude Oil
Page 10
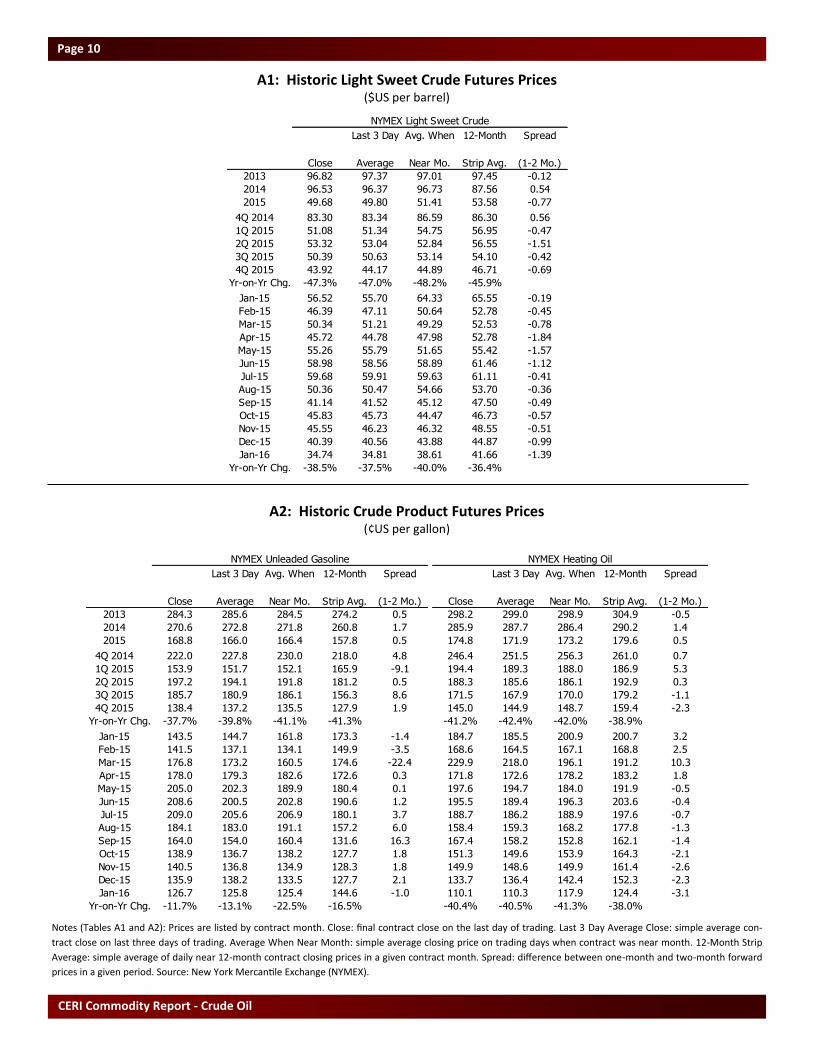
A1: Historic Light Sweet Crude Futures Prices ($US per barrel)
A2: Historic Crude Product Futures Prices (¢US per gallon)
Notes (Tables A1 and A2): Prices are listed by contract month. Close: final contract close on the last day of trading. Last 3 Day Average Close: simple average con-
tract close on last three days of trading. Average When Near Month: simple average closing price on trading days when contract was near month. 12-Month Strip
Average: simple average of daily near 12-month contract closing prices in a given contract month. Spread: difference between one-month and two-month forward
prices in a given period. Source: New York Mercantile Exchange (NYMEX).
NYMEX Light Sweet Crude
Last 3 Day Avg. When 12-Month Spread
Close Average Near Mo. Strip Avg. (1-2 Mo.)
2013 96.82 97.37 97.01 97.45 -0.12
2014 96.53 96.37 96.73 87.56 0.54
2015 49.68 49.80 51.41 53.58 -0.77
4Q 2014 83.30 83.34 86.59 86.30 0.56
1Q 2015 51.08 51.34 54.75 56.95 -0.47
2Q 2015 53.32 53.04 52.84 56.55 -1.51
3Q 2015 50.39 50.63 53.14 54.10 -0.42
4Q 2015 43.92 44.17 44.89 46.71 -0.69
Yr-on-Yr Chg. -47.3% -47.0% -48.2% -45.9%
Jan-15 56.52 55.70 64.33 65.55 -0.19
Feb-15 46.39 47.11 50.64 52.78 -0.45
Mar-15 50.34 51.21 49.29 52.53 -0.78
Apr-15 45.72 44.78 47.98 52.78 -1.84
May-15 55.26 55.79 51.65 55.42 -1.57
Jun-15 58.98 58.56 58.89 61.46 -1.12
Jul-15 59.68 59.91 59.63 61.11 -0.41
Aug-15 50.36 50.47 54.66 53.70 -0.36
Sep-15 41.14 41.52 45.12 47.50 -0.49
Oct-15 45.83 45.73 44.47 46.73 -0.57
Nov-15 45.55 46.23 46.32 48.55 -0.51
Dec-15 40.39 40.56 43.88 44.87 -0.99
Jan-16 34.74 34.81 38.61 41.66 -1.39
Yr-on-Yr Chg. -38.5% -37.5% -40.0% -36.4%
NYMEX Unleaded Gasoline NYMEX Heating Oil
Last 3 Day Avg. When 12-Month Spread Last 3 Day Avg. When 12-Month Spread
Close Average Near Mo. Strip Avg. (1-2 Mo.) Close Average Near Mo. Strip Avg. (1-2 Mo.)
2013 284.3 285.6 284.5 274.2 0.5 298.2 299.0 298.9 304.9 -0.5
2014 270.6 272.8 271.8 260.8 1.7 285.9 287.7 286.4 290.2 1.4
2015 168.8 166.0 166.4 157.8 0.5 174.8 171.9 173.2 179.6 0.5
4Q 2014 222.0 227.8 230.0 218.0 4.8 246.4 251.5 256.3 261.0 0.7
1Q 2015 153.9 151.7 152.1 165.9 -9.1 194.4 189.3 188.0 186.9 5.3
2Q 2015 197.2 194.1 191.8 181.2 0.5 188.3 185.6 186.1 192.9 0.3
3Q 2015 185.7 180.9 186.1 156.3 8.6 171.5 167.9 170.0 179.2 -1.1
4Q 2015 138.4 137.2 135.5 127.9 1.9 145.0 144.9 148.7 159.4 -2.3
Yr-on-Yr Chg. -37.7% -39.8% -41.1% -41.3% -41.2% -42.4% -42.0% -38.9%
Jan-15 143.5 144.7 161.8 173.3 -1.4 184.7 185.5 200.9 200.7 3.2
Feb-15 141.5 137.1 134.1 149.9 -3.5 168.6 164.5 167.1 168.8 2.5
Mar-15 176.8 173.2 160.5 174.6 -22.4 229.9 218.0 196.1 191.2 10.3
Apr-15 178.0 179.3 182.6 172.6 0.3 171.8 172.6 178.2 183.2 1.8
May-15 205.0 202.3 189.9 180.4 0.1 197.6 194.7 184.0 191.9 -0.5
Jun-15 208.6 200.5 202.8 190.6 1.2 195.5 189.4 196.3 203.6 -0.4
Jul-15 209.0 205.6 206.9 180.1 3.7 188.7 186.2 188.9 197.6 -0.7
Aug-15 184.1 183.0 191.1 157.2 6.0 158.4 159.3 168.2 177.8 -1.3
Sep-15 164.0 154.0 160.4 131.6 16.3 167.4 158.2 152.8 162.1 -1.4
Oct-15 138.9 136.7 138.2 127.7 1.8 151.3 149.6 153.9 164.3 -2.1
Nov-15 140.5 136.8 134.9 128.3 1.8 149.9 148.6 149.9 161.4 -2.6
Dec-15 135.9 138.2 133.5 127.7 2.1 133.7 136.4 142.4 152.3 -2.3
Jan-16 126.7 125.8 125.4 144.6 -1.0 110.1 110.3 117.9 124.4 -3.1
Yr-on-Yr Chg. -11.7% -13.1% -22.5% -16.5% -40.4% -40.5% -41.3% -38.0%
Relevant • Independent • Objective
Page 11
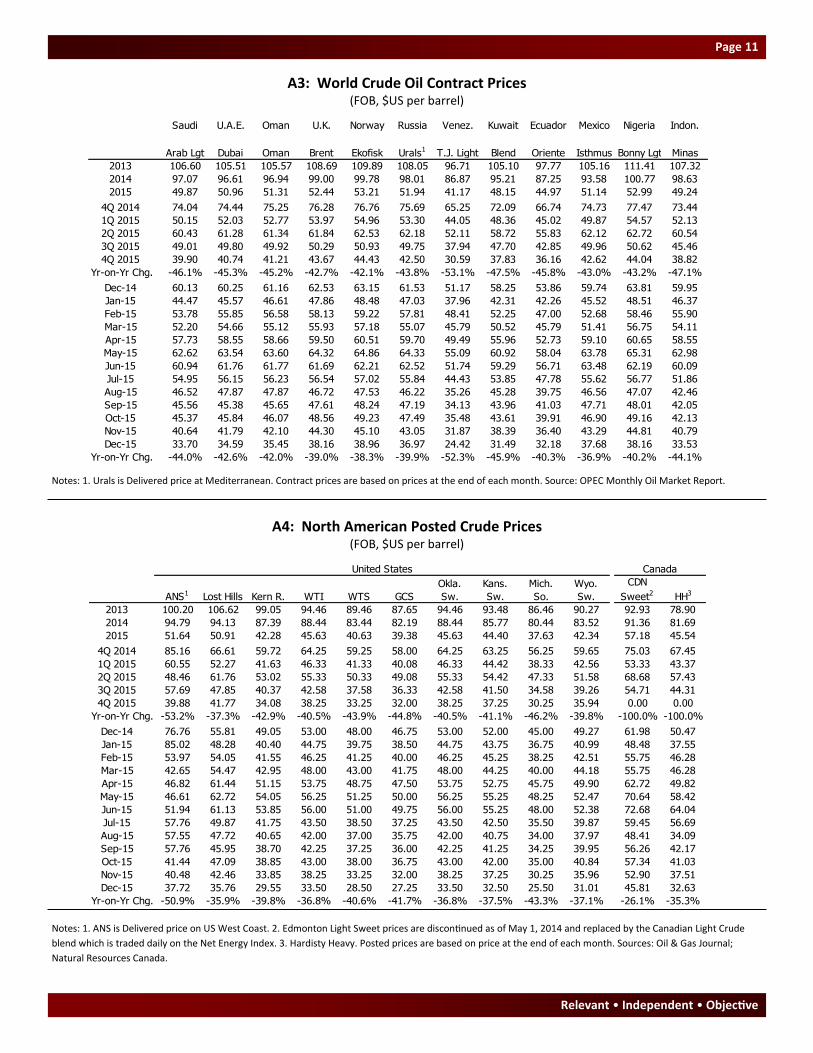
A3: World Crude Oil Contract Prices (FOB, $US per barrel)
A4: North American Posted Crude Prices (FOB, $US per barrel)
Notes: 1. ANS is Delivered price on US West Coast. 2. Edmonton Light Sweet prices are discontinued as of May 1, 2014 and replaced by the Canadian Light Crude
blend which is traded daily on the Net Energy Index. 3. Hardisty Heavy. Posted prices are based on price at the end of each month. Sources: Oil & Gas Journal;
Natural Resources Canada.
Notes: 1. Urals is Delivered price at Mediterranean. Contract prices are based on prices at the end of each month. Source: OPEC Monthly Oil Market Report.
Saudi U.A.E. Oman U.K. Norway Russia Venez. Kuwait Ecuador Mexico Nigeria Indon.
Arab Lgt Dubai Oman Brent Ekofisk Urals1 T.J. Light Blend Oriente Isthmus Bonny Lgt Minas
2013 106.60 105.51 105.57 108.69 109.89 108.05 96.71 105.10 97.77 105.16 111.41 107.32
2014 97.07 96.61 96.94 99.00 99.78 98.01 86.87 95.21 87.25 93.58 100.77 98.63
2015 49.87 50.96 51.31 52.44 53.21 51.94 41.17 48.15 44.97 51.14 52.99 49.24
4Q 2014 74.04 74.44 75.25 76.28 76.76 75.69 65.25 72.09 66.74 74.73 77.47 73.44
1Q 2015 50.15 52.03 52.77 53.97 54.96 53.30 44.05 48.36 45.02 49.87 54.57 52.13
2Q 2015 60.43 61.28 61.34 61.84 62.53 62.18 52.11 58.72 55.83 62.12 62.72 60.54
3Q 2015 49.01 49.80 49.92 50.29 50.93 49.75 37.94 47.70 42.85 49.96 50.62 45.46
4Q 2015 39.90 40.74 41.21 43.67 44.43 42.50 30.59 37.83 36.16 42.62 44.04 38.82
Yr-on-Yr Chg. -46.1% -45.3% -45.2% -42.7% -42.1% -43.8% -53.1% -47.5% -45.8% -43.0% -43.2% -47.1%
Dec-14 60.13 60.25 61.16 62.53 63.15 61.53 51.17 58.25 53.86 59.74 63.81 59.95
Jan-15 44.47 45.57 46.61 47.86 48.48 47.03 37.96 42.31 42.26 45.52 48.51 46.37
Feb-15 53.78 55.85 56.58 58.13 59.22 57.81 48.41 52.25 47.00 52.68 58.46 55.90
Mar-15 52.20 54.66 55.12 55.93 57.18 55.07 45.79 50.52 45.79 51.41 56.75 54.11
Apr-15 57.73 58.55 58.66 59.50 60.51 59.70 49.49 55.96 52.73 59.10 60.65 58.55
May-15 62.62 63.54 63.60 64.32 64.86 64.33 55.09 60.92 58.04 63.78 65.31 62.98
Jun-15 60.94 61.76 61.77 61.69 62.21 62.52 51.74 59.29 56.71 63.48 62.19 60.09
Jul-15 54.95 56.15 56.23 56.54 57.02 55.84 44.43 53.85 47.78 55.62 56.77 51.86
Aug-15 46.52 47.87 47.87 46.72 47.53 46.22 35.26 45.28 39.75 46.56 47.07 42.46
Sep-15 45.56 45.38 45.65 47.61 48.24 47.19 34.13 43.96 41.03 47.71 48.01 42.05
Oct-15 45.37 45.84 46.07 48.56 49.23 47.49 35.48 43.61 39.91 46.90 49.16 42.13
Nov-15 40.64 41.79 42.10 44.30 45.10 43.05 31.87 38.39 36.40 43.29 44.81 40.79
Dec-15 33.70 34.59 35.45 38.16 38.96 36.97 24.42 31.49 32.18 37.68 38.16 33.53
Yr-on-Yr Chg. -44.0% -42.6% -42.0% -39.0% -38.3% -39.9% -52.3% -45.9% -40.3% -36.9% -40.2% -44.1%
United States Canada Light vs. Heavy
ANS1 Lost Hills Kern R. WTI WTS GCS
Okla.
Sw.
Kans.
Sw.
Mich.
So.
Wyo.
Sw.
CDN
Sweet2 HH3
2013 100.20 106.62 99.05 94.46 89.46 87.65 94.46 93.48 86.46 90.27 92.93 78.90
2014 94.79 94.13 87.39 88.44 83.44 82.19 88.44 85.77 80.44 83.52 91.36 81.69
2015 51.64 50.91 42.28 45.63 40.63 39.38 45.63 44.40 37.63 42.34 57.18 45.54
4Q 2014 85.16 66.61 59.72 64.25 59.25 58.00 64.25 63.25 56.25 59.65 75.03 67.45
1Q 2015 60.55 52.27 41.63 46.33 41.33 40.08 46.33 44.42 38.33 42.56 53.33 43.37
2Q 2015 48.46 61.76 53.02 55.33 50.33 49.08 55.33 54.42 47.33 51.58 68.68 57.43
3Q 2015 57.69 47.85 40.37 42.58 37.58 36.33 42.58 41.50 34.58 39.26 54.71 44.31
4Q 2015 39.88 41.77 34.08 38.25 33.25 32.00 38.25 37.25 30.25 35.94 0.00 0.00
Yr-on-Yr Chg. -53.2% -37.3% -42.9% -40.5% -43.9% -44.8% -40.5% -41.1% -46.2% -39.8% -100.0% -100.0%
Dec-14 76.76 55.81 49.05 53.00 48.00 46.75 53.00 52.00 45.00 49.27 61.98 50.47
Jan-15 85.02 48.28 40.40 44.75 39.75 38.50 44.75 43.75 36.75 40.99 48.48 37.55
Feb-15 53.97 54.05 41.55 46.25 41.25 40.00 46.25 45.25 38.25 42.51 55.75 46.28
Mar-15 42.65 54.47 42.95 48.00 43.00 41.75 48.00 44.25 40.00 44.18 55.75 46.28
Apr-15 46.82 61.44 51.15 53.75 48.75 47.50 53.75 52.75 45.75 49.90 62.72 49.82
May-15 46.61 62.72 54.05 56.25 51.25 50.00 56.25 55.25 48.25 52.47 70.64 58.42
Jun-15 51.94 61.13 53.85 56.00 51.00 49.75 56.00 55.25 48.00 52.38 72.68 64.04
Jul-15 57.76 49.87 41.75 43.50 38.50 37.25 43.50 42.50 35.50 39.87 59.45 56.69
Aug-15 57.55 47.72 40.65 42.00 37.00 35.75 42.00 40.75 34.00 37.97 48.41 34.09
Sep-15 57.76 45.95 38.70 42.25 37.25 36.00 42.25 41.25 34.25 39.95 56.26 42.17
Oct-15 41.44 47.09 38.85 43.00 38.00 36.75 43.00 42.00 35.00 40.84 57.34 41.03
Nov-15 40.48 42.46 33.85 38.25 33.25 32.00 38.25 37.25 30.25 35.96 52.90 37.51
Dec-15 37.72 35.76 29.55 33.50 28.50 27.25 33.50 32.50 25.50 31.01 45.81 32.63
Yr-on-Yr Chg. -50.9% -35.9% -39.8% -36.8% -40.6% -41.7% -36.8% -37.5% -43.3% -37.1% -26.1% -35.3%
CERI Commodity Report - Crude Oil
Page 12
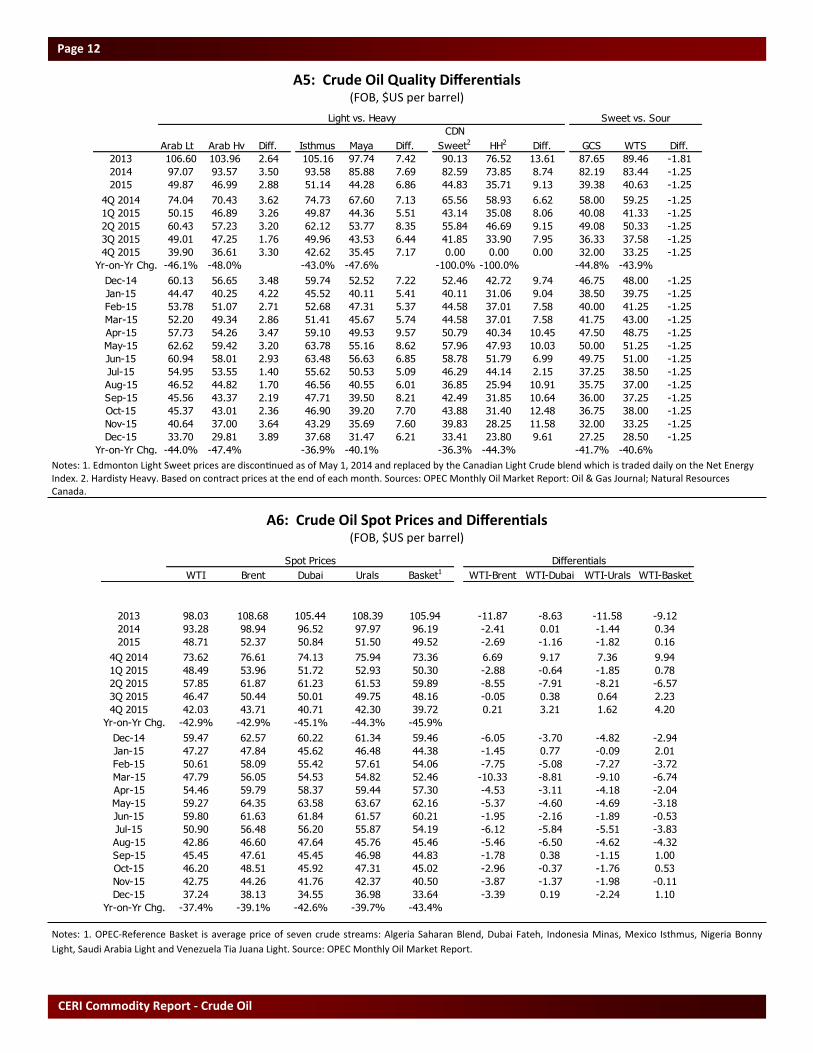
A5: Crude Oil Quality Differentials (FOB, $US per barrel)
A6: Crude Oil Spot Prices and Differentials (FOB, $US per barrel)
Notes: 1. OPEC-Reference Basket is average price of seven crude streams: Algeria Saharan Blend, Dubai Fateh, Indonesia Minas, Mexico Isthmus, Nigeria Bonny
Light, Saudi Arabia Light and Venezuela Tia Juana Light. Source: OPEC Monthly Oil Market Report.
Notes: 1. Edmonton Light Sweet prices are discontinued as of May 1, 2014 and replaced by the Canadian Light Crude blend which is traded daily on the Net Energy Index. 2. Hardisty Heavy. Based on contract prices at the end of each month. Sources: OPEC Monthly Oil Market Report: Oil & Gas Journal; Natural Resources Canada.
Light vs. Heavy Sweet vs. Sour
Arab Lt Arab Hv Diff. Isthmus Maya Diff.
CDN
Sweet2 HH2 Diff. GCS WTS Diff.
2013 106.60 103.96 2.64 105.16 97.74 7.42 90.13 76.52 13.61 87.65 89.46 -1.81
2014 97.07 93.57 3.50 93.58 85.88 7.69 82.59 73.85 8.74 82.19 83.44 -1.25
2015 49.87 46.99 2.88 51.14 44.28 6.86 44.83 35.71 9.13 39.38 40.63 -1.25
4Q 2014 74.04 70.43 3.62 74.73 67.60 7.13 65.56 58.93 6.62 58.00 59.25 -1.25
1Q 2015 50.15 46.89 3.26 49.87 44.36 5.51 43.14 35.08 8.06 40.08 41.33 -1.25
2Q 2015 60.43 57.23 3.20 62.12 53.77 8.35 55.84 46.69 9.15 49.08 50.33 -1.25
3Q 2015 49.01 47.25 1.76 49.96 43.53 6.44 41.85 33.90 7.95 36.33 37.58 -1.25
4Q 2015 39.90 36.61 3.30 42.62 35.45 7.17 0.00 0.00 0.00 32.00 33.25 -1.25
Yr-on-Yr Chg. -46.1% -48.0% -43.0% -47.6% -100.0% -100.0% -44.8% -43.9%
Dec-14 60.13 56.65 3.48 59.74 52.52 7.22 52.46 42.72 9.74 46.75 48.00 -1.25
Jan-15 44.47 40.25 4.22 45.52 40.11 5.41 40.11 31.06 9.04 38.50 39.75 -1.25
Feb-15 53.78 51.07 2.71 52.68 47.31 5.37 44.58 37.01 7.58 40.00 41.25 -1.25
Mar-15 52.20 49.34 2.86 51.41 45.67 5.74 44.58 37.01 7.58 41.75 43.00 -1.25
Apr-15 57.73 54.26 3.47 59.10 49.53 9.57 50.79 40.34 10.45 47.50 48.75 -1.25
May-15 62.62 59.42 3.20 63.78 55.16 8.62 57.96 47.93 10.03 50.00 51.25 -1.25
Jun-15 60.94 58.01 2.93 63.48 56.63 6.85 58.78 51.79 6.99 49.75 51.00 -1.25
Jul-15 54.95 53.55 1.40 55.62 50.53 5.09 46.29 44.14 2.15 37.25 38.50 -1.25
Aug-15 46.52 44.82 1.70 46.56 40.55 6.01 36.85 25.94 10.91 35.75 37.00 -1.25
Sep-15 45.56 43.37 2.19 47.71 39.50 8.21 42.49 31.85 10.64 36.00 37.25 -1.25
Oct-15 45.37 43.01 2.36 46.90 39.20 7.70 43.88 31.40 12.48 36.75 38.00 -1.25
Nov-15 40.64 37.00 3.64 43.29 35.69 7.60 39.83 28.25 11.58 32.00 33.25 -1.25
Dec-15 33.70 29.81 3.89 37.68 31.47 6.21 33.41 23.80 9.61 27.25 28.50 -1.25
Yr-on-Yr Chg. -44.0% -47.4% -36.9% -40.1% -36.3% -44.3% -41.7% -40.6%
Spot Prices Differentials
WTI Brent Dubai Urals Basket1 WTI-Brent WTI-Dubai WTI-Urals WTI-Basket
2013 98.03 108.68 105.44 108.39 105.94 -11.87 -8.63 -11.58 -9.12
2014 93.28 98.94 96.52 97.97 96.19 -2.41 0.01 -1.44 0.34
2015 48.71 52.37 50.84 51.50 49.52 -2.69 -1.16 -1.82 0.16
4Q 2014 73.62 76.61 74.13 75.94 73.36 6.69 9.17 7.36 9.94
1Q 2015 48.49 53.96 51.72 52.93 50.30 -2.88 -0.64 -1.85 0.78
2Q 2015 57.85 61.87 61.23 61.53 59.89 -8.55 -7.91 -8.21 -6.57
3Q 2015 46.47 50.44 50.01 49.75 48.16 -0.05 0.38 0.64 2.23
4Q 2015 42.03 43.71 40.71 42.30 39.72 0.21 3.21 1.62 4.20
Yr-on-Yr Chg. -42.9% -42.9% -45.1% -44.3% -45.9%
Dec-14 59.47 62.57 60.22 61.34 59.46 -6.05 -3.70 -4.82 -2.94
Jan-15 47.27 47.84 45.62 46.48 44.38 -1.45 0.77 -0.09 2.01
Feb-15 50.61 58.09 55.42 57.61 54.06 -7.75 -5.08 -7.27 -3.72
Mar-15 47.79 56.05 54.53 54.82 52.46 -10.33 -8.81 -9.10 -6.74
Apr-15 54.46 59.79 58.37 59.44 57.30 -4.53 -3.11 -4.18 -2.04
May-15 59.27 64.35 63.58 63.67 62.16 -5.37 -4.60 -4.69 -3.18
Jun-15 59.80 61.63 61.84 61.57 60.21 -1.95 -2.16 -1.89 -0.53
Jul-15 50.90 56.48 56.20 55.87 54.19 -6.12 -5.84 -5.51 -3.83
Aug-15 42.86 46.60 47.64 45.76 45.46 -5.46 -6.50 -4.62 -4.32
Sep-15 45.45 47.61 45.45 46.98 44.83 -1.78 0.38 -1.15 1.00
Oct-15 46.20 48.51 45.92 47.31 45.02 -2.96 -0.37 -1.76 0.53
Nov-15 42.75 44.26 41.76 42.37 40.50 -3.87 -1.37 -1.98 -0.11
Dec-15 37.24 38.13 34.55 36.98 33.64 -3.39 0.19 -2.24 1.10
Yr-on-Yr Chg. -37.4% -39.1% -42.6% -39.7% -43.4%
Relevant • Independent • Objective
Page 13
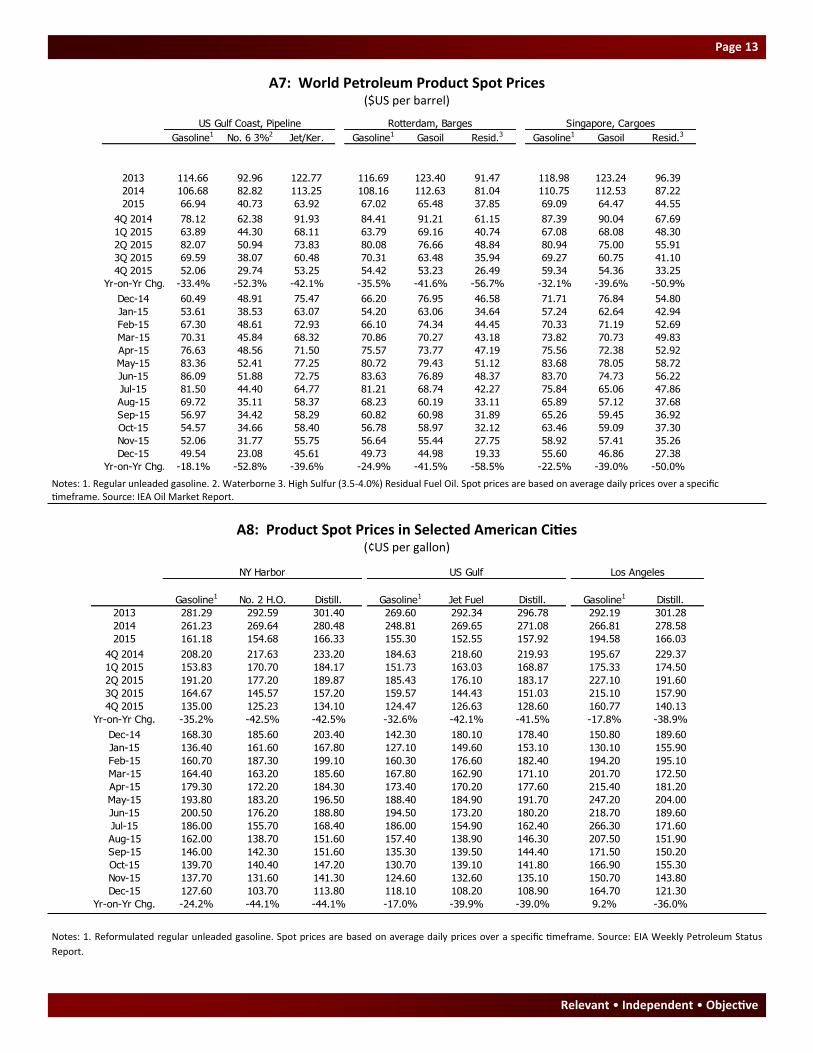
A7: World Petroleum Product Spot Prices ($US per barrel)
A8: Product Spot Prices in Selected American Cities (¢US per gallon)
Notes: 1. Reformulated regular unleaded gasoline. Spot prices are based on average daily prices over a specific timeframe. Source: EIA Weekly Petroleum Status
Report.
Notes: 1. Regular unleaded gasoline. 2. Waterborne 3. High Sulfur (3.5-4.0%) Residual Fuel Oil. Spot prices are based on average daily prices over a specific timeframe. Source: IEA Oil Market Report.
US Gulf Coast, Pipeline Rotterdam, Barges Singapore, Cargoes
Gasoline1 No. 6 3%2 Jet/Ker. Gasoline1 Gasoil Resid.3 Gasoline1 Gasoil Resid.3
2013 114.66 92.96 122.77 116.69 123.40 91.47 118.98 123.24 96.39
2014 106.68 82.82 113.25 108.16 112.63 81.04 110.75 112.53 87.22
2015 66.94 40.73 63.92 67.02 65.48 37.85 69.09 64.47 44.55
4Q 2014 78.12 62.38 91.93 84.41 91.21 61.15 87.39 90.04 67.69
1Q 2015 63.89 44.30 68.11 63.79 69.16 40.74 67.08 68.08 48.30
2Q 2015 82.07 50.94 73.83 80.08 76.66 48.84 80.94 75.00 55.91
3Q 2015 69.59 38.07 60.48 70.31 63.48 35.94 69.27 60.75 41.10
4Q 2015 52.06 29.74 53.25 54.42 53.23 26.49 59.34 54.36 33.25
Yr-on-Yr Chg. -33.4% -52.3% -42.1% -35.5% -41.6% -56.7% -32.1% -39.6% -50.9%
Dec-14 60.49 48.91 75.47 66.20 76.95 46.58 71.71 76.84 54.80
Jan-15 53.61 38.53 63.07 54.20 63.06 34.64 57.24 62.64 42.94
Feb-15 67.30 48.61 72.93 66.10 74.34 44.45 70.33 71.19 52.69
Mar-15 70.31 45.84 68.32 70.86 70.27 43.18 73.82 70.73 49.83
Apr-15 76.63 48.56 71.50 75.57 73.77 47.19 75.56 72.38 52.92
May-15 83.36 52.41 77.25 80.72 79.43 51.12 83.68 78.05 58.72
Jun-15 86.09 51.88 72.75 83.63 76.89 48.37 83.70 74.73 56.22
Jul-15 81.50 44.40 64.77 81.21 68.74 42.27 75.84 65.06 47.86
Aug-15 69.72 35.11 58.37 68.23 60.19 33.11 65.89 57.12 37.68
Sep-15 56.97 34.42 58.29 60.82 60.98 31.89 65.26 59.45 36.92
Oct-15 54.57 34.66 58.40 56.78 58.97 32.12 63.46 59.09 37.30
Nov-15 52.06 31.77 55.75 56.64 55.44 27.75 58.92 57.41 35.26
Dec-15 49.54 23.08 45.61 49.73 44.98 19.33 55.60 46.86 27.38
Yr-on-Yr Chg. -18.1% -52.8% -39.6% -24.9% -41.5% -58.5% -22.5% -39.0% -50.0%
NY Harbor US Gulf Los Angeles
Gasoline1 No. 2 H.O. Distill. Gasoline1 Jet Fuel Distill. Gasoline1 Distill.
2013 281.29 292.59 301.40 269.60 292.34 296.78 292.19 301.28
2014 261.23 269.64 280.48 248.81 269.65 271.08 266.81 278.58
2015 161.18 154.68 166.33 155.30 152.55 157.92 194.58 166.03
4Q 2014 208.20 217.63 233.20 184.63 218.60 219.93 195.67 229.37
1Q 2015 153.83 170.70 184.17 151.73 163.03 168.87 175.33 174.50
2Q 2015 191.20 177.20 189.87 185.43 176.10 183.17 227.10 191.60
3Q 2015 164.67 145.57 157.20 159.57 144.43 151.03 215.10 157.90
4Q 2015 135.00 125.23 134.10 124.47 126.63 128.60 160.77 140.13
Yr-on-Yr Chg. -35.2% -42.5% -42.5% -32.6% -42.1% -41.5% -17.8% -38.9%
Dec-14 168.30 185.60 203.40 142.30 180.10 178.40 150.80 189.60
Jan-15 136.40 161.60 167.80 127.10 149.60 153.10 130.10 155.90
Feb-15 160.70 187.30 199.10 160.30 176.60 182.40 194.20 195.10
Mar-15 164.40 163.20 185.60 167.80 162.90 171.10 201.70 172.50
Apr-15 179.30 172.20 184.30 173.40 170.20 177.60 215.40 181.20
May-15 193.80 183.20 196.50 188.40 184.90 191.70 247.20 204.00
Jun-15 200.50 176.20 188.80 194.50 173.20 180.20 218.70 189.60
Jul-15 186.00 155.70 168.40 186.00 154.90 162.40 266.30 171.60
Aug-15 162.00 138.70 151.60 157.40 138.90 146.30 207.50 151.90
Sep-15 146.00 142.30 151.60 135.30 139.50 144.40 171.50 150.20
Oct-15 139.70 140.40 147.20 130.70 139.10 141.80 166.90 155.30
Nov-15 137.70 131.60 141.30 124.60 132.60 135.10 150.70 143.80
Dec-15 127.60 103.70 113.80 118.10 108.20 108.90 164.70 121.30
Yr-on-Yr Chg. -24.2% -44.1% -44.1% -17.0% -39.9% -39.0% 9.2% -36.0%
CERI Commodity Report - Crude Oil
Page 14
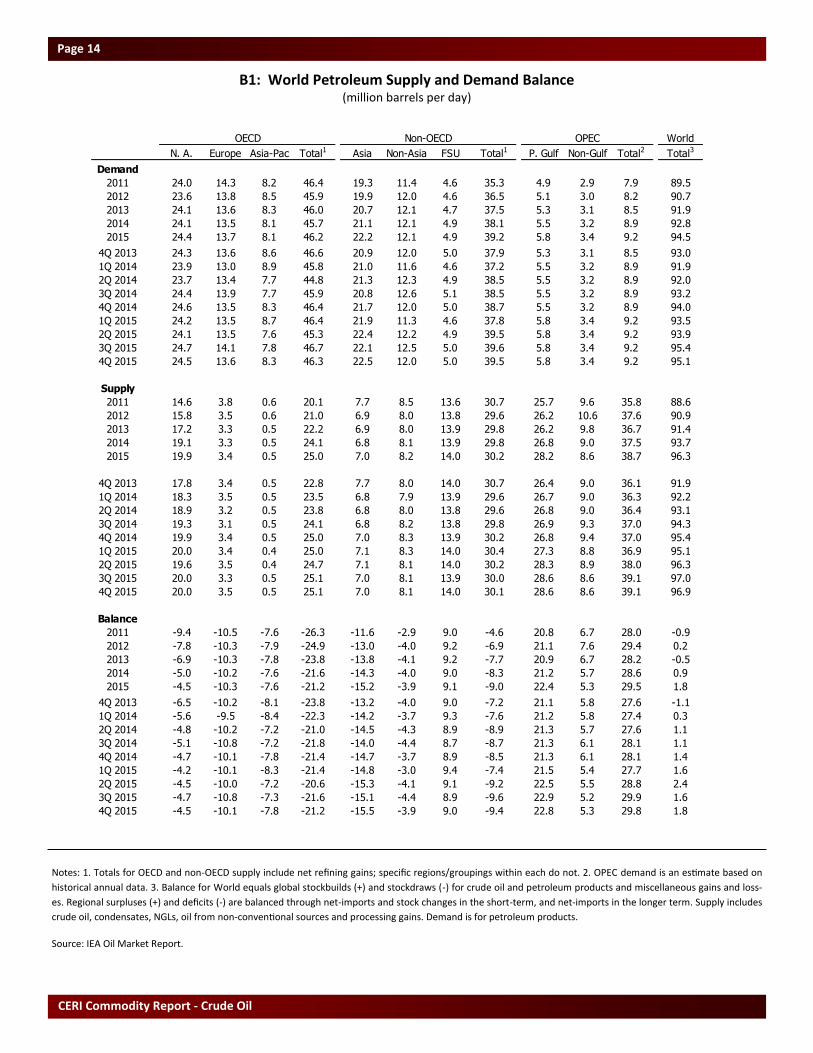
B1: World Petroleum Supply and Demand Balance (million barrels per day)
Notes: 1. Totals for OECD and non-OECD supply include net refining gains; specific regions/groupings within each do not. 2. OPEC demand is an estimate based on
historical annual data. 3. Balance for World equals global stockbuilds (+) and stockdraws (-) for crude oil and petroleum products and miscellaneous gains and loss-
es. Regional surpluses (+) and deficits (-) are balanced through net-imports and stock changes in the short-term, and net-imports in the longer term. Supply includes
crude oil, condensates, NGLs, oil from non-conventional sources and processing gains. Demand is for petroleum products.
Source: IEA Oil Market Report.
OECD Non-OECD OPEC World
N. A. Europe Asia-Pac Total1 Asia Non-Asia FSU Total1 P. Gulf Non-Gulf Total2 Total3
Demand
2011 24.0 14.3 8.2 46.4 19.3 11.4 4.6 35.3 4.9 2.9 7.9 89.5
2012 23.6 13.8 8.5 45.9 19.9 12.0 4.6 36.5 5.1 3.0 8.2 90.7
2013 24.1 13.6 8.3 46.0 20.7 12.1 4.7 37.5 5.3 3.1 8.5 91.9
2014 24.1 13.5 8.1 45.7 21.1 12.1 4.9 38.1 5.5 3.2 8.9 92.8
2015 24.4 13.7 8.1 46.2 22.2 12.1 4.9 39.2 5.8 3.4 9.2 94.5
4Q 2013 24.3 13.6 8.6 46.6 20.9 12.0 5.0 37.9 5.3 3.1 8.5 93.0
1Q 2014 23.9 13.0 8.9 45.8 21.0 11.6 4.6 37.2 5.5 3.2 8.9 91.9
2Q 2014 23.7 13.4 7.7 44.8 21.3 12.3 4.9 38.5 5.5 3.2 8.9 92.0
3Q 2014 24.4 13.9 7.7 45.9 20.8 12.6 5.1 38.5 5.5 3.2 8.9 93.2
4Q 2014 24.6 13.5 8.3 46.4 21.7 12.0 5.0 38.7 5.5 3.2 8.9 94.0
1Q 2015 24.2 13.5 8.7 46.4 21.9 11.3 4.6 37.8 5.8 3.4 9.2 93.5
2Q 2015 24.1 13.5 7.6 45.3 22.4 12.2 4.9 39.5 5.8 3.4 9.2 93.9
3Q 2015 24.7 14.1 7.8 46.7 22.1 12.5 5.0 39.6 5.8 3.4 9.2 95.4
4Q 2015 24.5 13.6 8.3 46.3 22.5 12.0 5.0 39.5 5.8 3.4 9.2 95.1
Supply
2011 14.6 3.8 0.6 20.1 7.7 8.5 13.6 30.7 25.7 9.6 35.8 88.6
2012 15.8 3.5 0.6 21.0 6.9 8.0 13.8 29.6 26.2 10.6 37.6 90.9
2013 17.2 3.3 0.5 22.2 6.9 8.0 13.9 29.8 26.2 9.8 36.7 91.4
2014 19.1 3.3 0.5 24.1 6.8 8.1 13.9 29.8 26.8 9.0 37.5 93.7
2015 19.9 3.4 0.5 25.0 7.0 8.2 14.0 30.2 28.2 8.6 38.7 96.3
4Q 2013 17.8 3.4 0.5 22.8 7.7 8.0 14.0 30.7 26.4 9.0 36.1 91.9
1Q 2014 18.3 3.5 0.5 23.5 6.8 7.9 13.9 29.6 26.7 9.0 36.3 92.2
2Q 2014 18.9 3.2 0.5 23.8 6.8 8.0 13.8 29.6 26.8 9.0 36.4 93.1
3Q 2014 19.3 3.1 0.5 24.1 6.8 8.2 13.8 29.8 26.9 9.3 37.0 94.3
4Q 2014 19.9 3.4 0.5 25.0 7.0 8.3 13.9 30.2 26.8 9.4 37.0 95.4
1Q 2015 20.0 3.4 0.4 25.0 7.1 8.3 14.0 30.4 27.3 8.8 36.9 95.1
2Q 2015 19.6 3.5 0.4 24.7 7.1 8.1 14.0 30.2 28.3 8.9 38.0 96.3
3Q 2015 20.0 3.3 0.5 25.1 7.0 8.1 13.9 30.0 28.6 8.6 39.1 97.0
4Q 2015 20.0 3.5 0.5 25.1 7.0 8.1 14.0 30.1 28.6 8.6 39.1 96.9
Balance
2011 -9.4 -10.5 -7.6 -26.3 -11.6 -2.9 9.0 -4.6 20.8 6.7 28.0 -0.9
2012 -7.8 -10.3 -7.9 -24.9 -13.0 -4.0 9.2 -6.9 21.1 7.6 29.4 0.2
2013 -6.9 -10.3 -7.8 -23.8 -13.8 -4.1 9.2 -7.7 20.9 6.7 28.2 -0.5
2014 -5.0 -10.2 -7.6 -21.6 -14.3 -4.0 9.0 -8.3 21.2 5.7 28.6 0.9
2015 -4.5 -10.3 -7.6 -21.2 -15.2 -3.9 9.1 -9.0 22.4 5.3 29.5 1.8
4Q 2013 -6.5 -10.2 -8.1 -23.8 -13.2 -4.0 9.0 -7.2 21.1 5.8 27.6 -1.1
1Q 2014 -5.6 -9.5 -8.4 -22.3 -14.2 -3.7 9.3 -7.6 21.2 5.8 27.4 0.3
2Q 2014 -4.8 -10.2 -7.2 -21.0 -14.5 -4.3 8.9 -8.9 21.3 5.7 27.6 1.1
3Q 2014 -5.1 -10.8 -7.2 -21.8 -14.0 -4.4 8.7 -8.7 21.3 6.1 28.1 1.1
4Q 2014 -4.7 -10.1 -7.8 -21.4 -14.7 -3.7 8.9 -8.5 21.3 6.1 28.1 1.4
1Q 2015 -4.2 -10.1 -8.3 -21.4 -14.8 -3.0 9.4 -7.4 21.5 5.4 27.7 1.6
2Q 2015 -4.5 -10.0 -7.2 -20.6 -15.3 -4.1 9.1 -9.2 22.5 5.5 28.8 2.4
3Q 2015 -4.7 -10.8 -7.3 -21.6 -15.1 -4.4 8.9 -9.6 22.9 5.2 29.9 1.6
4Q 2015 -4.5 -10.1 -7.8 -21.2 -15.5 -3.9 9.0 -9.4 22.8 5.3 29.8 1.8
Relevant • Independent • Objective
Page 15
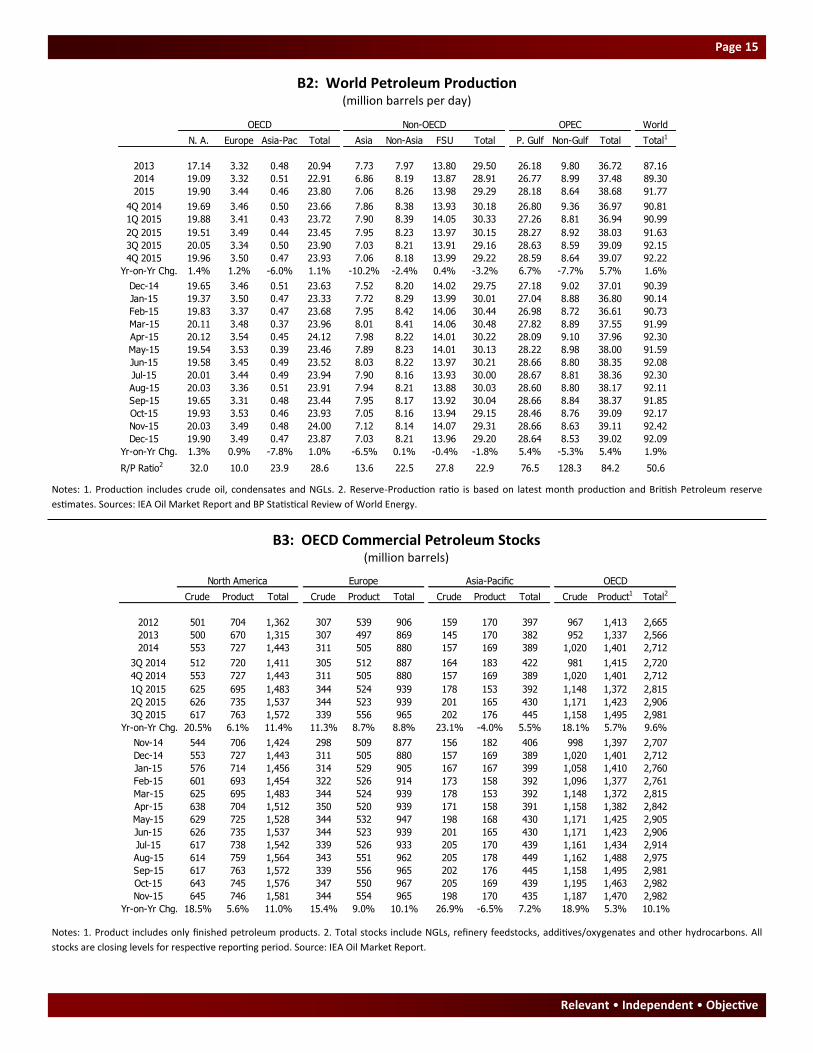
B2: World Petroleum Production (million barrels per day)
B3: OECD Commercial Petroleum Stocks (million barrels)
Notes: 1. Production includes crude oil, condensates and NGLs. 2. Reserve-Production ratio is based on latest month production and British Petroleum reserve
estimates. Sources: IEA Oil Market Report and BP Statistical Review of World Energy.
Notes: 1. Product includes only finished petroleum products. 2. Total stocks include NGLs, refinery feedstocks, additives/oxygenates and other hydrocarbons. All
stocks are closing levels for respective reporting period. Source: IEA Oil Market Report.
OECD Non-OECD OPEC World
N. A. Europe Asia-Pac Total Asia Non-Asia FSU Total P. Gulf Non-Gulf Total Total1
2013 17.14 3.32 0.48 20.94 7.73 7.97 13.80 29.50 26.18 9.80 36.72 87.16
2014 19.09 3.32 0.51 22.91 6.86 8.19 13.87 28.91 26.77 8.99 37.48 89.30
2015 19.90 3.44 0.46 23.80 7.06 8.26 13.98 29.29 28.18 8.64 38.68 91.77
4Q 2014 19.69 3.46 0.50 23.66 7.86 8.38 13.93 30.18 26.80 9.36 36.97 90.81
1Q 2015 19.88 3.41 0.43 23.72 7.90 8.39 14.05 30.33 27.26 8.81 36.94 90.99
2Q 2015 19.51 3.49 0.44 23.45 7.95 8.23 13.97 30.15 28.27 8.92 38.03 91.63
3Q 2015 20.05 3.34 0.50 23.90 7.03 8.21 13.91 29.16 28.63 8.59 39.09 92.15
4Q 2015 19.96 3.50 0.47 23.93 7.06 8.18 13.99 29.22 28.59 8.64 39.07 92.22
Yr-on-Yr Chg. 1.4% 1.2% -6.0% 1.1% -10.2% -2.4% 0.4% -3.2% 6.7% -7.7% 5.7% 1.6%
Dec-14 19.65 3.46 0.51 23.63 7.52 8.20 14.02 29.75 27.18 9.02 37.01 90.39
Jan-15 19.37 3.50 0.47 23.33 7.72 8.29 13.99 30.01 27.04 8.88 36.80 90.14
Feb-15 19.83 3.37 0.47 23.68 7.95 8.42 14.06 30.44 26.98 8.72 36.61 90.73
Mar-15 20.11 3.48 0.37 23.96 8.01 8.41 14.06 30.48 27.82 8.89 37.55 91.99
Apr-15 20.12 3.54 0.45 24.12 7.98 8.22 14.01 30.22 28.09 9.10 37.96 92.30
May-15 19.54 3.53 0.39 23.46 7.89 8.23 14.01 30.13 28.22 8.98 38.00 91.59
Jun-15 19.58 3.45 0.49 23.52 8.03 8.22 13.97 30.21 28.66 8.80 38.35 92.08
Jul-15 20.01 3.44 0.49 23.94 7.90 8.16 13.93 30.00 28.67 8.81 38.36 92.30
Aug-15 20.03 3.36 0.51 23.91 7.94 8.21 13.88 30.03 28.60 8.80 38.17 92.11
Sep-15 19.65 3.31 0.48 23.44 7.95 8.17 13.92 30.04 28.66 8.84 38.37 91.85
Oct-15 19.93 3.53 0.46 23.93 7.05 8.16 13.94 29.15 28.46 8.76 39.09 92.17
Nov-15 20.03 3.49 0.48 24.00 7.12 8.14 14.07 29.31 28.66 8.63 39.11 92.42
Dec-15 19.90 3.49 0.47 23.87 7.03 8.21 13.96 29.20 28.64 8.53 39.02 92.09
Yr-on-Yr Chg. 1.3% 0.9% -7.8% 1.0% -6.5% 0.1% -0.4% -1.8% 5.4% -5.3% 5.4% 1.9%
R/P Ratio2 32.0 10.0 23.9 28.6 13.6 22.5 27.8 22.9 76.5 128.3 84.2 50.6
North America Europe Asia-Pacific OECD
Crude Product Total Crude Product Total Crude Product Total Crude Product1 Total2
2012 501 704 1,362 307 539 906 159 170 397 967 1,413 2,665
2013 500 670 1,315 307 497 869 145 170 382 952 1,337 2,566
2014 553 727 1,443 311 505 880 157 169 389 1,020 1,401 2,712
3Q 2014 512 720 1,411 305 512 887 164 183 422 981 1,415 2,720
4Q 2014 553 727 1,443 311 505 880 157 169 389 1,020 1,401 2,712
1Q 2015 625 695 1,483 344 524 939 178 153 392 1,148 1,372 2,815
2Q 2015 626 735 1,537 344 523 939 201 165 430 1,171 1,423 2,906
3Q 2015 617 763 1,572 339 556 965 202 176 445 1,158 1,495 2,981
Yr-on-Yr Chg. 20.5% 6.1% 11.4% 11.3% 8.7% 8.8% 23.1% -4.0% 5.5% 18.1% 5.7% 9.6%
Nov-14 544 706 1,424 298 509 877 156 182 406 998 1,397 2,707
Dec-14 553 727 1,443 311 505 880 157 169 389 1,020 1,401 2,712
Jan-15 576 714 1,456 314 529 905 167 167 399 1,058 1,410 2,760
Feb-15 601 693 1,454 322 526 914 173 158 392 1,096 1,377 2,761
Mar-15 625 695 1,483 344 524 939 178 153 392 1,148 1,372 2,815
Apr-15 638 704 1,512 350 520 939 171 158 391 1,158 1,382 2,842
May-15 629 725 1,528 344 532 947 198 168 430 1,171 1,425 2,905
Jun-15 626 735 1,537 344 523 939 201 165 430 1,171 1,423 2,906
Jul-15 617 738 1,542 339 526 933 205 170 439 1,161 1,434 2,914
Aug-15 614 759 1,564 343 551 962 205 178 449 1,162 1,488 2,975
Sep-15 617 763 1,572 339 556 965 202 176 445 1,158 1,495 2,981
Oct-15 643 745 1,576 347 550 967 205 169 439 1,195 1,463 2,982
Nov-15 645 746 1,581 344 554 965 198 170 435 1,187 1,470 2,982
Yr-on-Yr Chg. 18.5% 5.6% 11.0% 15.4% 9.0% 10.1% 26.9% -6.5% 7.2% 18.9% 5.3% 10.1%
CERI Commodity Report - Crude Oil
Page 16
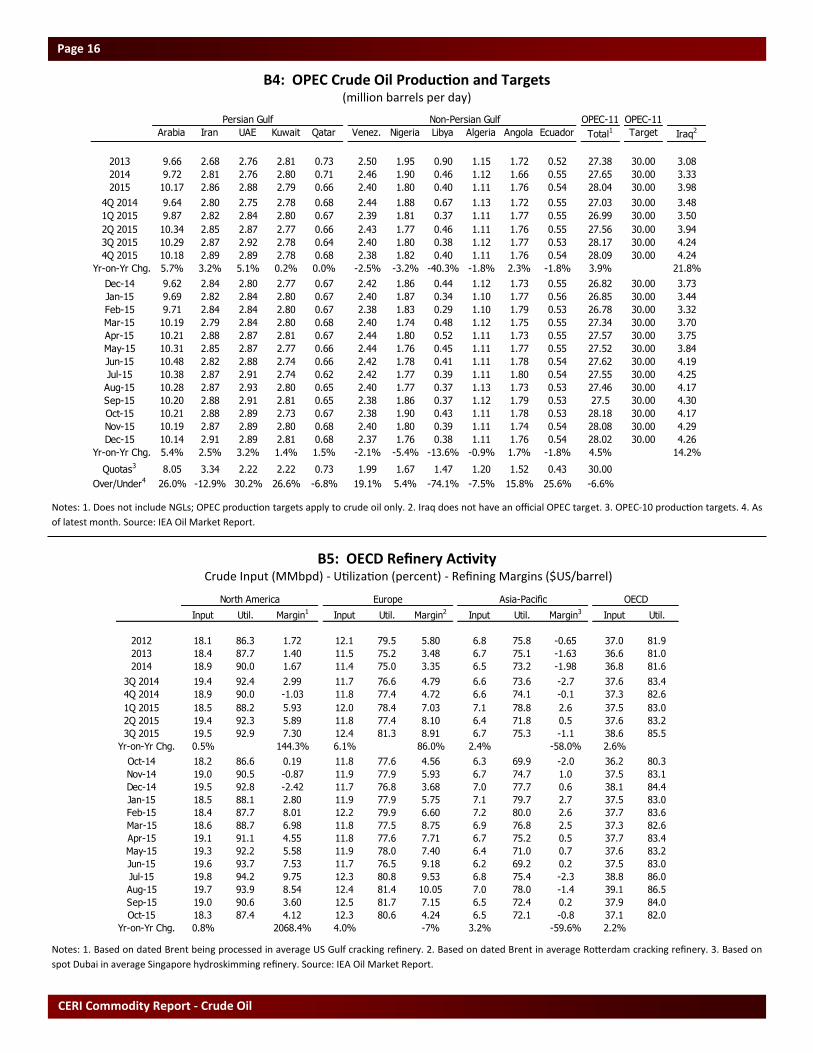
B4: OPEC Crude Oil Production and Targets (million barrels per day)
Notes: 1. Does not include NGLs; OPEC production targets apply to crude oil only. 2. Iraq does not have an official OPEC target. 3. OPEC-10 production targets. 4. As
of latest month. Source: IEA Oil Market Report.
B5: OECD Refinery Activity Crude Input (MMbpd) - Utilization (percent) - Refining Margins ($US/barrel)
Notes: 1. Based on dated Brent being processed in average US Gulf cracking refinery. 2. Based on dated Brent in average Rotterdam cracking refinery. 3. Based on
spot Dubai in average Singapore hydroskimming refinery. Source: IEA Oil Market Report.
Non-Persian Gulf OPEC-11 OPEC-11
Arabia Iran UAE Kuwait Qatar Venez. Nigeria Libya Algeria Angola Ecuador Total1 Target Iraq2
2013 9.66 2.68 2.76 2.81 0.73 2.50 1.95 0.90 1.15 1.72 0.52 27.38 30.00 3.08
2014 9.72 2.81 2.76 2.80 0.71 2.46 1.90 0.46 1.12 1.66 0.55 27.65 30.00 3.33
2015 10.17 2.86 2.88 2.79 0.66 2.40 1.80 0.40 1.11 1.76 0.54 28.04 30.00 3.98
4Q 2014 9.64 2.80 2.75 2.78 0.68 2.44 1.88 0.67 1.13 1.72 0.55 27.03 30.00 3.48
1Q 2015 9.87 2.82 2.84 2.80 0.67 2.39 1.81 0.37 1.11 1.77 0.55 26.99 30.00 3.50
2Q 2015 10.34 2.85 2.87 2.77 0.66 2.43 1.77 0.46 1.11 1.76 0.55 27.56 30.00 3.94
3Q 2015 10.29 2.87 2.92 2.78 0.64 2.40 1.80 0.38 1.12 1.77 0.53 28.17 30.00 4.24
4Q 2015 10.18 2.89 2.89 2.78 0.68 2.38 1.82 0.40 1.11 1.76 0.54 28.09 30.00 4.24
Yr-on-Yr Chg. 5.7% 3.2% 5.1% 0.2% 0.0% -2.5% -3.2% -40.3% -1.8% 2.3% -1.8% 3.9% 21.8%
Dec-14 9.62 2.84 2.80 2.77 0.67 2.42 1.86 0.44 1.12 1.73 0.55 26.82 30.00 3.73
Jan-15 9.69 2.82 2.84 2.80 0.67 2.40 1.87 0.34 1.10 1.77 0.56 26.85 30.00 3.44
Feb-15 9.71 2.84 2.84 2.80 0.67 2.38 1.83 0.29 1.10 1.79 0.53 26.78 30.00 3.32
Mar-15 10.19 2.79 2.84 2.80 0.68 2.40 1.74 0.48 1.12 1.75 0.55 27.34 30.00 3.70
Apr-15 10.21 2.88 2.87 2.81 0.67 2.44 1.80 0.52 1.11 1.73 0.55 27.57 30.00 3.75
May-15 10.31 2.85 2.87 2.77 0.66 2.44 1.76 0.45 1.11 1.77 0.55 27.52 30.00 3.84
Jun-15 10.48 2.82 2.88 2.74 0.66 2.42 1.78 0.41 1.11 1.78 0.54 27.62 30.00 4.19
Jul-15 10.38 2.87 2.91 2.74 0.62 2.42 1.77 0.39 1.11 1.80 0.54 27.55 30.00 4.25
Aug-15 10.28 2.87 2.93 2.80 0.65 2.40 1.77 0.37 1.13 1.73 0.53 27.46 30.00 4.17
Sep-15 10.20 2.88 2.91 2.81 0.65 2.38 1.86 0.37 1.12 1.79 0.53 27.5 30.00 4.30
Oct-15 10.21 2.88 2.89 2.73 0.67 2.38 1.90 0.43 1.11 1.78 0.53 28.18 30.00 4.17
Nov-15 10.19 2.87 2.89 2.80 0.68 2.40 1.80 0.39 1.11 1.74 0.54 28.08 30.00 4.29
Dec-15 10.14 2.91 2.89 2.81 0.68 2.37 1.76 0.38 1.11 1.76 0.54 28.02 30.00 4.26
Yr-on-Yr Chg. 5.4% 2.5% 3.2% 1.4% 1.5% -2.1% -5.4% -13.6% -0.9% 1.7% -1.8% 4.5% 14.2%
Quotas3 8.05 3.34 2.22 2.22 0.73 1.99 1.67 1.47 1.20 1.52 0.43 30.00
Over/Under4 26.0% -12.9% 30.2% 26.6% -6.8% 19.1% 5.4% -74.1% -7.5% 15.8% 25.6% -6.6%
Persian Gulf
North America Europe Asia-Pacific OECD
Input Util. Margin1 Input Util. Margin2 Input Util. Margin3 Input Util.
2012 18.1 86.3 1.72 12.1 79.5 5.80 6.8 75.8 -0.65 37.0 81.9
2013 18.4 87.7 1.40 11.5 75.2 3.48 6.7 75.1 -1.63 36.6 81.0
2014 18.9 90.0 1.67 11.4 75.0 3.35 6.5 73.2 -1.98 36.8 81.6
3Q 2014 19.4 92.4 2.99 11.7 76.6 4.79 6.6 73.6 -2.7 37.6 83.4
4Q 2014 18.9 90.0 -1.03 11.8 77.4 4.72 6.6 74.1 -0.1 37.3 82.6
1Q 2015 18.5 88.2 5.93 12.0 78.4 7.03 7.1 78.8 2.6 37.5 83.0
2Q 2015 19.4 92.3 5.89 11.8 77.4 8.10 6.4 71.8 0.5 37.6 83.2
3Q 2015 19.5 92.9 7.30 12.4 81.3 8.91 6.7 75.3 -1.1 38.6 85.5
Yr-on-Yr Chg. 0.5% 144.3% 6.1% 86.0% 2.4% -58.0% 2.6%
Oct-14 18.2 86.6 0.19 11.8 77.6 4.56 6.3 69.9 -2.0 36.2 80.3
Nov-14 19.0 90.5 -0.87 11.9 77.9 5.93 6.7 74.7 1.0 37.5 83.1
Dec-14 19.5 92.8 -2.42 11.7 76.8 3.68 7.0 77.7 0.6 38.1 84.4
Jan-15 18.5 88.1 2.80 11.9 77.9 5.75 7.1 79.7 2.7 37.5 83.0
Feb-15 18.4 87.7 8.01 12.2 79.9 6.60 7.2 80.0 2.6 37.7 83.6
Mar-15 18.6 88.7 6.98 11.8 77.5 8.75 6.9 76.8 2.5 37.3 82.6
Apr-15 19.1 91.1 4.55 11.8 77.6 7.71 6.7 75.2 0.5 37.7 83.4
May-15 19.3 92.2 5.58 11.9 78.0 7.40 6.4 71.0 0.7 37.6 83.2
Jun-15 19.6 93.7 7.53 11.7 76.5 9.18 6.2 69.2 0.2 37.5 83.0
Jul-15 19.8 94.2 9.75 12.3 80.8 9.53 6.8 75.4 -2.3 38.8 86.0
Aug-15 19.7 93.9 8.54 12.4 81.4 10.05 7.0 78.0 -1.4 39.1 86.5
Sep-15 19.0 90.6 3.60 12.5 81.7 7.15 6.5 72.4 0.2 37.9 84.0
Oct-15 18.3 87.4 4.12 12.3 80.6 4.24 6.5 72.1 -0.8 37.1 82.0
Yr-on-Yr Chg. 0.8% 2068.4% 4.0% -7% 3.2% -59.6% 2.2%
Relevant • Independent • Objective
Page 17
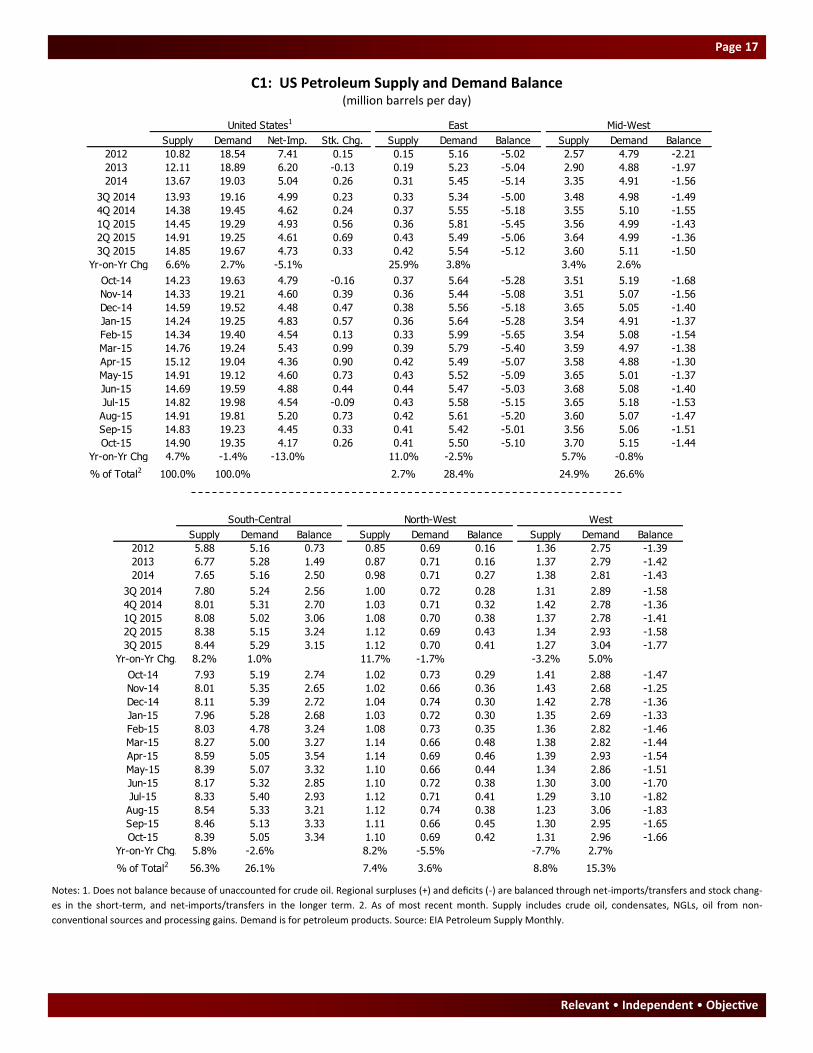
C1: US Petroleum Supply and Demand Balance (million barrels per day)
Notes: 1. Does not balance because of unaccounted for crude oil. Regional surpluses (+) and deficits (-) are balanced through net-imports/transfers and stock chang-
es in the short-term, and net-imports/transfers in the longer term. 2. As of most recent month. Supply includes crude oil, condensates, NGLs, oil from non-
conventional sources and processing gains. Demand is for petroleum products. Source: EIA Petroleum Supply Monthly.
United States1 East Mid-West
Supply Demand Net-Imp. Stk. Chg. Supply Demand Balance Supply Demand Balance
2012 10.82 18.54 7.41 0.15 0.15 5.16 -5.02 2.57 4.79 -2.21
2013 12.11 18.89 6.20 -0.13 0.19 5.23 -5.04 2.90 4.88 -1.97
2014 13.67 19.03 5.04 0.26 0.31 5.45 -5.14 3.35 4.91 -1.56
3Q 2014 13.93 19.16 4.99 0.23 0.33 5.34 -5.00 3.48 4.98 -1.49
4Q 2014 14.38 19.45 4.62 0.24 0.37 5.55 -5.18 3.55 5.10 -1.55
1Q 2015 14.45 19.29 4.93 0.56 0.36 5.81 -5.45 3.56 4.99 -1.43
2Q 2015 14.91 19.25 4.61 0.69 0.43 5.49 -5.06 3.64 4.99 -1.36
3Q 2015 14.85 19.67 4.73 0.33 0.42 5.54 -5.12 3.60 5.11 -1.50
Yr-on-Yr Chg. 6.6% 2.7% -5.1% 25.9% 3.8% 3.4% 2.6%
Oct-14 14.23 19.63 4.79 -0.16 0.37 5.64 -5.28 3.51 5.19 -1.68
Nov-14 14.33 19.21 4.60 0.39 0.36 5.44 -5.08 3.51 5.07 -1.56
Dec-14 14.59 19.52 4.48 0.47 0.38 5.56 -5.18 3.65 5.05 -1.40
Jan-15 14.24 19.25 4.83 0.57 0.36 5.64 -5.28 3.54 4.91 -1.37
Feb-15 14.34 19.40 4.54 0.13 0.33 5.99 -5.65 3.54 5.08 -1.54
Mar-15 14.76 19.24 5.43 0.99 0.39 5.79 -5.40 3.59 4.97 -1.38
Apr-15 15.12 19.04 4.36 0.90 0.42 5.49 -5.07 3.58 4.88 -1.30
May-15 14.91 19.12 4.60 0.73 0.43 5.52 -5.09 3.65 5.01 -1.37
Jun-15 14.69 19.59 4.88 0.44 0.44 5.47 -5.03 3.68 5.08 -1.40
Jul-15 14.82 19.98 4.54 -0.09 0.43 5.58 -5.15 3.65 5.18 -1.53
Aug-15 14.91 19.81 5.20 0.73 0.42 5.61 -5.20 3.60 5.07 -1.47
Sep-15 14.83 19.23 4.45 0.33 0.41 5.42 -5.01 3.56 5.06 -1.51
Oct-15 14.90 19.35 4.17 0.26 0.41 5.50 -5.10 3.70 5.15 -1.44
Yr-on-Yr Chg. 4.7% -1.4% -13.0% 11.0% -2.5% 5.7% -0.8%
% of Total2 100.0% 100.0% 2.7% 28.4% 24.9% 26.6%
South-Central North-West West Finished Petroleum Products
Supply Demand Balance Supply Demand Balance Supply Demand Balance
2012 5.88 5.16 0.73 0.85 0.69 0.16 1.36 2.75 -1.39
2013 6.77 5.28 1.49 0.87 0.71 0.16 1.37 2.79 -1.42
2014 7.65 5.16 2.50 0.98 0.71 0.27 1.38 2.81 -1.43
3Q 2014 7.80 5.24 2.56 1.00 0.72 0.28 1.31 2.89 -1.58
4Q 2014 8.01 5.31 2.70 1.03 0.71 0.32 1.42 2.78 -1.36
1Q 2015 8.08 5.02 3.06 1.08 0.70 0.38 1.37 2.78 -1.41
2Q 2015 8.38 5.15 3.24 1.12 0.69 0.43 1.34 2.93 -1.58
3Q 2015 8.44 5.29 3.15 1.12 0.70 0.41 1.27 3.04 -1.77
Yr-on-Yr Chg. 8.2% 1.0% 11.7% -1.7% -3.2% 5.0%
Oct-14 7.93 5.19 2.74 1.02 0.73 0.29 1.41 2.88 -1.47
Nov-14 8.01 5.35 2.65 1.02 0.66 0.36 1.43 2.68 -1.25
Dec-14 8.11 5.39 2.72 1.04 0.74 0.30 1.42 2.78 -1.36
Jan-15 7.96 5.28 2.68 1.03 0.72 0.30 1.35 2.69 -1.33
Feb-15 8.03 4.78 3.24 1.08 0.73 0.35 1.36 2.82 -1.46
Mar-15 8.27 5.00 3.27 1.14 0.66 0.48 1.38 2.82 -1.44
Apr-15 8.59 5.05 3.54 1.14 0.69 0.46 1.39 2.93 -1.54
May-15 8.39 5.07 3.32 1.10 0.66 0.44 1.34 2.86 -1.51
Jun-15 8.17 5.32 2.85 1.10 0.72 0.38 1.30 3.00 -1.70
Jul-15 8.33 5.40 2.93 1.12 0.71 0.41 1.29 3.10 -1.82
Aug-15 8.54 5.33 3.21 1.12 0.74 0.38 1.23 3.06 -1.83
Sep-15 8.46 5.13 3.33 1.11 0.66 0.45 1.30 2.95 -1.65
Oct-15 8.39 5.05 3.34 1.10 0.69 0.42 1.31 2.96 -1.66
Yr-on-Yr Chg. 5.8% -2.6% 8.2% -5.5% -7.7% 2.7%
% of Total2 56.3% 26.1% 7.4% 3.6% 8.8% 15.3%
CERI Commodity Report - Crude Oil
Page 18
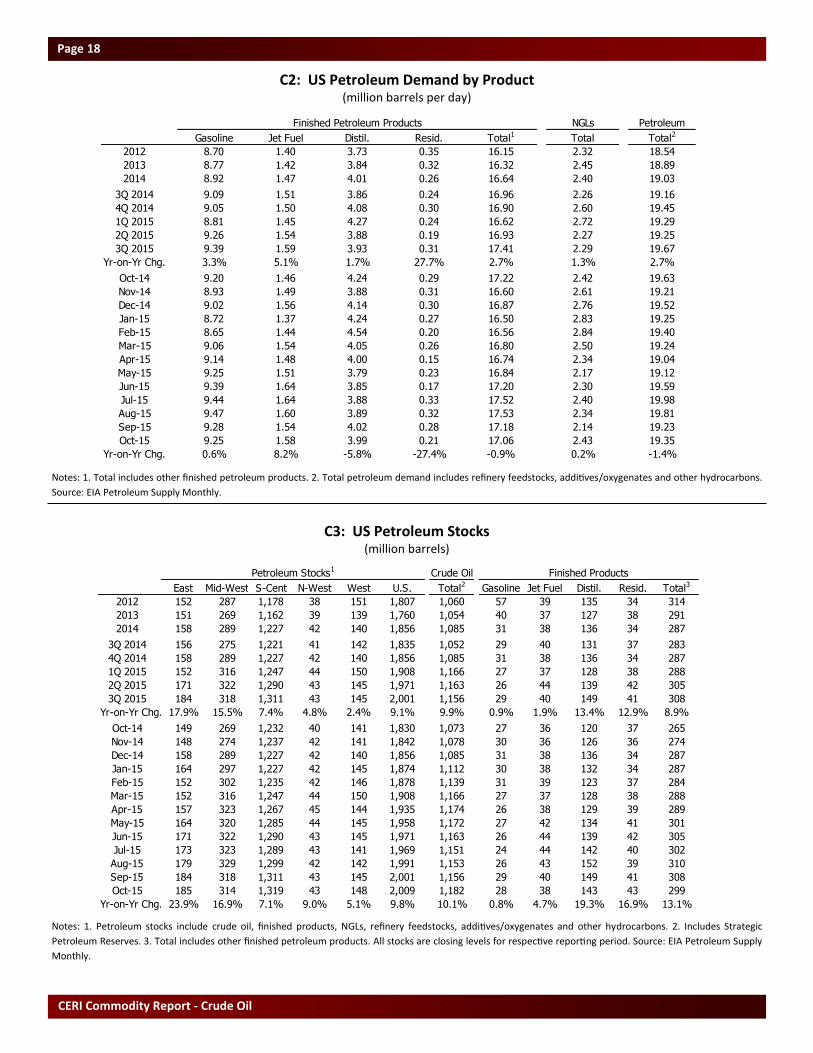
C2: US Petroleum Demand by Product (million barrels per day)
Notes: 1. Total includes other finished petroleum products. 2. Total petroleum demand includes refinery feedstocks, additives/oxygenates and other hydrocarbons.
Source: EIA Petroleum Supply Monthly.
C3: US Petroleum Stocks (million barrels)
Notes: 1. Petroleum stocks include crude oil, finished products, NGLs, refinery feedstocks, additives/oxygenates and other hydrocarbons. 2. Includes Strategic
Petroleum Reserves. 3. Total includes other finished petroleum products. All stocks are closing levels for respective reporting period. Source: EIA Petroleum Supply
Monthly.
Finished Petroleum Products NGLs Petroleum
Gasoline Jet Fuel Distil. Resid. Total1 Total Total2
2012 8.70 1.40 3.73 0.35 16.15 2.32 18.54
2013 8.77 1.42 3.84 0.32 16.32 2.45 18.89
2014 8.92 1.47 4.01 0.26 16.64 2.40 19.03
3Q 2014 9.09 1.51 3.86 0.24 16.96 2.26 19.16
4Q 2014 9.05 1.50 4.08 0.30 16.90 2.60 19.45
1Q 2015 8.81 1.45 4.27 0.24 16.62 2.72 19.29
2Q 2015 9.26 1.54 3.88 0.19 16.93 2.27 19.25
3Q 2015 9.39 1.59 3.93 0.31 17.41 2.29 19.67
Yr-on-Yr Chg. 3.3% 5.1% 1.7% 27.7% 2.7% 1.3% 2.7%
Oct-14 9.20 1.46 4.24 0.29 17.22 2.42 19.63
Nov-14 8.93 1.49 3.88 0.31 16.60 2.61 19.21
Dec-14 9.02 1.56 4.14 0.30 16.87 2.76 19.52
Jan-15 8.72 1.37 4.24 0.27 16.50 2.83 19.25
Feb-15 8.65 1.44 4.54 0.20 16.56 2.84 19.40
Mar-15 9.06 1.54 4.05 0.26 16.80 2.50 19.24
Apr-15 9.14 1.48 4.00 0.15 16.74 2.34 19.04
May-15 9.25 1.51 3.79 0.23 16.84 2.17 19.12
Jun-15 9.39 1.64 3.85 0.17 17.20 2.30 19.59
Jul-15 9.44 1.64 3.88 0.33 17.52 2.40 19.98
Aug-15 9.47 1.60 3.89 0.32 17.53 2.34 19.81
Sep-15 9.28 1.54 4.02 0.28 17.18 2.14 19.23
Oct-15 9.25 1.58 3.99 0.21 17.06 2.43 19.35
Yr-on-Yr Chg. 0.6% 8.2% -5.8% -27.4% -0.9% 0.2% -1.4%
Petroleum Stocks1 Crude Oil Finished Products
East Mid-West S-Cent N-West West U.S. Total2 Gasoline Jet Fuel Distil. Resid. Total3
2012 152 287 1,178 38 151 1,807 1,060 57 39 135 34 314
2013 151 269 1,162 39 139 1,760 1,054 40 37 127 38 291
2014 158 289 1,227 42 140 1,856 1,085 31 38 136 34 287
3Q 2014 156 275 1,221 41 142 1,835 1,052 29 40 131 37 283
4Q 2014 158 289 1,227 42 140 1,856 1,085 31 38 136 34 287
1Q 2015 152 316 1,247 44 150 1,908 1,166 27 37 128 38 288
2Q 2015 171 322 1,290 43 145 1,971 1,163 26 44 139 42 305
3Q 2015 184 318 1,311 43 145 2,001 1,156 29 40 149 41 308
Yr-on-Yr Chg. 17.9% 15.5% 7.4% 4.8% 2.4% 9.1% 9.9% 0.9% 1.9% 13.4% 12.9% 8.9%
Oct-14 149 269 1,232 40 141 1,830 1,073 27 36 120 37 265
Nov-14 148 274 1,237 42 141 1,842 1,078 30 36 126 36 274
Dec-14 158 289 1,227 42 140 1,856 1,085 31 38 136 34 287
Jan-15 164 297 1,227 42 145 1,874 1,112 30 38 132 34 287
Feb-15 152 302 1,235 42 146 1,878 1,139 31 39 123 37 284
Mar-15 152 316 1,247 44 150 1,908 1,166 27 37 128 38 288
Apr-15 157 323 1,267 45 144 1,935 1,174 26 38 129 39 289
May-15 164 320 1,285 44 145 1,958 1,172 27 42 134 41 301
Jun-15 171 322 1,290 43 145 1,971 1,163 26 44 139 42 305
Jul-15 173 323 1,289 43 141 1,969 1,151 24 44 142 40 302
Aug-15 179 329 1,299 42 142 1,991 1,153 26 43 152 39 310
Sep-15 184 318 1,311 43 145 2,001 1,156 29 40 149 41 308
Oct-15 185 314 1,319 43 148 2,009 1,182 28 38 143 43 299
Yr-on-Yr Chg. 23.9% 16.9% 7.1% 9.0% 5.1% 9.8% 10.1% 0.8% 4.7% 19.3% 16.9% 13.1%
Relevant • Independent • Objective
Page 19
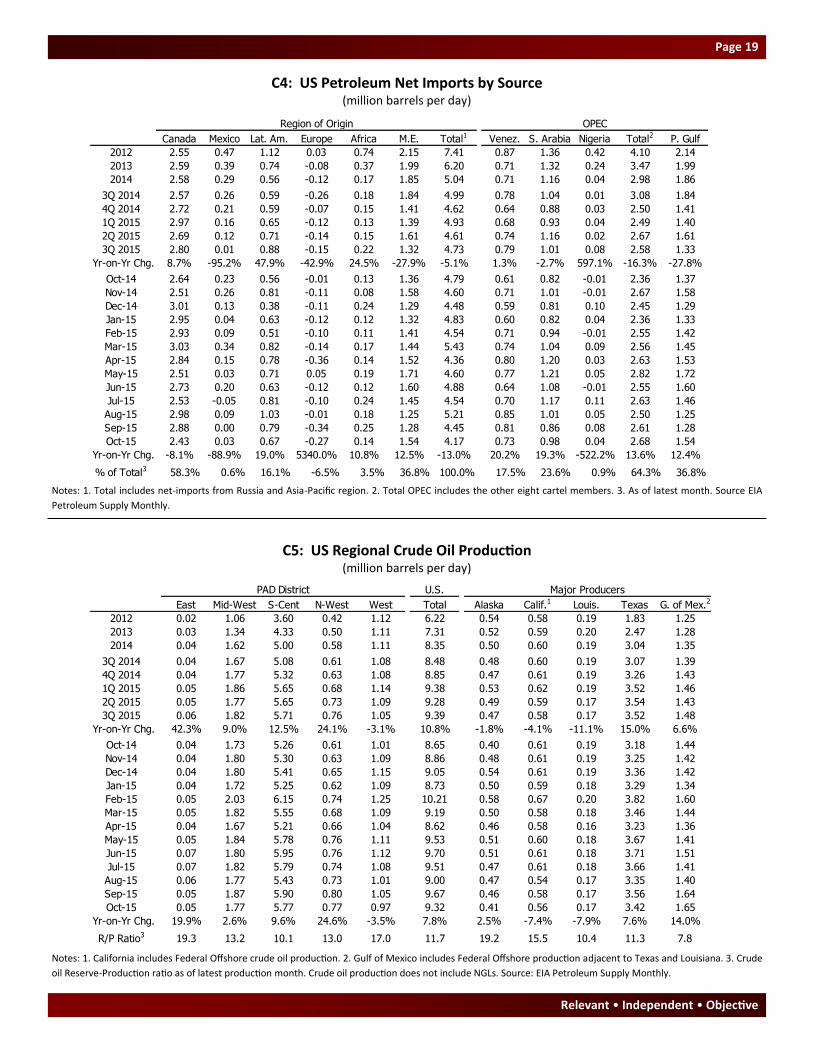
C4: US Petroleum Net Imports by Source (million barrels per day)
Notes: 1. Total includes net-imports from Russia and Asia-Pacific region. 2. Total OPEC includes the other eight cartel members. 3. As of latest month. Source EIA
Petroleum Supply Monthly.
C5: US Regional Crude Oil Production (million barrels per day)
Notes: 1. California includes Federal Offshore crude oil production. 2. Gulf of Mexico includes Federal Offshore production adjacent to Texas and Louisiana. 3. Crude
oil Reserve-Production ratio as of latest production month. Crude oil production does not include NGLs. Source: EIA Petroleum Supply Monthly.
OPEC
Canada Mexico Lat. Am. Europe Africa M.E. Total1 Venez. S. Arabia Nigeria Total2 P. Gulf
2012 2.55 0.47 1.12 0.03 0.74 2.15 7.41 0.87 1.36 0.42 4.10 2.14
2013 2.59 0.39 0.74 -0.08 0.37 1.99 6.20 0.71 1.32 0.24 3.47 1.99
2014 2.58 0.29 0.56 -0.12 0.17 1.85 5.04 0.71 1.16 0.04 2.98 1.86
3Q 2014 2.57 0.26 0.59 -0.26 0.18 1.84 4.99 0.78 1.04 0.01 3.08 1.84
4Q 2014 2.72 0.21 0.59 -0.07 0.15 1.41 4.62 0.64 0.88 0.03 2.50 1.41
1Q 2015 2.97 0.16 0.65 -0.12 0.13 1.39 4.93 0.68 0.93 0.04 2.49 1.40
2Q 2015 2.69 0.12 0.71 -0.14 0.15 1.61 4.61 0.74 1.16 0.02 2.67 1.61
3Q 2015 2.80 0.01 0.88 -0.15 0.22 1.32 4.73 0.79 1.01 0.08 2.58 1.33
Yr-on-Yr Chg. 8.7% -95.2% 47.9% -42.9% 24.5% -27.9% -5.1% 1.3% -2.7% 597.1% -16.3% -27.8%
Oct-14 2.64 0.23 0.56 -0.01 0.13 1.36 4.79 0.61 0.82 -0.01 2.36 1.37
Nov-14 2.51 0.26 0.81 -0.11 0.08 1.58 4.60 0.71 1.01 -0.01 2.67 1.58
Dec-14 3.01 0.13 0.38 -0.11 0.24 1.29 4.48 0.59 0.81 0.10 2.45 1.29
Jan-15 2.95 0.04 0.63 -0.12 0.12 1.32 4.83 0.60 0.82 0.04 2.36 1.33
Feb-15 2.93 0.09 0.51 -0.10 0.11 1.41 4.54 0.71 0.94 -0.01 2.55 1.42
Mar-15 3.03 0.34 0.82 -0.14 0.17 1.44 5.43 0.74 1.04 0.09 2.56 1.45
Apr-15 2.84 0.15 0.78 -0.36 0.14 1.52 4.36 0.80 1.20 0.03 2.63 1.53
May-15 2.51 0.03 0.71 0.05 0.19 1.71 4.60 0.77 1.21 0.05 2.82 1.72
Jun-15 2.73 0.20 0.63 -0.12 0.12 1.60 4.88 0.64 1.08 -0.01 2.55 1.60
Jul-15 2.53 -0.05 0.81 -0.10 0.24 1.45 4.54 0.70 1.17 0.11 2.63 1.46
Aug-15 2.98 0.09 1.03 -0.01 0.18 1.25 5.21 0.85 1.01 0.05 2.50 1.25
Sep-15 2.88 0.00 0.79 -0.34 0.25 1.28 4.45 0.81 0.86 0.08 2.61 1.28
Oct-15 2.43 0.03 0.67 -0.27 0.14 1.54 4.17 0.73 0.98 0.04 2.68 1.54
Yr-on-Yr Chg. -8.1% -88.9% 19.0% 5340.0% 10.8% 12.5% -13.0% 20.2% 19.3% -522.2% 13.6% 12.4%
% of Total3 58.3% 0.6% 16.1% -6.5% 3.5% 36.8% 100.0% 17.5% 23.6% 0.9% 64.3% 36.8%
Region of Origin
PAD District U.S. Major Producers
East Mid-West S-Cent N-West West Total Alaska Calif.1 Louis. Texas G. of Mex.2
2012 0.02 1.06 3.60 0.42 1.12 6.22 0.54 0.58 0.19 1.83 1.25
2013 0.03 1.34 4.33 0.50 1.11 7.31 0.52 0.59 0.20 2.47 1.28
2014 0.04 1.62 5.00 0.58 1.11 8.35 0.50 0.60 0.19 3.04 1.35
3Q 2014 0.04 1.67 5.08 0.61 1.08 8.48 0.48 0.60 0.19 3.07 1.39
4Q 2014 0.04 1.77 5.32 0.63 1.08 8.85 0.47 0.61 0.19 3.26 1.43
1Q 2015 0.05 1.86 5.65 0.68 1.14 9.38 0.53 0.62 0.19 3.52 1.46
2Q 2015 0.05 1.77 5.65 0.73 1.09 9.28 0.49 0.59 0.17 3.54 1.43
3Q 2015 0.06 1.82 5.71 0.76 1.05 9.39 0.47 0.58 0.17 3.52 1.48
Yr-on-Yr Chg. 42.3% 9.0% 12.5% 24.1% -3.1% 10.8% -1.8% -4.1% -11.1% 15.0% 6.6%
Oct-14 0.04 1.73 5.26 0.61 1.01 8.65 0.40 0.61 0.19 3.18 1.44
Nov-14 0.04 1.80 5.30 0.63 1.09 8.86 0.48 0.61 0.19 3.25 1.42
Dec-14 0.04 1.80 5.41 0.65 1.15 9.05 0.54 0.61 0.19 3.36 1.42
Jan-15 0.04 1.72 5.25 0.62 1.09 8.73 0.50 0.59 0.18 3.29 1.34
Feb-15 0.05 2.03 6.15 0.74 1.25 10.21 0.58 0.67 0.20 3.82 1.60
Mar-15 0.05 1.82 5.55 0.68 1.09 9.19 0.50 0.58 0.18 3.46 1.44
Apr-15 0.04 1.67 5.21 0.66 1.04 8.62 0.46 0.58 0.16 3.23 1.36
May-15 0.05 1.84 5.78 0.76 1.11 9.53 0.51 0.60 0.18 3.67 1.41
Jun-15 0.07 1.80 5.95 0.76 1.12 9.70 0.51 0.61 0.18 3.71 1.51
Jul-15 0.07 1.82 5.79 0.74 1.08 9.51 0.47 0.61 0.18 3.66 1.41
Aug-15 0.06 1.77 5.43 0.73 1.01 9.00 0.47 0.54 0.17 3.35 1.40
Sep-15 0.05 1.87 5.90 0.80 1.05 9.67 0.46 0.58 0.17 3.56 1.64
Oct-15 0.05 1.77 5.77 0.77 0.97 9.32 0.41 0.56 0.17 3.42 1.65
Yr-on-Yr Chg. 19.9% 2.6% 9.6% 24.6% -3.5% 7.8% 2.5% -7.4% -7.9% 7.6% 14.0%
R/P Ratio3 19.3 13.2 10.1 13.0 17.0 11.7 19.2 15.5 10.4 11.3 7.8
CERI Commodity Report - Crude Oil
Page 20
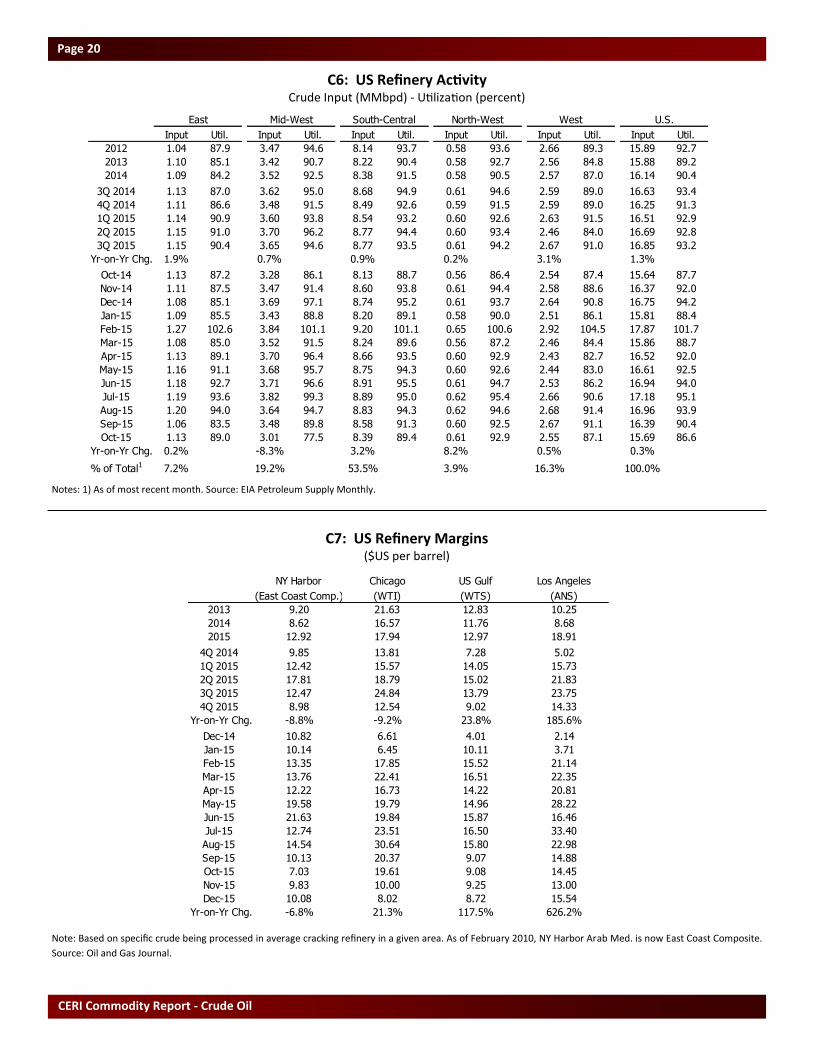
C6: US Refinery Activity Crude Input (MMbpd) - Utilization (percent)
Notes: 1) As of most recent month. Source: EIA Petroleum Supply Monthly.
C7: US Refinery Margins ($US per barrel)
Note: Based on specific crude being processed in average cracking refinery in a given area. As of February 2010, NY Harbor Arab Med. is now East Coast Composite.
Source: Oil and Gas Journal.
East Mid-West South-Central North-West West U.S.
Input Util. Input Util. Input Util. Input Util. Input Util. Input Util.
2012 1.04 87.9 3.47 94.6 8.14 93.7 0.58 93.6 2.66 89.3 15.89 92.7
2013 1.10 85.1 3.42 90.7 8.22 90.4 0.58 92.7 2.56 84.8 15.88 89.2
2014 1.09 84.2 3.52 92.5 8.38 91.5 0.58 90.5 2.57 87.0 16.14 90.4
3Q 2014 1.13 87.0 3.62 95.0 8.68 94.9 0.61 94.6 2.59 89.0 16.63 93.4
4Q 2014 1.11 86.6 3.48 91.5 8.49 92.6 0.59 91.5 2.59 89.0 16.25 91.3
1Q 2015 1.14 90.9 3.60 93.8 8.54 93.2 0.60 92.6 2.63 91.5 16.51 92.9
2Q 2015 1.15 91.0 3.70 96.2 8.77 94.4 0.60 93.4 2.46 84.0 16.69 92.8
3Q 2015 1.15 90.4 3.65 94.6 8.77 93.5 0.61 94.2 2.67 91.0 16.85 93.2
Yr-on-Yr Chg. 1.9% 0.7% 0.9% 0.2% 3.1% 1.3%
Oct-14 1.13 87.2 3.28 86.1 8.13 88.7 0.56 86.4 2.54 87.4 15.64 87.7
Nov-14 1.11 87.5 3.47 91.4 8.60 93.8 0.61 94.4 2.58 88.6 16.37 92.0
Dec-14 1.08 85.1 3.69 97.1 8.74 95.2 0.61 93.7 2.64 90.8 16.75 94.2
Jan-15 1.09 85.5 3.43 88.8 8.20 89.1 0.58 90.0 2.51 86.1 15.81 88.4
Feb-15 1.27 102.6 3.84 101.1 9.20 101.1 0.65 100.6 2.92 104.5 17.87 101.7
Mar-15 1.08 85.0 3.52 91.5 8.24 89.6 0.56 87.2 2.46 84.4 15.86 88.7
Apr-15 1.13 89.1 3.70 96.4 8.66 93.5 0.60 92.9 2.43 82.7 16.52 92.0
May-15 1.16 91.1 3.68 95.7 8.75 94.3 0.60 92.6 2.44 83.0 16.61 92.5
Jun-15 1.18 92.7 3.71 96.6 8.91 95.5 0.61 94.7 2.53 86.2 16.94 94.0
Jul-15 1.19 93.6 3.82 99.3 8.89 95.0 0.62 95.4 2.66 90.6 17.18 95.1
Aug-15 1.20 94.0 3.64 94.7 8.83 94.3 0.62 94.6 2.68 91.4 16.96 93.9
Sep-15 1.06 83.5 3.48 89.8 8.58 91.3 0.60 92.5 2.67 91.1 16.39 90.4
Oct-15 1.13 89.0 3.01 77.5 8.39 89.4 0.61 92.9 2.55 87.1 15.69 86.6
Yr-on-Yr Chg. 0.2% -8.3% 3.2% 8.2% 0.5% 0.3%
% of Total1 7.2% 19.2% 53.5% 3.9% 16.3% 100.0%
NY Harbor Chicago US Gulf Los Angeles
(East Coast Comp.) (WTI) (WTS) (ANS)
2013 9.20 21.63 12.83 10.25
2014 8.62 16.57 11.76 8.68
2015 12.92 17.94 12.97 18.91
4Q 2014 9.85 13.81 7.28 5.02
1Q 2015 12.42 15.57 14.05 15.73
2Q 2015 17.81 18.79 15.02 21.83
3Q 2015 12.47 24.84 13.79 23.75
4Q 2015 8.98 12.54 9.02 14.33
Yr-on-Yr Chg. -8.8% -9.2% 23.8% 185.6%
Dec-14 10.82 6.61 4.01 2.14
Jan-15 10.14 6.45 10.11 3.71
Feb-15 13.35 17.85 15.52 21.14
Mar-15 13.76 22.41 16.51 22.35
Apr-15 12.22 16.73 14.22 20.81
May-15 19.58 19.79 14.96 28.22
Jun-15 21.63 19.84 15.87 16.46
Jul-15 12.74 23.51 16.50 33.40
Aug-15 14.54 30.64 15.80 22.98
Sep-15 10.13 20.37 9.07 14.88
Oct-15 7.03 19.61 9.08 14.45
Nov-15 9.83 10.00 9.25 13.00
Dec-15 10.08 8.02 8.72 15.54
Yr-on-Yr Chg. -6.8% 21.3% 117.5% 626.2%
Relevant • Independent • Objective
Page 21
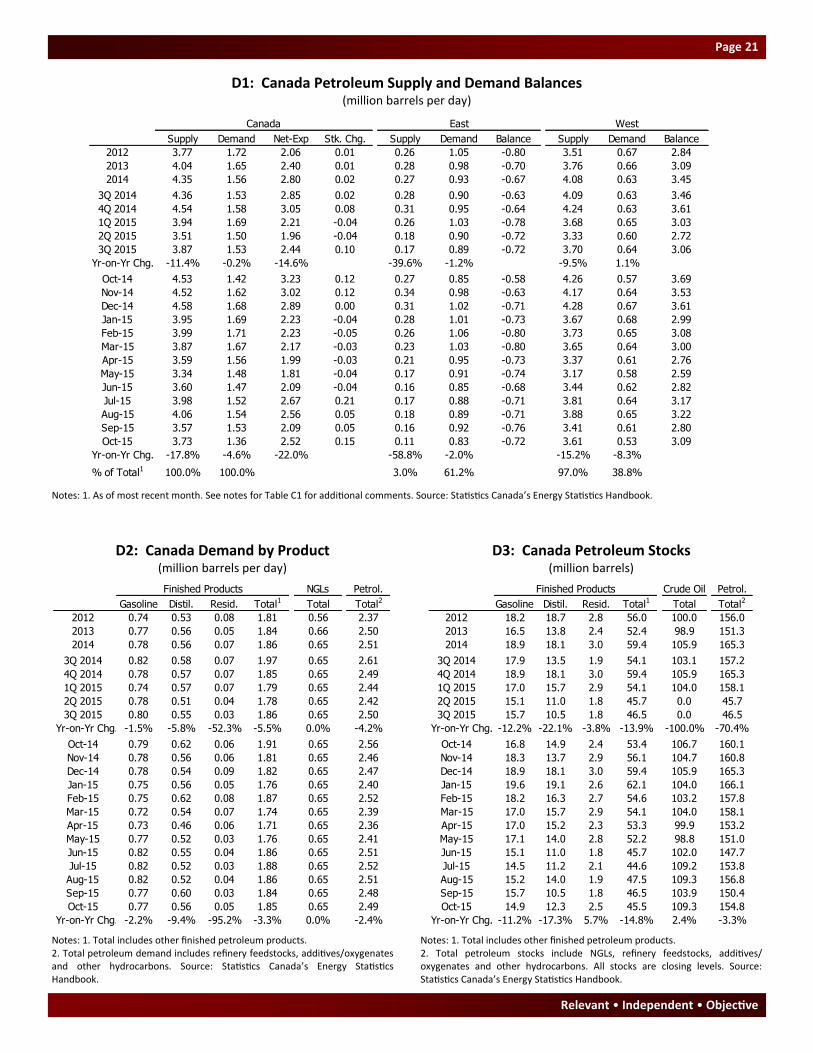
D1: Canada Petroleum Supply and Demand Balances (million barrels per day)
D2: Canada Demand by Product (million barrels per day)
Notes: 1. As of most recent month. See notes for Table C1 for additional comments. Source: Statistics Canada’s Energy Statistics Handbook.
D3: Canada Petroleum Stocks (million barrels)
Notes: 1. Total includes other finished petroleum products. 2. Total petroleum demand includes refinery feedstocks, additives/oxygenates and other hydrocarbons. Source: Statistics Canada’s Energy Statistics Handbook.
Notes: 1. Total includes other finished petroleum products. 2. Total petroleum stocks include NGLs, refinery feedstocks, additives/oxygenates and other hydrocarbons. All stocks are closing levels. Source: Statistics Canada’s Energy Statistics Handbook.
Canada East West
Supply Demand Net-Exp Stk. Chg. Supply Demand Balance Supply Demand Balance
2012 3.77 1.72 2.06 0.01 0.26 1.05 -0.80 3.51 0.67 2.84
2013 4.04 1.65 2.40 0.01 0.28 0.98 -0.70 3.76 0.66 3.09
2014 4.35 1.56 2.80 0.02 0.27 0.93 -0.67 4.08 0.63 3.45
3Q 2014 4.36 1.53 2.85 0.02 0.28 0.90 -0.63 4.09 0.63 3.46
4Q 2014 4.54 1.58 3.05 0.08 0.31 0.95 -0.64 4.24 0.63 3.61
1Q 2015 3.94 1.69 2.21 -0.04 0.26 1.03 -0.78 3.68 0.65 3.03
2Q 2015 3.51 1.50 1.96 -0.04 0.18 0.90 -0.72 3.33 0.60 2.72
3Q 2015 3.87 1.53 2.44 0.10 0.17 0.89 -0.72 3.70 0.64 3.06
Yr-on-Yr Chg. -11.4% -0.2% -14.6% -39.6% -1.2% -9.5% 1.1%
Oct-14 4.53 1.42 3.23 0.12 0.27 0.85 -0.58 4.26 0.57 3.69
Nov-14 4.52 1.62 3.02 0.12 0.34 0.98 -0.63 4.17 0.64 3.53
Dec-14 4.58 1.68 2.89 0.00 0.31 1.02 -0.71 4.28 0.67 3.61
Jan-15 3.95 1.69 2.23 -0.04 0.28 1.01 -0.73 3.67 0.68 2.99
Feb-15 3.99 1.71 2.23 -0.05 0.26 1.06 -0.80 3.73 0.65 3.08
Mar-15 3.87 1.67 2.17 -0.03 0.23 1.03 -0.80 3.65 0.64 3.00
Apr-15 3.59 1.56 1.99 -0.03 0.21 0.95 -0.73 3.37 0.61 2.76
May-15 3.34 1.48 1.81 -0.04 0.17 0.91 -0.74 3.17 0.58 2.59
Jun-15 3.60 1.47 2.09 -0.04 0.16 0.85 -0.68 3.44 0.62 2.82
Jul-15 3.98 1.52 2.67 0.21 0.17 0.88 -0.71 3.81 0.64 3.17
Aug-15 4.06 1.54 2.56 0.05 0.18 0.89 -0.71 3.88 0.65 3.22
Sep-15 3.57 1.53 2.09 0.05 0.16 0.92 -0.76 3.41 0.61 2.80
Oct-15 3.73 1.36 2.52 0.15 0.11 0.83 -0.72 3.61 0.53 3.09
Yr-on-Yr Chg. -17.8% -4.6% -22.0% -58.8% -2.0% -15.2% -8.3%
% of Total1 100.0% 100.0% 3.0% 61.2% 97.0% 38.8%
Finished Products NGLs Petrol.
Gasoline Distil. Resid. Total1 Total Total2
2012 0.74 0.53 0.08 1.81 0.56 2.37
2013 0.77 0.56 0.05 1.84 0.66 2.50
2014 0.78 0.56 0.07 1.86 0.65 2.51
3Q 2014 0.82 0.58 0.07 1.97 0.65 2.61
4Q 2014 0.78 0.57 0.07 1.85 0.65 2.49
1Q 2015 0.74 0.57 0.07 1.79 0.65 2.44
2Q 2015 0.78 0.51 0.04 1.78 0.65 2.42
3Q 2015 0.80 0.55 0.03 1.86 0.65 2.50
Yr-on-Yr Chg. -1.5% -5.8% -52.3% -5.5% 0.0% -4.2%
Oct-14 0.79 0.62 0.06 1.91 0.65 2.56
Nov-14 0.78 0.56 0.06 1.81 0.65 2.46
Dec-14 0.78 0.54 0.09 1.82 0.65 2.47
Jan-15 0.75 0.56 0.05 1.76 0.65 2.40
Feb-15 0.75 0.62 0.08 1.87 0.65 2.52
Mar-15 0.72 0.54 0.07 1.74 0.65 2.39
Apr-15 0.73 0.46 0.06 1.71 0.65 2.36
May-15 0.77 0.52 0.03 1.76 0.65 2.41
Jun-15 0.82 0.55 0.04 1.86 0.65 2.51
Jul-15 0.82 0.52 0.03 1.88 0.65 2.52
Aug-15 0.82 0.52 0.04 1.86 0.65 2.51
Sep-15 0.77 0.60 0.03 1.84 0.65 2.48
Oct-15 0.77 0.56 0.05 1.85 0.65 2.49
Yr-on-Yr Chg. -2.2% -9.4% -95.2% -3.3% 0.0% -2.4%
Finished Products Crude Oil Petrol.
Gasoline Distil. Resid. Total1 Total Total2
2012 18.2 18.7 2.8 56.0 100.0 156.0
2013 16.5 13.8 2.4 52.4 98.9 151.3
2014 18.9 18.1 3.0 59.4 105.9 165.3
3Q 2014 17.9 13.5 1.9 54.1 103.1 157.2
4Q 2014 18.9 18.1 3.0 59.4 105.9 165.3
1Q 2015 17.0 15.7 2.9 54.1 104.0 158.1
2Q 2015 15.1 11.0 1.8 45.7 0.0 45.7
3Q 2015 15.7 10.5 1.8 46.5 0.0 46.5
Yr-on-Yr Chg. -12.2% -22.1% -3.8% -13.9% -100.0% -70.4%
Oct-14 16.8 14.9 2.4 53.4 106.7 160.1
Nov-14 18.3 13.7 2.9 56.1 104.7 160.8
Dec-14 18.9 18.1 3.0 59.4 105.9 165.3
Jan-15 19.6 19.1 2.6 62.1 104.0 166.1
Feb-15 18.2 16.3 2.7 54.6 103.2 157.8
Mar-15 17.0 15.7 2.9 54.1 104.0 158.1
Apr-15 17.0 15.2 2.3 53.3 99.9 153.2
May-15 17.1 14.0 2.8 52.2 98.8 151.0
Jun-15 15.1 11.0 1.8 45.7 102.0 147.7
Jul-15 14.5 11.2 2.1 44.6 109.2 153.8
Aug-15 15.2 14.0 1.9 47.5 109.3 156.8
Sep-15 15.7 10.5 1.8 46.5 103.9 150.4
Oct-15 14.9 12.3 2.5 45.5 109.3 154.8
Yr-on-Yr Chg. -11.2% -17.3% 5.7% -14.8% 2.4% -3.3%
CERI Commodity Report - Crude Oil
Page 22
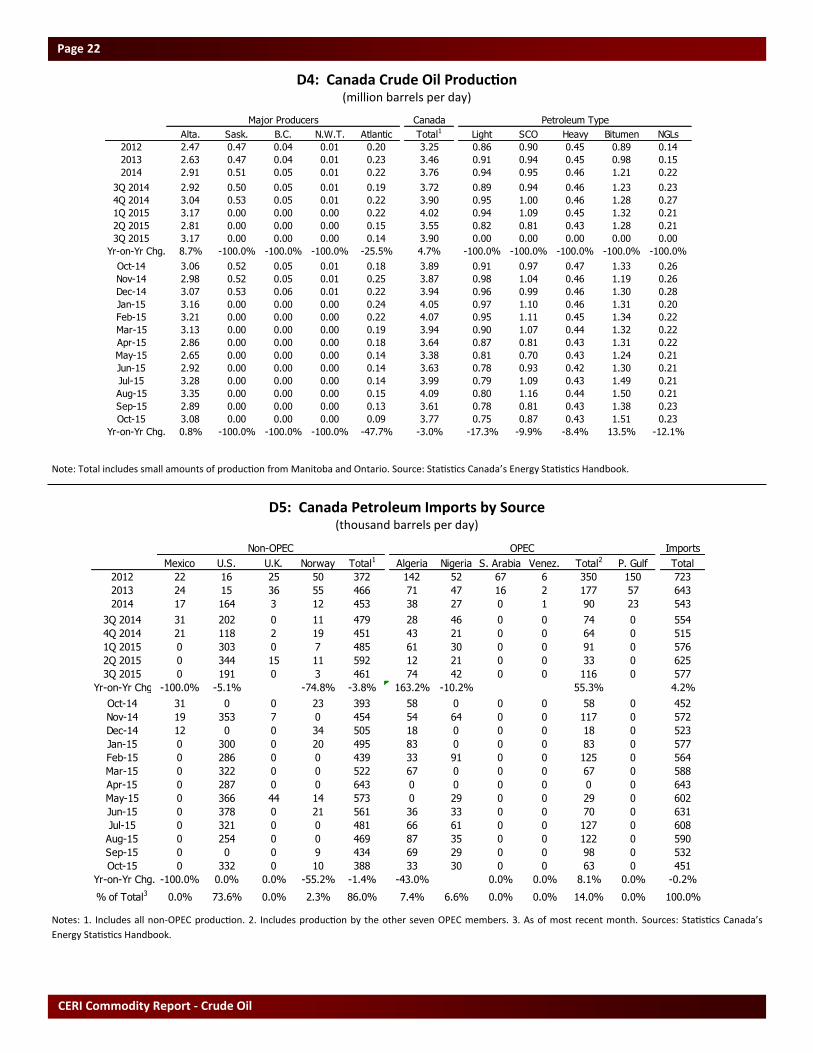
D4: Canada Crude Oil Production (million barrels per day)
Note: Total includes small amounts of production from Manitoba and Ontario. Source: Statistics Canada’s Energy Statistics Handbook.
D5: Canada Petroleum Imports by Source (thousand barrels per day)
Notes: 1. Includes all non-OPEC production. 2. Includes production by the other seven OPEC members. 3. As of most recent month. Sources: Statistics Canada’s
Energy Statistics Handbook.
Major Producers Canada Petroleum Type
Alta. Sask. B.C. N.W.T. Atlantic Total1 Light SCO Heavy Bitumen NGLs
2012 2.47 0.47 0.04 0.01 0.20 3.25 0.86 0.90 0.45 0.89 0.14
2013 2.63 0.47 0.04 0.01 0.23 3.46 0.91 0.94 0.45 0.98 0.15
2014 2.91 0.51 0.05 0.01 0.22 3.76 0.94 0.95 0.46 1.21 0.22
3Q 2014 2.92 0.50 0.05 0.01 0.19 3.72 0.89 0.94 0.46 1.23 0.23
4Q 2014 3.04 0.53 0.05 0.01 0.22 3.90 0.95 1.00 0.46 1.28 0.27
1Q 2015 3.17 0.00 0.00 0.00 0.22 4.02 0.94 1.09 0.45 1.32 0.21
2Q 2015 2.81 0.00 0.00 0.00 0.15 3.55 0.82 0.81 0.43 1.28 0.21
3Q 2015 3.17 0.00 0.00 0.00 0.14 3.90 0.00 0.00 0.00 0.00 0.00
Yr-on-Yr Chg. 8.7% -100.0% -100.0% -100.0% -25.5% 4.7% -100.0% -100.0% -100.0% -100.0% -100.0%
Oct-14 3.06 0.52 0.05 0.01 0.18 3.89 0.91 0.97 0.47 1.33 0.26
Nov-14 2.98 0.52 0.05 0.01 0.25 3.87 0.98 1.04 0.46 1.19 0.26
Dec-14 3.07 0.53 0.06 0.01 0.22 3.94 0.96 0.99 0.46 1.30 0.28
Jan-15 3.16 0.00 0.00 0.00 0.24 4.05 0.97 1.10 0.46 1.31 0.20
Feb-15 3.21 0.00 0.00 0.00 0.22 4.07 0.95 1.11 0.45 1.34 0.22
Mar-15 3.13 0.00 0.00 0.00 0.19 3.94 0.90 1.07 0.44 1.32 0.22
Apr-15 2.86 0.00 0.00 0.00 0.18 3.64 0.87 0.81 0.43 1.31 0.22
May-15 2.65 0.00 0.00 0.00 0.14 3.38 0.81 0.70 0.43 1.24 0.21
Jun-15 2.92 0.00 0.00 0.00 0.14 3.63 0.78 0.93 0.42 1.30 0.21
Jul-15 3.28 0.00 0.00 0.00 0.14 3.99 0.79 1.09 0.43 1.49 0.21
Aug-15 3.35 0.00 0.00 0.00 0.15 4.09 0.80 1.16 0.44 1.50 0.21
Sep-15 2.89 0.00 0.00 0.00 0.13 3.61 0.78 0.81 0.43 1.38 0.23
Oct-15 3.08 0.00 0.00 0.00 0.09 3.77 0.75 0.87 0.43 1.51 0.23
Yr-on-Yr Chg. 0.8% -100.0% -100.0% -100.0% -47.7% -3.0% -17.3% -9.9% -8.4% 13.5% -12.1%
Non-OPEC OPEC Imports
Mexico U.S. U.K. Norway Total1 Algeria Nigeria S. Arabia Venez. Total2 P. Gulf Total
2012 22 16 25 50 372 142 52 67 6 350 150 723
2013 24 15 36 55 466 71 47 16 2 177 57 643
2014 17 164 3 12 453 38 27 0 1 90 23 543
3Q 2014 31 202 0 11 479 28 46 0 0 74 0 554
4Q 2014 21 118 2 19 451 43 21 0 0 64 0 515
1Q 2015 0 303 0 7 485 61 30 0 0 91 0 576
2Q 2015 0 344 15 11 592 12 21 0 0 33 0 625
3Q 2015 0 191 0 3 461 74 42 0 0 116 0 577
Yr-on-Yr Chg. -100.0% -5.1% -74.8% -3.8% 163.2% -10.2% 55.3% 4.2%
Oct-14 31 0 0 23 393 58 0 0 0 58 0 452
Nov-14 19 353 7 0 454 54 64 0 0 117 0 572
Dec-14 12 0 0 34 505 18 0 0 0 18 0 523
Jan-15 0 300 0 20 495 83 0 0 0 83 0 577
Feb-15 0 286 0 0 439 33 91 0 0 125 0 564
Mar-15 0 322 0 0 522 67 0 0 0 67 0 588
Apr-15 0 287 0 0 643 0 0 0 0 0 0 643
May-15 0 366 44 14 573 0 29 0 0 29 0 602
Jun-15 0 378 0 21 561 36 33 0 0 70 0 631
Jul-15 0 321 0 0 481 66 61 0 0 127 0 608
Aug-15 0 254 0 0 469 87 35 0 0 122 0 590
Sep-15 0 0 0 9 434 69 29 0 0 98 0 532
Oct-15 0 332 0 10 388 33 30 0 0 63 0 451
Yr-on-Yr Chg. -100.0% 0.0% 0.0% -55.2% -1.4% -43.0% 0.0% 0.0% 8.1% 0.0% -0.2%
% of Total3 0.0% 73.6% 0.0% 2.3% 86.0% 7.4% 6.6% 0.0% 0.0% 14.0% 0.0% 100.0%
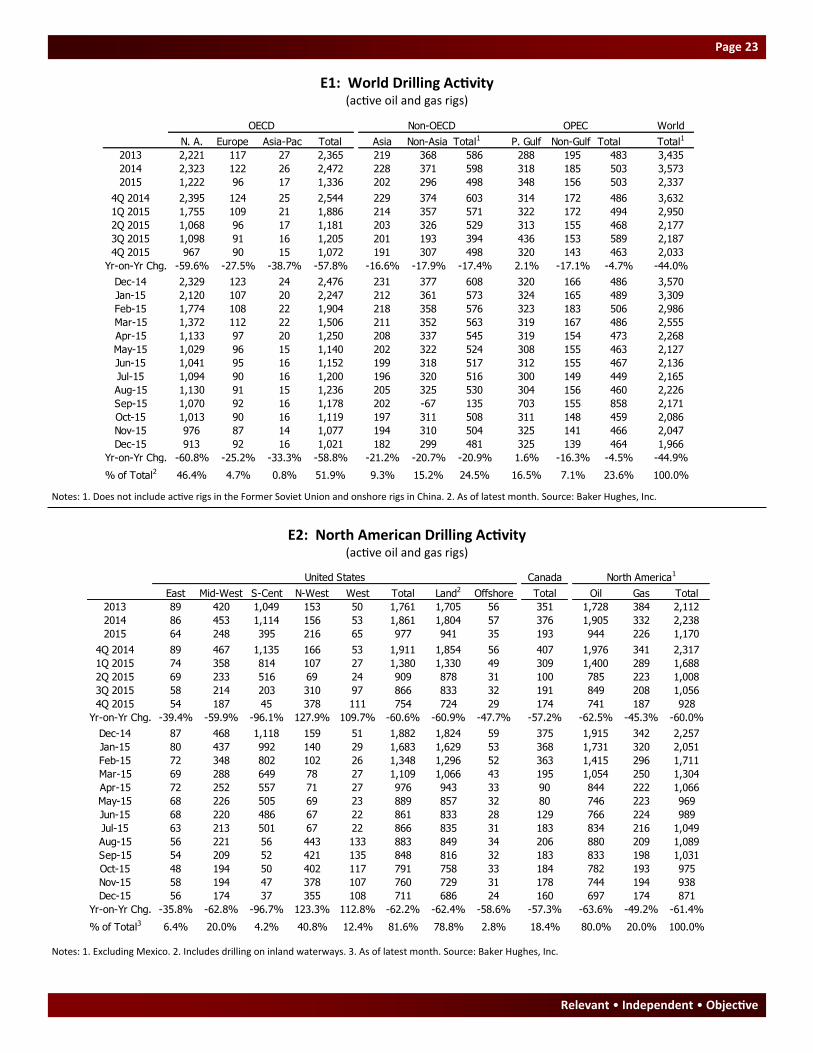
Relevant • Independent • Objective
Page 23
E1: World Drilling Activity (active oil and gas rigs)
Notes: 1. Does not include active rigs in the Former Soviet Union and onshore rigs in China. 2. As of latest month. Source: Baker Hughes, Inc.
E2: North American Drilling Activity (active oil and gas rigs)
Notes: 1. Excluding Mexico. 2. Includes drilling on inland waterways. 3. As of latest month. Source: Baker Hughes, Inc.
OECD Non-OECD OPEC World
N. A. Europe Asia-Pac Total Asia Non-Asia Total1 P. Gulf Non-Gulf Total Total1
2013 2,221 117 27 2,365 219 368 586 288 195 483 3,435
2014 2,323 122 26 2,472 228 371 598 318 185 503 3,573
2015 1,222 96 17 1,336 202 296 498 348 156 503 2,337
4Q 2014 2,395 124 25 2,544 229 374 603 314 172 486 3,632
1Q 2015 1,755 109 21 1,886 214 357 571 322 172 494 2,950
2Q 2015 1,068 96 17 1,181 203 326 529 313 155 468 2,177
3Q 2015 1,098 91 16 1,205 201 193 394 436 153 589 2,187
4Q 2015 967 90 15 1,072 191 307 498 320 143 463 2,033
Yr-on-Yr Chg. -59.6% -27.5% -38.7% -57.8% -16.6% -17.9% -17.4% 2.1% -17.1% -4.7% -44.0%
Dec-14 2,329 123 24 2,476 231 377 608 320 166 486 3,570
Jan-15 2,120 107 20 2,247 212 361 573 324 165 489 3,309
Feb-15 1,774 108 22 1,904 218 358 576 323 183 506 2,986
Mar-15 1,372 112 22 1,506 211 352 563 319 167 486 2,555
Apr-15 1,133 97 20 1,250 208 337 545 319 154 473 2,268
May-15 1,029 96 15 1,140 202 322 524 308 155 463 2,127
Jun-15 1,041 95 16 1,152 199 318 517 312 155 467 2,136
Jul-15 1,094 90 16 1,200 196 320 516 300 149 449 2,165
Aug-15 1,130 91 15 1,236 205 325 530 304 156 460 2,226
Sep-15 1,070 92 16 1,178 202 -67 135 703 155 858 2,171
Oct-15 1,013 90 16 1,119 197 311 508 311 148 459 2,086
Nov-15 976 87 14 1,077 194 310 504 325 141 466 2,047
Dec-15 913 92 16 1,021 182 299 481 325 139 464 1,966
Yr-on-Yr Chg. -60.8% -25.2% -33.3% -58.8% -21.2% -20.7% -20.9% 1.6% -16.3% -4.5% -44.9%
% of Total2 46.4% 4.7% 0.8% 51.9% 9.3% 15.2% 24.5% 16.5% 7.1% 23.6% 100.0%
United States Canada North America1
East Mid-West S-Cent N-West West Total Land2 Offshore Total Oil Gas Total
2013 89 420 1,049 153 50 1,761 1,705 56 351 1,728 384 2,112
2014 86 453 1,114 156 53 1,861 1,804 57 376 1,905 332 2,238
2015 64 248 395 216 65 977 941 35 193 944 226 1,170
4Q 2014 89 467 1,135 166 53 1,911 1,854 56 407 1,976 341 2,317
1Q 2015 74 358 814 107 27 1,380 1,330 49 309 1,400 289 1,688
2Q 2015 69 233 516 69 24 909 878 31 100 785 223 1,008
3Q 2015 58 214 203 310 97 866 833 32 191 849 208 1,056
4Q 2015 54 187 45 378 111 754 724 29 174 741 187 928
Yr-on-Yr Chg. -39.4% -59.9% -96.1% 127.9% 109.7% -60.6% -60.9% -47.7% -57.2% -62.5% -45.3% -60.0%
Dec-14 87 468 1,118 159 51 1,882 1,824 59 375 1,915 342 2,257
Jan-15 80 437 992 140 29 1,683 1,629 53 368 1,731 320 2,051
Feb-15 72 348 802 102 26 1,348 1,296 52 363 1,415 296 1,711
Mar-15 69 288 649 78 27 1,109 1,066 43 195 1,054 250 1,304
Apr-15 72 252 557 71 27 976 943 33 90 844 222 1,066
May-15 68 226 505 69 23 889 857 32 80 746 223 969
Jun-15 68 220 486 67 22 861 833 28 129 766 224 989
Jul-15 63 213 501 67 22 866 835 31 183 834 216 1,049
Aug-15 56 221 56 443 133 883 849 34 206 880 209 1,089
Sep-15 54 209 52 421 135 848 816 32 183 833 198 1,031
Oct-15 48 194 50 402 117 791 758 33 184 782 193 975
Nov-15 58 194 47 378 107 760 729 31 178 744 194 938
Dec-15 56 174 37 355 108 711 686 24 160 697 174 871
Yr-on-Yr Chg. -35.8% -62.8% -96.7% 123.3% 112.8% -62.2% -62.4% -58.6% -57.3% -63.6% -49.2% -61.4%
% of Total3 6.4% 20.0% 4.2% 40.8% 12.4% 81.6% 78.8% 2.8% 18.4% 80.0% 20.0% 100.0%
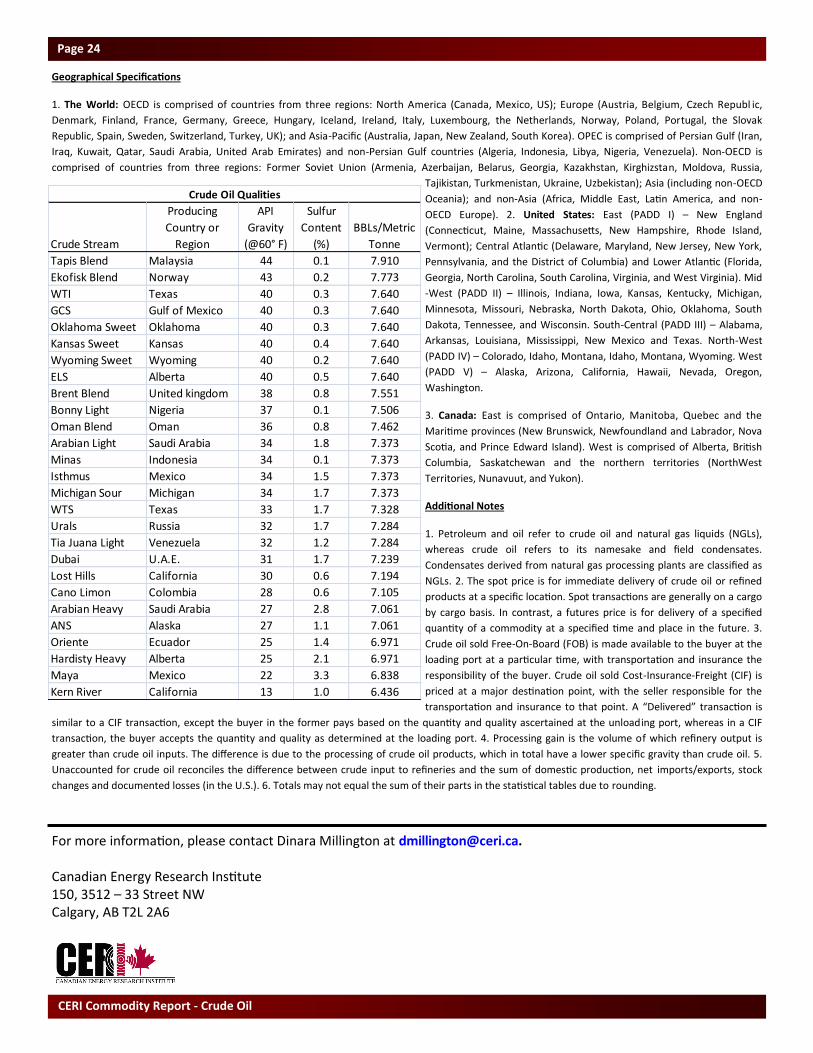
CERI Commodity Report - Crude Oil
Page 24
Geographical Specifications
1. The World: OECD is comprised of countries from three regions: North America (Canada, Mexico, US); Europe (Austria, Belgium, Czech Republ ic,
Denmark, Finland, France, Germany, Greece, Hungary, Iceland, Ireland, Italy, Luxembourg, the Netherlands, Norway, Poland, Portugal, the Slovak
Republic, Spain, Sweden, Switzerland, Turkey, UK); and Asia-Pacific (Australia, Japan, New Zealand, South Korea). OPEC is comprised of Persian Gulf (Iran,
Iraq, Kuwait, Qatar, Saudi Arabia, United Arab Emirates) and non-Persian Gulf countries (Algeria, Indonesia, Libya, Nigeria, Venezuela). Non-OECD is
comprised of countries from three regions: Former Soviet Union (Armenia, Azerbaijan, Belarus, Georgia, Kazakhstan, Kirghizstan, Moldova, Russia,
Tajikistan, Turkmenistan, Ukraine, Uzbekistan); Asia (including non-OECD
Oceania); and non-Asia (Africa, Middle East, Latin America, and non-
OECD Europe). 2. United States: East (PADD I) – New England
(Connecticut, Maine, Massachusetts, New Hampshire, Rhode Island,
Vermont); Central Atlantic (Delaware, Maryland, New Jersey, New York,
Pennsylvania, and the District of Columbia) and Lower Atlantic (Florida,
Georgia, North Carolina, South Carolina, Virginia, and West Virginia). Mid
-West (PADD II) – Illinois, Indiana, Iowa, Kansas, Kentucky, Michigan,
Minnesota, Missouri, Nebraska, North Dakota, Ohio, Oklahoma, South
Dakota, Tennessee, and Wisconsin. South-Central (PADD III) – Alabama,
Arkansas, Louisiana, Mississippi, New Mexico and Texas. North-West
(PADD IV) – Colorado, Idaho, Montana, Idaho, Montana, Wyoming. West
(PADD V) – Alaska, Arizona, California, Hawaii, Nevada, Oregon,
Washington.
3. Canada: East is comprised of Ontario, Manitoba, Quebec and the
Maritime provinces (New Brunswick, Newfoundland and Labrador, Nova
Scotia, and Prince Edward Island). West is comprised of Alberta, British
Columbia, Saskatchewan and the northern territories (NorthWest
Territories, Nunavuut, and Yukon).
Additional Notes
1. Petroleum and oil refer to crude oil and natural gas liquids (NGLs),
whereas crude oil refers to its namesake and field condensates.
Condensates derived from natural gas processing plants are classified as
NGLs. 2. The spot price is for immediate delivery of crude oil or refined
products at a specific location. Spot transactions are generally on a cargo
by cargo basis. In contrast, a futures price is for delivery of a specified
quantity of a commodity at a specified time and place in the future. 3.
Crude oil sold Free-On-Board (FOB) is made available to the buyer at the
loading port at a particular time, with transportation and insurance the
responsibility of the buyer. Crude oil sold Cost-Insurance-Freight (CIF) is
priced at a major destination point, with the seller responsible for the
transportation and insurance to that point. A “Delivered” transaction is
similar to a CIF transaction, except the buyer in the former pays based on the quantity and quality ascertained at the unloading port, whereas in a CIF
transaction, the buyer accepts the quantity and quality as determined at the loading port. 4. Processing gain is the volume of which refinery output is
greater than crude oil inputs. The difference is due to the processing of crude oil products, which in total have a lower specific gravity than crude oil. 5.
Unaccounted for crude oil reconciles the difference between crude input to refineries and the sum of domestic production, net imports/exports, stock
changes and documented losses (in the U.S.). 6. Totals may not equal the sum of their parts in the statistical tables due to rounding.
Crude Stream
Producing
Country or
Region
API
Gravity
(@60° F)
Sulfur
Content
(%)
BBLs/Metric
Tonne
Tapis Blend Malaysia 44 0.1 7.910
Ekofisk Blend Norway 43 0.2 7.773
WTI Texas 40 0.3 7.640
GCS Gulf of Mexico 40 0.3 7.640
Oklahoma Sweet Oklahoma 40 0.3 7.640
Kansas Sweet Kansas 40 0.4 7.640
Wyoming Sweet Wyoming 40 0.2 7.640
ELS Alberta 40 0.5 7.640
Brent Blend United kingdom 38 0.8 7.551
Bonny Light Nigeria 37 0.1 7.506
Oman Blend Oman 36 0.8 7.462
Arabian Light Saudi Arabia 34 1.8 7.373
Minas Indonesia 34 0.1 7.373
Isthmus Mexico 34 1.5 7.373
Michigan Sour Michigan 34 1.7 7.373
WTS Texas 33 1.7 7.328
Urals Russia 32 1.7 7.284
Tia Juana Light Venezuela 32 1.2 7.284
Dubai U.A.E. 31 1.7 7.239
Lost Hills California 30 0.6 7.194
Cano Limon Colombia 28 0.6 7.105
Arabian Heavy Saudi Arabia 27 2.8 7.061
ANS Alaska 27 1.1 7.061
Oriente Ecuador 25 1.4 6.971
Hardisty Heavy Alberta 25 2.1 6.971
Maya Mexico 22 3.3 6.838
Kern River California 13 1.0 6.436
Crude Oil Qualities
For more information, please contact Dinara Millington at [email protected]. Canadian Energy Research Institute 150, 3512 – 33 Street NW Calgary, AB T2L 2A6