November 2019 - Seeking Alpha
30
November 2019
Transcript of November 2019 - Seeking Alpha
November 2019

2
In keeping with the SEC's "Safe Harbor" guidelines, certain statements made during this presentation could be considered forward-looking and
subject to certain risks and uncertainties that could cause results to differ materially from those projected. When we use the words "will likely result,"
"may," "anticipate," "estimate," "should," "expect," "believe," "intend," or similar expressions, we intend to identify forward-looking statements. Such
forward-looking statements include, but are not limited to, our business and investment strategy, our understanding of our competition, current
market trends and opportunities, projected operating results, and projected capital expenditures.
These forward-looking statements are subject to known and unknown risks and uncertainties, which could cause actual results to differ materially
from those anticipated including, without limitation: general volatility of the capital markets and the market price of our common stock; changes in
our business or investment strategy; availability, terms and deployment of capital; availability of qualified personnel; changes in our industry and the
market in which we operate, interest rates or the general economy, the degree and nature of our competition, legislative and regulatory changes,
including changes to the Internal Revenue Code of 1986, as amended (the “Code”), and related rules, regulations and interpretations governing
the taxation of REITs; limitations imposed on our business and our ability to satisfy complex rules in order for us to qualify as a REIT for federal income
tax purposes; and risks related to Ashford Inc.’s ability to complete the acquisition of Remington’s hotel management business on the proposed
terms. These and other risk factors are more fully discussed in the company's filings with the Securities and Exchange Commission.
EBITDA is defined as net income before interest, taxes, depreciation and amortization. EBITDA yield is defined as trailing twelve month EBITDA divided
by the purchase price or debt amount. A capitalization rate is determined by dividing the property's net operating income by the purchase price.
Net operating income is the property's funds from operations minus a capital expense reserve of either 4% or 5% of gross revenues. Hotel EBITDA
flow-through is the change in Hotel EBITDA divided by the change in total revenues. EBITDA, FFO, AFFO, CAD and other terms are non-GAAP
measures, reconciliations of which have been provided in prior earnings releases and filings with the SEC or in the appendix to this presentation.
The calculation of implied equity value is derived from an estimated blended capitalization rate (“Cap Rate”) for the entire portfolio using the
capitalization rate method. The estimated Cap Rate is based on recent Cap Rates of publically traded peers involving a similar blend of asset types
found in the portfolio, which is then applied to Net Operating Income (“NOI”) of the company’s assets to calculate a Total Enterprise Value (“TEV”)
of the company. From the TEV, we deduct debt and preferred equity and then add back working capital and the company’s investment in Ashford
Inc. to derive an equity value.
The capitalization rate method is one of several valuation methods for estimating asset value and implied equity value. Among the limitations of
using the capitalization rate method for determining an implied equity value are that it does not take into account the potential change or
variability in future cash flows, potential significant future capital expenditures, the intended hold period of the asset, or a change in the future risk
profile of an asset.
This overview is for informational purposes only and is not an offer to sell, or a solicitation of an offer to buy or sell, any securities of Ashford Hospitality
Trust Inc. or any of its respective affiliates, and may not be relied upon in connection with the purchase or sale of any such security.
F o r wa r d L o o k i n g S t a t e m e n t s a n d N o n - G A A P M e a s u r e s

3
Portfolio consists primarily of upper upscale full-service hotels
INVESTMENT FOCUS
Widespread initiatives designed to enhance operational performance
ASSET MANAGEMENT
Provide competitive advantage intended to maximize value of our hotels
AFFILIATE COMPANIES
Financial expertise proven over multiple cycles
CAPITAL IMPLEMENTATION
Ashford Hospitality Trust
Provide an integrated value-add approach to optimize operating performance and maximize shareholder returns
A d v a n t a g e s
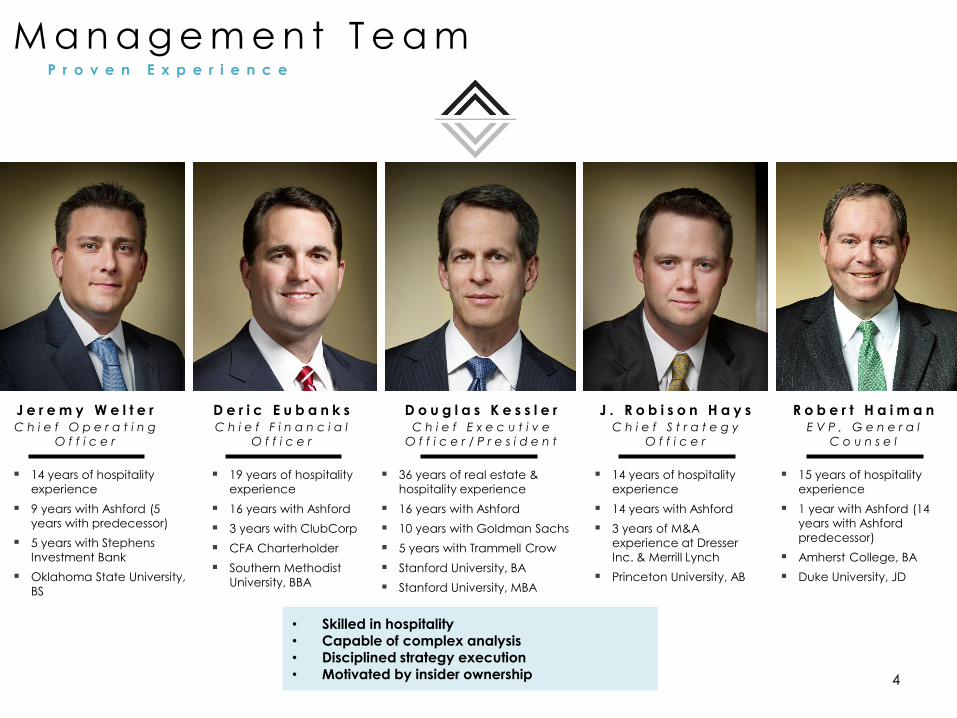
M a n a g e m e n t T e a m
R o b e r t H a i m a nE V P , G e n e r a l
C o u n s e l
15 years of hospitality
experience
1 year with Ashford (14
years with Ashford
predecessor)
Amherst College, BA
Duke University, JD
D e r i c E u b a n k sC h i e f F i n a n c i a l
O f f i c e r
19 years of hospitality
experience
16 years with Ashford
3 years with ClubCorp
CFA Charterholder
Southern Methodist
University, BBA
D o u g l a s K e s s l e rC h i e f E x e c u t i v e
O f f i c e r / P r e s i d e n t
36 years of real estate &
hospitality experience
16 years with Ashford
10 years with Goldman Sachs
5 years with Trammell Crow
Stanford University, BA
Stanford University, MBA
J . R o b i s o n H a y sC h i e f S t r a t e g y
O f f i c e r
14 years of hospitality
experience
14 years with Ashford
3 years of M&A
experience at Dresser
Inc. & Merrill Lynch
Princeton University, AB
J e r e m y W e l t e rC h i e f O p e r a t i n g
O f f i c e r
14 years of hospitality
experience
9 years with Ashford (5
years with predecessor)
5 years with Stephens
Investment Bank
Oklahoma State University,
BS
4
P r o v e n E x p e r i e n c e
• Skilled in hospitality• Capable of complex analysis• Disciplined strategy execution • Motivated by insider ownership

Aligned Management Team(2)
#1More insider ownership vs.
peer average
4.6xTotal Dollar Value of insider
ownership(3)
$60M
Peer Avg. includes: BHR, HT, APLE, CLDT, RLJ, PEB, INN, HST, DRH, SHO, XHR, PKSource: latest proxy, SNL
(1) Includes direct interests and interests of related parties(2) Based on insider ownership(3) Assumed stock price as of November 1, 2019
5
Insider Ownership“ T h i n k a n d A c t L i k e O w n e r s ”
17.4%
14.3%
10.6%
6.5%
3.8% 3.6%
2.3%1.7% 1.6% 1.3% 1.1% 1.0% 0.9% 0.5%
0%
2%
4%
6%
8%
10%
12%
14%
16%
18%
20%
AHT BHR HT APLE Peer Avg. CLDT INN RLJ XHR PEB HST SHO DRH PK(1) (1)
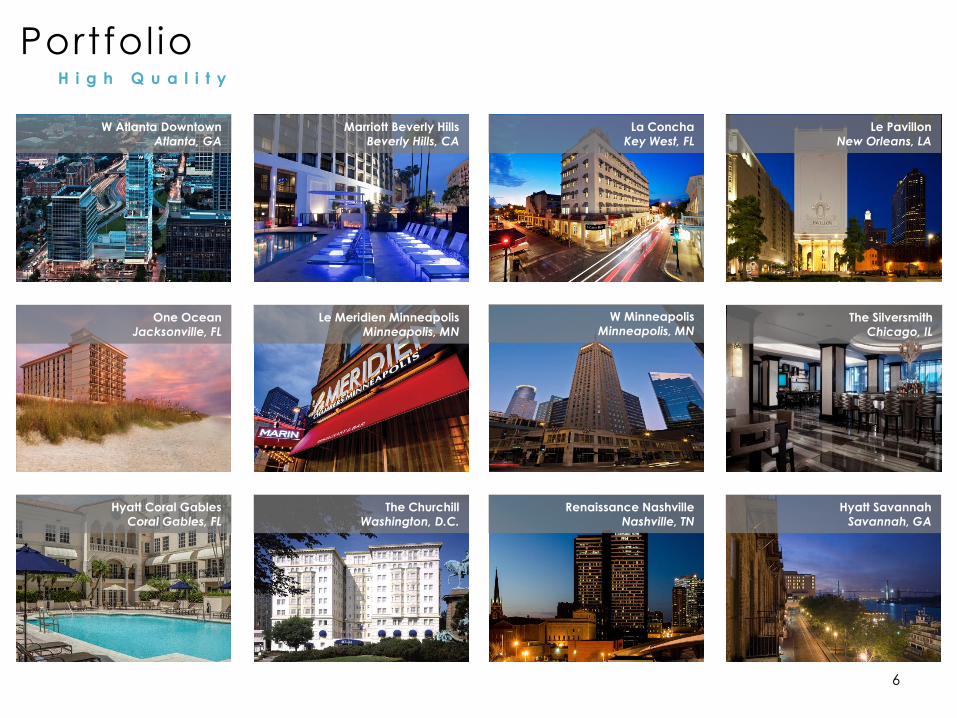
La Concha
Key West, FL
W Atlanta Downtown
Atlanta, GA
Marriott Beverly Hills
Beverly Hills, CA
Le Pavillon
New Orleans, LA
One Ocean
Jacksonville, FL
Le Meridien Minneapolis
Minneapolis, MN
W Minneapolis
Minneapolis, MNThe Silversmith
Chicago, IL
Hyatt Coral Gables
Coral Gables, FL
The Churchill
Washington, D.C.
Renaissance Nashville
Nashville, TN
Hyatt Savannah
Savannah, GA
Portfol ioH i g h Q u a l i t y
6
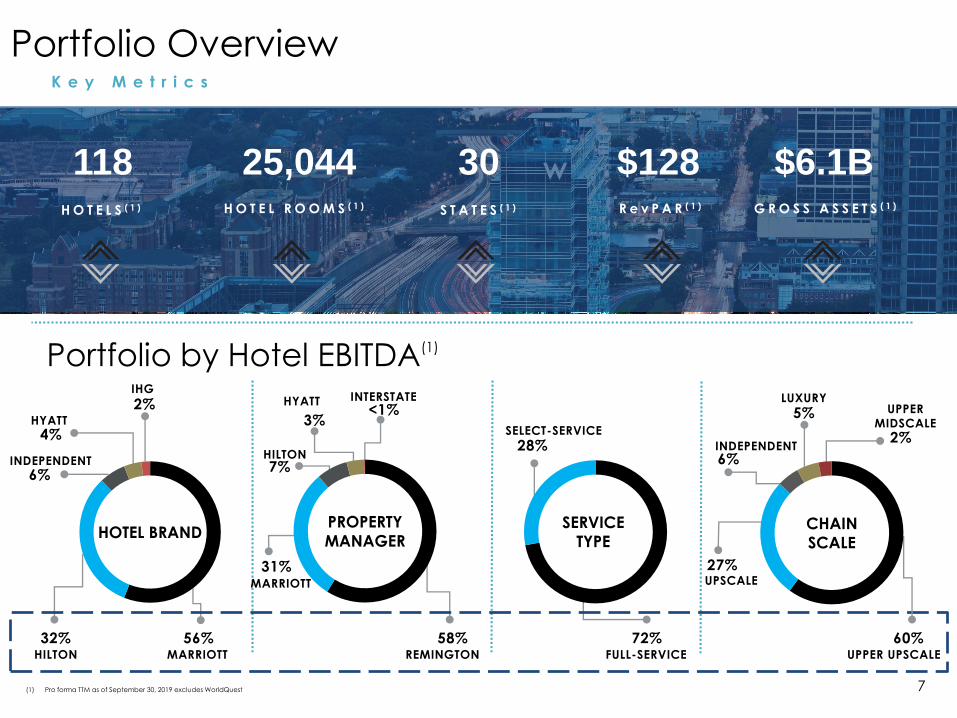
Portfolio Overview
Portfolio by Hotel EBITDA(1)
CHAIN
SCALE
UPPER UPSCALE
60%
UPSCALE
INDEPENDENT6%
LUXURY
5% UPPER
MIDSCALE
2%
REMINGTON
58%
31%
HILTON7%
HYATT
3%
INTERSTATE<1%
(1) Pro forma TTM as of September 30, 2019 excludes WorldQuest 7
K e y M e t r i c s
FULL-SERVICE
72%
SELECT-SERVICE
28%
SERVICE
TYPE
$6.1B118H O T E L S ( 1 )
30S T A T E S ( 1 )
25,044H O T E L R O O M S ( 1 )
$128R e v P A R ( 1 ) G R O S S A S S E T S ( 1 )
MARRIOTTHILTON
32%
INDEPENDENT
6%
HYATT
4%
IHG
2%
56%
MARRIOTT
27%
HOTEL BRANDPROPERTY
MANAGER
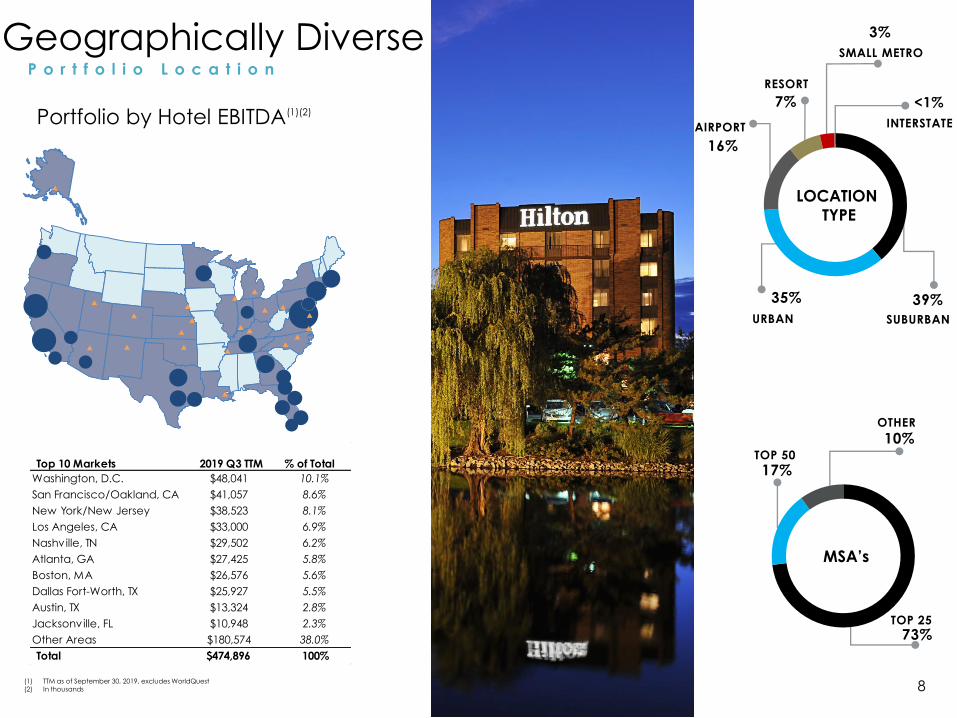
RESORT
16%
URBAN
35%
SUBURBAN
39%
AIRPORT INTERSTATE
7% <1%
3%
LOCATION
TYPE
TOP 25
73%
TOP 50
10%OTHER
17%
MSA’s
(1) TTM as of September 30, 2019, excludes WorldQuest(2) In thousands
Geographically DiverseP o r t f o l i o L o c a t i o n
Portfolio by Hotel EBITDA(1)(2)
8
SMALL METRO
Top 10 Markets 2019 Q3 TTM % of Total
Washington, D.C. $48,041 10.1%
San Francisco/Oakland, CA $41,057 8.6%
New York/New Jersey $38,523 8.1%
Los Angeles, CA $33,000 6.9%
Nashville, TN $29,502 6.2%
Atlanta, GA $27,425 5.8%
Boston, MA $26,576 5.6%
Dallas Fort-Worth, TX $25,927 5.5%
Austin, TX $13,324 2.8%
Jacksonville, FL $10,948 2.3%
Other Areas $180,574 38.0%
Total $474,896 100%

(1) Typical estimated select-service and full-service hotel revenue
9
Portfolio BenefitsC o m p a r a t i v e S e g m e n t s
ROOM REVENUE
98%
ALL OTHER REVENUE
~ 2%
ROOM REVENUE
66%
OTHER
DEPARTMENTS
FOOD
BEVERAGE
OTHER F&B
5%
4%
6%
19%
Select-Service:
28% of TTM EBITDA
• Operational efficiency
• Less CapEx per key
• High operating margins
• Higher initial yield
• Value consistency
• More revenue generators
• More variable costs to control
• Attractive RevPAR/yield
balance
• Asset repositioning
• Asset appreciation
Full-Service:
72% of TTM EBITDA
$-
$50,000
$100,000
$150,000
$200,000
$250,000
$300,000
$350,000
$400,000
2000
2001
2002
2003
2004
2005
2006
2007
2008
2009
2010
2011
2012
2013
2014
2015
2016
2017
2018
Average Price per Room:
Select-Service vs Full-Service
Full-Service Select-Service
SELECT-SERVICE(1) FULL-SERVICE(1) Source: STR

(1) 2018 hotel transactions from Real Capital Analytics (2) Source: STR. Estimate based upon MAR, HLT, H, and IHG branded rooms
~6.5% - 8.5%Estimated upper upscale cap rates
~41%Of total upper upscale rooms are franchised(2)
10
Transaction OpportunityS t r a t e g i c R a t i o n a l e
Value-Add Opportunity
Attractive Yield
DEAL FLOW(1)
FULL-SERVICE
(NON-LUXURY)
$21.3B
51%
LIMITED-SERVICE
$13.8B
33%
FULL-SERVICE
(LUXURY)
$6.6B
16%
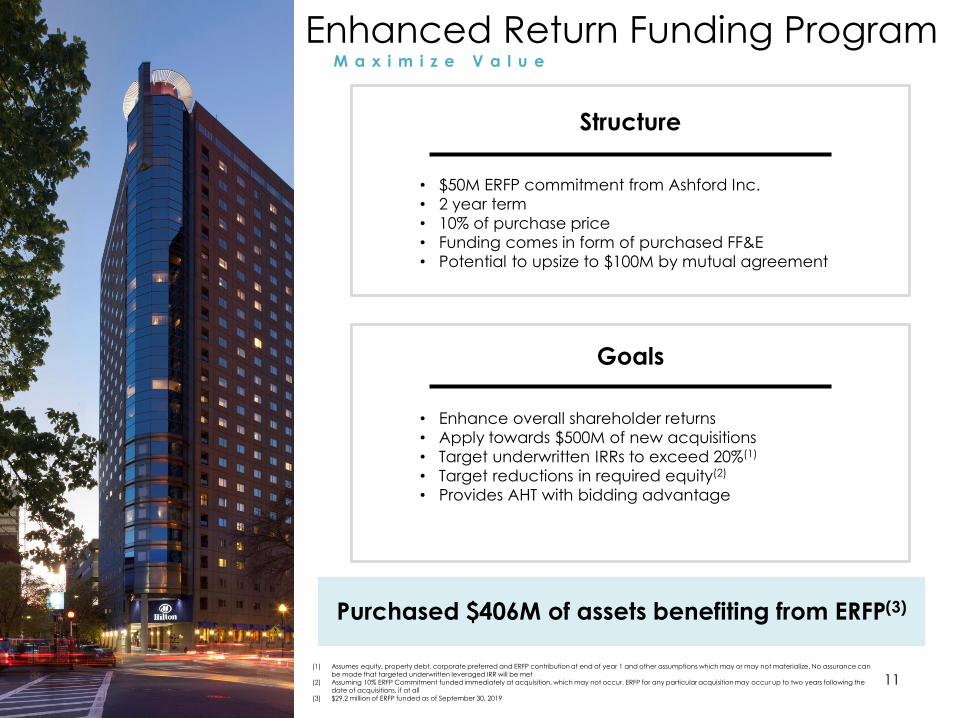
Enhanced Return Funding Program
• Enhance overall shareholder returns
• Apply towards $500M of new acquisitions
• Target underwritten IRRs to exceed 20%(1)
• Target reductions in required equity(2)
• Provides AHT with bidding advantage
(1) Assumes equity, property debt, corporate preferred and ERFP contribution at end of year 1 and other assumptions which may or may not materialize. No assurance can be made that targeted underwritten leveraged IRR will be met
(2) Assuming 10% ERFP Commitment funded immediately at acquisition, which may not occur. ERFP for any particular acquisition may occur up to two years following the date of acquisitions, if at all
(3) $29.2 million of ERFP funded as of September 30, 2019
11
• $50M ERFP commitment from Ashford Inc.
• 2 year term
• 10% of purchase price
• Funding comes in form of purchased FF&E
• Potential to upsize to $100M by mutual agreement
M a x i m i z e V a l u e
Purchased $406M of assets benefiting from ERFP(3)
Goals
Structure

Acquisition Price $50M
ERFP
Commitment$5.0M
Price Per Key(2) $287k
TTM RevPAR(3) $155
vs AHT RevPAR(5) +$30
FTM NOI Cap
Rate(1) 7.3%
Leveraged IRR(2) 28.1%
Acquisition Price $111M
ERFP
Commitment$11.1M
Price Per Key(2) $396k
TTM RevPAR(3) $161
vs AHT RevPAR(5) +$36
TTM NOI Cap
Rate(1) 8.3%
Leveraged IRR(2) 29.5%
H i l t o n A l e x a n d r i a
O l d T o w n
L a P o s a d a d e
S a n t a F e
(1) No assurance can be made that any company transaction or investment in the company will be profitable or achieve the desired returns(2) Underwritten leverage neutral IRR, assumes various levels of property level debt and/or corporate preferred, estimated cash flow and terminal value over a 5 year holding period, closing costs, and ERFP funding at the end of
year 1 - all of which may vary in amount or timing resulting in possibly better or worse returns. For purposes of calculating per key value, ERFP funding is assumed to have occurred at acquisition(3) As of May 30 2018; August 30, 2018; June 30, 2018 from left to right(4) T3 RevPAR as of December 31, 2018(5) From Comparable Portfolio RevPAR (i.e. $125 as of December 31, 2018)(6) Projected stabilization in Yr. 3
Acquisition Price $50M
ERFP
Commitment$5.0M
Price Per Key(2) $253k
TTM RevPAR(3) $149
vs AHT RevPAR(5) +$24
FTM NOI Cap
Rate(1) 8.5%
Leveraged IRR(2) 23.5%
H i l t o n S a n t a C r u z
S c o t t s V a l l e y
12
Acquisition Price $195M
ERFP
Commitment$19.5M
Price Per Key(2) $566k
T3 RevPAR(4) $254
vs AHT RevPAR(5) +$129
Stabilized NOI
Cap Rate(1)(6) 8.0%
Leveraged IRR(2) 23.0%
E m b a s s y S u i t e s
M a n h a t t a n
Acquisit ions Using ERFP“ M a k i n g G o o d D e a l s G r e a t ”
( 1 )
• Attractive RevPAR/yield
combination
• High margins
• Hilton Mgmt. – convertible
to franchise
• Favorable RevPAR/yield
combination
• Significant operational
synergies
• Only Marriott full-service
product
• Supply constrained
market
• Operational upside
• Leisure driven resort
market
• Excellent Midtown
Manhattan location
• Recently opened; no
material near term CapEx
• Only Embassy Suites in
Manhattan
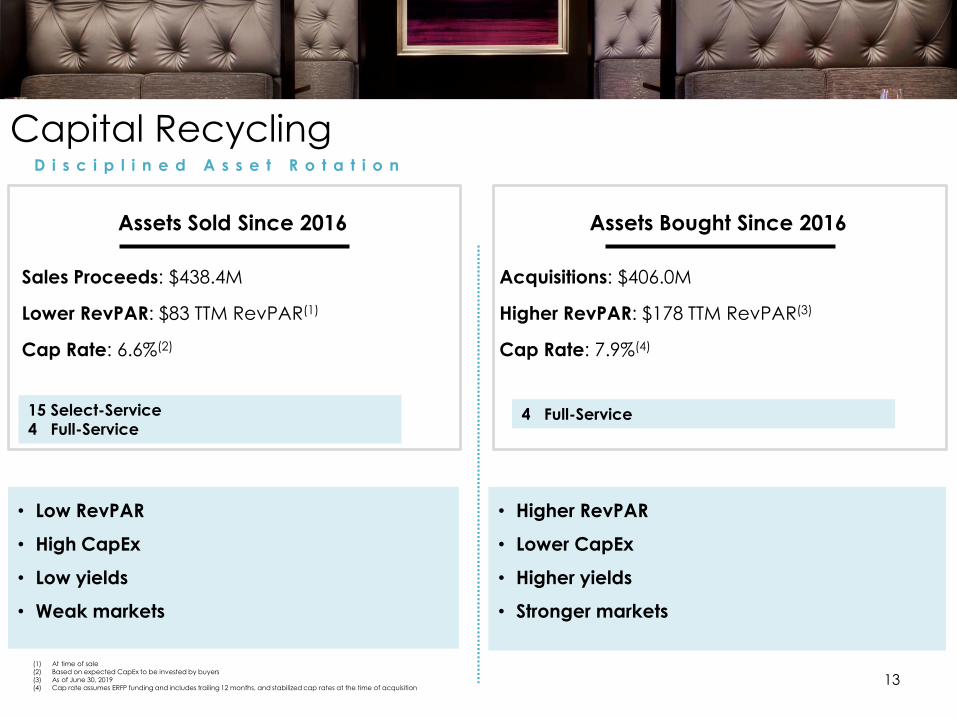
Assets Sold Since 2016
Capital Recycling
13
D i s c i p l i n e d A s s e t R o t a t i o n
Assets Bought Since 2016
Sales Proceeds: $438.4M
Lower RevPAR: $83 TTM RevPAR(1)
Cap Rate: 6.6%(2)
Acquisitions: $406.0M
Higher RevPAR: $178 TTM RevPAR(3)
Cap Rate: 7.9%(4)
(1) At time of sale(2) Based on expected CapEx to be invested by buyers(3) As of June 30, 2019(4) Cap rate assumes ERFP funding and includes trailing 12 months, and stabilized cap rates at the time of acquisition
• Low RevPAR
• High CapEx
• Low yields
• Weak markets
• Higher RevPAR
• Lower CapEx
• Higher yields
• Stronger markets
15 Select-Service
4 Full-Service4 Full-Service

2018 1.6% -2.6%
2017 -0.4% 1.0%
2016 3.2% 4.5%
2015 6.2% 9.0%
2014 11.6% 13.3%
Year Peers AHT
Outperformed Our Peers
Nearly 5 Out of the Last 6 Years
3.9%(1)
Peers CAGR
4.3%(1)
AHT CAGR
14
YTD 2019(2) 1.3% 1.6%
(1) Assumes 2019 YTD results finalize as YE results(2) YTD through June 2019Peer group: CHSP, DRH, INN, RLJ, SHO, HST, and HT
Portfol io PerformanceE B I T D A G r o w t h
Cumulative Outperformance: 350bps(1)

15
Asset EnhancementsA s s e t M a n a g e m e n t I n i t i a t i v e s
$96,285
$120,105
$175,159
$204,040
$221,960
$207,325
$121,746 10.2%
15.1%
13.1%
13.7%
15.4%
14.5%
10.6%
5.0%
7.0%
9.0%
11.0%
13.0%
15.0%
17.0%
$-
$25,000
$50,000
$75,000
$100,000
$125,000
$150,000
$175,000
$200,000
$225,000
$250,000
2013 2014 2015 2016 2017 2018 2019 Q3
YTD
Tho
usa
nd
s
Hotel CapEx Invested
Capex As % of Revenue
Capital Expenditures(2)
• ~75% of portfolio
• ~ $1.0 billion in CapEx
(1) Peer average includes: SHO, DRH, PEB, BHR, HT, INN, CLDT, RLJ, XHR, HST, PK, and APLE(2) Number of hotels as reported under renovation each quarter since 2014
Value Enhancing Initiatives
• Ancillary income
• Cost controls
• Rebranding
• Room additions
• Affiliate businesses
• Price/repositioning mix
Peer 3-Yr Average(1)
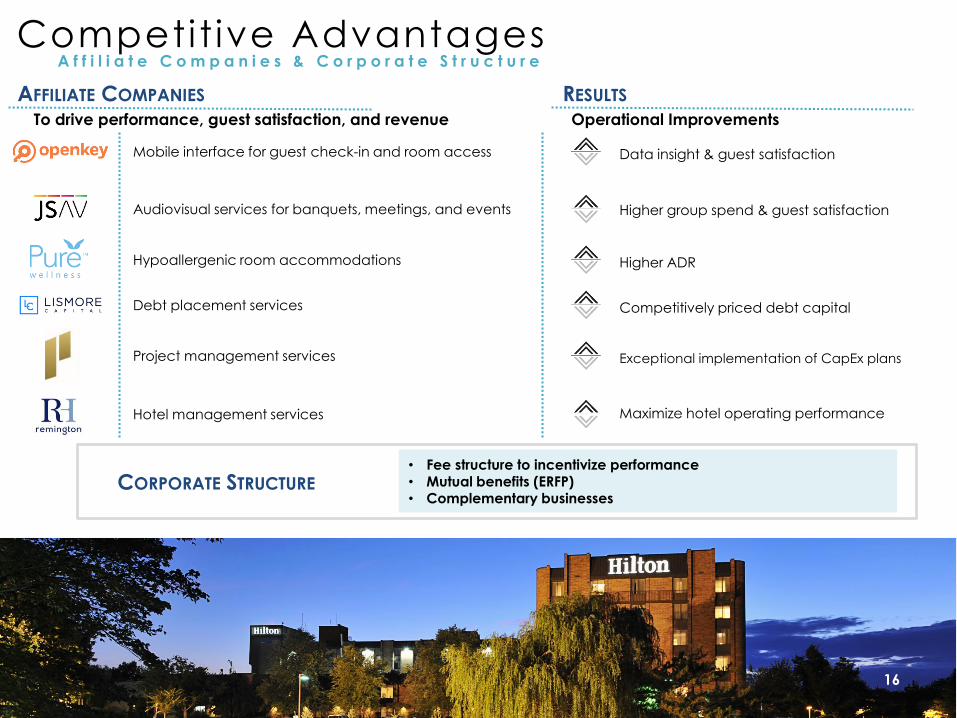
Mobile interface for guest check-in and room access
Audiovisual services for banquets, meetings, and events
Hypoallergenic room accommodations
Debt placement services
Competit ive AdvantagesA f f i l i a t e C o m p a n i e s & C o r p o r a t e S t r u c t u r e
16
AFFILIATE COMPANIES
To drive performance, guest satisfaction, and revenue
RESULTS
Operational Improvements
Project management services
Hotel management services
Data insight & guest satisfaction
Higher group spend & guest satisfaction
Competitively priced debt capital
Exceptional implementation of CapEx plans
Higher ADR
Maximize hotel operating performance
• Fee structure to incentivize performance• Mutual benefits (ERFP)• Complementary businesses
CORPORATE STRUCTURE

(1) TTM July 2018 vs. TTM July 2019(2) Assumed 7.5% cap rate
E s t i m a t e d A s s e t V a l u e A d d e d :
$ 1 1 . 6 M o r 2 3 . 1 % s i n c e A c q u i s i t i o n
17
Occupancy
7.6%
RevPAR
13.5%
ADR
5.5%
EBITDA
32.9%
• Eliminated unnecessary positions, saving ~$350K annually
• Created a new strategy for Group pricing
• Removed OTA promotions that were not producing a ROI
STRATEGY IMPLEMENTED
La Posada de Santa FeC a s e S t u d y – A c q u i s i t i o n
(1) (1)
(1) (1)
(1)(2)

Renovation
STRATEGY IMPLEMENTED
4
(1)
(1) Acquired hotel March 2011(2) TTM July 2019(3) Growth since YE 2010
• Eliminated low-rated market segments as demand grew
• Comprehensive meeting space renovation
• Extensive public space renovation with
reconceptualized restaurant and new 24-hour market
• Ranked Top-10 Meeting Hotel 2019 in the United States
by Cvent
(2)
18
Renaissance Nashvi l leC a s e S t u d y – L o n g T e r m G r o w t h
EBITDA Growth
+207.4%(3)
RevPAR Growth
+97.9%(3)
$100
$120
$140
$160
$180
$200
$9
$14
$19
$24
$29
2010 2011 2012 2013 2014 2015 2016 2017 2018 TTM
2019
Re
vP
AR
Mill
ion
s
EBITDA
RevPAR
Ac
qu
isitio
n

$17.0M +539.7% +75.5%
$110
$120
$130
$140
$150
$160
$170
$180
$190
$200
$2.0
$4.0
$6.0
$8.0
$10.0
$12.0
$14.0
2010 2011 2012 2013 2014 2015 2016 2017 2018 TTM
2019
Re
vP
AR
Mill
ion
s
EBITDA
RevPAR
• Focus on upselling suites and Ritz-Carlton Club rooms
• Guest satisfaction up 7.5% YTD compared to last year
• Targeted luxury consortia, gaining ~$300k YTD in revenue(4)
STRATEGY IMPLEMENTED
Guestroom Renovation
19
Renovation
(1) (2)
(1) Acquired hotel March 2011(2) TTM July 2019(3) Growth since YE 2010(4) YTD July 2019
EBITDA Growth(3) RevPAR Growth(3)
Ritz-Carlton AtlantaC a s e S t u d y – R e n o v a t i o n
Ac
qu
isitio
n

38
Incremental CapEx: $7.8M
Unleveraged IRR: 19.1%(1)
Incremental Value
Added: $16.4M or
15.4%(1)
Strategic Rebrand from Crowne Plaza to Autograph
(1) Assumed 6.0% cap rate(2) Upper Upscale and Luxury chain scales by room count. Source: STR
20
• Marriott has interest to increase brand presence, resulting in contribution of key money
• Opportunity to improve demand and RevPAR• Strengthens positon in high RevPAR market with
high barriers to entry
La Concha – Autograph Rebrand O p p o r t u n i t y – R e b r a n d i n g
Marriott in Top-25 Markets: 37%(2)
Marriott in Key West: 21%(2)
MARKET
7.5%NEW
COUPON
2017
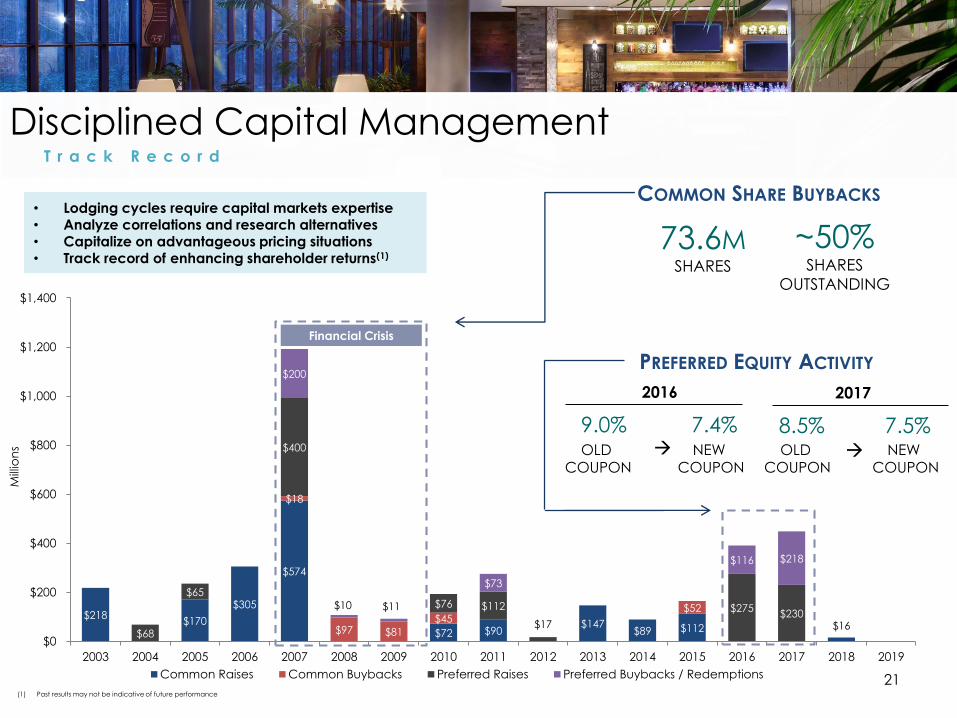
• Lodging cycles require capital markets expertise• Analyze correlations and research alternatives• Capitalize on advantageous pricing situations• Track record of enhancing shareholder returns(1)
21
Disciplined Capital ManagementT r a c k R e c o r d
$218 $170
$305
$574
$72 $90 $147
$89 $112 $16
$18
$97 $81
$45 $52
$68
$65
$400
$76 $112
$17
$275 $230
$200
$10 $11
$73
$116 $218
$0
$200
$400
$600
$800
$1,000
$1,200
$1,400
2003 2004 2005 2006 2007 2008 2009 2010 2011 2012 2013 2014 2015 2016 2017 2018 2019
Mill
ion
s
Common Raises Common Buybacks Preferred Raises Preferred Buybacks / Redemptions
Financial Crisis
(1) Past results may not be indicative of future performance
COMMON SHARE BUYBACKS
73.6MSHARES
~50%SHARES
OUTSTANDING
PREFERRED EQUITY ACTIVITY
9.0%
7.4%
2016
8.5%OLD
COUPONNEW
COUPONOLD
COUPON

• Promoted structure
• Diversification
• Accretive growth
• ROFOs
• Exit strategy optionality
Benefits
22
Potential Capital AccessO p p o r t u n i t y f o r G r o w t h
Investor
5%-20% (GP) 80%-95% (LP)
Incentive Fees
• Institutional
• Private Equity
• Family Office
Joint Venture
• Asset
• Portfolio
• Fund
• Access lower cost alternative capital
• Maintain transaction pipeline
Rationale
23
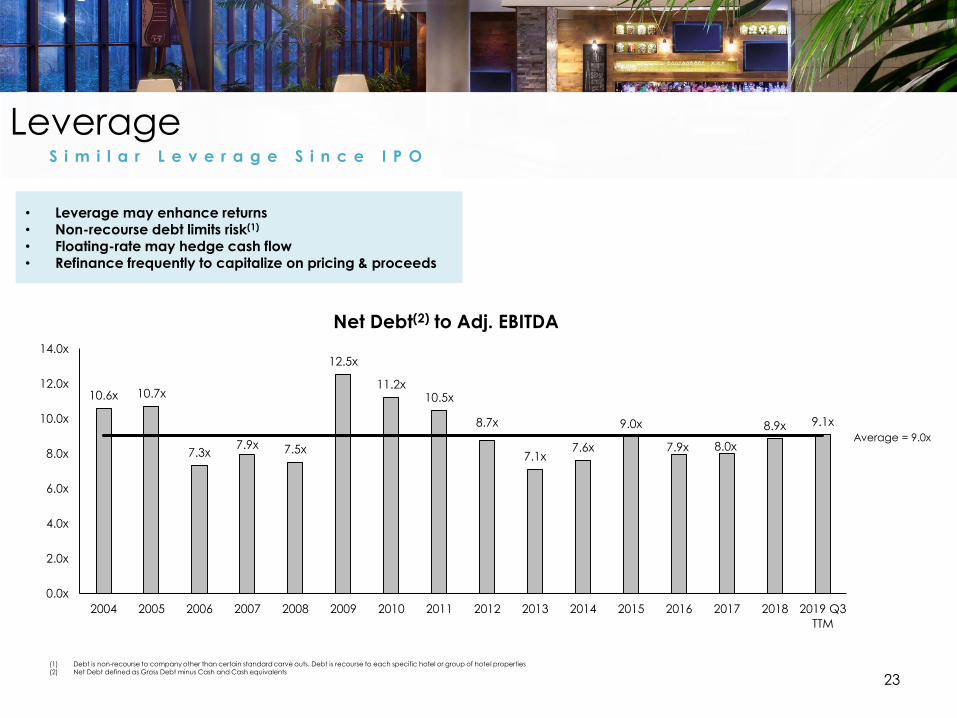
LeverageS i m i l a r L e v e r a g e S i n c e I P O
10.6x 10.7x
7.3x7.9x 7.5x
12.5x
11.2x10.5x
8.7x
7.1x7.6x
9.0x
7.9x 8.0x
8.9x 9.1x
0.0x
2.0x
4.0x
6.0x
8.0x
10.0x
12.0x
14.0x
2004 2005 2006 2007 2008 2009 2010 2011 2012 2013 2014 2015 2016 2017 2018 2019 Q3
TTM
Net Debt(2) to Adj. EBITDA
• Leverage may enhance returns• Non-recourse debt limits risk(1)
• Floating-rate may hedge cash flow• Refinance frequently to capitalize on pricing & proceeds
Average = 9.0x
(1) Debt is non-recourse to company other than certain standard carve outs. Debt is recourse to each specific hotel or group of hotel properties(2) Net Debt defined as Gross Debt minus Cash and Cash equivalents
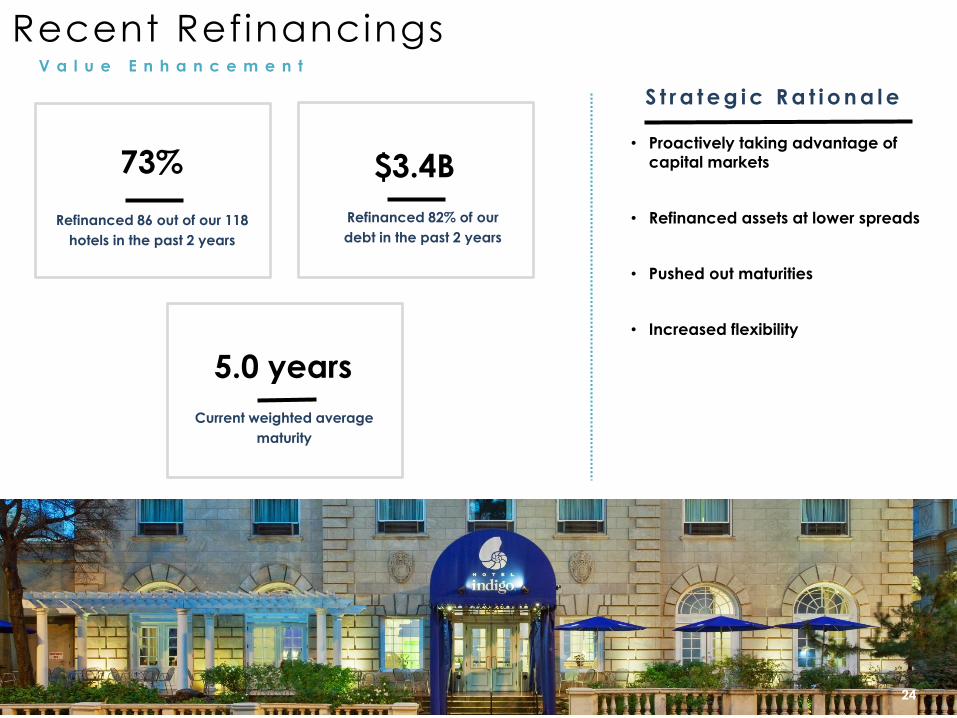
Recent RefinancingsV a l u e E n h a n c e m e n t
Refinanced 82% of our
debt in the past 2 years
73%
S t r a t e g i c R a t i o n a l e
• Proactively taking advantage of
capital markets
24
Current weighted average
maturity
Refinanced 86 out of our 118
hotels in the past 2 years
$3.4B
5.0 years
• Refinanced assets at lower spreads
• Pushed out maturities
• Increased flexibility

Debt Maturity Schedule ( 1 )
W e l l - L a d d e r e d
25
Total Portfolio Weighed Average Rate
5.3%Floating rate debt
91.2%
$92.5 $52.3 $219.5 $223.0
$113.1
$98.5
$3,328.5
$0
$500
$1,000
$1,500
$2,000
$2,500
$3,000
$3,500
$4,000
2019 2020 2021 2022 2023 Thereafter
Mill
ion
s
Fixed-Rate Floating-Rate
(1) As of September 30, 2019. Assumes extension options are exercised. Certain loans may require the company to partially pay down loan balances in order to exercise extensions
(2) Debt is non-recourse to company other than certain standard carve outs.
• Predominantly floating rate
• Attractive maturity schedule
• All non-recourse to the company(2)
Only 14% of debt maturing
through 2023
Weighted Average Maturity
5.0
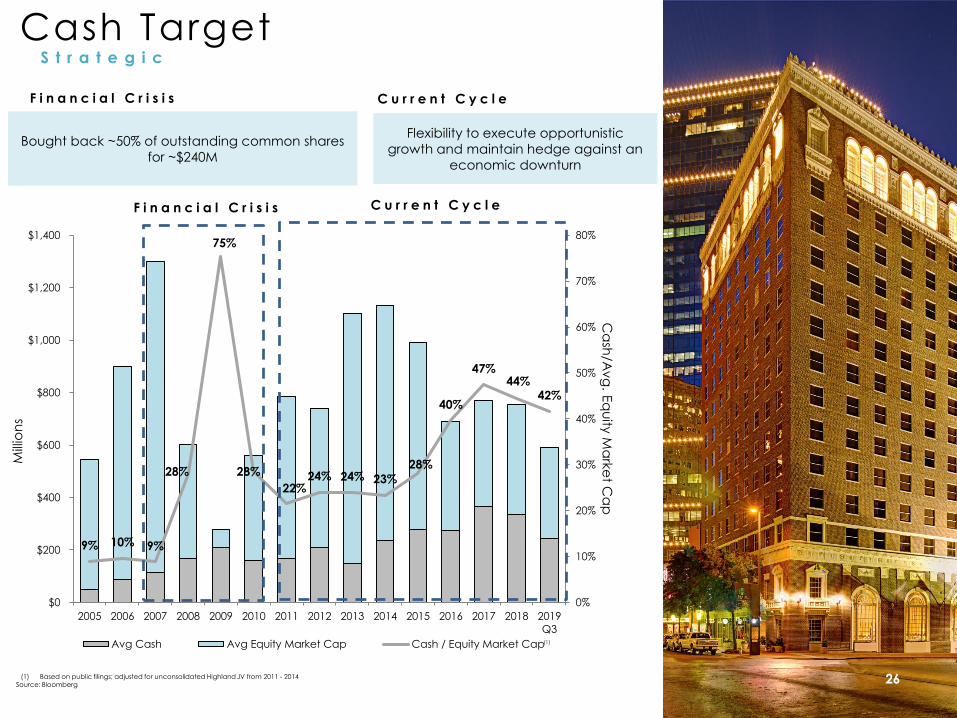
Cash TargetS t r a t e g i c
(1) Based on public filings; adjusted for unconsolidated Highland JV from 2011 - 2014Source: Bloomberg
F i n a n c i a l C r i s i s C u r r e n t C y c l e
Bought back ~50% of outstanding common shares
for ~$240M
Flexibility to execute opportunistic
growth and maintain hedge against an
economic downturn
F i n a n c i a l C r i s i s C u r r e n t C y c l e
26
(1)
9% 10% 9%
28%
75%
28%
22%24% 24% 23%
28%
40%
47%44%
42%
0%
10%
20%
30%
40%
50%
60%
70%
80%
$0
$200
$400
$600
$800
$1,000
$1,200
$1,400
2005 2006 2007 2008 2009 2010 2011 2012 2013 2014 2015 2016 2017 2018 2019
Q3
Ca
sh/A
vg
. Eq
uity
Ma
rke
t Ca
p
Mill
ion
s
Avg Cash Avg Equity Market Cap Cash / Equity Market Cap
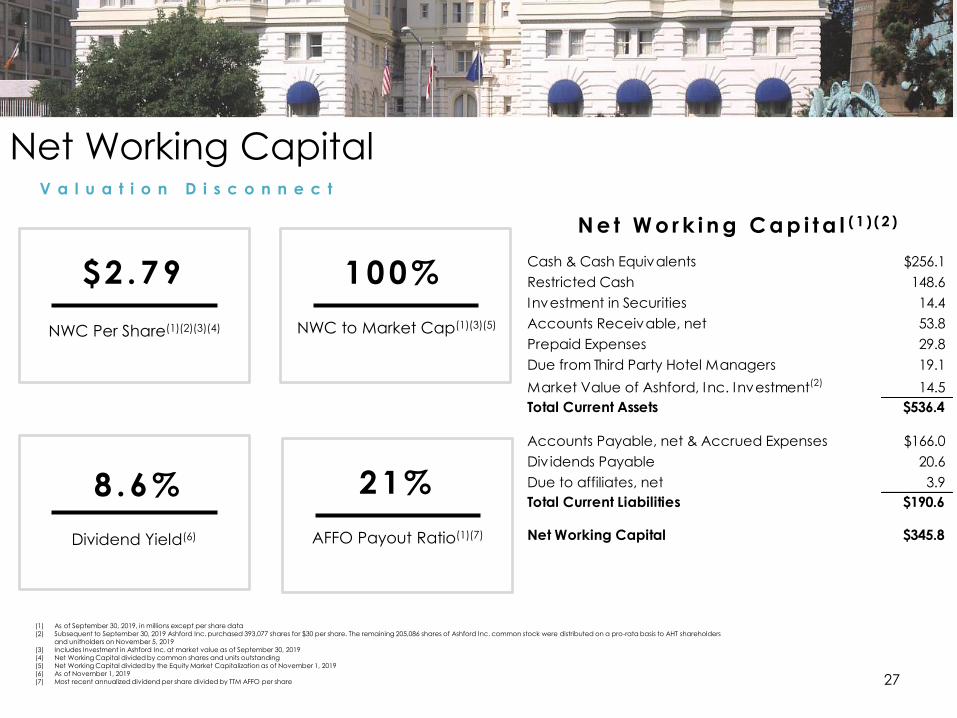
NWC Per Share(1)(2)(3)(4)
$2 .79
NWC to Market Cap(1)(3)(5)
100%
Dividend Yield(6)
8 .6%
N e t W o r k i n g C a p i t a l ( 1 ) ( 2 )
Net Working CapitalV a l u a t i o n D i s c o n n e c t
(1) As of September 30, 2019, in millions except per share data(2) Subsequent to September 30, 2019 Ashford Inc. purchased 393,077 shares for $30 per share. The remaining 205,086 shares of Ashford Inc. common stock were distributed on a pro-rata basis to AHT shareholders
and unitholders on November 5, 2019(3) Includes Investment in Ashford Inc. at market value as of September 30, 2019(4) Net Working Capital divided by common shares and units outstanding(5) Net Working Capital divided by the Equity Market Capitalization as of November 1, 2019(6) As of November 1, 2019(7) Most recent annualized dividend per share divided by TTM AFFO per share 27
AFFO Payout Ratio(1)(7)
21%
Cash & Cash Equivalents $256.1
Restricted Cash 148.6
Investment in Securities 14.4
Accounts Receivable, net 53.8
Prepaid Expenses 29.8
Due from Third Party Hotel Managers 19.1
Market Value of Ashford, Inc. Investment(2) 14.5
Total Current Assets $536.4
Accounts Payable, net & Accrued Expenses $166.0
Div idends Payable 20.6
Due to affiliates, net 3.9
Total Current Liabilities $190.6
Net Working Capital $345.8
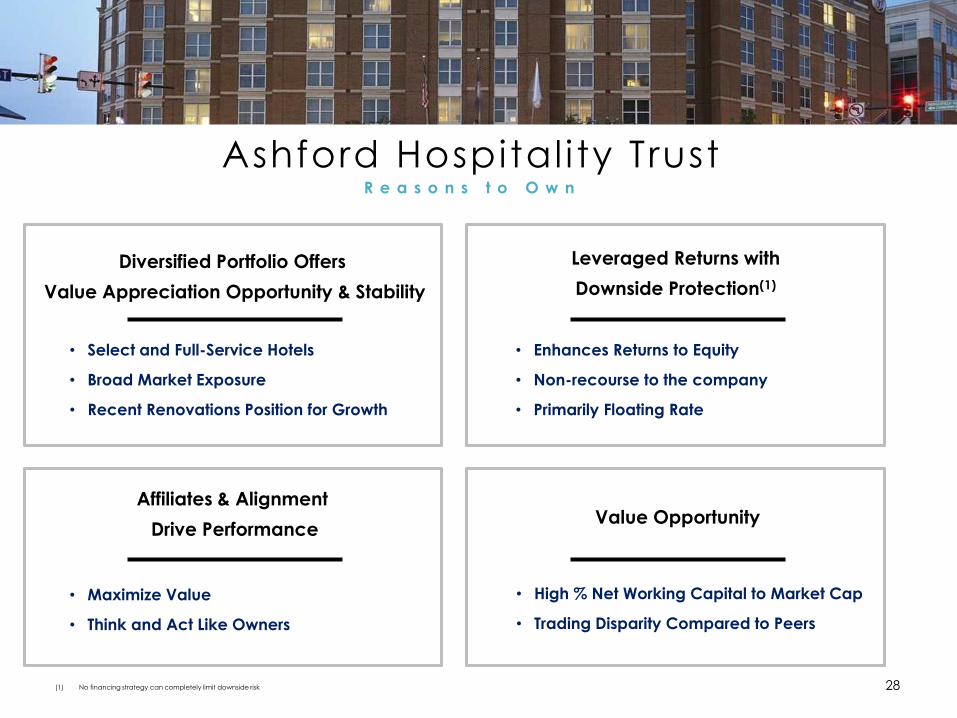
Ashford Hospital i ty Trust
28
R e a s o n s t o O w n
• Select and Full-Service Hotels
• Broad Market Exposure
• Recent Renovations Position for Growth
Diversified Portfolio Offers
Value Appreciation Opportunity & Stability
• High % Net Working Capital to Market Cap
• Trading Disparity Compared to Peers
Value Opportunity
Leveraged Returns with
Downside Protection(1)
• Enhances Returns to Equity
• Non-recourse to the company
• Primarily Floating Rate
Affiliates & Alignment
Drive Performance
• Maximize Value
• Think and Act Like Owners
(1) No financing strategy can completely limit downside risk

APPENDIX
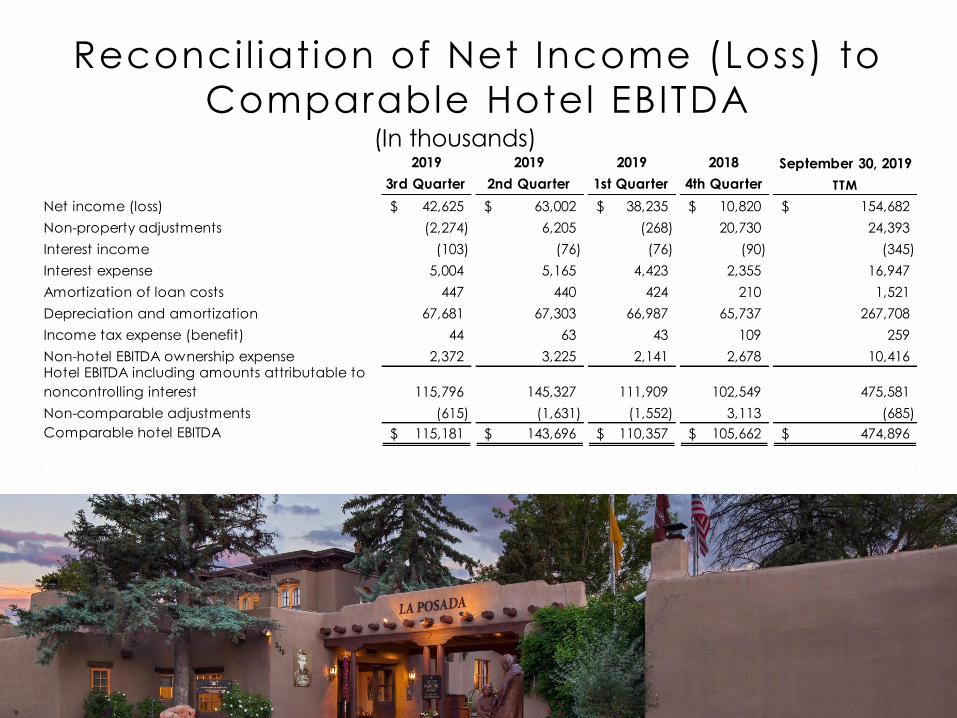
Reconci l iation of Net Income (Loss) to
Comparable Hotel EBITDA(In thousands)
2019 2019 2019 2018 September 30, 2019
3rd Quarter 2nd Quarter 1st Quarter 4th Quarter TTM
Net income (loss) 42,625$ 63,002$ 38,235$ 10,820$ 154,682$
Non-property adjustments (2,274) 6,205 (268) 20,730 24,393
Interest income (103) (76) (76) (90) (345)
Interest expense 5,004 5,165 4,423 2,355 16,947
Amortization of loan costs 447 440 424 210 1,521
Depreciation and amortization 67,681 67,303 66,987 65,737 267,708
Income tax expense (benefit) 44 63 43 109 259
Non-hotel EBITDA ownership expense 2,372 3,225 2,141 2,678 10,416Hotel EBITDA including amounts attributable to
noncontrolling interest 115,796 145,327 111,909 102,549 475,581
Non-comparable adjustments (615) (1,631) (1,552) 3,113 (685)
Comparable hotel EBITDA 115,181$ 143,696$ 110,357$ 105,662$ 474,896$