November 2018 Trupanion · November 2018 Trupanion Investor Presentation. This presentation...
23
November 2018 Trupanion Investor Presentation
Transcript of November 2018 Trupanion · November 2018 Trupanion Investor Presentation. This presentation...

November 2018
TrupanionInvestor Presentation
This presentation contains forward-looking statements within the meaning of Section 27A of the Securities Act of 1933 and Section 21E of the Securities Exchange Act of 1934 relating to, among other things, expectations, plans, prospects and financial results for Trupanion, including, but not limited to, its expectations regarding its ability to execute its business plans. These forward-looking statements are based upon the current expectations and beliefs of Trupanion’s management as of the date of this presentation, and are subject to certain risks and uncertainties that could cause actual results to differ materially from those described in the forward-looking statements. All forward-looking statements made in this presentation are based on information available to Trupanion as of the date hereof, and Trupanion has no obligation to update these forward-looking statements.
In particular, the following factors, among others, could cause results to differ materially from those expressed or implied by such forward-looking statements: the ability to achieve or maintain profitability and/or appropriate levels of cash flow in future periods; the ability to keep growing our membership base and revenue; the accuracy of assumptions used in determining appropriate member acquisition expenditures; the severity and frequency of claims; the ability to maintain high retention rates; the accuracy of assumptions used in pricing medical plan subscriptions and the ability to accurately estimate the impact of new products or offerings on claims frequency; actual claims expense exceeding estimates; regulatory and other constraints on the ability to institute, or the decision to otherwise delay, pricing modifications in response to changes in actual or estimated claims expense; the effectiveness and statutory or regulatory compliance of our Territory Partner model and of our Territory Partners, veterinarians and other third parties in recommending medical plan subscriptions to potential members; the ability to retain existing Territory Partners and increase the number of Territory Partners and active hospitals; compliance by us and those referring us members with laws and regulations that apply to our business, including the sale of a pet medical plan; the ability to maintain the security of our data; fluctuations in currency exchange rates; the ability to protect our proprietary and member information; the ability to maintain our culture and team, including key personnel; the ability to maintain the requisite amount of risk-based capital; our ability to implement and maintain effective controls, including over financial reporting; the ability to protect and enforce Trupanion’s intellectual property rights; the ability to continue key contractual relationships with third parties; third-party claims including litigation and regulatory actions; and the ability to recognize benefits from investments in new solutions and enhancements to Trupanion’s technology platform and website.
For a detailed discussion of these and other cautionary statements, please refer to the risk factors discussed in filings with the Securities and Exchange Commission (SEC), including but not limited to, Trupanion’s Annual Report on Form 10-K for the year ended December 31, 2017 and any subsequently filed reports on Forms 10-Q and 8-K. All documents are available through the SEC’s Electronic Data Gathering Analysis and Retrieval system at www.sec.gov or the Investor Relations section of Trupanion’s website at http://investors.trupanion.com.
In addition to U.S. GAAP financials, this presentation includes certain non-GAAP financial measures. These non-GAAP measures are in addition to, not a substitute for or superior to, measures of financial performance prepared in accordance with U.S. GAAP. A reconciliation of non-GAAP financial measures to the corresponding GAAP measures is provided on our Investor Relations website.

Our Mission
Our mission is to help
the pets we all love
receive the best
veterinary care.
3
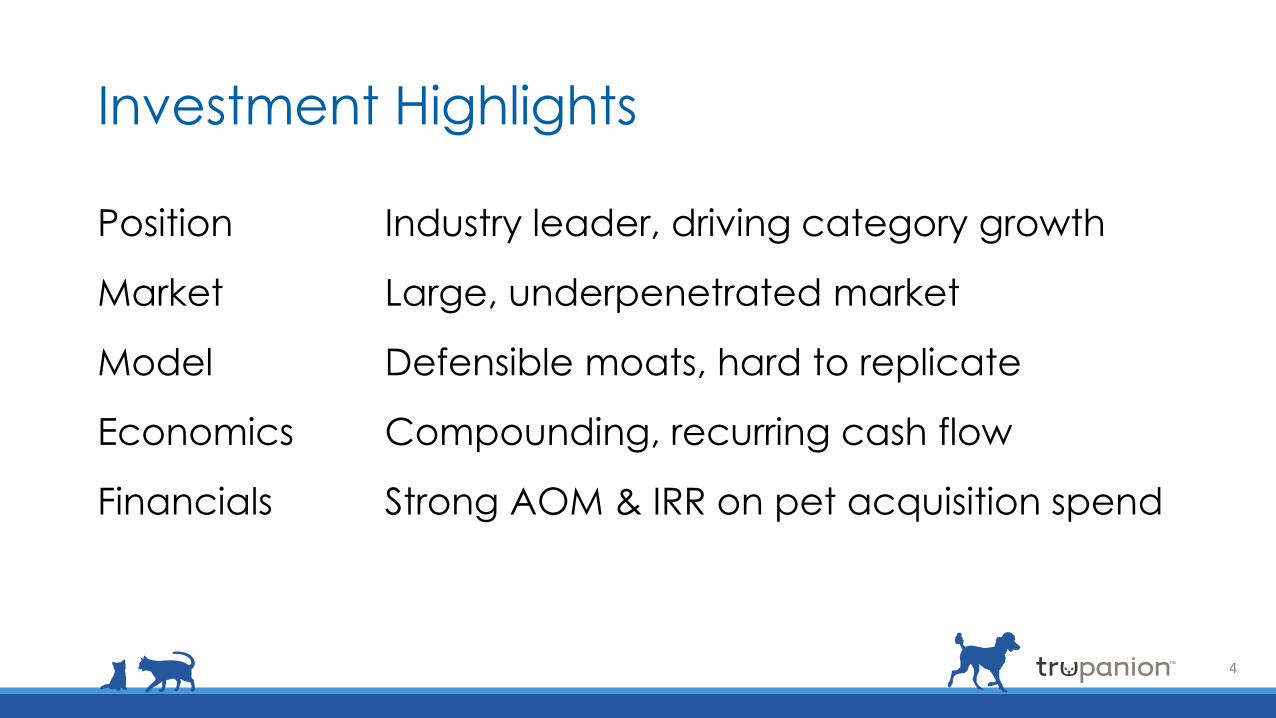
Investment Highlights
Position Industry leader, driving category growth
Market Large, underpenetrated market
Model Defensible moats, hard to replicate
Economics Compounding, recurring cash flow
Financials Strong AOM & IRR on pet acquisition spend
4

The Problem We Are Solving
It is very difficult for pet owners to budget
for veterinary expenses if/when their pet becomes sick
or injured.
5
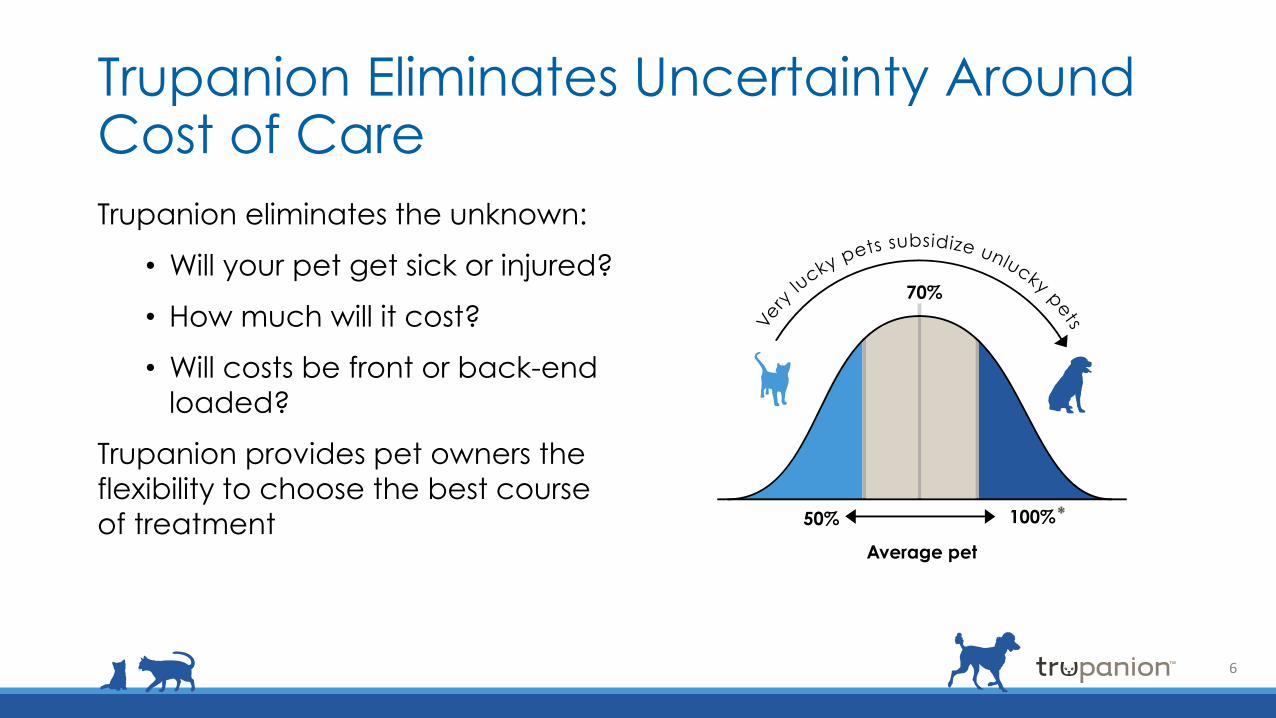
Trupanion Eliminates Uncertainty Around Cost of Care
Trupanion eliminates the unknown:
• Will your pet get sick or injured?
• How much will it cost?
• Will costs be front or back-end
loaded?
Trupanion provides pet owners the
flexibility to choose the best course
of treatment
6
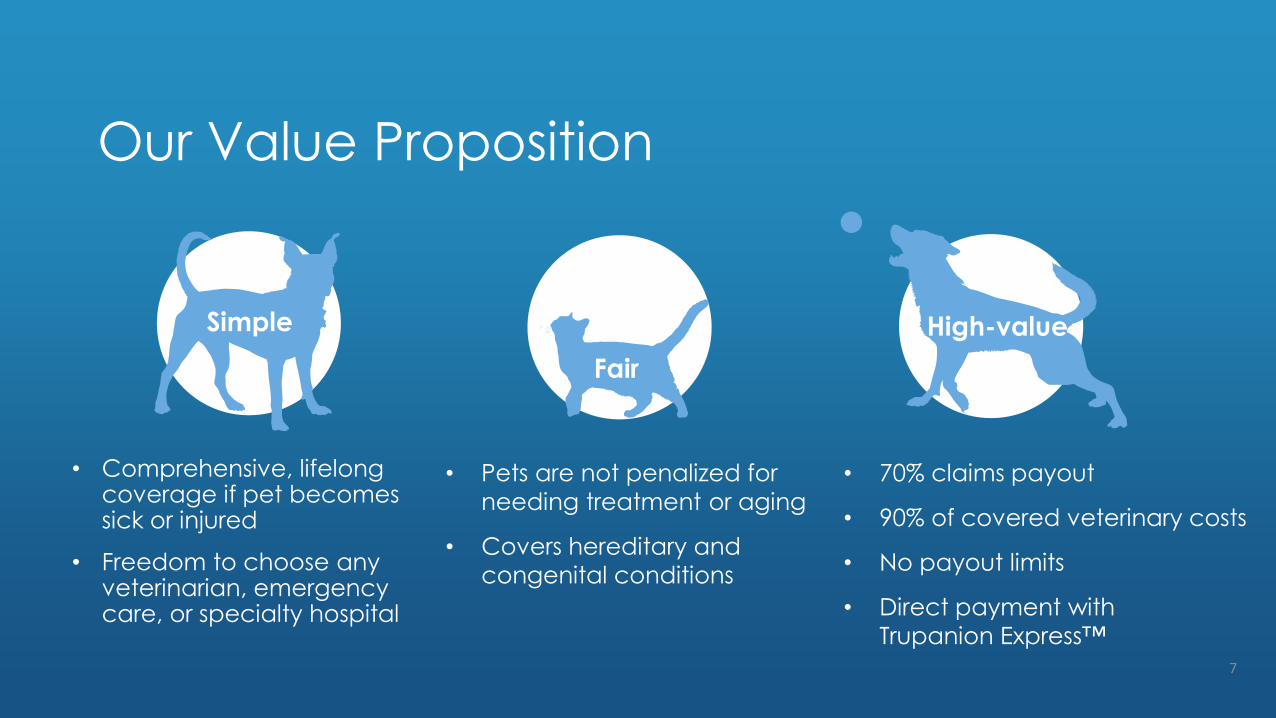
Our Value Proposition
• Comprehensive, lifelong coverage if pet becomes sick or injured
• Freedom to choose any veterinarian, emergency care, or specialty hospital
• Pets are not penalized for
needing treatment or aging
• Covers hereditary and
congenital conditions
• 70% claims payout
• 90% of covered veterinary costs
• No payout limits
• Direct payment with
Trupanion Express™
Simple
Fair
High-value
7
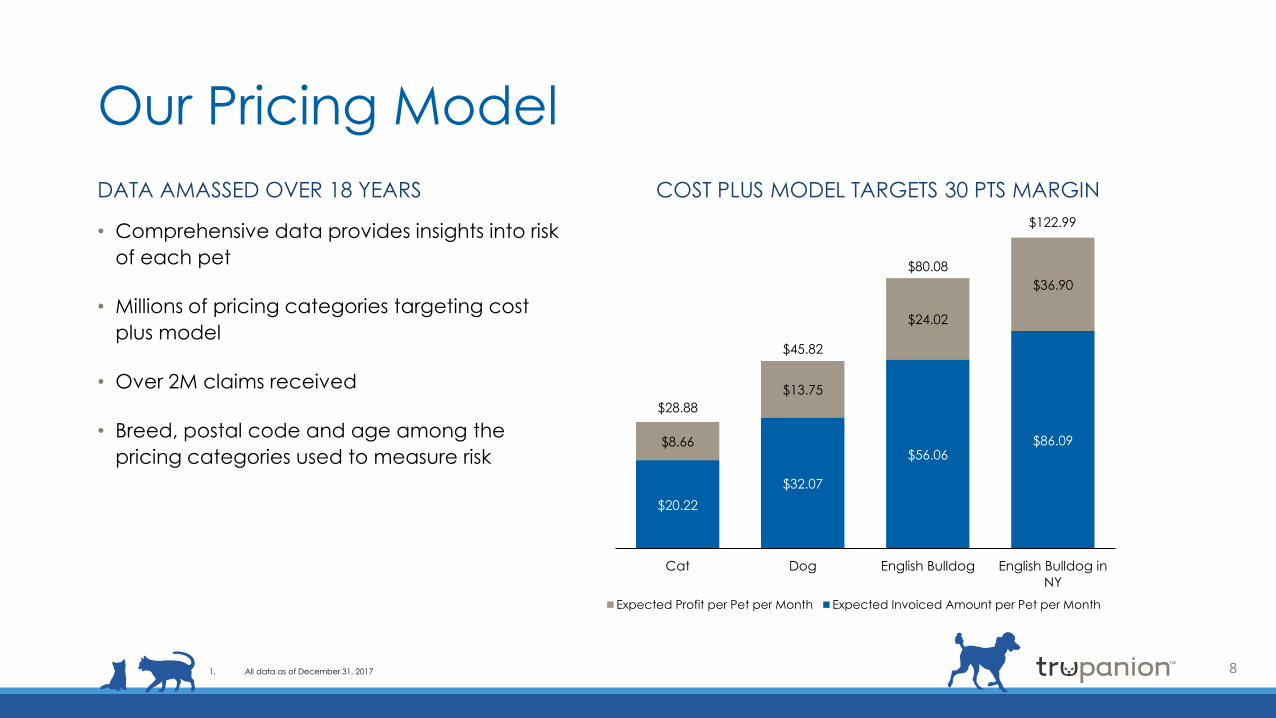
Our Pricing Model
DATA AMASSED OVER 18 YEARS
• Comprehensive data provides insights into risk
of each pet
• Millions of pricing categories targeting cost
plus model
• Over 2M claims received
• Breed, postal code and age among the
pricing categories used to measure risk
COST PLUS MODEL TARGETS 30 PTS MARGIN
$20.22
$32.07
$56.06$86.09$8.66
$13.75
$24.02
$36.90
$28.88
$45.82
$80.08
$122.99
Cat Dog English Bulldog English Bulldog in
NY
Expected Profit per Pet per Month Expected Invoiced Amount per Pet per Month
1. All data as of December 31, 2017 8
Veterinarians love us!
• Ability to recommend optimal
course of treatment that isn’t
dictated by cost
• Increased customer engagement
and better alignment
• Reduction in economic euthanasia
• Reduction in paperwork
• Direct invoice payment improves
bottom line
9
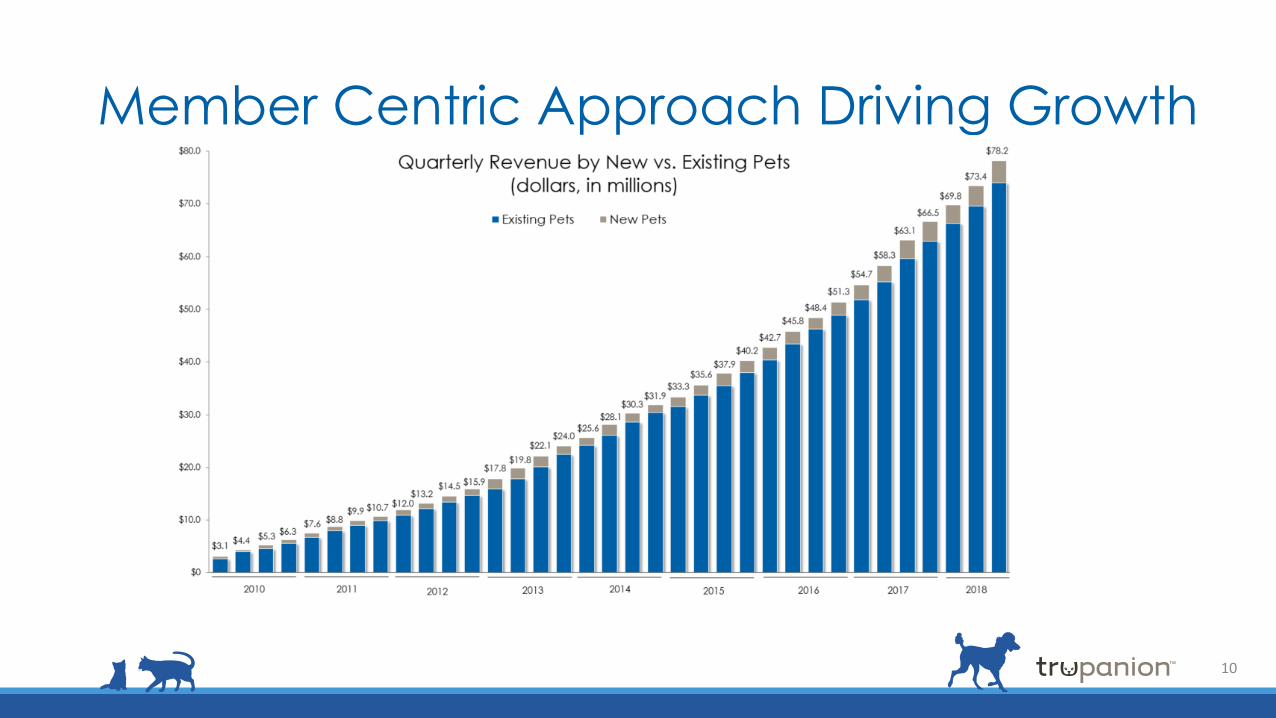
Member Centric Approach Driving Growth
10
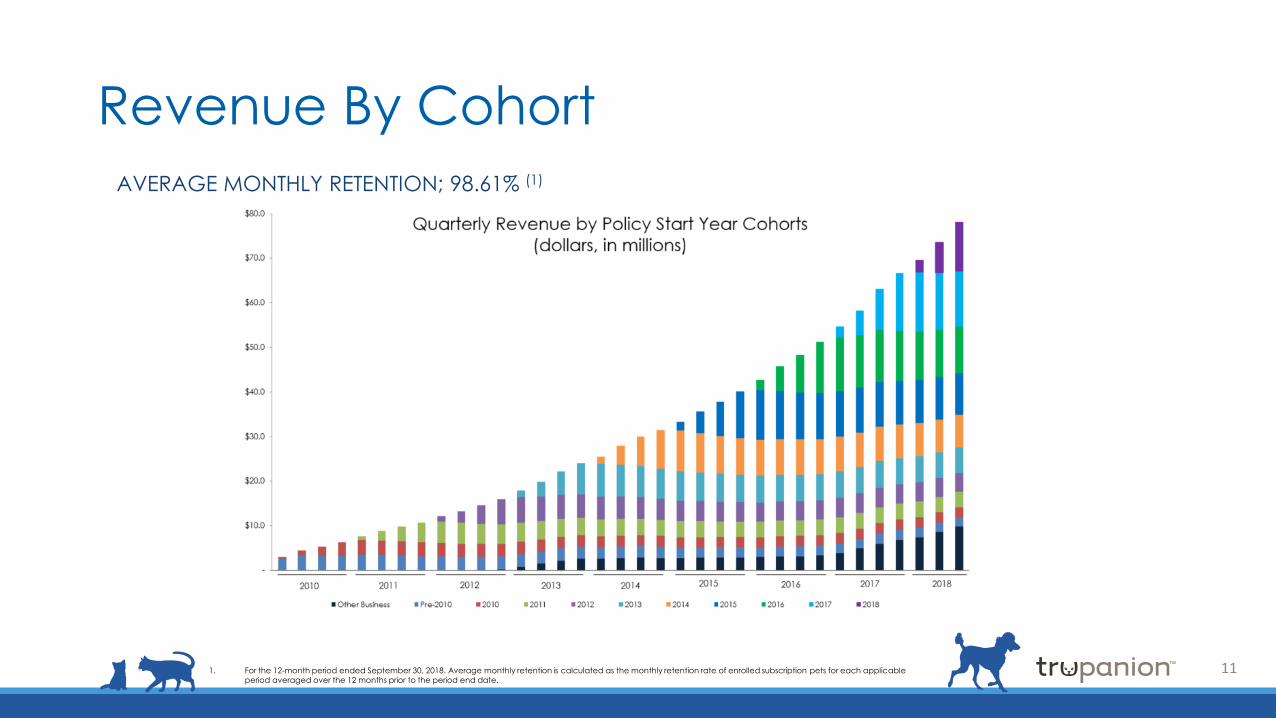
Revenue By Cohort
1. For the 12-month period ended September 30, 2018. Average monthly retention is calculated as the monthly retention rate of enrolled subscription pets for each applicable
period averaged over the 12 months prior to the period end date.
AVERAGE MONTHLY RETENTION; 98.61% (1)
11
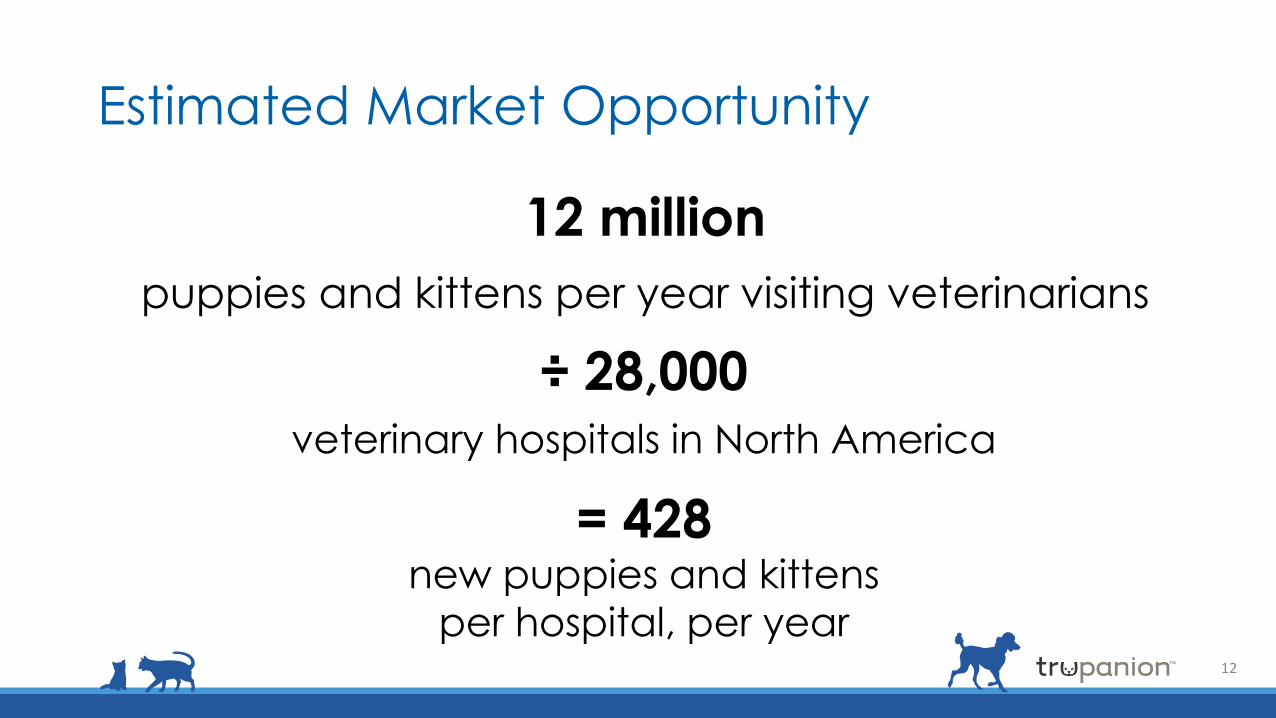
Estimated Market Opportunity
12 million
puppies and kittens per year visiting veterinarians
÷ 28,000 veterinary hospitals in North America
= 428new puppies and kittens
per hospital, per year12
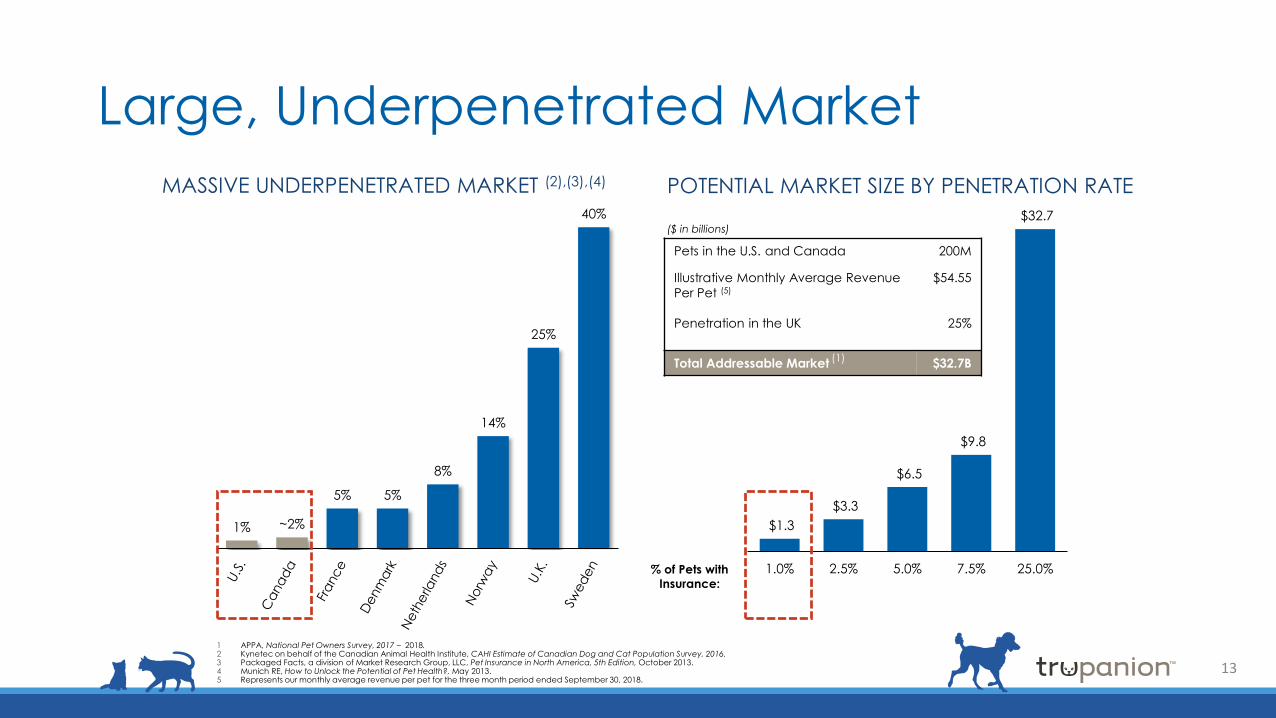
$1.3
$3.3
$6.5
$9.8
$32.7
1.0% 2.5% 5.0% 7.5% 25.0%
Large, Underpenetrated Market
1% ~2%
5% 5%
8%
14%
25%
40%
% of Pets with
Insurance:
Pets in the U.S. and Canada 200M
Illustrative Monthly Average Revenue
Per Pet (5)
Penetration in the UK
$54.55
25%
Total Addressable Market $32.7B
($ in billions)
MASSIVE UNDERPENETRATED MARKET (2),(3),(4) POTENTIAL MARKET SIZE BY PENETRATION RATE
1 APPA, National Pet Owners Survey, 2017 – 2018.2 Kynetec on behalf of the Canadian Animal Health Institute, CAHI Estimate of Canadian Dog and Cat Population Survey, 2016.3 Packaged Facts, a division of Market Research Group, LLC, Pet Insurance in North America, 5th Edition, October 2013.4 Munich RE, How to Unlock the Potential of Pet Health?, May 2013.5 Represents our monthly average revenue per pet for the three month period ended September 30, 2018.
(1)
13

Trupanion is Leading the Category
TRUPANION CONTRIBUTED 25% OF THE $211M IN ADDED INDUSTRY REVENUE IN 2017
Others
21%
Healthy
Paws
20% VPI
26%
Trupanion
33%Top 3
Players
73%
Remaining
12 - 15
Players
27%
• Medical insurance for pets is
a $1+billion industry in North
America
• Trupanion is the largest pet
insurance provider in
Canada & 2nd largest
provider in the U.S.
14
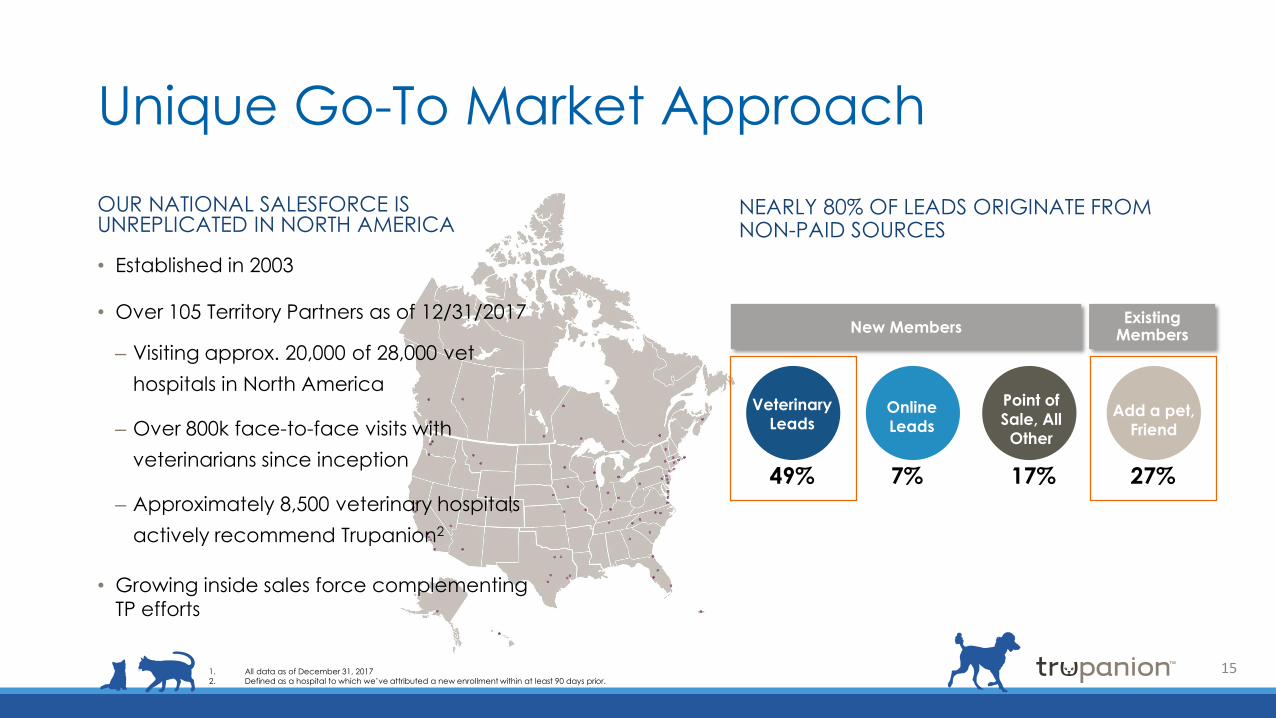
Unique Go-To Market Approach
NEARLY 80% OF LEADS ORIGINATE FROM NON-PAID SOURCES
Veterinary
LeadsOnline
Leads
Point of
Sale, All
Other
Add a pet,
Friend
49% 7% 17% 27%
ExistingMembers
New Members
OUR NATIONAL SALESFORCE IS UNREPLICATED IN NORTH AMERICA
• Established in 2003
• Over 105 Territory Partners as of 12/31/2017
– Visiting approx. 20,000 of 28,000 vet
hospitals in North America
– Over 800k face-to-face visits with
veterinarians since inception
– Approximately 8,500 veterinary hospitals
actively recommend Trupanion2
• Growing inside sales force complementing
TP efforts
1. All data as of December 31, 2017
2. Defined as a hospital to which we’ve attributed a new enrollment within at least 90 days prior.
15
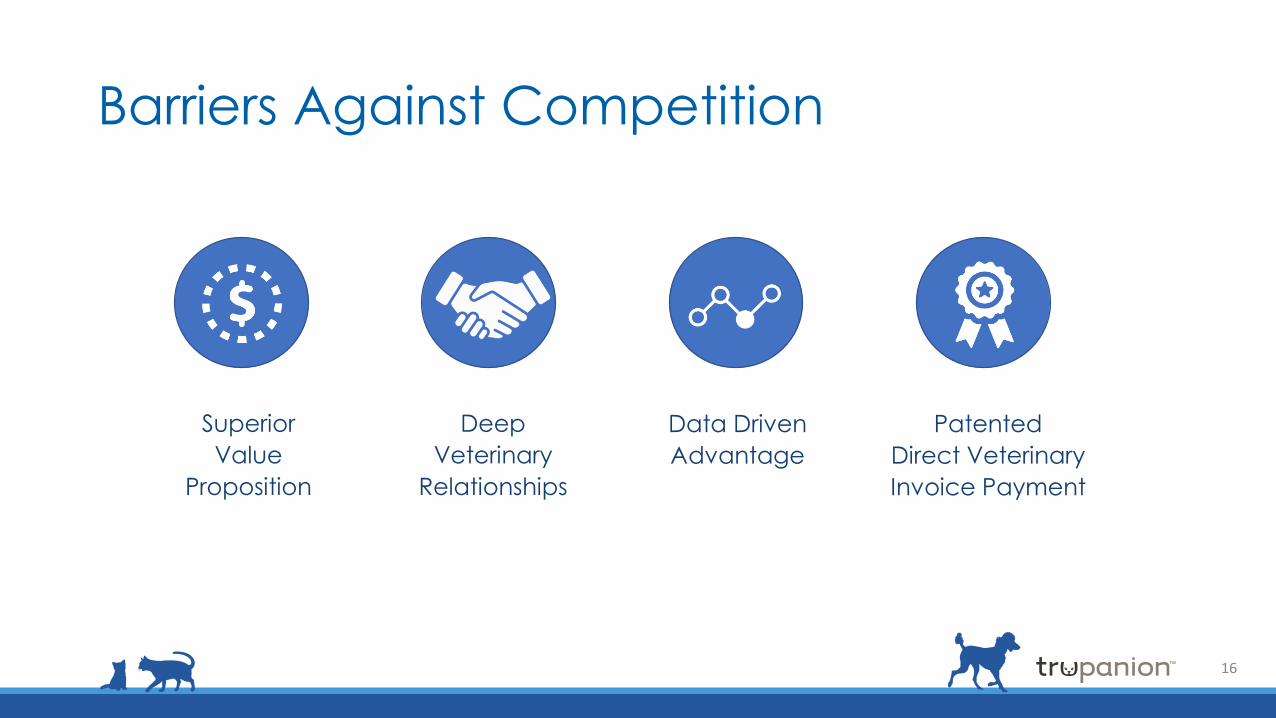
Barriers Against Competition
Superior
Value
Proposition
Deep
Veterinary
Relationships
Data Driven
Advantage
Patented
Direct Veterinary
Invoice Payment
16
Paths to Growth
• Number of stores
• Same-store-sales
• Direct-to-consumer marketing
• Pet owner referrals
• Other revenue
• New products
• New businesses
17
Compelling Financial Model
• High growth business capturing underpenetrated market
• Monthly subscription model with recurring and visible revenues
• Strong lifetime value and customer unit economics
• Attractive long-term margin profile
18
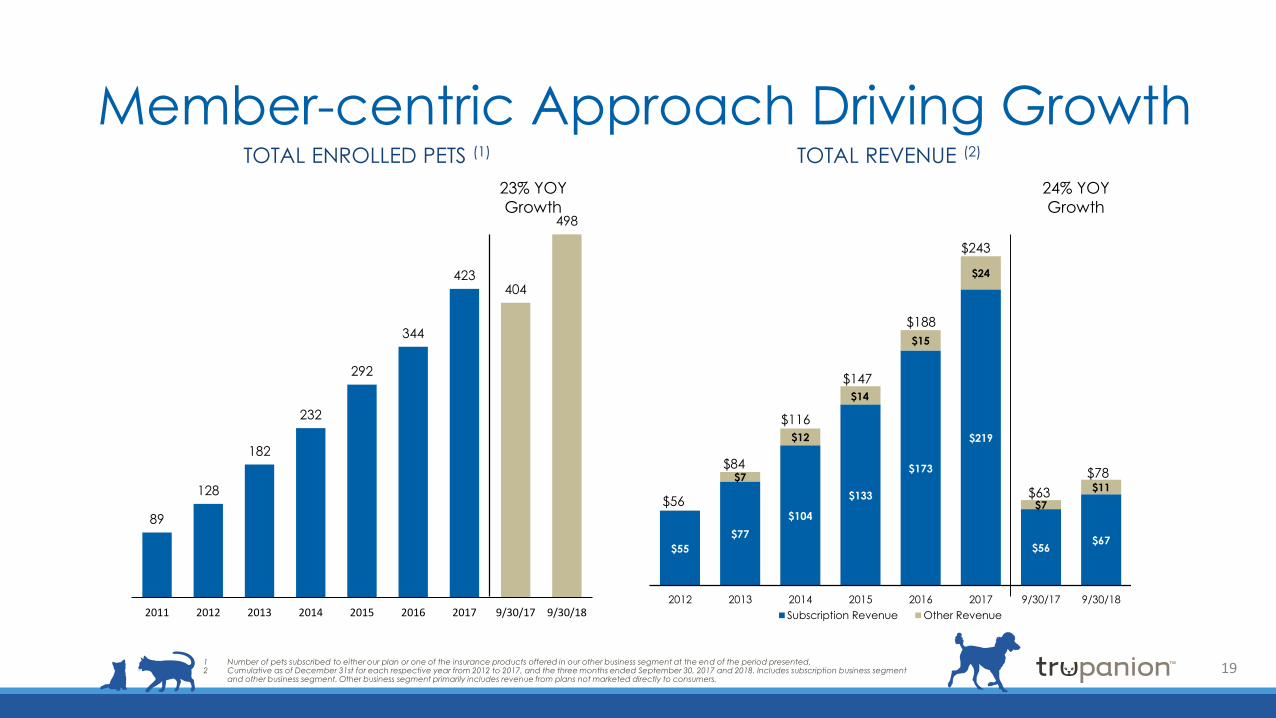
$55
$77
$104
$133
$173
$219
$56$67
$7
$12
$14
$15
$24
$7
$11
2012 2013 2014 2015 2016 2017 9/30/17 9/30/18
Subscription Revenue Other Revenue
Member-centric Approach Driving GrowthTOTAL ENROLLED PETS (1) TOTAL REVENUE (2)
1 Number of pets subscribed to either our plan or one of the insurance products offered in our other business segment at the end of the period presented.2 Cumulative as of December 31st for each respective year from 2012 to 2017, and the three months ended September 30, 2017 and 2018. Includes subscription business segment
and other business segment. Other business segment primarily includes revenue from plans not marketed directly to consumers.
23% YOY
Growth
24% YOY
Growth
$56
$84
$116
$147
$188
$243
$63
$78
19
89
128
182
232
292
344
423404
498
2011 2012 2013 2014 2015 2016 2017 9/30/17 9/30/18
($200)
($100)
$0
$100
$200
$300
$400
$500
$600
Year 0 Year 1 Year 2 Year 3 Year 4 Year 5 Year 6
($200)
($150)
($100)
($50)
$0
$50
$100
$150
Year 0 Year 1 Year 2 Year 3 Year 4 Year 5 Year 6
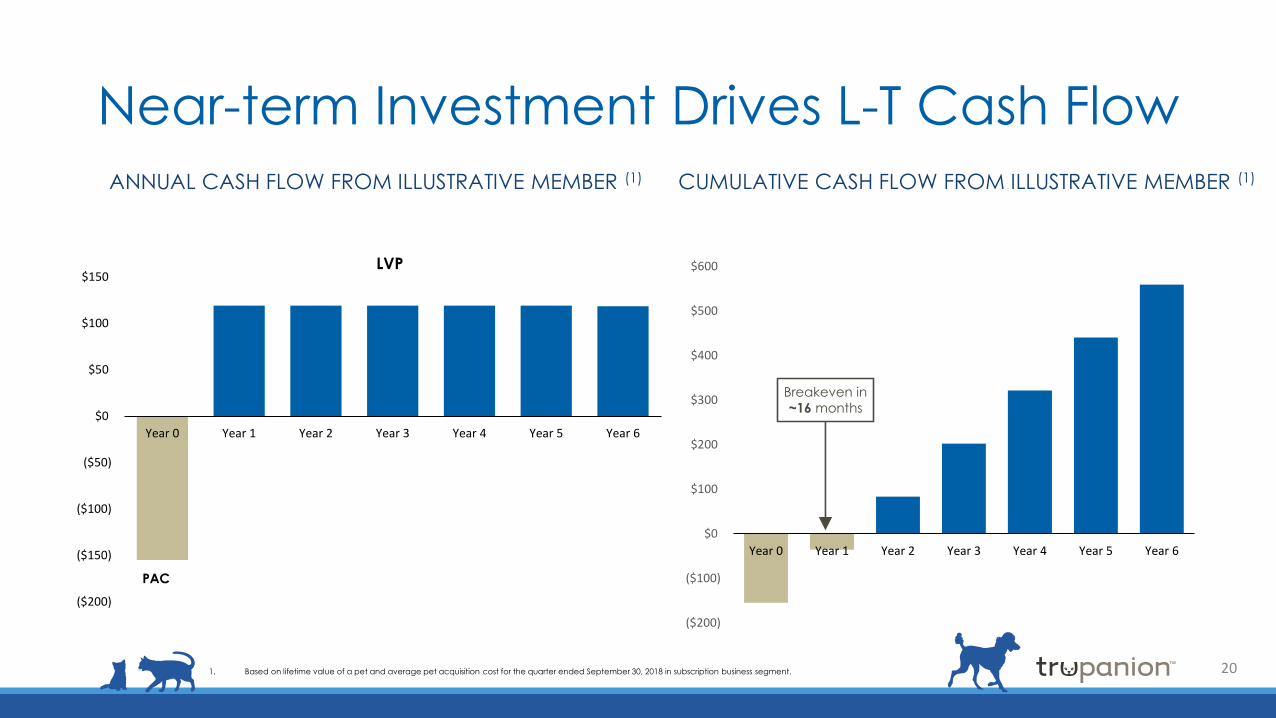
Near-term Investment Drives L-T Cash Flow
ANNUAL CASH FLOW FROM ILLUSTRATIVE MEMBER (1) CUMULATIVE CASH FLOW FROM ILLUSTRATIVE MEMBER (1)
LVP
PAC
Breakeven in
~16 months
1. Based on lifetime value of a pet and average pet acquisition cost for the quarter ended September 30, 2018 in subscription business segment. 20
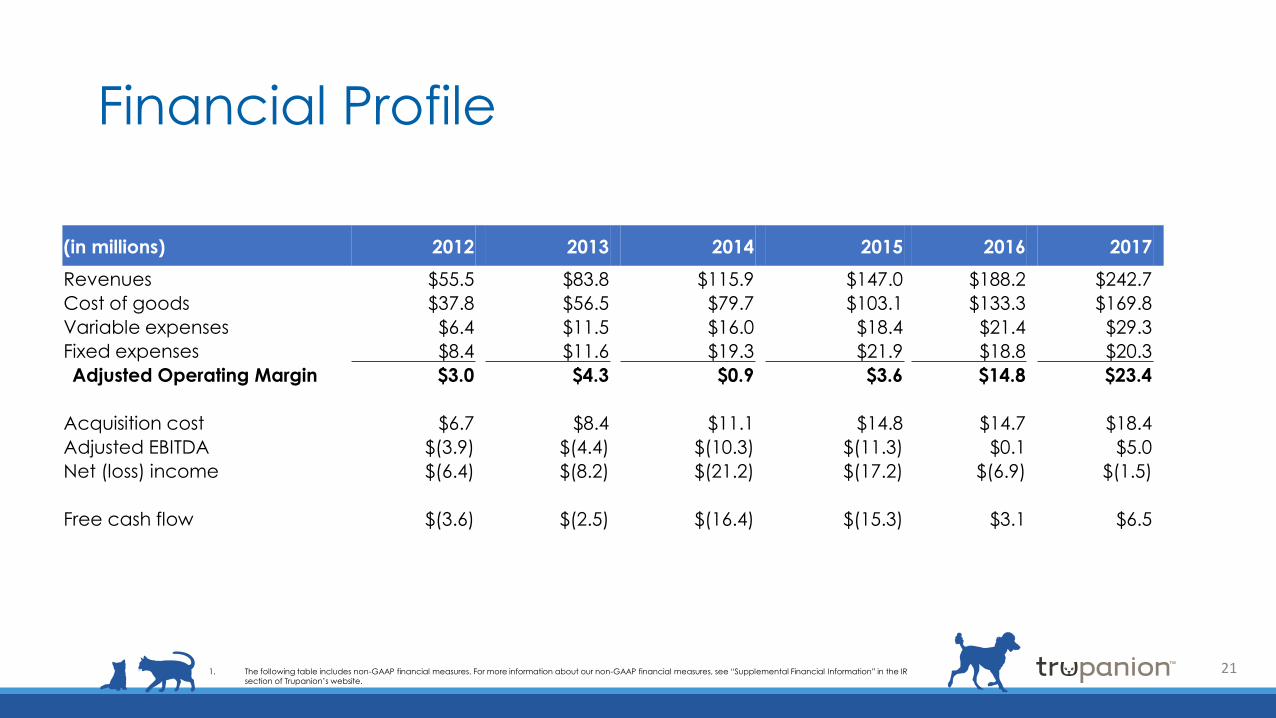
Financial Profile
(in millions) 2012 2013 2014 2015 2016 2017
Revenues $55.5 $83.8 $115.9 $147.0 $188.2 $242.7
Cost of goods $37.8 $56.5 $79.7 $103.1 $133.3 $169.8
Variable expenses $6.4 $11.5 $16.0 $18.4 $21.4 $29.3
Fixed expenses $8.4 $11.6 $19.3 $21.9 $18.8 $20.3
Adjusted Operating Margin $3.0 $4.3 $0.9 $3.6 $14.8 $23.4
Acquisition cost $6.7 $8.4 $11.1 $14.8 $14.7 $18.4
Adjusted EBITDA $(3.9) $(4.4) $(10.3) $(11.3) $0.1 $5.0
Net (loss) income $(6.4) $(8.2) $(21.2) $(17.2) $(6.9) $(1.5)
Free cash flow $(3.6) $(2.5) $(16.4) $(15.3) $3.1 $6.5
1. The following table includes non-GAAP financial measures. For more information about our non-GAAP financial measures, see “Supplemental Financial Information” in the IR
section of Trupanion’s website.
21
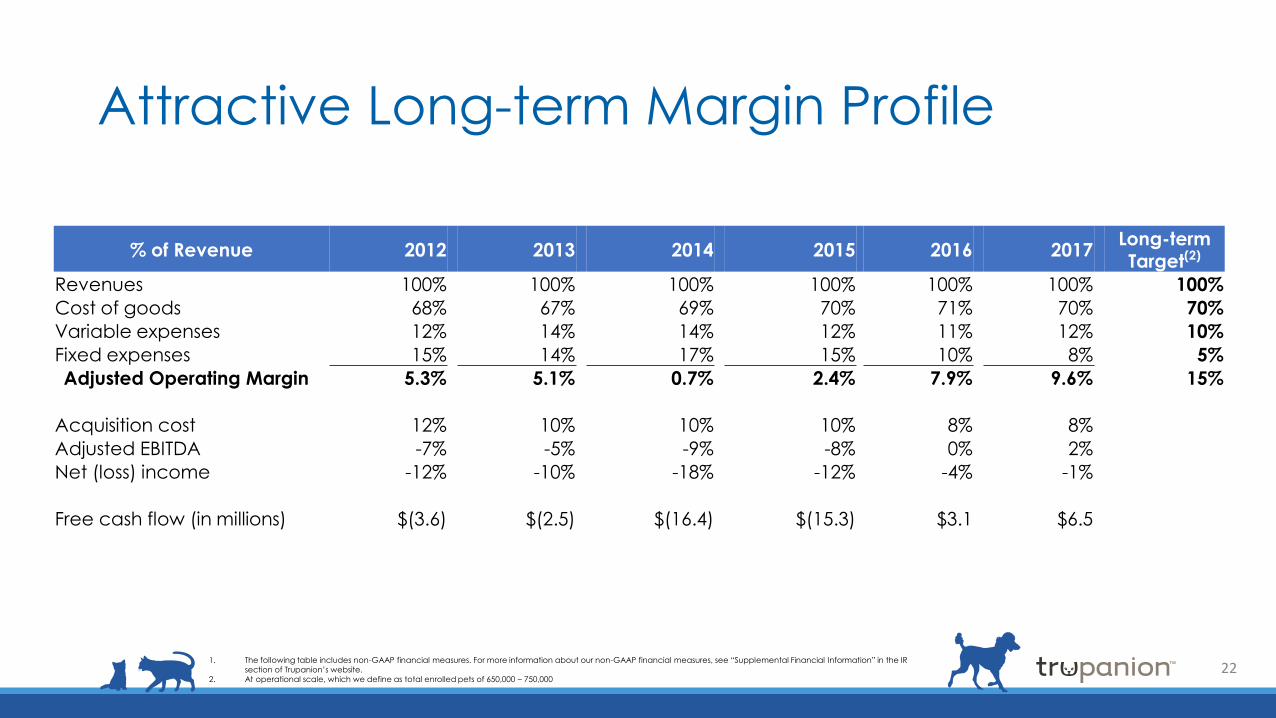
Attractive Long-term Margin Profile
% of Revenue 2012 2013 2014 2015 2016 2017Long-term Target(2)
Revenues 100% 100% 100% 100% 100% 100% 100%
Cost of goods 68% 67% 69% 70% 71% 70% 70%
Variable expenses 12% 14% 14% 12% 11% 12% 10%
Fixed expenses 15% 14% 17% 15% 10% 8% 5%
Adjusted Operating Margin 5.3% 5.1% 0.7% 2.4% 7.9% 9.6% 15%
Acquisition cost 12% 10% 10% 10% 8% 8%
Adjusted EBITDA -7% -5% -9% -8% 0% 2%
Net (loss) income -12% -10% -18% -12% -4% -1%
Free cash flow (in millions) $(3.6) $(2.5) $(16.4) $(15.3) $3.1 $6.5
1. The following table includes non-GAAP financial measures. For more information about our non-GAAP financial measures, see “Supplemental Financial Information” in the IR
section of Trupanion’s website.
2. At operational scale, which we define as total enrolled pets of 650,000 – 750,00022

Questions?Thank you.