“Working Together To Achieve Excellent Health” Volume XVI ...
November 2013
Volume XVI - Issue No. 4
Use of material is subject to credit being given to source:
FAO
Rice Market Monitor Trade and Markets Division
Food and Agriculture Organization of the United Nations
Contact or enquiries
Facsimile: ++(39-06) 570-54495 Telephone: ++(39-06) 570-54136
E-mail: [email protected]
Also available on the Internet at the following address: http://www.fao.org/economic/est/publications/rice-publications/rice-market-
monitor-rmm/en/

ROUND UP Since the release of the July issue of the RMM, prospects for the well advanced 2013 paddy
season have been marred by a series of setbacks, resulting in more subdued expectations for global paddy production in 2013. As a result, the July forecast has been revised down by about 5 million tonnes to 741.4 million tonnes (494.2 million tonnes, milled basis), implying a growth of only 1.1 percent, or 7.8 million tonnes, from the 2012 production estimate. The deterioration of prospects primarily concerned China (Mainland), Pakistan and the Philippines, which were hit, in recent months, by erratic climatic events, including storms and typhoons. Adverse growing conditions also impaired prospects in Madagascar, Mali and Senegal, while revisions to historical figures called for a sizeable scaling down of 2013 estimates in Egypt and Myanmar. Part of these reductions was compensated by more buoyant production forecasts in a number of countries, especially Indonesia, Thailand and the United States.
Although accounting for much of the worsening in the global outlook, Asia is still expected to sustain growth in world rice production in 2013. According to the latest forecasts, the region is to harvest 672.7 million tonnes (448.6 million tonnes, milled), 1.2 percent more than in 2012. Foremost among countries responsible for the increase are India, Indonesia, Thailand, Myanmar and Bangladesh. By contrast, drought in China’s central and eastern provinces exacted a heavy toll on the intermediate and late rice crops, which may bring about the first production decline in the country since 2003. Japan, Malaysia and the Philippines could also face a contraction. In the Philippines, the passage of super-typhoon Haiyan had only a limited impact on the main crop, as much of the rice had been harvested. However, the implications for the secondary crop, now at the planting stage might be more severe, as agricultural activities in the affected regions will be hindered by the losses of lives, displacement of the local populations and the destruction of agricultural machinery and infrastructure. The outlook for crops in Africa also has deteriorated since July, with paddy production in the region poised to remain unchanged at the 2012 level of 26.8 million tonnes (17.5 million tonnes, milled). This apparent stability masks different trends across the region, as output gains in Northern Africa (Egypt), Western Africa (Guinea, Mali and Nigeria), Eastern Africa (Tanzania, Uganda) and Central Africa (Cameroon) are expected to compensate for an 18 percent drop in Southern Africa, caused by Madagascar’s sharp losses. In Latin America and the Caribbean, rice production in 2013 was slightly raised to 28.0 million tonnes (18.7 million tonnes, milled), 1.9 percent above the depressed 2012 level, insufficient to sustain a full recovery to the high 2011 level. In Central America and the Caribbean, most producers are anticipated to harvest larger crops, especially the Dominican Republic and Mexico, while in South America, the outlook is mixed, with sizeable increases expected in Brazil, Guyana, Paraguay and Venezuela, and declines in Bolivia and Chile. In North America, despite an improved outlook, the United States is anticipated to face a 5 percent drop in production this year. In Europe, prospects changed little for the EU and the Russian Federation, with the first heading towards a sharply reduced harvest and the second towards a new record crop. In Oceania, Australia already reaped its 2013 crop early this year, achieving the best results in the past ten years.
Countries located along and south of the equators have started sowing their 2014 main crops, with some already providing indications on possible outcomes for the forthcoming season. For instance, abundant water for irrigation is anticipated to foster an increase of sowings in Argentina, Chile and Uruguay, despite lingering concerns over high costs and falling returns. Although planting surveys point to little change in area coverage in Brazil, officials forecast production to rise by 2-5 percent on higher yields. In Asia, Viet Nam already announced it will encourage a shift of plantings away from rice, while Indonesia has set an official production target calling for a 6 percent production increase. By contrast, in Australia, drought conditions and expectations of lower yields have led officials to foreshadow a 22 percent drop of output.

2
FAO Rice Market Monitor – November 2013
FAO’s forecast of world trade in rice in calendar 2013 has not changed since July, remaining at 37.5 million tonnes (milled basis), implying a 2 percent contraction from the 2012 record. The retrenchment is expected to be demand-led, and mostly imputable to import cuts in the Far East (Indonesia, the Philippines) and in Western Africa (Nigeria, Senegal), a reflection of good crops, but also of the restrictive policies instituted as part of self-sufficiency programmes. Poor production results, combined with strong domestic demand, are, instead, foreseen to lift purchases in Europe (EU), Latin America and the Caribbean (Brazil, Colombia) and North America (United States). Among exporters, the faltering import demand is foreseen to curb shipments from Viet Nam the most, although supply constraints and high prices are also expected to depress sales by Argentina, Brazil, and Uruguay. Given a poor delivery record so far, Thailand appears unlikely to boost its exports beyond the relatively low level of last year. Expectations have, instead, improved for India, which may replicate the 2012 record performance, with Australia, Cambodia, China (Mainland), Egypt, Pakistan, Paraguay and the United States also forecast to export more.
Global trade in rice in 2014 is currently forecast at 38.3 million tonnes, 2 percent above the 2013 current trade estimate and only fractionally short of the 2012 record. On the export side, much of the trade growth is forecast to be captured by Thailand, where government releases of supplies from stocks have resulted in prices falling in recent months, helping the country regain its competitive edge. Ample supplies may also enable Brazil, China (Mainland), Egypt, Guyana and Paraguay to step-up deliveries. However, a return in force of Thailand as an exporter is seen to affect negatively sales from most of the other suppliers, in particular India, which may, nonetheless, retain its dominant position in the global rice market. Shipments by Argentina, Pakistan, Uruguay and the United States are also anticipated to fall.
FAO has lowered its forecast for global rice utilisation in 2013/14 to 489.4 million tonnes (milled basis), 2.8 percent more than in the previous year. The increase is sustained by a 8 million tonne rise in global food intake to 410.6 million tonnes. As a result, per caput rice consumption is forecast to average 57.0 kilos in 2013/14, up from 56.5 kilos in 2012/13. The rise would be in spite of generally high retail prices compared to last year, often fostered by a widening of subsidized distribution schemes, especially in Asia, where Bangladesh, Indonesia and, especially, India have recently expanded the scope of such programmes.
World rice stocks carried over in 2014 are now projected to surpass their opening levels by 4.6 million tonnes, sufficient to lift the global stocks-to-use ratio from 35.6 percent in 2012/13 to 35.9 percent this year. Developing countries are expected to account for all of the stock increase. Among exporters, Thailand and Viet Nam are forecast to close their marketing years with larger reserves, while these may shrink in India, Pakistan and the United States. Among importers, China is anticipated to increase its rice stockpiles. On the other hand, traditional importers, including Bangladesh, Indonesia, the Islamic Republic of Iran, Madagascar, Nigeria, Philippines and South Africa may end the season with smaller inventories.
After holding steady for much of 2013, international rice prices fell markedly in September. The FAO All Rice Price Index (2002-2004 = 100) shed 5 percent of its value that month to 226 points. The index dropped by a further 2 points in October and 1 point in November, when it averaged 223 points. The price weakness was most pronounced in the long-grain segment, where quotations were pressured by thin buying interest and prospects of large main-crop harvests in northern hemisphere countries. Because the price slide was particularly steep in Thailand, a salient development of the market in recent months has been the convergence of prices across major origins in Asia, which bears important implications for trade in the coming months.

1
FAO Rice Market Monitor – November 2013
INFORMATION UPDATE AS OF 15 NOVEMBER 2013
I. PRODUCTION Climatic setbacks and prospects of low returns demean global production growth
to 1.1 percent in 2013 At this time of the year, the northern hemisphere producing countries are busy harvesting their main paddy crops, while, south of the equator, the season has virtually concluded, with countries already engaged in planting their 2014 crops.1 Since the July issue of the RMM, FAO has lowered its 2013 global production forecast by 5.0 million tonnes to 741.4 million tonnes (494.2 million tonnes, milled basis). The downgrading has primarily concerned China (Mainland), but also Pakistan and the Philippines. In Africa, Madagascar, Mali, Senegal are now foreseen to produce less than asserted in July, while revisions to historical figures also entailed a lowering of estimates for Egypt and Myanmar. Overall, these reductions more than offset upward adjustments in Bangladesh, Cambodia, Guinea, Indonesia, the Democratic People’s Republic of Korea, the Lao PDR, Nigeria, Sri Lanka, Thailand, the United Republic of Tanzania, the United States, Venezuela and Viet Nam.
At the revised forecast of 741.4 million tonnes (494.2 million tonnes, milled basis), world paddy production would exceed the 2012 level by 1.1 percent, or 7.8 million tonnes. All of the growth is expected to stem from an expansion in area to 164.0 million hectares, as average yields are anticipated to fall to 4.52 tonnes per hectare, 1 percent below the relative high level attained in 2012. The decline of yields in part reflects the situation in Asia, where various important producers have been negatively impacted by inclement weather. Climatic setbacks combined with prospects of lower margins are behind the expectation of production shortfalls in Europe and North America. Overall, Africa is
anticipated to harvest a similar level to last season. Elsewhere, paddy output is expected to post a partial recovery in Latin America and the Caribbean, while in Australia the season has already ended with favourable results.
A. ASIA
Adverse weather conditions behind a 5.1 million tonne downscaling of production forecasts in Asia While many northern hemisphere countries in Asia are currently harvesting their 2013 main crops, FAO has lowered its forecast of 2013 production in the region by 5.1 million tonnes to 672.7 million tonnes (448.6 million tonnes, milled basis), which would still imply a 1.2 percent year-on-year expansion. The downward revision primarily reflects prospects of an output shortfall in China (Mainland), the world’s largest rice producer, where crops have been negatively affected by
1 The 2013 rice production season normally includes rice from the main paddy crops whose harvests fall in 2013, to which rice from all subsequent secondary crops, if any, is added. In the case of northern hemisphere countries, this principle implies that production in 2013 comprises the main rice crop, which is usually collected in the latter part of the year, plus the volume obtained from the successive secondary crops, commonly harvested in the first half of 2014. In the case of southern hemisphere countries, production in 2013 normally comprises rice from the main paddy crops assembled in the first part of 2013, plus rice from the secondary crops, generally gathered in the latter part of 2013. This approach to assess rice production is applicable to any given season.

2
FAO Rice Market Monitor – November 2013
unseasonable dryness. Although inclement weather has also impacted crops in the eastern part of India, FAO has tentatively maintained a positive production outlook for the country, reflecting the beneficial effects of abundant monsoon rains elsewhere in the country. Sizeable gains are instead anticipated in Indonesia, Thailand and Viet Nam. Prospects also remain favourable for Bangladesh, Cambodia, the Republic of Korea, Myanmar, Nepal, Pakistan, and Sri Lanka, whereas Japan, Malaysia, the Philippines, and Timor Leste are expected to incur output shortfalls.
The 2013 paddy season progresses well in Bangladesh. Area coverage under the Aman crop, the second most important of the three crops harvested every season, is assessed at 5.7 million hectares, 2 percent larger than in 2012, aided by favourable rainfall, adequate availability of productive inputs and improved prices prospects. Indeed, local quotations have recovered steadily since the completion of the 2012/13 Boro harvest in May 2013, with wholesale prices in Dhaka reported in September at Taka 30.54 per kilo (USD 394)2, or 29 percent above year earlier levels. As a consequence and assuming the remainder of the season progresses normally, the country is
forecast to gather 51.5 million tonnes in 2013 (34.3 million tonnes, milled basis), 1.5 percent above a revised 2012 estimate and 350 000 tonnes more than previously envisaged. After a slow start to the season, planting activities of main crops regained pace in Cambodia. By end of October, 2.6 million hectares were officially reported under the main season crop, 2 percent more than in October last year, as favourable rainfall made the advance possible. At the same time, the heavy rains since mid-September also translated into floods, which damaged close to 125 000 hectares of paddies. However, on expectations that those losses will be compensated by a larger offseason harvest, FAO anticipates Cambodia to gather 9.5 million tonnes (6.1 million tonnes, milled basis), up 200 000 tonnes year-on-year. Production in China (Mainland) has been downgraded since July, with the China National Grain and Oils Information Centre lowering its 2013 semi-official forecast by 4.0 million tonnes to 202.8 million tonnes (138.9 million tonnes, milled basis). The revised estimate stands 0.7 percent, or 1.5 million tonnes, below the 2012 output level, a relatively small reduction for the country, but one that marks the first production decline registered in China since 2003. The contraction reflects prospects of lower yields, depressed by precipitation shortages and high temperatures in south-central and eastern provinces. The drought conditions that prevailed through much of August impacted the provinces of Zhejiang, Hubei and Hunan the most. China (Mainland): Paddy Production by Crop in 2012 and 2013
Area (000 ha) Yield (tonne/ha) Production (000 tonnes)
2012 2013 Var % 2012 2013 Var % 2012 2013 Var %
Total 30,137 30,432 1.0 6.78 5.88 -1.7 204,236 202,750 -0.7
Early 5,765 5,792 0.5 5.78 7.27 1.9 33,290 34,075 2.4
Intermediate 18,019 18,370 1.9 7.41 5.60 -1.9 133,575 133,575 0.0
Late 6,353 6,270 -1.3 5.88 5.60 -4.8 37,371 35,100 -6.1
Source: China National Grain and Oils Information Centre (CNGOIC)
2 All currency conversion as of 1 October 2013.
0
100
200
300
400
500
600
700
2009 2010 2011 2012 2013
Rice Paddy Production in Asia
Others Viet Nam Bangladesh Indonesia India China
million tonnes

3
FAO Rice Market Monitor – November 2013
0
20
40
60
80
100
120
2010-11 2011-12 2012-13
million tonnes
Jharkhand
Assam
Chhattisgarh
Bihar
Orissa
Uttar Pradesh
West Bengal
Others
India: Rice Production by State
Looking at the various crops, the season shortfall is anticipated to stem from a 2.3 million tonne decline in the late rice crop, cancelling out gains achieved during the early crop harvest. As for the largest, intermediate rice crop, production is expected to remain close to last year, as an area-led expansion in the Heilongjiang province compensated for losses in the other provinces. On 24 September 2013, the Government of India released the first advanced estimates of production in 2013, pegging the main crop Kharif output at 138.5 million tonnes (92.3 million tonnes, milled basis), 0.5 percent short of volumes gathered in 2012. Such a downcast outlook for the year’s main crop primarily reflected a deficient performance of the monsoon rains over eastern and north-eastern India, where cumulative precipitation between June and September fell 28 percent short of the long period average. Rainfall deficits were reported to have impeded transplanting activities and reduced yield prospects for crops, especially in the States of Bihar and Jharkhand, which had made significant production strides in previous years under the “Bringing the Green Revolution to Eastern India” (BGREI) programme. Prospects further deteriorated in Odisha and Andhra Pradesh, two other eastern states, following the 12 October landfall of cyclone Phailin. Although an assessment of crop damages is still pending, up to 670 000 hectares of standing crops across 17 districts of Odisha alone were reported affected by the strong winds and flash floods brought by the storm. Most of the crops affected were paddies at the reproductive stage.
The climatic setbacks in eastern states dampened the outlook for a season that had otherwise progressed favourably. In fact, in September, FAO had lifted its production forecast for India to 162.0 million tonnes (108.0 million tonnes, milled basis), as above-average monsoon rains in all other broad geographical regions, had indeed permitted Kharif plantings to exceed year-earlier levels. Since then, in light of the successive passage of storms, FAO has again reduced India’s production forecast, which currently stand at 159.0 million tonnes (106.0 million tonnes, milled basis), unchanged from expectations in July and 2 percent above the 2012 outcome. This is pending assessments of the extent of losses incurred in eastern states
and taking into account the potential for shortfalls to be recouped under the secondary Rabi crop. Overturning previous prospects of little growth due to excessively wet conditions, the second output forecasting figures released by authorities in Indonesia indicate a likely 3 percent expansion in the 2013 harvest to 70.87 million tonnes (44.6 million tonnes, milled basis). The result is close to 1.6 million tonnes above previous estimates and marks a new record. The achievement came on the back of an expanded acreage of 13.8 million hectares, as yields are estimated to have remained at 2012 highs of 5.1 tonnes per hectare. This is notwithstanding a 2 percent decline of productivity levels in Java, which had endured above-average rainfall during the dry-season. Based on the results of a FAO/WFP assessment mission, the area under paddy in the Democratic People’s Republic of Korea fell for the second consecutive season to 547 000 hectares, reflecting a diversion of rice land to other end-uses. Despite the retrenchment, the October harvest is estimated to have brought in 2.9 million tonnes (1.9 million tonnes, milled basis), 8 percent above the already positive 2012 production. The growth came on the back of an 11 percent rise in yields to 5.3 tonnes per hectare, facilitated by a stable input supply situation, abundant rains early in the season, followed by conducive dry weather in August and September, which all favoured crop development.

4
FAO Rice Market Monitor – November 2013
With the 2013 paddy campaign having proceeded without major obstacles, Japan remains forecast to gather 10.6 million tonnes (7.7 million tonnes, milled basis). This would represent a small contraction from the previous year, in the order of 50 000 tonnes, amid expectations of a return of yields to more normal levels. On the policy front, the government has hinted that it might soon reconsider the measures introduced in the 1970s to reduce paddy production, including the generous income subsidies provided to rice farmers. The October-November harvest in the Republic of Korea is officially gauged to have recovered by 6 percent to 5.72 million tonnes (4.2 million tonnes, milled basis). The upturn was in spite of continued area losses, as farmers shifted to more profitable crops and more stretches of land were converted to other purposes. On the other hand, favourable weather conditions permitted average yields to recover to 6.9 tonnes per hectare, which compares with 6.4 tonnes per hectare in 2012, when crops were affected by inclement weather. Meanwhile, the Korean Government has announced that, by the end of the year, it will purchase 370 000 tonnes from this harvest at prevailing market prices under the Public Rice Stockholding Programme (PRSP). Based on recently released Government assessments, Malaysia gathered a bumper harvest of 2.75 million tonnes (1.8 million tonnes, milled basis) in 2012. The excellent result was underpinned by record yields of close to 4.0 tonnes per hectare, while the area under paddy remained largely stable at 692 000 hectares. The outlook is less positive for the 2013 season, which is officially estimated to have concluded with a 4 percent output contraction to 2.6 million tonnes (1.7 million tonnes, milled basis), as yields declined to more normal levels. Much of the downturn was concentrated in Peninsular Malaysia, particularly in Kedah, but also in Sabah and Sarawak. Meanwhile, on the policy front, officials have renewed assistance to the sector, including price support, subsidies on fertilizers and seeds, and offered incentives to raise fragrant rice production.
Malaysia: Paddy Production, Planted Area and Yields
2009 2010 2011 2012 2013
2013 vs 2012Var %
Planted Area (Ha) 674,928 677,884 687,940 692,340 688,207 -0.60
Peninsular Malaysia 515,657 512,610 517,586 524,893 520,848 -0.77
Sabah 40,352 43,353 43,331 43,485 43,118 -0.84
Sarawak 118,919 121,921 127,023 123,962 124,241 0.23
Yields (Mt/ha) 3.720 3.636 3.748 3.973 3.817 -3.92
Peninsular Malaysia 4.254 4.102 4.257 4.539 4.351 -4.14
Sabah 3.264 3.403 3.052 3.499 3.406 -2.65
Sarawak 1.562 1.761 1.910 1.740 1.720 -1.16
Production (Mt) 2,511,043 2,464,830 2,578,519 2,750,404 2,626,882 -4.49
Peninsular Malaysia 2,193,640 2,102,644 2,203,597 2,382,561 2,266,341 -4.88
Sabah 131,710 147,531 132,253 152,142 146,858 -3.47
Sarawak 185,693 214,655 242,669 215,701 213,683 -0.94
Source: Department of Agriculture - Statistik Tanaman (Sub-Sektor Tanaman Makanan) Historical production estimates for Myanmar have been subject to revision. In 2011, the government assessed that area diversions to other uses, together with lower yields following heavy precipitations and floods, depressed output by 11 percent to 29.0 million tonnes (18.3 million tonnes, milled basis). Production deteriorated further in 2012 to 28.1 million tonnes (17.7 million tonnes, milled basis), under the combined effects of floods and dry weather. As for the ongoing season, FAO’s outlook is more positive despite reports of recurring flooding problems, with Myanmar forecast to gather 29.0 million tonnes (18.3 million tonnes, milled basis). The partial upturn is expected to stem from a

5
FAO Rice Market Monitor – November 2013
recovery in area, reflecting a rebound of local rice prices and growing investment interest in the country’s rice sector. Production prospects remain favourable in Nepal, where the early crop has already been collected. Output in 2013 is expected to reach 4.6 million tonnes (3.0 million tonnes, milled basis), exceeding the 2012 weather-affected outcome by 2 percent. Both area and yields are seen to increase, facilitated by timely and adequate rainfall conditions and by an improved input supply. After three consecutive years of flood-related losses, Pakistan was again battered by torrential rains and ensuing floods in August. The two main rice producing regions of Punjab and Sindh were affected by the inundations, with the basmati growing areas of Punjab particularly hit. To take account of the damages, FAO has downgraded its production forecast for Pakistan by 600 000 tonnes to 8.7 million tonnes (5.8 million tonnes, milled basis). The revised figure nevertheless suggests a 5 percent production increase from the poor 2012 outcome, supported by larger area coverage. Indeed, farmers in the country are reported to be favouring rice over cotton and, contrary to the previous year, adequate water availabilities for irrigation permitted planting activities to unfold in a timely manner. On 8 November 2013, the Philippines was struck by super typhoon Haiyan, the strongest tropical cyclone ever to make a landfall. The storm wrecked havoc across nine of the country’s 17 regions, affecting up to 9 million people and displacing close to 2 million individuals, further to inflicting severe damage to roads and infrastructure. Of the nine affected regions, the three worst hit were Eastern, Western and Central Visayas, which normally account for some 20 percent of the country’s rice production. Early official assessments indicate that the damage inflicted to rice crops by Haiyan was limited to close to 86 000 hectares, mostly in Eastern Visayas, as farmers in many regions had already collected their main-season crops. Prior to Haiyan, however, rice crops had already been hit by late rains, the passage of typhoons Usagi and Utor, and particularly of typhoon Nari, which on its own is reported to have laid waste to 130 000 tonnes of paddy. Given the scale of infrastructural damage and loss of productive assets, there is much uncertainty now clouding the outlook for the largely irrigated secondary crop. At the time of the storm’s landfall, offseason plantings were already underway or about to be launched. The success of these crops now depend on whether facilities are rehabilitated and displaced populations return home in time to complete sowings. As a result, FAO tentatively forecasts production in the Philippines at 18.0 million tonnes, 900 000 tonnes less than previously foreseen and 1 percent below the 2012 outcome. Sri Lanka concluded its 2013 paddy season with the August to September harvest of the secondary Yala crop. Production in the country is officially gauged at a new record of 4.3 million tonnes (3.0 million tonnes, milled basis), 13 percent more than last year, as new lands came under cultivation in the northern and eastern areas, with support from the government. Looking at the individual paddy crops, the bulk of the increase reflects a bumper offseason (Yala) harvest of 1.5 million tonnes (1.0 million tonnes, milled basis), although the main (Maha) crop also grew to 2.85 million tonnes (1.9 million tonnes, milled basis), notwithstanding recurring flooding problems. FAO’s forecast for 2013 production in Thailand, where harvesting of the main crop is presently underway, stands at 38.0 million tonnes (25.2 million tonnes, milled basis), 550 000 tonnes more than expected in July, and a 4 percent year-on-year expansion. The upward revision reflects buoyant official prospects for the main season harvest, which at 28.4 million tonnes (18.8 million tonnes, milled basis), is anticipated to yield 7 percent more than last year, thanks to a conducive weather and high official support prices. Prospects for the offseason crops, soon to be sown, are more subdued, as amendments to the controversial paddy pledging scheme are expected to weigh on producer plantings. This follows an August decision by Thai authorities to maintain mortgaging prices for the main season crop unchanged at Baht 13 800-15 000 (USD 440-478) per tonne, but to reduce them for

6
FAO Rice Market Monitor – November 2013
offseason crops by 13 percent to Baht 13 000 (USD 414) per tonne. In addition, lower value-based ceilings were imposed on the quantities that could be pledged from both the main and offseason crops. The decision comes as the Thai government continues to face significant pressure over the financial implications of its high support price policy. The limits imposed aim to keep the overall volume pledged under the programme at 16.5 million tonnes. This is after the 2012/13 mortgaging target of 22 million tonnes was reported to have been amply met, absorbing close to 60 percent of paddy produced during that season. According to the latest official estimate, Viet Nam is poised to end the season with a paddy harvest of 44.1 million tonnes (29.4 million tonnes, milled basis), 1 percent more than in 2012 and a new high. After harvesting a winter-spring crop similar to last year, the authorities indicated that the summer-autumn crop rose by 3 percent to 14.3 million tonnes (9.5 million tonnes, milled basis). The expansion relied on larger plantings, as delayed rains over parts of the country and successive localised damages to floods depressed yields to an average of 5.2 tonnes per hectare. Production from the third, winter, crop is also assessed 1 percent higher, at 9.5 million tonnes (6.4 million tonnes, milled basis), on the back of area and yield improvements. 2013 marks the eighth uninterrupted season of production expansions in Viet Nam. However, this trend may be interrupted next season, as the successive bumper harvests, along with greater competition in the international markets, have put producer incomes under increasing pressure. In response and ahead of the December launch of 2014 winter-spring planting activities, officials in the country have announced that they will seek to promote alternatives to rice cultivation in 2014, including maize and soybean for use as animal feed.
B. AFRICA Shortfall in Madagascar to keep production in Africa close to the 2012 level
Main paddy crops have by now reached the harvest stage in northern and western Africa, while only a few countries in the southern and eastern parts of the continent have still to complete harvesting activities of offseason crop. On aggregate, the region is currently forecast to produce 26.8 million tonnes (17.5 million tonnes, milled basis), 400 000 tonnes less than last reported and little changed from a revised 2012 estimate. Much of the projected stagnation mirrors an output shortfall in Madagascar, the second largest rice producer in Africa, where crops were heavily impacted by unfavourable weather and locust infestations. Production prospects remain positive elsewhere
in the region, with output in Northern and Western African countries expected to make further inroads. In the central and eastern parts of the continent, crops are anticipated to recover. In Northern Africa, FAO has revised down its estimates of 2012 production in Egypt by 611 000 tonnes based on official assessments that indicate a lower level of plantings and yields than previously estimated. At 5.9 million tonnes (4.1 million tonnes, milled basis), the 2012 output in Egypt stands 4 percent above a year-earlier level, with all of the growth stemming from a 5 percent expansion of area to 620 000 hectares. FAO anticipates the 2013 season crop, currently being
0
4
8
12
16
20
24
28
2009 2010 2011 2012 2013
Rice Paddy Production in Africa
Egypt Nigeria Madagascar Mali Others
million tonnes

7
FAO Rice Market Monitor – November 2013
collected, to amount to 6.1 million tonnes (4.2 million tonnes, milled basis), 3 percent more than in 2012, as expectations of favourable prices fostered a further increase in area coverage. Aggregate paddy output in West Africa is forecast to exceed the 2012 level by 5 percent to 13.4 million tonnes (8.5 million tonnes, milled basis). At a country level, production prospects have improved in Nigeria, which is now predicted to harvest a record 4.7 million tonnes (2.8 million tonnes, milled basis). This would imply a 7 percent upturn from the 2012 reduced level, when crops were negatively impacted by severe floods. Early and well distributed rains this season are expected to sustain the growth, even though some parts of the country were again affected by inundations and dry spells this year. Moreover, the sector has benefitted from strong state support under the country’s self-sufficiency programme, mostly in the form of subsidised fertilizers and seeds channelled through the Growth Enhancement Scheme (GES). The outlook is likewise positive for Guinea, where production could rise by 7 percent to an all time high of 2.1 million tonnes (1.4 million tonnes, milled basis). The result is anticipated to be yield-driven and underpinned by a generally favourable unfolding of the season, with further assistance provided by the Government under its inputs distribution programme. Abundant and well distributed rains are similarly anticipated to boost production in Sierra Leone by 3 percent to 1.2 million tonnes (702 000 tonnes, milled basis) while in Cote d’Ivoire output is officially forecast to rise by 4 percent to 759 000 tonnes (455 000 tonnes, milled basis). The expected expansion in Cote d’Ivoire is notwithstanding sustained constraints to access seeds and other productive inputs. Current expectations also point to likely gains in Chad, Ghana, Guinea Bissau and Mauritania. By contrast, prospects deteriorated for Benin, Liberia and Senegal, which are now foreseen to end the season negatively, primarily on account of erratic rains and damages caused by localized floods. Compared to figures released in July, the 2013 production forecast was also lowered for Mali, to 2.0 million tonnes (1.4 million tonnes, milled basis), although the country might nonetheless witness a 4 percent output increase. Mali, together with various countries in the Gulf of Guinea, was affected by precipitation shortages persisting until mid-July, which delayed plantings, but increased rainfall activity in August eased the prevailing dryness, permitting progress to regain pace. Important input assistance programs are reported to have permitted to keep plantings of irrigated crops at normal levels in the northern part of the country , notwithstanding delays in seasonal flooding. In Eastern Africa, historical production figures for United Republic of Tanzania have been subject to a number of official revisions, pointing to much higher output levels from 2010 to 2012 than originally stated. After reaching an all time high of 2.7 million tonnes (1.7 million tonnes, milled basis) in 2010, inclement weather is assessed to have caused output to contract to 2.2 million tonnes in 2011 (1.5 million tonnes, milled basis) and again to 1.8 million tonnes in 2012 (1.2 million tonnes, milled basis). Prospects for the ongoing campaign are positive, as favourable rainfall is expected to boost both area and yields, lifting output by 3 percent to 1.9 million tonnes (1.2 million tonnes, milled basis). The sector has also benefited from official support to the sector, including input assistance channelled through the National Agricultural Input Voucher Scheme (NAIVS). The programme, introduced in 2009 after a successful pilot phase, provides a 50 percent subsidy on the costs of a package of fertilizers and seeds to farmers cultivating less than one hectare of maize or rice for a period of three years. During the 2013/14 season, the Government intends to provide 932 000 households with support through the scheme. Elsewhere in the sub-region, the outlook is favourable in Burundi, Kenya and Ethiopia. Excellent results are also being reported in Rwanda, where favourable growing conditions boosted first crop output by 24 percent to 42 000 tonnes (28 000 tonnes, milled basis). Coupled with expectations of a favourable secondary crop outturn, Rwanda is forecast to gather 7 percent more than in 2012 or 90 000 tonnes (60 000 tonnes, milled basis), twice the level it produced ten years ago. Higher yields

8
FAO Rice Market Monitor – November 2013
are expected to prompt a 7 percent output recovery in Uganda to 226 000 tonnes (151 000 tonnes, milled basis), with much of the country’s gain attributed to a growing adoption of improved seed varieties. In Southern Africa, where the 2013 season has practically concluded, the production estimate for Madagascar has been lowered by 300 000 tonnes to 3.6 million tonnes (2.4 million tonnes, milled basis), or 21 percent below the good 2012 outcome. Based on the results of a FAO/WFP field assessment, the shortfall was brought about by a combination of inclement weather and pest attacks. In the important northern and central producing regions, late and erratic rains constrained plantings and impacted yields. In the southern parts, damages to crops and infrastructure inflicted by the landfall of cyclones early in the year compounded an outbreak of migratory locust. Fortunately, the South-western region, which was among the most affected by the pest, account for a limited share of the country’s rice output. Locust-control measures are currently underway in the country, as planting activities of 2014 main crops begin. Although a more normal unfolding of the seasonal rains would facilitate a recovery of production, concerns exist over the severe impact that the plague could still have on the upcoming harvest, especially if swarms reach the more important rice producing regions in the northern parts of the country. On the other hand, overturning earlier expectations of a production shortfall, officials in Mozambique indicate that paddy output in 2013 grew by 2 percent to an all time high of 351 000 tonnes (234 000 tonnes, milled basis). As in previous years, all of the production increase relied on an expanded area coverage, with yields estimated to have remained at an average 1.1 tonnes per hectare. Authorities in the country are seeking to address the yield stagnation through interventions such as the introduction of improved varieties, expansion of irrigation capacity and input use. Starting this year, a World Bank project will provide further support to the sector, by funding the establishment of a rice research facility in the Zambezia province.
C. CENTRAL AMERICA AND THE CARIBBEAN Improved growing conditions foster a 5 percent production recovery in the sub-region
Production prospects for Central American and Caribbean now stand at 2.9 million tonnes (1.9 million tonnes, milled basis), 5 percent above the 2012 depressed level, but 100 000 tonnes less than previously envisaged. The revision primarily reflects a deteriorated outlook for Panama, where output is expected to contract for the second consecutive season to 230 000 tonnes (150 000 tonnes, milled basis). The 7 percent shortfall mirrors a growing substitution of other crops for rice, including sugar and palm, a reaction to high input prices, credit constraints and high levels of indebtedness of the sector. Production forecasts have also been lowered for Mexico, following revisions to 2012 figures, which put output in the country at 179 000 tonnes (119 000 tonnes, milled basis). The revised level would imply an only marginal recovery from the 2011 low, as the industry continued to suffer from import competition, indebtedness and difficulties in marketing the produce. The outlook is more positive for the ongoing 2013 season. Under prospects of greater returns and assistance provided to the sector, Mexico is forecast to gather 210 000 tonnes (140 000 tonnes, milled basis). Officials in the Dominican Republic report damages to hurricanes in 2012 to have been greater than previously reported, with output declining by 11 percent to 756 000 tonnes (499 000 tonnes, milled basis). The 2013 season has so far progressed without major setbacks, which could permit both area and yields to rebound. As a result, the country is now predicted to gather 820 000 tonnes (541 000 tonnes, milled basis), 8 percent more than in 2012. Elsewhere in the sub-region, the wet season harvest has just been concluded in Cuba. FAO anticipates production in the country to grow for the third consecutive season to 650 000 tonnes (434 000 tonnes, milled basis). The increase is expected to be sustained by investments in the sector,

9
FAO Rice Market Monitor – November 2013
as part of the Government’s import substitution programme, which are targeting to improve overall access to machinery and inputs, as well as establishing new processing and storage facilities. Adding to the assistance already received from Viet Nam, Cuba is to benefit from technical support from Brazil under a cooperation agreement signed this year. In Haiti, a return to more normal growing conditions is also anticipated to prompt a recovery of 2013 paddy output to 130 000 tonnes (87 000 tonnes, milled basis). In Costa Rica, a return to average yields, which hit a low of 2.8 tonnes per hectare in 2012, is expected to facilitate a 7 percent upturn of production to 230 000 tonnes (150 000 tonnes, milled basis). The productivity improvement is to compensate for area retrenchments resulting from lower expected margins. The outlook also remains positive for El Salvador, Honduras and Nicaragua.
D. SOUTH AMERICA Unfavourable margins keep paddy plantings stable around the 2012 reduced level
Since most countries located in South America have already concluded the 2013 paddy season, production prospects for the sub-region have changed little since the last issue of the RMM. On aggregate, the sub-region is assessed to have gathered 25.1 million tonnes (16.8 million tonnes, milled basis), signifying an only partial recovery from the 2012 poor result. All of the 2 percent increase is estimated to have stemmed from yield improvements, as prospects of unfavourable margins kept area planted to paddy at the 2012 reduced level. Output gains in Brazil, Colombia, Ecuador, Guyana, Paraguay, Peru and Venezuela were responsible for the recovery, compensating for shortfalls in Argentina, Bolivia, Chile and
Uruguay. Meanwhile, with 2014 crop planting activities well advanced in the sub-region, early prospects for the forthcoming season point to little change from the 2013 paddy campaign, as high production costs and more attractive prices for other crops continue to stall area growth. In Argentina, the latest official assessments continue to gauge the 2013 harvest at 1.6 million tonnes (1.1 million tonnes, milled basis), 0.5 percent below the already poor 2012 result. The contraction stemmed from area cuts due to prospects of low returns, but higher yields partly compensated for the fall. Producers in Argentina are already busy planting 2014 crops. Based on surveys of planting intentions, good supplies of water for irrigation may permit the area under paddy to remain stable in the largest producing provinces of Corrientes and Entre Rios. High fuel costs, however, remain a concern in Entre Rios, which relies on diesel pumps for irrigation, although reports suggest that some producers have moved towards gas-powered pumps to mitigate expenses. Production in Bolivia contracted sharply in 2013, under the combined effects of unfavourable weather and low prices. Officially, the harvest amounted to 435 000 tonnes (298 000 tonnes, milled basis), down 26 percent from the 2012 record level. With the 2014 season already launched, torrential rains and floods have delayed planting activities in the main producing region of Santa Cruz. Nonetheless, a rise in local quotations are raising expectations of a recovery of plantings in 2014. On the policy front, authorities have agreed to keep prices paid to producers by the state enterprise EMAPA unchanged at USD 55 per fanega (USD 275 per tonne), following negotiations with industry representatives.
0
4
8
12
16
20
24
28
32
2009 2010 2011 2012 2013
Rice Paddy Production in Latin America and the Caribbean
Brazil Colombia Peru Uruguay Others
million tonnes

10
FAO Rice Market Monitor – November 2013
In Brazil, officials estimate the 2013 paddy season to have yielded 11.7 million tonnes (7.9 million tonnes, milled basis), 1.3 percent above the poor 2012 outcome, but some 100 000 tonnes less than previously envisaged. The small upturn in 2013 was made possible by higher yields, which made up for area retrenchments. This is despite some climatic setbacks, which caused plantings in various producing regions to conclude outside of the recommended period. Meanwhile, the October-opened 2014 season is unfolding under normal conditions, with plantings progress reported half complete by early November in the main producing region of Rio Grande do Sul. Based on CONAB’s latest assessment, the 2014 rice coverage in Brazil is to change little, hovering around 2.4 million hectares, again because of the high production costs faced by producers and the incentive for them to move to more profitable crops such as maize and soy. However, on anticipation that average yields will rise further, officials predict Brazil to produce between 12.0 and 12.3 million tonnes (8.0-8.2 million tonnes, milled basis), which would be 2.1-4.8 percent above the current 2013 estimate. The 2013 harvest in Chile fell 13 percent short of year-earlier levels to 130 000 tonnes (88 000 tonnes, milled basis). The reduction stemmed from area retrenchments due to insufficient availabilities of water for irrigation, although a conducive growing climate permitted average yields to remain at highs of 6.2 tonnes per hectare. According to a survey of planting intentions conducted by authorities, 21 500 hectares will be sown to paddy in 2014, 2 percent more than year-earlier levels, reflecting an improved water supply situation. In Colombia, where the 2013 season is still ongoing, favourable growing conditions are behind expectations of a 1 percent production increase to 2.6 million tonnes (1.8 million tonnes, milled basis). On the policy front, the sector has benefitted from Government assistance, including the institution of price bands under the storage incentive programme and the provision of subsidies to support yield recoveries in areas that were affected by adverse weather in previous seasons. Following widespread agricultural sector protests in August, the authorities have taken steps to eliminate import duties on productive inputs and agreed to establish a system to monitor and regulate their prices. Government assessments in Ecuador indicate that damages to crops inflicted by floods and pest attacks had a limited impact on 2012 production, which totalled 1.56 million tonnes (892 000 tonnes, milled basis). This would imply a 6 percent upturn from the 2011 low level of output and stand some 200 000 tonnes higher than previously envisaged. Prospects for the 2013 season are also positive. Despite some localized dryness, overall favourable growing conditions are expected to sustain a 2 percent output increase to 1.6 million tonnes (912 000 tonnes, milled basis). In Guyana, officials report that a record of 405 500 tonnes of paddy were reaped during the 2013 main season crop despite some localized pest and weather problems. On the whole, the country is now anticipated to gather a new record of 740 000 tonnes of paddy (481 000 tonnes, milled basis) in 2013, marking the sixth consecutive season of output gains. Paraguay is also estimated to have ended the 2013 season with a record level achievement of 600 000 tonnes (420 000 tonnes, milled basis), largely on the back expanded plantings, as producers reacted to growing export opportunities. By contrast, in Uruguay, output stagnated around the 2012 low level of 1.4 million tonnes (994 000 tonnes, milled basis). Based on an ample supply of water for irrigation, prospects for the forthcoming 2014 crop are more buoyant: field reports indicate that area under paddy may recover somewhat,

11
FAO Rice Market Monitor – November 2013
despite sustained concerns over high production costs and some delays in planting caused by untimely rains. Reversing previous expectations of an output decline, Venezuela is now envisaged to gather 1.0 million tonnes (718 000 tonnes, milled basis), nearly 200 000 tonnes more than previously forecast and 11 percent more than in 2012. The increase is largely expected to mirror expansions in area planted to paddy, supported by a favourable growing climate. Additional support is being provided to the sector by the Government. After allocating Bolívares 3.0 billion (USD 475 million) to a special assistance fund for agricultural producers, in August, the authorities raised subsidies for the winter crop cycle. According to the decision, paddy producers will receive Bolívares 2.13 per kilo of paddy gathered between 1 August and 30 December 2013 (USD 338 per tonne), on top of official producer support prices of Bolívares 2.50 -2.58 per kg (USD 396-409 per tonne).
E. NORTH AMERICA, EUROPE AND OCEANIA Production in the United States and the European Union set to fall, but Australia ends the season
with favourable results In North America, by 5 November, the 2013 season harvest was reported 98 percent complete in the United States. The latest official assessments have upgraded production forecasts for the country by over 400 000 tonnes based on expectations of higher yields. Notwithstanding delays in plantings caused by adverse weather, yields look set to outdo last season’s record by 3 percent and reach 8.6 tonnes per hectare. With the higher productivity level expected to compensate for area retrenchments, production in the country is now officially gauged at 8.6 million tonnes (6.0 million tonnes, milled basis), which is still 5 percent below the 2012 level. In Europe, production prospects remain negative for the European Union, which is forecast to face a 9 percent output contraction to 2.9 million tonnes (1.7 million tonnes, milled basis). At a country level the reduction would reflect output shortfalls in all the major EU producers. The outlook has particularly deteriorated in Spain, where reduced price prospects are officially reported to have prevented the area from recovering from the 2012 drought-stricken level. Combined with expectations of yields coming down from last year’s excellent levels, Spain is officially forecast to produce 2 percent less, or 863 000 tonnes (518 000 tonnes, milled basis). By contrast, the outlook is somewhat improved in Italy, where a conducive summer climate helped temper the negative impacts on yields arising from late plantings and unfavourable spring weather. As a result, Italy’s production forecast has been raised to 1.4 million tonnes (840 000 tonnes, milled basis), still 13 percent below the 2012 level. Outside of the EU, there have been no changes in the production forecast for the Russian Federation, with officials still expecting area expansion to support a 3 percent year-on-year output increase to 1.1 million tonnes (723 000 tonnes, milled basis). In Oceania, estimates of 2013 production in Australia have been only marginally revised, with the country gauged to have gathered 1.2 million tonnes (778 000 tonnes, milled basis), 27 percent more than a year earlier and the highest in over a decade. An 11 percent area expansion to 114 000 hectares sustained the result, although yields also staged a strong recovery reaching their second highest level on record of 10.2 tonnes per hectares. ABARES’s outlook for the 2014 season is more downcast, largely due to the dry winter conditions prevailing over New South Wales this year. On expectations that the more limited water supply situation will constrain plantings and that yields will return to more normal levels, the agency expects 2014 production in Australia to fall 22 percent short of the excellent 2013 outcome to 907 000 tonnes (605 000 tonnes, milled basis).

12
FAO Rice Market Monitor – November 2013
II. INTERNATIONAL TRADE IN RICE Faltering import demand depresses world rice trade in 2013, while early prospects point to a recovery
in global deliveries during 2014 FAO’s forecast of world trade in rice in calendar 2013 remains at 37.5 million tonnes (milled basis), little changed from the July outlook. Country level trade figures were, however, subject to a number of revisions. On the import side, forecasts were lowered mostly for Asian countries, of which particularly Indonesia, but also China (Mainland), the Democratic People’s Republic of Korea and Malaysia. Import forecasts were instead raised for the Islamic Republic of Iran, South Africa and Thailand. On the supply side, export forecasts were lowered for Brazil, Cambodia, China (Mainland), Myanmar, Thailand and Viet Nam, while those by India and Pakistan were raised.
At the current estimate of 37.5 million tonnes, world trade in rice in 2013 would fall 2 percent short of the 2012 record. The retrenchment is expected to be demand-led, mostly imputable to import cuts in the Far East and West Africa, a reflection of good crops gathered there, but also of the restrictive policies instituted as part of self-sufficiency programs. Poor production results, combined with strong domestic demand are, instead, foreseen to lift purchases in Europe, Latin America and the Caribbean and North America. Looking at the major rice exporters, faltering import demand is now foreseen to affect shipments by Viet Nam the most, although supply constraints and high
prices are also expected to depress rice exports by Argentina, Brazil, Thailand and Uruguay. Expectations have, instead, improved for India, which looks set to ship as much as the 2012 record performance, with Australia, Cambodia, China (Mainland), Egypt, Paraguay Pakistan and the United States also forecast to export more than last year. Largely based on current expectations for 2013 production in northern hemisphere countries and early prospects for 2014 crops south of the equator, FAO tentatively forecasts 2014 trade in rice to recover by 2 percent to 38.3 million tonnes, almost at par with the 2012 high. From a regional perspective, Europe and North America are projected to step up purchases so as to make up for production shortfalls, while efforts to refurbish stocks may provide a boost to Asian and African imports. Among the exporters, Thailand is projected to capture much of the trade growth, provided Thai officials continue to let prices converge to levels in others origins, thus restoring the country’s competitive edge. Greater Thai exports are primarily expected to offset lower shipments by India, which, nonetheless, is anticipated to retain its position as the world’s largest supplier of rice. For the other trade suppliers, the export outlook is positive for Brazil, Cambodia, China (Mainland), Egypt, Guyana, Paraguay and Viet Nam, while Argentina, Pakistan, the United States and Uruguay could see shipments fall.
0
50
100
150
200
250
300
10
15
20
25
30
35
40
2005
2006
2007
2008
2009
2010
2011
2012
2013
2014
Exports FAO Rice Export Price Index
million tonnes, milled eq. 2002-2004=100f'c
ast
Global Rice Trade and Price Index

13
FAO Rice Market Monitor – November 2013
A. IMPORTS Fewer purchases by Indonesia and Nigeria drive decline in 2013 trade in rice
Based on the latest figures, countries in Asia are set to cut their 2013 purchases by 3 percent to 17.5 million tonnes. The retrenchment is expected to be on account of smaller deliveries to the Far East, with the largest reduction now forecast to take place in Indonesia. Consistent with the improved production outlook, the country is forecast to see consignments fall from over 1.8 million tonnes in 2012 to 800 000 tonnes this year, mostly consisting of private sector imports. Indeed and despite initial indications that up to 600 000 tonnes would be needed from abroad, officials in the country report that Bulog, the state trading agency, completed its local purchasing target of 3.2
million tonnes by October, sufficient to it to meet, both, the mandated end-of year stock level and run the expanded welfare operations. Rice imports by the Philippines are similarly seen falling by 20 percent in 2013 to 1.0 million tonnes, primarily on account of large availabilities from a good 2012 harvest. The forecast volume is expected to include commercial imports, contracted by public and private operators, as well as deliveries in the form of food aid in the aftermath of typhoon Haiyan. Authorities in the Philippines have responded to the immediate needs of the typhoon-affected populations by stepping-up distribution of rice from government inventories. Between 8 and 14 November, close to 4 000 tonnes of rice were reported distributed in affected areas. Although the need to refurbish inventories to service relief operations could prompt officials to approve imports beyond the 350 000 tonnes already authorised for 2013, FAO anticipates the bulk of these volumes to be delivered in 2014. Meanwhile, a combination of sluggish export demand and a stepping up of border protection are also expected to curb rice inflows to Thailand to 550 000 tonnes, most of which consisting of unrecorded trade in the form of paddy for processing and export. On the other hand, the 2013 import forecast has been lowered for China (Mainland), where high domestic prices are now expected to keep purchases marginally changed from the 2012 record level of 2.4 million tonnes. In the case of Bangladesh, a slow pace of deliveries recorded to date led to a downward revision of imports to 50 000 tonnes. Based on official assessments Malaysia, too, is likely to keep volumes purchased stable at 992 000 tonnes. By contrast, Bhutan, Japan, the Chinese Province of Taiwan, the Democratic Republic of Korea, Singapore and Timor Leste may all close the year with larger imports. Nevertheless, the Republic of Korea is currently the only country within the sub-region foreseen to step-up purchases considerably in 2013, as it compensates for poor harvest results and attempts to keep prices in check. Counter to the prevailing tendencies in the rest of the region, import demand is forecast to remain strong in 2013 among Asian countries situated in the Near East. This is particularly the case of the Islamic Republic of Iran, which has been actively present in the market in 2013, taking delivery of 1.3 million tonnes between January and August, 11 percent more than in the corresponding period of 2012. India remains Iran’s foremost supplier of rice, but growing amounts have been sourced by Iran
Asia
Africa
Others
0.0 5.0 10.0 15.0 20.0
2013 2014 F
Rice Imports by Regions in 2012 and 2013
(million tonnes, milled equivalent)
F=forecast
Lat. America & Car.

14
FAO Rice Market Monitor – November 2013
from Uruguay, the United States and more recently also Thailand. FAO now anticipates overall 2013 deliveries to Iran to surpass the 2012 record level by 11 percent to 1.7 million tonnes. Consistent with growing consumption of rice in the region, current expectations also point to a higher level of consignments to Jordan, Oman, Saudi Arabia, Turkey and the United Arab Emirates, while Iraq is forecast to take-in 1.45 million tonnes, in order to satisfy the needs of the ration card system. Mostly based on current expectations for 2013 paddy crops, rice imports to Asia in calendar 2014 are seen ending 3 percent higher at 18.0 million tonnes. Looking at the individual countries, China (Mainland) is forecast to remain the foremost rice destination in the region, importing 2.7 million tonnes, 300 000 tonnes more than currently estimated for 2013. Although China is facing a production decline in 2013, the increase in shipments is primarily based on expectations that high domestic prices will encourage traders to keep sourcing supplies from abroad. The country has also been reported to have engaged Thailand in numerous purchasing agreements through official channels. Meanwhile, in September, the Chinese authorities announced that the 2014 tariff-rate import quota for rice will remain unchanged at 5.32 million tonnes, with the volume to be distributed equally between state trading enterprises and the private sector. Indonesia is also provisionally forecast to lift rice purchases to 1.1 tonnes next year, although import prospects for the country remain uncertain at this stage, since much will depend on the success of 2014 crops, which are just being planted. Official purchasing decisions in the country over the year will likely be influenced by a number of factors, including the pace of public domestic purchases, quantities to be allocated to the public subsidized distribution programme (Raskin), and by the recently announced plans to raise the level of strategic reserves to 1.0 million tonnes. The latter would be in addition to the 2.0 million tonnes required to be held by Bulog at the end of each marketing year. At 150 000 tonnes, rice imports by Bangladesh would also stand higher than purchases in 2013, but still comparatively small, underscoring the country’s overall ample supply situation that have permitted imports to remain at a fraction of the 1.5 million tonnes secured in 2011. Rice purchases by Malaysia are also seen ending slightly higher at 1.0 million tonnes. Although still preliminary, the Philippines is also forecast to lift purchases by 200 000 tonnes to 1.2 million tonnes in 2014, subject to adjustment should damages to typhoon Haiyan prove larger than currently reported. Given the good harvest expectations and refurbished stock levels, the Philippines’ authorities had earlier announced their intentions to cap purchases next year at 350 000 tonnes, equivalent to the Minimum Access Volume (MAV) committed to the WTO.3 The policy was consistent with the government’s self-sufficiency stance, which has led to falling imports by the National Food Authority and curbed overall deliveries to the country in recent years to well below the 2.4 million tonnes delivered in 2010. Import decisions may, however, be reviewed next year, especially as public rice inventories will need to be refurbished, following the conspicuous releases made in the aftermath of typhoon Haiyan. Additional supplies might be required to cover the damage caused by the typhoons to the standing crops and to the rice that was already harvested prior to the storm’s landfall, especially if the destruction of the infrastructure and losses of lives further impair the unfolding of the secondary paddy crop in the affected areas. Conversely, the Republic of Korea is forecast to purchase 410 000 tonnes in 2014, equivalent to the country’s Minimum Market Access (MMA) quota for the year. This would be down from the
3 Although the special treatment on rice formally expired on 30 of June 2012, the Philippines continues to adhere to the regime while awaiting the conclusion of negations to extend its coverage until 30 June 2017. As a result, rice imports remain under the full control of the National Food Authority, which undertakes purchases directly, alternatively licensing private operators to do so.

15
FAO Rice Market Monitor – November 2013
520 000 tonnes expected for 2013, a volume that includes purchases conducted under both 2012 and 2013 MMA commitments. In the aftermath of two years of brisk imports, the Islamic Republic of Iran is also expected to be sufficiently well-stocked to cut 2014 deliveries to 1.5 million tonnes. Among the other buyers in the regions, the Chinese Province of Taiwan, Japan and Singapore are expected to keep purchases largely unvaried around their 2013 levels. FAO’s latest forecast of total African imports in 2013 stands at 12.9 million tonnes, 325 000 tonnes more than last envisaged, but 5 percent below the record of 2012. Compared to import forecasts reported in the previous issue of the RMM, upward adjustments have primarily concerned Eastern and Southern African countries, of which, particularly South Africa, which is seen taking delivery of 1.35 million tonnes, 4 percent more than the 2012 high level of imports. Cumulative deliveries to the country by August were officially reported to have surpassed year-earlier levels by 26 percent reaching close to 860 000 tonnes, most of which originating from India, Thailand and China. The pace of imports by Madagascar has also been brisk, reflecting the severe output shortfall caused by inclement weather and locust attacks this year. By September, the country had already taken delivery of 235 000 tonnes of rice, exceeding the volume bought during the whole of 2012 by 15 percent. Madagascar is now expected to take consignment of 300 000 tonnes of rice during 2013, or almost 50 percent more than in 2012. Officials in Kenya indicate a likely higher level of imports of 405 000 tonnes in 2013, while in the case of the United Republic of Tanzania and Cameroon these are expected to rise to 230 000 tonnes and 510 000 tonnes, respectively, on account of poor harvest results. Elsewhere in the continent, import demand is forecast to remain weak. The year-on-year cut is mainly attributable to Nigeria, where greater protective measures are expected to push deliveries 17 percent below year-earlier levels to 2.5 million tonnes. Largely reflecting improved supply situations, Cote d’Ivoire, Ghana, Guinea, Mali, Senegal, Sierra Leone and Togo are similarly seen to reduce their imports in 2013. In 2014, countries in Africa are forecast to take consignments of 13.1 million tonnes, which is 2 percent more than current expected for 2013. Within the region, Nigeria is projected to import 8 percent more or 2.7 million tonnes. The projected increase rests on expectations of the country having to refurbish the stocks that were depleted in 2013 to cover the flood-related output shortfalls. Moreover and despite official efforts to clamp-down on unofficial imports, large quantities of rice have continued to flow into the country through its porous land borders. Unrecorded border trade has also raised concerns in Ghana, where, effective November 2013, rice imports will only be permitted through selected ports. Despite the measure, FAO anticipated purchases by the country to reach 640 000 tonnes in 2014, which would 5 percent above year-earlier levels. Current indications also point to Kenya, Liberia, Mali and Togo, having to lift purchases to meet ever-growing domestic demand, while in the case of Benin and Burkina Faso larger supplies will also be needed to compensate for poor production results. FAO anticipates greater purchases in these countries to be partially offset by cuts in Guinea, Cote d’Ivoire, Mozambique, Sierra Leone and the United Republic of Tanzania. Despite the expected reduction in 2013 production, large carryovers could enable Senegal to curb imports over the year. Rice imports by South Africa are expected to remain about unchanged at the 2013 level. Rice deliveries in 2013 to countries in Latin America and the Caribbean are forecast to amount to 3.9 million tonnes, 4 percent more than in 2012 and slightly higher than last reported. Looking at the major buyers in the region, consignments to Brazil are anticipated to surpass their 2012 levels by 11 percent to 800 000 tonnes, in reaction to an only partial output recovery and lingering high local prices. In the case of Mexico, imports are expected to rise by 5 percent to 670 000 tonnes, spurred by growing consumption needs in the face of a comparatively small crop. Rice purchases by Nicaragua in 2013 are forecast at 80 000 tonnes, largely unchanged from 2012. The purchased volume is

16
FAO Rice Market Monitor – November 2013
expected to be facilitated by the establishment of two duty-free shortage import quotas for 105 311 tonnes of paddy and 8 500 tonnes of husked/milled/broken rice, which come in addition to tariff-rate quotas set under the DR-CAFTA and WTO commitments. Production shortfalls are also envisaged to prompt Bolivia, Costa Rica, Haiti, and Panama to purchase more over 2013, whereas, in Colombia, the increase is expected to be associated with the fulfilment of bi-lateral trade commitments, namely with the United States. Larger purchases by these countries, combined, would more than compensate for reductions in Chile, Cuba, Honduras, Ecuador, Peru and Venezuela. As to prospects for 2014, FAO anticipates the region to cut rice purchases by 2 percent to 3.8 million tonnes, overall. The reduction is mostly expected to be on account of a 5 percent cut in deliveries in South America to 1.6 million tonnes, much of which concentrated in Brazil. A larger crop gathered there is envisaged to prompt a 6 percent fall in imports to 750 000 tonnes. Based on current expectations of an output recovery, Venezuela too reduce purchases by 14 percent to 345 000 tonnes, with less pronounced declines also anticipated in Chile and Peru. By contrast, current expectations point to a possible small increase in shipments to Central America and the Caribbean, to 2.2 million tonnes, led primarily by Costa Rica and Panama, which harvested below average production outturns this season. Greater domestic availabilities are, instead, seen leading to further reductions in Cuba and Honduras, while volumes purchased by both Mexico and Haiti are anticipated to remain around 2013 levels. In the other regions, officials in the European Union foresee a volume of 1.26 million tonnes to be delivered to the region in 2013, which is somewhat lower than last envisaged by FAO. The forecast volume would still represent a 9 percent year-on-year increase, with the rise in part sustained by growing milled rice deliveries from Cambodia, which enjoys preferential access to the region under the Everything-but-Arms initiative. Given current expectations of poor production results, the region is expected to raise its level of purchases by a further 11 percent to 1.4 million tonnes in 2014. During the first half of the 2013/2014 marketing year (started on 1 September), EU import duties on non-basmati husked rice and on semi/wholly milled rice will remain steady at Euro 30 and Euro 175 per tonne, respectively. Elsewhere in Europe, officials in the Russian Federation decided, effective 1 September 2013, to lift the restrictions on rice imports from India that were imposed in February 2013 after khapra beetles were found in a consignment from the country. In 2012, India accounted for over a quarter of rice deliveries to Russia. Despite this year’s disruption, imports by the country have continued at an upbeat pace to date, buoyed by larger consignments from Viet Nam. For the whole of 2013, FAO now anticipates Russia to take in 210 000 tonnes, a level which may fall by 10 percent in 2014 due to larger domestic availabilities. On the other hand, the USDA has kept forecast of 2013 imports by the United States steady at 700 000 tonnes, a volume the agency predicts will be surpassed in 2014, when US imports may reach a record of 725 000 tonnes.
B. EXPORTS India set to replicate the 2012 record export performance
FAO’s forecast of world trade in 2013 points to a 2 percent contraction from the record achieved in 2012. Among the major exporters, Viet Nam is anticipated to see shipments fall due to weak import demand in its traditional Asian markets. Dragged down by uncompetitive prices, shipments by Thailand are similarly forecast to end with a second consecutive year of reductions. By contrast,

17
FAO Rice Market Monitor – November 2013
India, looks set to replicate the 2012 record performance, on the back of ample availabilities and favourable currency movements, which have boosted the country’s competitiveness. The export outlook also remains favourable for Australia, Cambodia, China (Mainland), Egypt, Pakistan, Paraguay and the United States, whereas supply constraints are foreseen to hinder rice deliveries by Argentina, Brazil and Uruguay.
Based on current expectations, global trade in rice is likely to see a near full recovery in 2014, reaching 38.3 million tonnes, only fractionally short of the 2012 record of 38.4 million tonnes. On the export side, an ample enough supply situation may enable Brazil, China (Mainland), Egypt, Guyana and Paraguay to step-up deliveries. Singularly, however, much of the global growth is forecast to be captured by Thailand, where a recent stance to release supplies from the huge stocks accumulated through the paddy pledging programme could help the country to regain part of the market share lost to uncompetitive prices in recent years. Greater competition resulting from an increase in Thai
supplies in the world markets is expected to come to the detriment of a number of suppliers. India is foremost amongst these, although the country is still forecast to retain its dominant position in the global rice market. Rice shipments by Argentina, Myanmar, Pakistan, Uruguay and the United States are similarly anticipated to fall, under prospects of more intense competition combined, for some, with little or negative production growth. By contrast, a revival in buying interest by important Asian outlets may permit shipments by Viet Nam to recover over the course of the year. Based on the latest figures, Cambodia may close calendar 2013 with a 13 percent boost in rice exports to 1.2 million tonnes. The exceptional performance is expected to be sustained by ample supplies and increased investment in processing capacity, including from Thai traders attracted by the more affordable supplies offered in the country. Cambodia is presently seen exporting 1.3 million tonnes in 2014, with the growth in part reflecting prospects of further increases in direct milled rice exports, as opposed to border trade in the form of paddy. Indeed, officials report that official shipments from Cambodia approached the 300 000 tonne mark in the first ten months of 2013, close to double the amount delivered during the corresponding period of 2012. Even though high local prices have severely hindered China’s ability to compete in the Indica market, a revival of demand for japonica varieties from the Republic of Korea is expected to help rice shipments by the country regain ground in 2013, reaching 400 000 tonnes. Given expectations of still ample availabilities of japonica rice, notwithstanding the overall shortfall in national production, China (Mainland) is expected to export 500 000 tonnes in 2014, 25 percent more than the 2013 estimate. Based on preliminary export data, rice shipments by India between January and September 2013, amounted to 8.1 million tonnes, which compares with 7.7 million tonnes in the preceding year. The faster pace of deliveries was sustained by basmati sales, although, since May, exports of non-basmati rice also accelerated, assisted by a depreciating rupee. As a result, India is now envisaged to ship 10.5 million tonnes in 2013, 1.7 million tonnes above the July forecast and comparable to the 2012
0.0
2.0
4.0
6.0
8.0
10.0
12.0
India Pakistan Thailand USA Viet Nam Others
Rice Exports by Major Exporters
2013 2014 F
million tonnes, milled eq.
F=forecast

18
FAO Rice Market Monitor – November 2013
record level of deliveries. Based on the currently upbeat prospects of production, India is expected to count on sufficient availabilities to retain its dominant position in the world rice market also in 2014. However, given expectations of more intense competition in the plain Indica rice segment, as greater Thai supplies enter the market, India is forecast to see its shipments fall by 11 percent to 9.3 million tonnes next year. After reaching a high of 3.5 million tonnes in 2010, rice exports by Pakistan have come under increasing pressure from tight availabilities and severe electricity shortages. This has been, particularly the case in the
Basmati market, where the country has been consistently outcompeted by India. While affordable prices in the non-basmati segment are expected to keep 2013 shipments from Pakistan at 3 million tonnes, or 7 percent above 2012 levels, the outlook for 2014 has been dampened by prospects of intense competition for markets. Next year, exports from the country would be further constrained if current expectations of flood-related losses in the basmati producing areas are confirmed. As a result, FAO anticipates Pakistan to ship 2.9 million tonnes in 2014, which would be 3 percent below the current 2013 forecast. Reflecting the country’s loss of competitiveness since the implementation of the Government’s high producer price policy in 2011, Thailand is projected to keep exports in 2013 close to the 2012 subdued level of 6.75 million tonnes. Prospects for 2014 sales are more positive, given the considerable decline in Thai export quotations registered in the run up to the 2013/14 round of the paddy pledging scheme. The reduction came amid renewed efforts by the Thai authorities to offload supplies from public granaries to secure funds for the continuation of the programme. Against this backdrop, close to 1.1 million tonnes of rice were put to auction by officials since July 2013. The Thai government hopes that stock releases, combined with a weaker Baht will help revive rice exports to 8 million -10 million tonnes in the forthcoming year. On the G2G front, the country is reported to have reached a deal with the Islamic Republic of Iran to ship 250 000 tonnes and to have engaged China in various bilateral import agreements. Assuming Thai authorities continue offloading public stocks to fund the programme and reduce the volume of their purchases under the pledging programme (hence prompting farmers to sell more through the market), FAO anticipates Thailand to ship 8.5 million tonnes in 2014, which would be 26 percent above the 2013 expected level. FAO has lowered its 2013 forecast of rice exports by Viet Nam to 6.9 million tonnes, implying an 11 percent fall in deliveries from the 2012 record. The 800 000 tonne downward revision takes into account the slow pace of exports recorded to date, which saw cumulative deliveries to October fall 14 percent short of year-earlier levels to 5.9 million tonnes. Viet Nam’s rice export performance has been considerably affected by a reduction in buying interest from its traditional Asian outlets, especially Indonesia and the Philippines. According to official statistics, the pace of shipments to China (Mainland) has also slowed in recent months, although reports suggest that larger volumes are being delivered through unrecorded deals across the countries’ borders. Outside of Asia, the situation has been compounded by difficulties in competing for African markets, to which Vietnamese traders have increasingly looked to compensate for diminishing Asian sales. Some encouragement was,
0
200
400
600
800
1000
1200
Jan
-11
Mar
-11
May
-11
Jul-
11
Se p
-11
No
v-11
Jan
-12
Mar
-12
May
-12
Jul-
12
Se p
-12
No
v-12
Jan
-13
Mar
-13
May
-13
Jul-
13
Se p
-13
Basmati
Non Basmati
India: Monthly Rice Exports 2011 - 2013

19
FAO Rice Market Monitor – November 2013
however, provided by the striking of an import agreement with Comoros in August, which adds to similar accords signed by Viet Nam with Guinea and Sierra Leone. The 2013 disappointed performance comes after successive years of record deliveries, that was supported by the government stance to keep export prices at extremely competitive levels. Although much will depend on the size of the 2014 paddy crop, under current expectations of a revival in buying interest by several important Asian importers, FAO anticipates rice exports from the country to recover somewhat in 2014, to 7.2 million tonnes. On 7 November, officials in Egypt opened bids for 100 000 tonnes of export licenses, with the volume required to be delivered by 15 January 2014. This is the fourth of such auctions to take place since the ban on milled rice exports was lifted in October 2012 and an export tax instituted in its place, together with a tendering system to acquire shipping licences. Indeed, authorities place priority on domestic price stability and on ensuring that GASC acquires sufficient volumes to serve the ration card system. As a result, rice exports by Egypt are only foreseen to rise slightly to 400 000 tonnes in 2013, a level that is expected to remain largely unchanged in the following year. The USDA has kept forecasts of 2013 exports by the United States unchanged at 3.4 million tonnes, since July. The 3 percent year-on-year expansion is primarily expected to be sustained by demand from markets in Latin American and the Caribbean, but also by sales to the Near East. The latter include delivery of close to 126 000 tonnes to the Islamic Republic of Iran in the first nine months of the year, but also a deal struck in October for 40 000 tonnes to Iraq. The sale marks the first of its kind since US shipments to Iraq came to an abrupt halt in January 2011 due to stringent quality and shipping conditions. The outlook for 2014 consignments is less buoyant, with the USDA anticipating greater competition over Near Eastern and African markets in the long-grain segment to lead to a 6 percent drop in shipments to 3.2 million tonnes. Prospects may prove more positive in the Japonica market, particularly in view of expectations of reduced output in Australia and continued export constrains in Egypt. Among the major South American origins, Brazil is now anticipated to deliver 700 000 tonnes in 2013, 100 000 tonnes less than previously envisaged and 37 percent less than in 2012. The contraction comes as a result of strong prices, notwithstanding a significantly weaker local currency, which have strongly reduced shipments to African countries. A more contained decline is anticipated in Uruguay, which has been able to maintain a hold over Near Eastern markets, despite a drop of sales to Brazil, which has moved to source growing amounts from Paraguay and Argentina. The country is anticipated to ship 900 000 tonnes in 2013, 90 000 tonnes lower than in 2012, but still a broadly average performance. Tighter availabilities are also behind an anticipated 3 percent decline in 2013 exports by Argentina to 610 000 tonnes. Based on early prospects for production over the forthcoming season, FAO anticipates an improved supply situation to enable exports by Brazil to recover somewhat in 2014, to 750 000 tonnes. Despite the overall negative performance of recent years, Brazil, together with the other major South American suppliers, has made steady headway in penetrating Central American and Caribbean markets, which have traditionally sourced their rice in the United States. Further encouragement has been provided by an October decision of Iraqi officials to include Brazil as an optional origin in tenders conducted to secure supplies for the country’s ration card system. The outlook is less favourable for Uruguay, which may see shipments fall by 11 percent to 800 000 tonnes in 2014, due to much stronger competition in the higher quality segment, especially from Thailand. Uncompetitive prices are similarly expected to depress sales by Argentina, while ample availabilities may, instead, enable both Guyana and Paraguay to boost shipments over the course of the year.
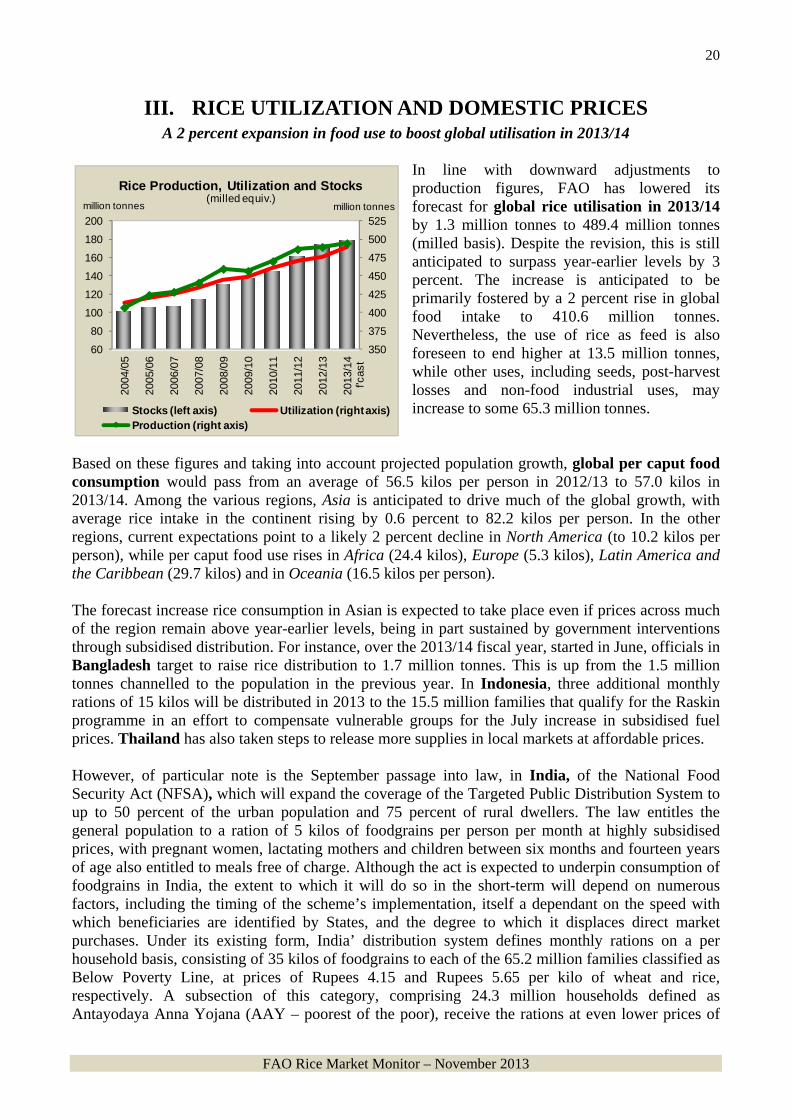
20
FAO Rice Market Monitor – November 2013
III. RICE UTILIZATION AND DOMESTIC PRICES A 2 percent expansion in food use to boost global utilisation in 2013/14
In line with downward adjustments to production figures, FAO has lowered its forecast for global rice utilisation in 2013/14 by 1.3 million tonnes to 489.4 million tonnes (milled basis). Despite the revision, this is still anticipated to surpass year-earlier levels by 3 percent. The increase is anticipated to be primarily fostered by a 2 percent rise in global food intake to 410.6 million tonnes. Nevertheless, the use of rice as feed is also foreseen to end higher at 13.5 million tonnes, while other uses, including seeds, post-harvest losses and non-food industrial uses, may increase to some 65.3 million tonnes.
Based on these figures and taking into account projected population growth, global per caput food consumption would pass from an average of 56.5 kilos per person in 2012/13 to 57.0 kilos in 2013/14. Among the various regions, Asia is anticipated to drive much of the global growth, with average rice intake in the continent rising by 0.6 percent to 82.2 kilos per person. In the other regions, current expectations point to a likely 2 percent decline in North America (to 10.2 kilos per person), while per caput food use rises in Africa (24.4 kilos), Europe (5.3 kilos), Latin America and the Caribbean (29.7 kilos) and in Oceania (16.5 kilos per person). The forecast increase rice consumption in Asian is expected to take place even if prices across much of the region remain above year-earlier levels, being in part sustained by government interventions through subsidised distribution. For instance, over the 2013/14 fiscal year, started in June, officials in Bangladesh target to raise rice distribution to 1.7 million tonnes. This is up from the 1.5 million tonnes channelled to the population in the previous year. In Indonesia, three additional monthly rations of 15 kilos will be distributed in 2013 to the 15.5 million families that qualify for the Raskin programme in an effort to compensate vulnerable groups for the July increase in subsidised fuel prices. Thailand has also taken steps to release more supplies in local markets at affordable prices. However, of particular note is the September passage into law, in India, of the National Food Security Act (NFSA), which will expand the coverage of the Targeted Public Distribution System to up to 50 percent of the urban population and 75 percent of rural dwellers. The law entitles the general population to a ration of 5 kilos of foodgrains per person per month at highly subsidised prices, with pregnant women, lactating mothers and children between six months and fourteen years of age also entitled to meals free of charge. Although the act is expected to underpin consumption of foodgrains in India, the extent to which it will do so in the short-term will depend on numerous factors, including the timing of the scheme’s implementation, itself a dependant on the speed with which beneficiaries are identified by States, and the degree to which it displaces direct market purchases. Under its existing form, India’ distribution system defines monthly rations on a per household basis, consisting of 35 kilos of foodgrains to each of the 65.2 million families classified as Below Poverty Line, at prices of Rupees 4.15 and Rupees 5.65 per kilo of wheat and rice, respectively. A subsection of this category, comprising 24.3 million households defined as Antayodaya Anna Yojana (AAY – poorest of the poor), receive the rations at even lower prices of
350
375
400
425
450
475
500
525
60
80
100
120
140
160
180
200
2004
/05
2005
/06
2006
/07
2007
/08
2008
/09
2009
/10
2010
/11
2011
/12
2012
/13
2013
/14
Stocks (left axis) Utilization (right axis)Production (right axis)
Rice Production, Utilization and Stocks(milled equiv.)
million tonnes
f'cas
t
million tonnes

21
FAO Rice Market Monitor – November 2013
Rupees 2.0/3.0 per kilo of wheat/rice. Allocations to Above Poverty Line families are subject to availability of supplies at the Central Pool and are released at Rupees 6.1 and 8.3 per kilo. In parallel to running other welfare schemes, officials have also granted additional allocations over and above those normally foreseen under the distribution system to both BPL and APL families, given the ample stock availabilities and efforts to ease local prices in recent,. Under the National Food Security Act, allocations to the AAY group will remain intact, while the rest of the population will fall under a single category entitled, to 5 kilos of foodgrains (wheat, rice and coarse grains) per person, per month. For the first three years of the scheme’s implementation, wheat and rice will be made available at the lower prices currently received by the AAY group only. Moreover, State-level welfare schemes whose coverage expands beyond those foreseen by the NFSA will be permitted to continue, with States’ past three-year’s average off-take from the Central Pool protected for the purpose. Other provisions of the law foresee end-to-end computerisation of the distribution system, door-end delivery of rations and the establishment of a grievance redressal mechanism, all measures geared at deterring leakage and diversion of supplies to other purposes. Looking at domestic price developments over the third quarter of 2013, retail/wholesale prices have tended to rise in Bangladesh, Bolivia, Chad, the Democratic Republic of Congo, Italy, Madagascar, Malawi, Mauritania, Nepal, Pakistan, the Philippines and Uganda; whereas they declined in Burundi, Cape Verde, Colombia, Costa Rica, Haiti, Mali, Niger, Rwanda, Somalia, and Thailand. From an annual perspective, however, local quotations were well above year-earlier levels in most of Asia (with the exception of Thailand and Viet Nam), in Latin America and the Caribbean (except for Colombia, Costa Rica and El Salvador), the United States and Italy. Quotations in Africa were mixed, with significant increases registered in Chad, Mauritania, Madagascar and Malawi, while prices eased significantly in Eastern Africa, namely in Burundi, Rwanda, Somalia and the United Republic of Tanzania.

22
FAO Rice Market Monitor – November 2013

23
FAO Rice Market Monitor – November 2013

24
FAO Rice Market Monitor – November 2013
IV. CLOSING STOCKS Forecasts of global closing stocks downgraded, but still pointing to a 3 percent annual rise
FAO’s forecast of global closing stocks in 2013/14 now stands at 179.0 million tonnes (milled basis), which is 2.1 million tonnes below expectations in July. At a country level, the reduction primarily reflects prospects of lower inventories in India, consistent with the improved export outlook for the country and expectations of higher domestic consumption. Forecasts of ending stocks were also downscaled for Egypt and Myanmar, mainly because of revisions to historical production estimates, as well as for Bangladesh, Cambodia and Pakistan. By contrast, inventories held by China (Mainland), Indonesia, the Lao PDR, the Philippines, Thailand and Viet Nam are expected to end higher than previously reported.
Taking these changes into account, world closing stocks are now projected to surpass their opening levels by 4.6 million tonnes, a volume that would be sufficient enough to lift the global stocks-to-use ratio from 35.6 percent in 2012/13 to 35.9 percent this year. Developing countries are expected to account for all of the stock increase, amassing 3 percent more, or 174.7 million tonnes, while developed nations draw their reserves down by 4 percent to 4.4 million tonnes. From a trade perspective, inventories held by the five major rice exporters4 are foreseen to expand for the third uninterrupted year to 48.5
million tonnes, with much of the projected increase again concentrated in Thailand. Supported by large public purchases conducted under the paddy pledging programme, FAO expects rice reserves in the country to outdo their year-earlier levels by 17 percent reaching a record of 20.4 million tonnes. The increase is notwithstanding renewed efforts by officials to liquidate public stocks to finance the continuation of the scheme and to lower the annual target of volumes mortgaged by 25 percent to 16.5 million tonnes of paddy. Reflecting a large crop gathered, coupled with a sluggish pace of exports, Viet Nam is also forecast to close the year with 17 percent more on reserve, or 4.9 million tonnes. By contrast, current expectations point to Pakistan, the United States and India ending their individual marketing years with reduced inventories. In the case of the United States, closing stocks are officially forecast at a four-year low of 993 000 tonnes, with the decline largely imputable to poor harvest results. On the other hand, FAO anticipates India to require an 8 percent stock draw-down to 22.0 million tonnes in order to meet demand for export and the needs of an expanded welfare scheme. Based on the state-wise allocation of foodgrains stipulated under the National Food Security Act (NFSA), a total of 54.93 million tonnes of foodgrains will be required to expand coverage under the public distribution system to 50 percent of the urban population and 75 percent of rural dwellers. The volume is lower than the 61.2 million tonnes previously anticipated by officials, with the country expected to meet these needs by tapping into the public reserves accumulated through large domestic purchase drives since 2008. In the case of rice, government stocks were reported to stand at 23.1 million tonnes as of 1 October 2013, slightly below year-earlier
4 India, Pakistan, Thailand, the United States and Viet Nam.
0
5
10
15
20
25
30
35
40
60
80
100
120
140
160
180
2004
/05
2005
/06
2006
/07
2007
/08
2008
/09
2009
/10
2010
/11
2011
/12
2012
/13
2013
/14
Closing Stocks Stocks-to-use Ratio
Global Rice Closing Stocks andStocks-to-use Ratio
million tonnes, milled eq. %
f'cas
t

25
FAO Rice Market Monitor – November 2013
levels, but well above the 7.2 million tonnes required to be held by that date under the country’s buffer norms and strategic reserves. Traditional rice importing countries are anticipated to draw their reserves down by 5 percent to 28.0 million tonnes in 2013/14. Within the group, the largest decline is forecast to take place in Bangladesh, where import cuts may lead inventories to diminish by 5 percent to 6.3 million tonnes. Indonesia is also forecast to close the year with 3 percent less on reserve, or 6.3 million tonnes. The draw-down is notwithstanding an expected stable level of government reserves, facilitated by the October completion of the 3.2 million tonne domestic procurement target for the year. Much as a result of import restraints instituted under country’s self-sufficiency drive, inventories in Nigeria are similarly forecast to decline, with reduced local availabilities also leading to cuts in the European Union, Malaysia, Senegal, the United Republic of Tanzania and especially Madagascar, which may require a significant stock draw-down, in addition to imports, to meet domestic needs in the face of a severe output shortfall. In the Philippines, authorities indicate that the 2012/13 marketing year ended on 30 June with inventories standing 14 percent above their opening levels at 2.2 million tonnes, which is some 710 000 tonnes more than previously foreseen by FAO. The refurbishment came on the back of good harvest results and efforts to boost official domestic purchases. Given the recent downgrading of 2013 production prospects in the country, FAO anticipates 2013/14 closing stocks in the Philippines to decline somewhat, to 2.1 million tonnes, partly due to losses incurred to typhoons. Among other important buyers, an output recovery and a fast pace of purchases from abroad is expected to keep stocks in Brazil largely steady at 900 000 tonnes. The expected stability is despite cuts in public reserves, given sustained efforts by officials to keep prices under check by releasing supplies into the local markets. Current expectations, instead, point to Japan, the Republic of Korea and Sri Lanka all refurbishing reserves over the course of the year.
V. INTERNATIONAL PRICES Thin import demand and prospects of large supplies entering the market pressure
international rice prices
After holding largely steady for much of 2013, international rice prices fell markedly in September. The FAO All Rice Price Index (2002-2004 = 100)5 shed 5 percent of its value that month to 226 points, a level it tended to maintain until the first three weeks of November, when an additional point was dropped. The price weakness was most pronounced in the long-grain segment, where quotations were pressured by thin buying interest and prospects of large main-crop harvests in northern hemisphere countries. Reflective of this, the High and Low Quality Indica Indices stood at 211 and 205 points in November, down 5 and 13 percent from July, respectively. While the Japonica Index tended to display more resilience, fragrant prices also subsided. At 256 points, the November Aromatica Index stood 5 percent short of July levels, but still 11 percent above its value a year earlier. This relative strength of fragrant quotations was still evident in the January-November average of the FAO All Rice Price Index, which stood 1.2 percent above its corresponding value in 2012, notwithstanding losses in all other rice market segments.
5 Please note that the methodology used to calculate the FAO Food Price Index, of which the FAO All Rice Price Index is one component, has been revisited slightly, as reported in the special feature of the November 2013 issue of the Food Outlook. As a result, the values of the FAO All Rice Price Index have changed somewhat compared to those previously published, without, however, altering their trajectory.

26
FAO Rice Market Monitor – November 2013
300
350
400
450
500
550
600
650
700
No
v-12
Jan
-13
Mar
-13
May
-13
Jul-
13
Se p
-13
No
v-13
Rice Export Prices
US 2/4%
Thai 100% B
Pak Irri 25%
Viet 5%
Thai A1 Super
US$/tonne
From an origin perspective, the tendency for quotation to weaken has been most striking in Thailand, where benchmark Thai 100% B white rice was quoted at USD 452 per tonne in November, 17 percent less than in July and its lowest since February 2008. After posting losses for much of the year due to weak buying interest, Thai prices declined at an accelerated pace in August and September, precipitated by alterations to the terms of the 2013/14 round of the paddy pledging programme and an intensification of efforts to dispose of the large public stocks amassed through the scheme. Close to 1.1 million tonnes of rice have been put to auction by Thai officials since July, in a move geared at securing funds for the continuation of the programme and at ensuring sufficient storage space for new-crop pledges. Even if the auctions have so far been met with meek interest from traders, amid concerns
over the quality of supplies and bidding terms, signals of Thai authorities’ willingness to accept sales at a loss were enough to weigh heavily on market sentiment. The resulting price decline served to significantly narrow the premium charged for Thai rice over competing origins. The price ratio of Thai 100% B white rice and the comparable N.2 4% quality in the US has fallen from 0.99 in January 2013 to 0.74 by November, and from 1.55 to 1.11, over the same period, in the case Thai and Vietnamese 25% broken rice.
Prices in Pakistan were also amongst those declining the most, pressured by the combined effects of a depreciating Rupee, staunch competition among traders to attract buyers and, more recently, the arrival of new supplies from the 2013 harvest. After trading at a premium over Viet Nam for much of 2013, 25% broken from Pakistan was quoted at USD 338 per tonne in November, between 8 and 11 percent below competing origins. Despite tight availabilities, losses were also posted in the fragrant sector. New-crop arrivals also tended to exert downward pressure in long-grain quotations in the United States. The support provided by a sale to Iraq by mid-October (the first since 2010) proved insufficient to offset the prevailing weakness. Strong competition to secure sales to Far Eastern countries similarly also weighed on the medium grain segment, where US N.1/4 medium grain rice
was quoted 9 percent below July levels at USD 673 per tonne. A further depreciation of the Rupee relative to the US dollar and the clearing of stocks ahead of an expected large Kharif crop harvest also tended to soften quotations in India. In the Indica segment, losses were posted notwithstanding support provided by a rebounding Rupee in October and the launch of 2013/14 official procurement
200
210
220
230
240
250
260
270
280
290
No
v-12
Jan
-13
Mar
-13
May
-13
Jul-
13
Sep
-13
No
v-13
FAO Price Indices for Rice
Aromatic
Japonica
Indica: High Quality
Indica: Low Quality
2002-2004=100

27
FAO Rice Market Monitor – November 2013
programme that month. The campaign seeks to absorb 34.5 million tonnes of paddy from domestic markets by September 2014. Among the major global suppliers of rice, Viet Nam has been one of the few to remain largely unaffected by the general tendency for prices to subside. In August, quotations in the country were underpinned by an upbeat pace of sales to China (Mainland) and African countries, with further support provided by the completion of the season’s second public procurement campaign on 15 August. Although a slow-down in buying interest pressured Vietnamese quotations in September, prices recovered by October, amid reported growing sales across borders with China (Mainland) and deals with private traders in the Philippines. In tandem with these developments, the Viet Nam Food Association re-established, in October, the minimum export price for 25% broken rice at its July value of USD 375 per tonne. This is after the floor price had been lowered by USD 15 the previous month. In the upcoming months, rice export prices are likely to come under increasing downward pressure from the arrival of new supplies from main-crop harvests in major northern hemisphere producing countries. This is expected to be particularly so if import demand remains subdued as in recent months. Still, policy decisions are expected to continue playing a central role. In Thailand, the supply tightness associated with the absorption of a large share of the harvest by the government under the paddy pledging programme could be abated by continued sales from public inventories. In India, modalities behind the roll-out of the National Food Security Act will also need to be monitored, although successive large harvests and abundant stocks are expected to enable the country to meet its needs while also remaining an active player in the international market. As always, developments in other cereal markets and currency factors will also be influential.
FAO Rice Price Indices
All Japonica AromaticHigh
qualityLow
quality2002-2004 = 100
2009 253 224 196 317 2312010 227 206 212 252 2292011 242 232 250 258 2202012 231 225 241 235 222
2012 November 237 230 243 241 231December 235 226 236 236 244
2013 January 235 227 237 231 254February 238 229 241 228 269March 238 228 241 226 273April 237 226 238 225 274May 238 224 237 231 273June 237 222 235 229 274July 237 222 235 233 273August 238 215 223 248 269September 226 206 206 235 263October 226 207 209 233 259
* November 225 211 205 231 2562012 Jan.-Nov. 231 225 241 235 2202013 Jan.-Nov. 234 220 228 232 267% Change 1.4 -2.4 -5.5 -1.5 21.6
Source: FAO
Indica
N.B. - The FAO Rice Price Index is based on 16 rice export quotations. "Quality" is defined by the percentage of broken kernels, with high (low) quality referringto rice with less (equal to or more) than 20 percent brokens. The Sub-Index forAromatic Rice follows movements in prices of Basmati and Fragrant rice. * Three weeks only.

28
FAO Rice Market Monitor – November 2013
EXPORT PRICES FOR RICE
(US $/tonne, f.o.b.)
2008 695 722 782 682 614 742 345 498 603 553 506 947 1 077 914
2009 587 619 545 555 432 530 ... 351 460 384 329 1 068 937 954
2010 518 532 510 492 416 559 ... 372 444 387 386 737 881 1 045
2011 565 563 577 549 505 546 409 433 511 467 464 821 1 060 1 054
2012 588 594 567 573 432 584 391 396 560 397 540 718 1 137 1 091
2012
November 598 603 608 582 446 638 396 380 567 418 545 746 1 185 1 111
December 599 580 608 583 412 620 390 368 568 384 546 712 1 312 1 098
2013
January 611 603 616 595 404 600 398 370 579 373 558 660 1 350 1 171
February 616 604 624 599 404 580 420 372 584 369 562 650 1 369 1 197
March 594 577 644 576 401 584 415 382 570 369 557 670 1 365 1 216
April 586 566 649 569 384 592 418 378 564 361 551 685 1 362 1 244
May 574 560 652 557 372 606 418 384 552 352 539 707 1 375 1 220
June 550 552 642 534 364 602 416 408 529 341 518 720 1 415 1 187
July 542 547 639 525 386 604 428 396 521 352 509 742 1 405 1 175
August 505 515 618 489 393 601 388 376 484 362 472 739 1 398 1 139
September 460 466 622 444 362 602 376 356 428 340 406 696 1 324 1 127
October 457 446 615 440 388 601 386 342 425 362 405 686 1 310 1 149
* November 452 448 611 436 398 595 379 338 409 368 379 673 1 333 1 150
2012 Jan.-Nov. 587 596 563 572 434 581 391 398 559 398 539 747 1 121 1 090
2013 Jan.-Nov. 541 535 630 524 387 597 404 373 513 359 496 677 1 364 1 180
% Change -7.9 -10.2 12.0 -8.4 -10.9 2.8 3.2 -6.4 -8.2 -9.7 -8.0 -9.4 21.7 8.2
Sources: Livericeindex.com, Thai Department of Foreign Trade (DFT) and other public sources.
1/ Long grain white rice, fob fcl. 2/ White broken rice. 3/ Basmati ordinary up to May 2011. Super kernel white basmati 2% from June 2011 onwards. 4/ Hom Mali rice, grade A.
... = unquoted
Note: Please note that data may have been subject to revision due to temporary unavailability and/or late publishing of weekly price quotations.
* Three weeks only.
Uru5%1/
ThaiWhite
100% BSecondgrade
ThaiParboiled
100%
U.S.Long
Grain#2, 4%
Thai5%
Viet5%
PakBasmati
3/
ThaiFragrant
4/
India25%
Pak25%
Thai25%
Viet25%
ThaiA1
Super2/
U.S .California
MediumGrain#1, 4%

29
FAO Rice Market Monitor – November 2013
VI. POLICY DEVELOPMENTS6
Area Date Policy Instrument Description
Argentina Oct‐13 Production support Description Agreed to establish a Pesos 5 million (USD 860 000) revolving fund together with sector representatives, that will assist small‐ and medium‐sized producers in regaining competitiveness.
Bolivia Oct‐13 Government procurement, purchasing prices
Decided with industry representatives that the state enterprise EMAPA would procure supplies from the 2014 harvest at USD 55 per 200 kilo fanega (USD 275 per tonne), unchanged from the previous year.
Brazil Aug‐13 Stock release Released 32 486 tonnes of paddy from public inventories through two auctions held on 6 August 2013, with a view to arresting domestic price increases and freeing storage space. The two auctions offered a total of 50 100 tonnes of paddy for sale.
Brazil Sep‐13 Stock release Released 44 629.8 tonnes of paddy from public reserves, out of a total of 50 656 tonnes offered in an auction held on 10 September 2013.
Brazil Oct‐13 Production support Stated that the federal government had no plans to provide official incentives to produce ethanol from maize or rice. Instead, the government is to focus on finding new markets for excess produce gathered in central and southern producing states.
China (Mainland) Sep‐13 Import quota Decided to keep the 2014 tariff‐rate import quota for rice unchanged at 5.32 million tonnes.
China (Mainland) Oct‐13 Import agreement A memorandum of understanding signed between the state trading enterprise, COFCO, and Thai traders to import 1.0 million tonnes of rice at market prices, over a period of five years. According to Thai officials, two separate agreements were also reached between the Chinese and Thai governments during the visit of Premier Li Keqiang to Thailand. The first would explore the possibility of shipping rice and other agricultural produce to China in return for Chinese investment on a high‐speed railway system while, under a second memorandum of understanding, the Chinese government would have agreed to purchase 1.0 million tonnes of rice per year from Thailand for an indefinite period of time. Thai officials indicated that details of the last two agreements are still to be worked out, but they expect the first rice shipments to China to take place by January 2014.
China (Mainland) Oct‐13 Futures trade Approved the listing of japonica and late Indica rice futures in the Zhengzhou Commodity Exchange.
6 Previous policy developments can be accessed at: http://www.fao.org/economic/est/est-commodities/commodity-policy-archive/en/?groupANDcommodity=rice

30
FAO Rice Market Monitor – November 2013
Area Date Policy Instrument Description
Colombia Jul‐13 Production support Introduced a subsidy programme for rice marketed between 16 July and 15 November 2013. Subsidy payments to producers are to be determined based on the size of farmers' holdings and the average extension cultivated in their respective regions. The initiative is geared at assisting the sector in facing a loss of productivity due to adverse climatic conditions, higher production costs, weakening prices and greater competition with imports.
Comoros Aug‐13 Import agreement Signed a memorandum of understanding with Viet Nam for the provision of 60 000 tonnes of rice per year until 2015.
Egypt Nov‐13 Export licenses Opened bids for 100 000 tonnes worth of export licenses on 7 November 2013. Volumes are to be delivered by 15 January 2014.
Ghana Oct‐13 Import restrictions Announced that, effective 1 November 2013, rice imports would only be permitted through the ports of Tema and Takoradi and through Kotoka International Airport.
India Jul‐13 Import tariff Removed import duties on rice bran and rice bran oil cake, effective 1 October 2013.
India Sep‐13 Food subsidies Signed the National Food Security Bill into law, following receipt of parliamentary approval in August. The law entitles the general population to a ration of 5 kg of foodgrains per person per month, but families covered by the Antyodaya Anna Yojna (AAY) scheme will continue to receive a monthly allowance of 35 kg of foodgrains per household. For the first three years of implementation of the scheme, the supplies will be distributed through the Targeted Public Distribution System at subsidized prices of Rupees 3 (USD 0.05), 2 (USD 0.03) and 1 (USD 0.02) per kg of rice, wheat and coarse grains, respectively, after which prices are to be determined based on the prevailing minimum support prices for the crops. Pregnant women, lactating mothers and children between six months and fourteen years of age will be additionally entitled to meals free of charge. A food security allowance is to be provided to beneficiaries when foodgrain supplies cannot be provided. The scheme is expected to cover up to 75 percent of the rural population and 50 percent of urban dwellers. The percentage coverage of rural and urban areas in each state will be determined by the central government, while state governments have been tasked with identifying eligible households and given 1 year to do so. The state‐wise allocation of foodgrains was stipulated for a total of 54.926 million tonnes, but states' existing grain entitlements were granted legal protection, subject to a ceiling equivalent to their average annual off‐take of the past three years. Among other provisions, the law stipulates that financial assistance will be provided to states to cover intra‐state movements and handling costs, while the public distribution system is to be reformed and an internal grievance redressal mechanism established.

31
FAO Rice Market Monitor – November 2013
Area Date Policy Instrument Description
India Sep‐13 Food subsidies Approved an additional allocation of 5.0 million tonnes of subsidized foodgrains for distribution to Below Poverty Line (BPL) families under the public welfare scheme, effective until 31 March 2014 or until the National Food Security Bill is implemented in states and union territories.
Indonesia Sep‐13 Stock‐holding policy Announced that it would allocate Rupiah 2 trillion (USD 180 million) to increase public rice reserves by 1.0 million tonnes to 3.0 million tonnes in 2014. The additional quantities are expected to aid the country in meeting consumption needs in times of emergency.
Iran Jul‐13 Import agreement Reached a government‐to‐government agreement with Thailand for the provision of 250 000 tonnes of white rice, to be delivered over a period of six months, starting in October 2013.
Iraq Oct‐13 Import requirements Announced that it would accept rice from Brazil in future import tenders.
Japan Aug‐13 Futures trade Extended the rice futures trial listing on the Osaka Dojima Commodity Exchange by two years.
Malaysia Oct‐13 Budgetary allocations/ production support/tax policy
As part of its 2014 budgetary allocations, announced that Ringgit 2.4 billion (USD 737 million) would be earmarked to rice production incentives, including price support and subsidies on fertilizers and seeds. Incentives to raise yields and boost fragrant rice production will also continue under a Ringgit 634 million (USD 195 million) allotment to the National Key Economic Areas initiative. Rice, along with other basic necessities, will furthermore remain free of the Goods and Services Tax.
Nicaragua Oct‐13 Import quota Raised the 2013 shortage import by 35 311 tonnes of paddy, bringing total volumes permitted to be brought into the country free of duty, by 31 December 2013, to 105 311 tonnes of paddy and 8 500 tonnes of husked/milled/broken rice.
Philippines Sep‐13 Import quota Declared that rice imports in 2014 would be kept within the minimum access volume (MAV) commitment of 350 000 tonnes.
Philippines Oct‐13 Import quota Clarified that no additional imports would be undertaken by the government in 2013, in response to media reports suggesting that further purchases from abroad were being planned.
Russia Aug‐13 Import restrictions Announced that, as of 1 September 2013, it will lift the temporary import restrictions imposed on Indian rice in February 2013 following the detection of khapra beetle in a consignment from the country.

32
FAO Rice Market Monitor – November 2013
Area Date Policy Instrument Description
Thailand Aug‐13 Stock release, futures trade
Announced that it would release 50 000 tonnes of Hom Mali rice and 100 000 tonnes of 5 percent broken rice from government stocks through the Agricultural Futures Exchange of Thailand (AFET), starting 15 August 2013.
Thailand Aug‐13 Stock release, futures trade
Postponed plans to sell 50 000 tonnes of Hom Mali rice and 100 000 tonnes of 5 percent white rice from public stocks through the Agricultural Futures Exchange of Thailand (AFET) due to budgetary constraints.
Thailand Aug‐13 Stock release Released 30 000 tonnes of 5 percent broken rice through an auction held 19 August 2013, which offered total of 101 304 tonnes of 5 percent broken rice and 100 361 tonnes of fragrant rice for sale.
Thailand Aug‐13 Government procurement, support prices
Approved the extension of the Paddy Pledging Programme for 2013/2014 crops with a budget of Baht 270 billion (USD 8.6 billion). Pledging prices for the main‐season round of the programme, which is to run between 1 October and 2013 and 28 February 2014, will remain unchanged at Baht 15 000 (USD 478) per tonne, but mortgaged amounts will be subject to a lower value ceiling of Baht 350 000 (USD 11 155) per farm household, down from a previous ceiling of Baht 500 000 (USD 15 935). For the off‐season round of the programme, mortgaging prices will be cut to Baht 13 000 (USD 414) per tonne, with the value ceiling further reduced to Baht 300 000 (USD 9 561) per household. The measures are expected to keep total quantities pledged under the programme at 16.5 million tonnes.
Thailand Sep‐13 Stock release Announced that the Public Warehouse Organization (PWO) would open bids for 200 000 tonnes of 5 percent white rice from public stocks in October for sale at affordable prices to domestic consumers.
Thailand Oct‐13 Stock release Announced that it would auction 300 340 tonnes of rice from government stocks on 14 October 2013. The volume is to include 62 398 tonnes of glutinous rice, 93 937 tonnes of fragrant rice and 144 005 of broken rice (fragrant, glutinous and white).
Thailand Oct‐13 Government procurement
Approved an additional allocation of Baht 6.7 billion (USD 214 million) to complete payments to farmers that had mortgaged volumes under the 2012/13 offseason round of the paddy pledging programme.
Thailand Oct‐13 Stock release Auctioned off 109 775 tonnes of 5 percent broken rice and 30 669 tonnes of fragrant rice from Government stocks through the Agricultural Futures Exchange of Thailand (AFET).
Thailand Oct‐13 Government procurement
Approved an additional allocation of Baht 1.9 billion (USD 61 million) to compensate farmers who harvested crops after the 15 September completion of the 2012/13 paddy pledging programme.

33
FAO Rice Market Monitor – November 2013
Area Date Policy Instrument Description
Thailand Nov‐13 Stock release Announced that it would release 450 000 tonnes of rice (fragrant and white) from government stocks through a tender to be held on 19 November 2013.
Thailand Nov‐13 Stock release, futures trade
Announced that it would release 31 162 tonnes of Hom Mali rice and 94 800 tonnes of 5 percent broken rice from government stocks through the Agricultural Futures Exchange of Thailand (AFET), on 25 November 2013.
Venezuela Aug‐13 Production support Approved a Bolívares 2.13 subsidy per kg of paddy produced (USD 338 per tonne). The assistance will be granted on top of official producer support prices of Bolívares 2.50–2.58 per kg (USD 396–409 per tonne) for quantities gathered between 1 August and 30 December 2013. The initiative follows the allocation of a Bolívares 3.0 billion (USD 475 million) special fund designated to assist agricultural producers in the country.
Venezuela Oct‐13 Import requirements Took steps to expedite imports of basic necessities, including rice, and to simplify administrative procedures applied to do so.
Vietnam Aug‐13 Government procurement
Extended the purchase drive of summer‐autumn rice until 15 August 2013. The move is geared at permitting participating enterprises to fulfil the 1.0 million tonne procurement target set for the scheme.
Vietnam Aug‐13 Export requirements Amended rules regarding the issuance of rice export certificates. Starting in 2015, the number of traders permitted to export rice will be capped at 150, instead of 100. In order to be eligible for rice export permits, traders will have to count on storage and milling facilities of their own and locate them in planned areas, with priority given to entities engaged in rice cultivation or partnered with rice farmers in their business. Traders that fail to ship 20 000 tonnes of rice over the course of two years will have their permits revoked..
Vietnam Sep‐13 Production target Announced that it would encourage farmers to substitute rice with alternative crops, in particular maize and soybean for use as feed. The initiative comes as farmer incomes are under increasing pressure from successive large harvests and growing competition in international markets.
Vietnam Sep‐13 Minimum export prices Lowered the minimum export price for 25 percent broken rice by USD 15 to USD 360 per tonne.
Vietnam Oct‐13 Minimum export prices Raised the minimum export price for 25 percent broken rice by USD 15 to USD 375 per tonne.

34
FAO Rice Market Monitor – November 2013
TABLE 1: WORLD PADDY PRODUCTION
2008-2010 2011 2012 2013 Annual Change 2013 Forecast
Average Estimate Forecast 2013 over 2012 Previous Revision
million tonnes million tonnes % million tonnes
WORLD 692.4 728.9 733.6 741.4 7.8 1.1 746.4 -5.0Developing countries 666.7 704.1 707.8 716.1 8.3 1.2 721.5 -5.4Developed countries 25.6 24.7 25.8 25.3 -0.6 -2.2 24.9 0.4
ASIA 626.5 659.9 664.9 672.7 7.8 1.2 677.9 -5.1Bangladesh 48.4 50.8 G 50.8 G 51.5 0.7 1.5 51.2 0.3Cambodia 7.7 8.8 G 9.3 G 9.5 0.2 2.3 9.3 0.2China 195.7 202.7 205.8 204.4 -1.4 -0.7 208.4 -4.0
of which China (Mainland) 194.3 201.0 G 204.2 G 202.8 G -1.5 -0.7 206.7 G -4.0India 142.1 157.9 G 156.6 G 159.0 2.4 1.5 159.0 0.0Indonesia 63.7 65.8 G 69.1 G 70.9 G 1.8 2.6 69.3 G 1.6Iran, Islamic Rep. of 2.2 2.3 2.4 2.5 0.1 5.8 2.5 -Japan 10.7 10.5 G 10.7 G 10.6 -0.1 -0.5 10.6 -Korea Rep. of 6.3 5.6 G 5.4 G 5.7 G 0.3 5.8 5.7 0.0Lao PDR 3.0 3.1 G 3.5 G 3.5 0.0 0.3 3.1 0.4Malaysia 2.4 2.6 G 2.8 G 2.6 G -0.1 -4.5 2.7 -0.1Myanmar 32.6 29.0 G 28.1 G 29.0 0.9 3.3 32.5 -3.5Nepal 4.3 5.1 G 4.5 G 4.6 0.1 2.1 4.6 -Pakistan 9.3 9.2 G 8.3 G 8.7 0.4 4.7 9.3 -0.6Philippines 16.4 17.0 G 18.1 G 18.0 -0.1 -0.8 18.9 -0.9Sri Lanka 3.9 3.9 G 3.8 G 4.3 G 0.5 13.0 4.1 0.2Thailand 33.5 38.1 G 36.6 G 38.0 1.4 3.9 37.5 0.6Viet Nam 39.2 42.4 G 43.7 G 44.1 G 0.4 0.9 43.8 0.3
AFRICA 24.5 26.2 26.8 26.8 0.0 -0.2 27.2 -0.4North Africa 5.8 5.7 6.0 6.2 0.2 3.2 6.8 -0.7Egypt 5.7 5.7 G 5.9 G 6.1 0.2 3.2 6.8 -0.7Western Africa 11.1 12.2 12.8 13.4 0.6 4.5 13.4 0.0Côte d'Ivoire 0.7 0.7 G 0.7 G 0.8 G 0.0 3.9 0.7 0.0Guinea 1.5 1.8 G 1.9 G 2.1 G 0.1 7.0 2.0 0.1Mali 2.0 1.7 G 1.9 G 2.0 0.1 4.4 2.2 -0.2Nigeria 3.8 4.6 G 4.4 G 4.7 0.3 7.2 4.4 0.3Sierra Leone 0.9 1.0 G 1.1 G 1.2 0.0 2.5 1.2 -Central Africa 0.5 0.5 0.5 0.5 0.0 6.2 0.5 0.0Eastern Africa 2.3 2.8 2.4 2.4 0.1 2.7 2.0 0.4Tanzania 1.8 2.2 G 1.8 G 1.9 0.0 2.7 1.4 0.5Southern Africa 4.8 4.8 5.1 4.2 -0.9 -18.0 4.3 -0.2Madagascar 4.4 4.3 G 4.6 G 3.6 G -0.9 -20.7 3.9 -0.3Mozambique 0.2 0.3 G 0.3 G 0.4 G 0.0 2.4 0.3 0.1
CENTRAL AMERICA & CAR 2.7 2.9 2.7 2.9 0.1 5.3 3.0 -0.1Cuba 0.5 0.6 G 0.6 G 0.7 0.0 1.3 0.7 -Dominican Rep. 0.8 0.8 G 0.8 G 0.8 0.1 8.5 0.9 0.0
SOUTH AMERICA 24.4 26.4 24.7 25.1 0.4 1.5 24.9 0.2Argentina 1.3 1.7 G 1.6 G 1.6 G 0.0 -0.5 1.6 G -Brazil 12.1 13.6 G 11.6 G 11.7 G 0.1 1.3 11.9 G -0.1Colombia 2.7 2.5 G 2.6 G 2.6 0.0 1.3 2.6 -Ecuador 1.6 1.5 G 1.6 G 1.6 0.0 2.2 1.5 0.1Peru 2.9 2.6 G 2.9 G 3.0 0.1 1.8 3.0 0.0Uruguay 1.3 1.6 G 1.4 G 1.4 0.0 -0.3 1.4 0.0
NORTH AMERICA 10.1 8.4 9.0 8.6 -0.5 -5.4 8.1 0.4United States 10.1 8.4 G 9.0 G 8.6 G -0.5 -5.4 8.1 G 0.4
EUROPE 4.0 4.4 4.4 4.1 -0.2 -5.6 4.1 0.0EU 3.0 3.2 G 3.1 G 2.9 -0.3 -8.9 2.9 0.0Russian Federation 0.9 1.1 G 1.1 G 1.1 G 0.0 3.0 1.1 G -
OCEANIA 0.1 0.7 0.9 1.2 0.2 26.4 1.2 0.0Australia 0.1 0.7 G 0.9 G 1.2 G 0.2 26.9 1.2 G 0.0
FOOTNOTES:
Totals computed from unrounded data.
G Official figure.
The 2012 paddy production season normally includes rice from the main paddy crops whose harvests fall in 2012, to which rice from all subsequent secondary crops, if any, is added. In the case of northern hemisphere countries, production in 2012 comprises the main rice crop, usually collected in the latter part of the year, plus the volume obtained from the successive secondary crops, commonly harvested in the first half of 2013. In the case of southern hemisphere countries, production in 2012 normally comprises rice from the main paddy crops assembled in the first part of 2012, plus rice from the secondary crops, generally gathered in the latter part of 2012. This approach to assess rice production is applicable to any given season.

35
FAO Rice Market Monitor – November 2013
TABLE 2: WORLD RICE IMPORTS (MILLED BASIS)
2009-2011 2012 2013 2014 Annual Change 2013 Forecast
Average Estimate Forecast 2014 over 2013 Previous Revision
million tonnes million tonnes % million tonnes
WORLD 32.3 38.4 37.5 38.3 0.8 2.1 37.5 0.0Developing countries 27.7 33.4 32.2 32.8 0.6 1.8 32.3 -0.1Developed countries 4.6 5.0 5.3 5.5 0.2 3.5 5.2 0.1
ASIA 15.6 18.1 17.5 18.0 0.5 2.7 17.9 -0.4Bangladesh 0.8 0.1 G 0.1 0.2 0.1 200.0 0.1 -0.1China 1.1 3.0 3.0 3.3 0.3 10.0 3.2 -0.2
of which China (Mainland) 0.4 2.4 G 2.4 2.7 0.3 12.5 2.6 -0.2Indonesia 1.4 1.8 G 0.8 1.1 0.3 37.5 1.3 -0.5Iran, Islamic Rep. of 1.2 1.5 G 1.7 1.5 -0.2 -11.8 1.3 0.4Iraq 1.2 1.5 1.5 1.5 0.0 2.1 1.4 0.1Japan 0.7 0.6 G 0.7 0.7 0.0 0.0 0.7 -Malaysia 1.0 1.0 G 1.0 G 1.0 0.0 0.8 1.1 -0.1Philippines 1.8 1.3 1.0 1.2 0.2 20.0 1.0 -Saudi Arabia 1.1 1.3 1.4 1.4 0.0 0.7 1.4 -United Arab Emirates 0.6 0.6 0.7 0.7 0.0 0.0 0.7 -
AFRICA 10.4 13.6 12.9 13.1 0.2 1.5 12.6 0.3Côte d'Ivoire 1.0 1.3 1.3 1.2 -0.1 -4.0 1.3 -Nigeria 2.1 3.0 2.5 2.7 0.2 8.0 2.5 -Senegal 0.7 1.2 0.9 0.9 0.0 -3.3 0.9 -South Africa 0.8 1.3 G 1.4 1.4 0.0 0.0 1.2 0.2
CENTRAL AMERICA & CAR 2.1 2.1 2.1 2.2 0.0 0.9 2.1 0.0Cuba 0.5 0.4 0.4 0.4 0.0 -2.5 0.4 -Mexico 0.6 0.6 G 0.7 G 0.7 0.0 0.0 0.6 0.0
SOUTH AMERICA 1.2 1.7 1.7 1.6 -0.1 -5.4 1.7 0.1Brazil 0.7 0.7 G 0.8 0.8 -0.1 -6.3 0.8 0.1
NORTH AMERICA 1.0 1.0 1.1 1.1 0.0 2.4 1.1 -United States 0.6 0.6 G 0.7 G 0.7 G 0.0 3.6 0.7 G -
EUROPE 1.6 1.6 1.7 1.8 0.1 7.0 1.8 -0.1EU 1/ 1.2 1.2 G 1.3 G 1.4 0.1 11.0 1.4 -0.1Russian Federation 0.2 0.2 G 0.2 0.2 0.0 -9.5 0.2 0.0
OCEANIA 0.5 0.5 0.4 0.5 0.0 8.3 0.4 -
FOOTNOTES:
Totals computed from unrounded data.
1/ Excluding intra-trade.
G Official figure.

36
FAO Rice Market Monitor – November 2013
TABLE 3: WORLD RICE EXPORTS (MILLED BASIS)
2009-2011 2012 2013 2014 Annual Change 2013 Forecast
Average Estimate Forecast 2014 over 2013 Previous Revision
million tonnes million tonnes % million tonnes
WORLD 32.4 38.4 37.5 38.3 0.8 2.0 37.5 0.0Developing countries 28.3 33.9 33.1 34.1 1.1 3.2 32.8 0.2Developed countries 4.1 4.5 4.4 4.2 -0.3 -6.5 4.6 -0.2
ASIA 25.1 30.1 29.8 30.7 1.0 3.2 29.5 0.3Cambodia 1.0 1.1 1.2 1.3 0.1 8.3 1.3 -0.1China 0.7 0.3 0.4 0.5 0.1 22.7 0.5 -0.1
of which China (Mainland) 0.6 0.3 G 0.4 0.5 0.1 25.0 0.5 -0.1India 3.1 10.4 G 10.5 9.3 -1.2 -11.4 8.8 1.7Myanmar 0.8 0.6 G 0.5 0.6 0.0 1.9 0.7 -0.2Pakistan 3.2 2.8 G 3.0 2.9 -0.1 -3.3 2.9 0.1Thailand 9.4 6.7 G 6.8 8.5 1.8 25.9 7.0 -0.3Viet Nam 6.7 7.7 G 6.9 7.2 0.3 4.3 7.7 -0.8
AFRICA 0.5 0.5 0.5 0.6 0.1 10.0 0.5 0.0Egypt 0.4 0.4 0.4 0.5 0.1 12.5 0.5 -0.1
SOUTH AMERICA 2.8 3.5 3.0 3.0 0.0 -0.2 3.1 -0.1Argentina 0.6 0.6 G 0.6 0.6 0.0 -1.6 0.6 0.1Brazil 0.8 1.1 G 0.7 0.8 0.1 7.1 0.8 -0.1Guyana 0.3 0.3 G 0.3 G 0.4 0.0 10.4 0.3 0.0Uruguay 0.9 1.0 G 0.9 0.8 -0.1 -11.1 0.9 0.0
NORTH AMERICA 3.4 3.3 3.4 3.2 -0.2 -5.9 3.4 -United States 3.4 3.3 G 3.4 G 3.2 G -0.2 -5.9 3.4 G -
EUROPE 0.3 0.5 0.3 0.3 0.0 -2.5 0.5 -0.2EU 1/ 0.2 0.2 G 0.1 G 0.1 0.0 -20.3 0.3 -0.1Russian Federation 0.1 0.3 G 0.1 0.2 0.0 15.4 0.2 -0.1
OCEANIA 0.1 0.5 0.5 0.5 0.0 -6.2 0.5 0.0Australia 0.1 0.5 G 0.5 0.5 0.0 -6.2 0.5 0.0
FOOTNOTES:
Totals computed from unrounded data.
1/ Excluding intra-trade.
G Official figure.

37
FAO Rice Market Monitor – November 2013
TABLE 4: END OF SEASON STOCKS (MILLED BASIS) 1/
2009-2011 2012 2013 2014 Annual Change 2013 Forecast
Average Estimate Forecast 2014 over 2013 Previous Revision
million tonnes million tonnes % million tonnes
WORLD 138.0 161.1 174.4 179.0 4.6 2.6 174.0 0.4Developing countries 133.7 156.5 169.9 174.7 4.8 2.8 169.6 0.2Developed countries 4.4 4.6 4.5 4.4 -0.2 -4.2 4.4 0.1
ASIA 130.1 153.6 167.6 173.1 5.5 3.3 167.4 0.2Bangladesh 5.8 7.0 6.6 6.3 -0.3 -4.5 6.7 -0.1Cambodia 1.5 1.8 2.0 2.0 0.0 1.0 1.9 0.1China 70.0 84.7 94.3 100.0 5.6 5.9 94.4 -0.1
of which China (Mainland) 69.8 84.5 94.2 99.8 5.6 5.9 94.3 -0.1India 22.3 23.5 23.9 22.0 -1.9 -7.8 23.5 0.4Indonesia 4.4 6.2 6.5 6.3 -0.2 -3.1 6.5 -Iran, Islamic Rep. of 0.3 0.5 0.5 0.5 -0.1 -16.7 0.5 0.1Japan 2.5 2.6 2.6 2.7 0.0 1.9 2.6 -Korea Rep. of 1.4 1.6 1.7 1.7 0.1 5.5 1.7 -Lao PDR 0.3 0.3 0.5 0.5 0.1 13.3 0.3 0.1Malaysia 0.3 0.2 0.2 0.2 -0.1 -37.5 0.3 0.0Myanmar 6.0 4.8 3.1 1.8 -1.4 -43.5 4.5 -1.4Nepal 0.2 0.4 0.4 0.4 0.0 0.0 0.4 -Pakistan 0.8 0.6 0.3 0.3 -0.1 -21.9 0.3 0.1Philippines 3.0 1.9 G 2.2 G 2.1 -0.1 -4.1 1.5 0.7Sri Lanka 0.3 0.3 0.1 0.2 0.1 65.2 0.2 -0.1Thailand 6.4 13.1 17.4 20.4 3.0 17.2 17.6 -0.2Viet Nam 3.6 2.9 4.2 4.9 0.7 16.7 3.5 0.7
AFRICA 2.9 3.5 3.1 2.4 -0.7 -22.5 3.1 0.0Egypt 1.0 0.6 0.6 0.6 0.0 0.0 0.8 -0.2Nigeria 0.3 0.7 0.4 0.3 -0.1 -25.0 0.3 0.1
CENTRAL AMERICA & CAR 0.3 0.3 0.2 0.2 0.0 0.8 0.3 0.0Dominican Rep. 0.1 0.1 0.1 0.1 0.0 0.0 0.1 0.0
SOUTH AMERICA 2.8 1.8 1.6 1.6 0.0 -0.3 1.6 0.0Argentina 0.1 0.0 0.0 0.0 0.0 0.0 0.0 -Brazil 1.7 1.1 G 0.9 G 0.9 0.0 0.2 0.9 G -Ecuador 0.1 0.1 0.1 0.1 0.0 0.0 0.0 0.0Peru 0.4 0.3 0.3 0.3 0.0 0.0 0.3 -
NORTH AMERICA 1.3 1.3 1.2 1.0 -0.2 -13.6 1.1 0.1United States 1.2 1.3 G 1.2 G 1.0 G -0.2 -14.1 1.0 G 0.1
EUROPE 0.5 0.6 0.6 0.5 -0.1 -11.1 0.6 0.0EU 0.5 0.5 G 0.5 G 0.5 G -0.1 -10.0 0.5 G -Russian Federation 0.0 0.0 0.1 0.0 0.0 -30.0 0.0 0.0
OCEANIA 0.0 0.1 0.0 0.0 0.0 59.8 0.0 -Australia 0.0 0.1 0.0 0.0 0.0 105.9 0.0 -
GOVERNMENT STOCKS
Bangladesh 0.4 0.9 G 0.7 G 0.8 0.0 4.9 1.0 -0.3India 18.0 23.4 G 23.8 G 18.0 -5.8 -24.4 23.0 0.8Japan 0.8 0.9 G 0.9 0.8 0.0 -5.9 0.9 -Korea Rep. of 0.8 0.8 0.9 0.9 0.1 5.9 0.9 -Philippines 1.7 0.6 G 0.7 G 0.7 0.0 0.0 0.4 0.3
FOOTNOTES:
Totals computed from unrounded data.
1/ Data refer to carry-overs at the close of national crop seasons ending in the year shown.
G Official figure.

38
FAO Rice Market Monitor – November 2013
TABLE 5: RICE SUPPLY AND UTILIZATION IN MAIN EXPORTING COUNTRIES
Opening Production Imports Total Domestic Exports Closing
Stocks 1/ Supply Use 1/ Stocks
thousand tonnes, milled basis
CHINA 2/
2011-12 75 575 138 902 2 969 217 446 132 447 329 84 670
2012-13 est. 84 670 141 070 3 011 228 751 133 966 440 94 345
2013-14 f'cast 94 345 140 088 3 311 237 744 137 254 540 99 950
INDIA2011-12 21 200 105 300 G 100 126 600 92 692 10 408 G 23 5002012-13 est. 23 500 104 400 G 100 128 000 93 650 10 500 23 8502013-14 f'cast 23 850 106 005 100 129 955 98 655 9 300 22 000
PAKISTAN 2011-12 250 6 160 G 60 6 470 3 028 2 802 G 6402012-13 est. 640 5 541 G 60 6 241 2 921 3 000 3202013-14 f'cast 320 5 800 60 6 180 3 030 2 900 250
THAILAND2011-12 7 400 25 224 G 670 33 294 13 460 6 734 G 13 1002012-13 est. 13 100 24 213 G 550 37 863 13 713 6 750 17 4002013-14 f'cast 17 400 25 156 400 42 956 14 056 8 500 20 400
UNITED STATES2011-12 1 514 G 5 866 G 640 G 8 020 3 412 3 305 G 1 303 G
2012-13 est. 1 303 G 6 334 G 700 G 8 337 3 781 3 400 G 1 156 G
2013-14 f'cast 1 156 G 6 014 G 725 G 7 895 3 702 3 200 G 993 G
VIET NAM2011-12 2 900 28 280 G 600 31 780 21 120 7 720 G 2 9402012-13 est. 2 940 29 143 G 600 32 683 21 583 6 900 4 2002013-14 f'cast 4 200 29 415 G 550 34 165 22 065 7 200 4 900
FOOTNOTES:
Data refers to national crop years: October-September for China and India, November-October for Pakistan, Thailand and Viet Nam and August-July for the United States.
Totals computed from unrounded data.
1/ Rice trade data refer to the calendar year of the second year shown.
2/ Including Taiwan province.
G Official figure