History of the Buckeye Canal.ppt - Buckeye Water Conservation
AFRL-PR-WP-TR-2001-2060
TESTING OF BAKER Flo-XS PIPELINE DRAG-REDUCING ADDITIVE
COMPILATION OF TESTS AND RESULTS
LT KIRSTEN WOHLWEND
AFRL/PRTG BUILDING 490 ROOM 209 WRIGHT-PATTERSON AFB, OH 45433-7251
BUCKEYE PIPE LINE COMPANY 5002 BUCKEYE ROAD EMMAUS, PA 18049
NOVEMBER 2000
FINAL REPORT FOR PERIOD 01 SEPTEMBER 1998 - 01 NOVEMBER 2000
Approved for public release; distribution unlimited I
20010511 OU PROPULSION DIRECTORATE AIR FORCE RESEARCH LABORATORY AIR FORCE MATERIEL COMMAND WRIGHT-PATTERSON AIR FORCE BASE, OH 45433-7251

NOTICE
USING GOVERNMENT DRAWINGS, SPECIFICATIONS, OR OTHER DATA INCLUDED IN THIS DOCUMENT FOR ANY PURPOSE OTHER THAN GOVERNMENT PROCUREMENT DOES NOT IN ANY WAY OBLIGATE THE US GOVERNMENT. THE FACT THAT THE GOVERNMENT FORMULATED OR SUPPLIED THE DRAWINGS, SPECIFICATIONS, OR OTHER DATA DOES NOT LICENSE THE HOLDER OR ANY OTHER PERSON OR CORPORATION; OR CONVEY ANY RIGHTS OR PERMISSION TO MANUFACTURE, USE, OR SELL ANY PATENTED INVENTION THAT MAY RELATE TO THEM.
THIS REPORT IS RELEASABLE TO THE NATIONAL TECHNICAL INFORMATION SERVICE (NTTS). AT NITS, IT WILL BE AVAILABLE TO THE GENERAL PUBLIC, INCLUDING FOREIGN NATIONS.
THIS TECHNICAL REPORT HAS BEEN REVIEWED AND IS APPROVED FOR PUBLICATION.
KIRSTEN M. WOHLWEND Fuels Branch Turbine Engine Division Propulsion Directorate
WILLIAM E. HARRISON m Chief, Fuels Branch Turbine Engine Division Propulsion Directorate
WILLIAM E. KOOP Chief of Technology Turbine Engine Division Propulsion Directorate
Do not return copies of this report unless contractual obligations or notice on a specific document requires its return.

REPORT DOCUMENTATION PAGE Form Approved
OMB No. 074-0188 Public reporting burden for this collection of information is estimated to average 1 hour per response, including the time for reviewing instructions, searching existing data sources, gathering and maintaining the data needed, and completing and reviewing this collection of information. Send comments regarding this burden estimate or any other aspect of this collection of information, including suggestions for reducing this burden to Washington Headquarters Services, Directorate for Information Operations and Reports, 1215 Jefferson Davis Highway, Suite 1204, Arlington, VA 22202-4302, and to the Office of Management and Budget, Paperwork Reduction Project (0704-01881, Washington, DC 20503
1. AGENCY USE ONLY (Leave blank)
2. REPORT DATE NOVEMBER 2000
3. REPORT TYPE AND DATES COVERED Final, 09/01/2000 - 11/01/2000
4. TITLE AND SUBTITLE
TESTING OF BAKER Flo-XS PIPELINE DRAG-REDUCING ADDITIVE
COMPILATION OF TESTS AND RESULTS
6. AUTHOR(S) JOHN E. GUTLIANO
7. PERFORMING ORGANIZATION NAME(S) AND ADDRESS(ES)
AFRL/PRTG BUILDING 490 ROOM 209 WRIGHT-PATTERSON AFB, OH 45433-7251
BUCKEYE PIPE LINE COMPANY 5002 BUCKEYE ROAD EMMAUS, PA 18049
9. SPONSORING / MONITORING AGENCY NAME(S) AND ADDRESS(ES)
PROPULSION DIRECTORATE AIR FORCE RESEARCH LABORATORY AIR FORCE MATERIEL COMMAND WRIGHT-PATTERSON AIR FORCE BASE, OH 45433-7334 POC: Lt. Kirsten Wohlwend, AFRL/PRTG, (937) 255-3190
5. FUNDING NUMBERS C: CRADA-98-173-PR-01/In-House PE:69120L PN: CRDP TN: 99 WU:00
8. PERFORMING ORGANIZATION REPORT NUMBER
10. SPONSORING / MONITORING AGENCY REPORT NUMBER
AFRL-PR-WP-TR-2001-2060
11. SUPPLEMENTARY NOTES:
12b. DISTRIBUTION CODE 12a. DISTRIBUTION / AVAILABILITY STATEMENT Approved for public release; distribution unlimited. 13. ABSTRACT (Maximum 200 Words) Pipeline drag-reducing additives have been used for many years in crude oil and some products to increase throughput in the pipeline. In recent years, interest in using drag-reducing additives in jet fuel has increased because of greater demand on the petroleum product pipelines for jet fuel. Thus, testing was completed on the Baker Flo-XS pipeline drag-reducing additive to determine if the additive had any negative impact on the fuel. The proposed use of the additive was to add 2 ppm at up to 4 points along the pipeline(s). Thus, the majority of testing was completed using 8.8 ppm (8 ppm total plus 0.8 ppm for errors in injection). Through a CRADA with Buckeye Pipeline Inc, thermal stability testing of the additive was completed. Additionally, low temperature testing, additive/additive compatibility testing and specification testing of additized fuel was also completed. Material compatibility tesing was also taken into consideration.
14. SUBJECT TERMS
17. SECURITY CLASSIFICATION OF REPORT
Unclassified
NSN 7540-01-280-5500
18. SECURITY CLASSIFICA- TION OF THIS PAGE
Unclassified
19. SECURITY CLASSIFICATION OF ABSTRACT
Unclassified
15. NUMBER OF PAGES 54
16. PRICE CODE
20. LIMITATION OF ABSTRACT
SAR Standard Form 298 (Rev. 2-89) Prescribed by ANSI Std. Z39-18 298-102

TABLE of CONTENTS
Section Page
Summary 1
Introduction 2
Methods, Assumptions, and Procedures & Results and Discussion: Section I.
Screening Tests : 4
Isothermal Corrosion/Oxidation Test 5
Quartz Crystal Microbalance 8
Hot Liquid Process Simulator 12
Fuels Used During Testing 16
Methods, Assumptions, and Procedures & Results and Discussion: Section H
Simulator Tests 17
Extended Duration Thermal Stability Test 18
Augmentor Fouling Simulator 22
Near Isothermal Flowing Test Rig 24
Advanced Reduced Scale Fuel System Simulator 27
Methods, Assumptions, and Procedures & Results and Discussion: Section HI.
Other Tests 31
Material Compatibility 32
Additive/Additive Compatibility 35
Specification Testing 36
Low Temperature Testing 41
Conclusion ] 43
References 43
List of Symbols, Abbreviations and Acronyms 44
in
LIST OF FIGURES
Figure Page
Figure 1.1-1. Isothermal Corrosion/Oxidation Test Apparatus 5
Figure 1.1-2. ICOT Results- 8.8 ppm polymer ^6
Figure 1.1-3. ICOT Results- 4x original concentration 7
Figure 1.2-1. Quartz Crystal Microbalance Schematic 8
Figure 1.2-2. QCM Results—8.8 ppm Polymer 9
Figure I. 2-3. QCM Results—4x Original Concentration 10
Figure 1.3-1. Hot Liquid Process Simulator Schematic 12
Figure 1.3-2. HLPS Results—8.8 ppm polymer 13
Figure 1.3-3. HLPS Results—4x Original Concentration 14
Figure H. 1-1. EDTST Schematic 18
Figure H. 1-2. EDTST Heater 19
Figure n.1-3. EDTST using POSF-3219 and POSF-3166:
Preheater and Heater Sections 20
Figure Ü.1-4. EDTST using POSF-3219 + Betz 8Q462 + POSF-3597:
Preheater and Heater 21
Figure n.2-1. Augmentor Simulator Schematic 22
Figure II.2-2. Augmentor Deposition at 15.24 cm 23
Figure H.3-1. NIFTR Schematic 24
Figure II. 3-2. NIFTR Deposition Results 25
Figure H.3-3. NIFTR Oxidation Results 26
Figure H.4-1. ARSFSS schematic 27
Figure n.4-2. Hysteresis Results for Servo Valve 28
Figure H4-3. Hysteresis Results for the Flow Divider Valve 29
Figure H.4-4. Carbon Burnoff of the Fuel Cooled Oil Cooler ; 29
Figure LL4-5. Carbon Burnoff of the Burner Feed Arm 30
IV

Figure m.1-1. Baker DRA (FLO XS) composition letter from Baker Petrolite 32
Figure m.1-2. Request to AFRL/MLSA for Material Compatibility Review 33
Figure m.1-3. Response from AFRL/MLSA 34
Figure m.4-1. System for Low-Temperature Flow Reduction and
Hold-Up Experiments . _41
LIST OF TABLES
Table Page
Table 1.1-1. ICOT Results- 8.8 ppm polymer 6
Table 1.1-2. ICOT Results-4x original concentration 7
Table 1.2-1. QCM Results—8.8 ppm polymer 9
Table 1.2-2. QCM Results—4x Original Concentration 10
Table 1.3-1. HLPS Results—8.8 ppm polymer 13
Table 1.3-2. HLPS Results—4x Original Concentration 14
Table 1.4-1. Processing of Red Dye Test Fuels Used 16
Table DJ.3-1 Specification Testing 37
Table m.4-1. Low Temperature Test Results 42
ACKNOWLEDGMENTS
This work was partially supported by the Buckeye Pipe Line Company, L.P. under CRADA #98-173-PR-01 and the U.S. Air Force Research Laboratory, Propulsion Directorate, Propulsion Sciences and Advanced Concepts Division, Wright-Patterson Air Force Base, Ohio, under Contract No. F33615-97-C-2719 (Technical Monitor: C.W. Frayne) and Contract No. F33615-95-C-2507 (Technical Monitor: I. Vihinen).
R. Grinstead, S. Zabarnick, and K. Wohlwend completed the ICOT data collection and analysis. S. Zabarnick completed the QCM data collection and analysis. K.E. Binns, G. Dieterle, and D. Davis completed the EDTST data collection and analysis. J. Shardo and K.E. Binns completed the ARSFSS data collection and analysis. A. Jacobson, J. Lawrence, and T. Edwards completed the Augmentor Fouling Simulator data collection and analysis. L. Balster and G. Jones completed the NIFTR data collection and analysis.
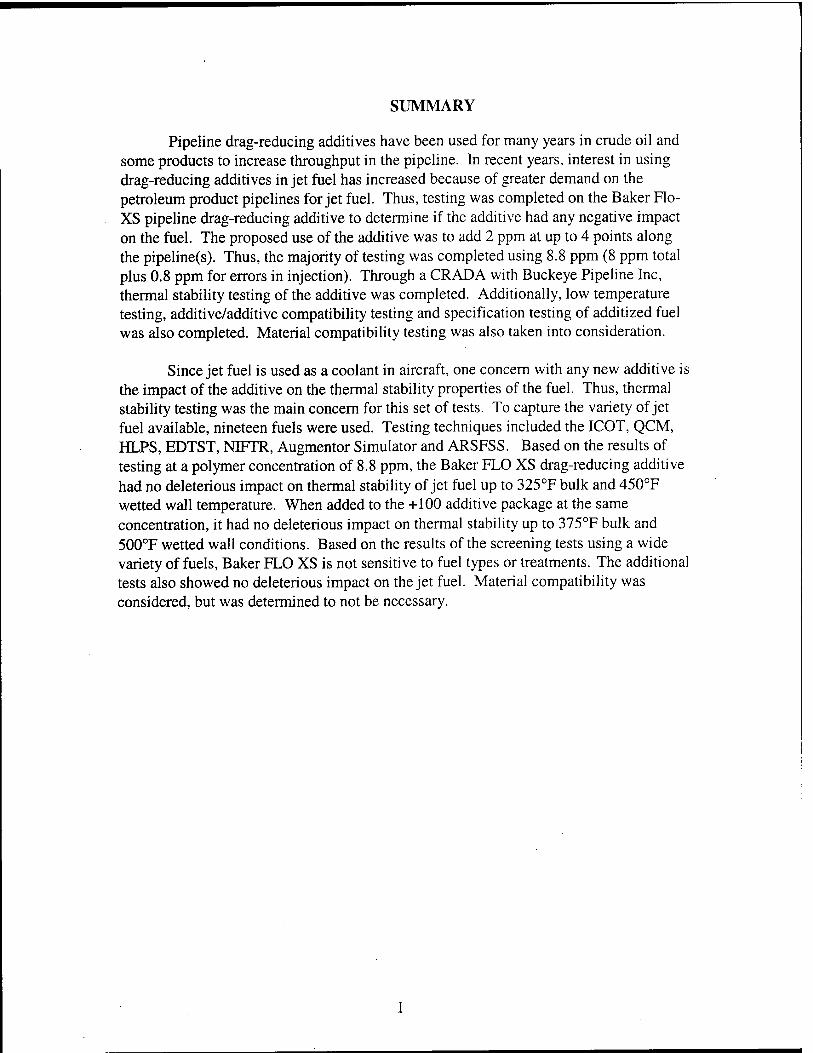
SUMMARY
Pipeline drag-reducing additives have been used for many years in crude oil and some products to increase throughput in the pipeline. In recent years, interest in using drag-reducing additives in jet fuel has increased because of greater demand on the petroleum product pipelines for jet fuel. Thus, testing was completed on the Baker Flo- XS pipeline drag-reducing additive to determine if the additive had any negative impact on the fuel. The proposed use of the additive was to add 2 ppm at up to 4 points along the pipeline(s). Thus, the majority of testing was completed using 8.8 ppm (8 ppm total plus 0.8 ppm for errors in injection). Through a CRADA with Buckeye Pipeline Inc, thermal stability testing of the additive was completed. Additionally, low temperature testing, additive/additive compatibility testing and specification testing of additized fuel was also completed. Material compatibility testing was also taken into consideration.
Since jet fuel is used as a coolant in aircraft, one concern with any new additive is the impact of the additive on the thermal stability properties of the fuel. Thus, thermal stability testing was the main concern for this set of tests. To capture the variety of jet fuel available, nineteen fuels were used. Testing techniques included the ICOT, QCM, HLPS, EDTST, NIFTR, Augmentor Simulator and ARSFSS. Based on the results of testing at a polymer concentration of 8.8 ppm, the Baker FLO XS drag-reducing additive had no deleterious impact on thermal stability of jet fuel up to 325°F bulk and 450°F wetted wall temperature. When added to the +100 additive package at the same concentration, it had no deleterious impact on thermal stability up to 375°F bulk and 500°F wetted wall conditions. Based on the results of the screening tests using a wide variety of fuels, Baker FLO XS is not sensitive to fuel types or treatments. The additional tests also showed no deleterious impact on the jet fuel. Material compatibility was considered, but was determined to not be necessary.
INTRODUCTION
The American Petroleum Institute (API) conducted a survey in 1997 that showed over 40% of the pipelines dedicated to jet fuel use in the US will be at maximum capacity in the next 10 years [1]. This is due to the forecasted increased demand for jet fuel by the commercial airlines. Many of the pipelines that deliver commercial jet fuel also deliver jet fuel to Air Force bases. In addition, the operators of over 80% of the existing multi- product pipelines need to increase throughput in order to move sufficient product to meet demand during the same time period. The delivery of the additional volume of jet fuel can be achieved in a number of ways. Additional pipelines could be built or alternative transportation modes such as tank trucks could be used. Both of these options are costly and will ultimately increase the price of jet fuel. The API survey results indicate that to construct additional pipelines to meet demand will cost in excess of $500M. Fulfilling the increased demand by truck transportation is even more costly. A third alternative is the use of a pipeline drag-reducing additive (DRA) in the jet fuel in the existing lines to achieve the desired throughput. This alternative has generated interest because drag reducing additives have already been used in crude oil and some of its other products. The third alternative is the driving force of this testing.
Thermal stability testing was performed on the Baker Flo XS pipeline drag- reducing additive (AFRL/PRSF identification number POSF-3597) to determine any negative impact of the additive on fuel properties. The test matrix used was developed through discussions at American Society of Testing and Materials (ASTM) Committee D- 2 meetings. A cooperative research and development agreement was created between Buckeye Pipeline and the Air Force Research Laboratory, Propulsion Directorate, Propulsion Sciences and Advanced Concepts Division, Fuels Branch. In this agreement, thermal stability tests developed during the JP-8+100 program in order to screen potential +100 additives were used to study POSF-3597.
The test hardware, protocols and conditions used were developed by the Air Force over many years as the +100 program developed in order to evaluate the acceptability of fuel additives for use in aircraft. Equipment manufacturers input was also considered during development of the testing. This series of tests was very successful in screening the potential additives for the JP-8+100 and reducing the risk of full-scale engine and aircraft testing [2].
Additional testing beyond that described in the CRADA was also completed. Specification testing of a variety of the test fuels was completed at various concentrations of the Baker Flo-XS additive to determine if the additive has any impact. Also, low temperature testing was completed to determine any low temperature impact of the additive. The low temperature properties were a concern because of the additive's high weight.
BAKER FLO-XS
Baker Flo-XS is a 12.5% solution of a 70/30 (w/w) copolymer of 1-dodecene/l- hexene in isopentane. The testing was completed using a polymer dosage of 8.8 ppm into jet fuel. At this dosage, residual catalyst hetero atoms in the jet fuel are Ti (0.8-1.1 ppb), Al (9.6-15.9 ppb) and Cl (12.0-19.1 ppb) [3]. Because the polymer is difficult to get into solution, Baker Chemical diluted the 12.5% polymer solution to a 1% polymer level using a high-grade kerosene for the laboratory testing. To achieve the 8.8 ppm needed for testing, 0.80 was assumed to be the density of the fuel. Assuming that density, 704 mg/L of the 1% polymer additive was used.
TASKS
The screening tests were the Isothermal Corrosion/Oxidation Test, the Quartz Crystal Microbalance and the Hot Liquid Process Simulator. After the screening tests, the larger Extended Duration Thermal Stability Test was completed on two test fuels with POSF- 3597 as well as one test with POSF-3597 + Betz 8Q462 (+100) additive at the more rigorous +100 conditions. The Advanced Reduced Scale Fuel System Simulator (ARSFSS) was completed on one test fuel with POSF-3597. Other tests included the Augmentor Fouling Simulator, the Near-Isothermal Flowing Test Rig, Low Temperature testing, specification testing, additive/additive compatibility and material compatibility. The standard additization rate was 8.8 ppm polymer. This rate assumed a maximum additization of 8 ppm total over the length of the pipeline with the 0.8 ppm added to cover injection inaccuracy. The 8.8 ppm rate was chosen because the pipelines determined that the most useful rate would be adding 2 ppm at 4 different points throughout the pipeline.
METHODS, ASSUMPTIONS and PROCEDURES
&
RESULTS and DISCUSSIONS
SECTION I. SCREENING TESTS
ISOTHERMAL CORROSION/OXIDATION TEST
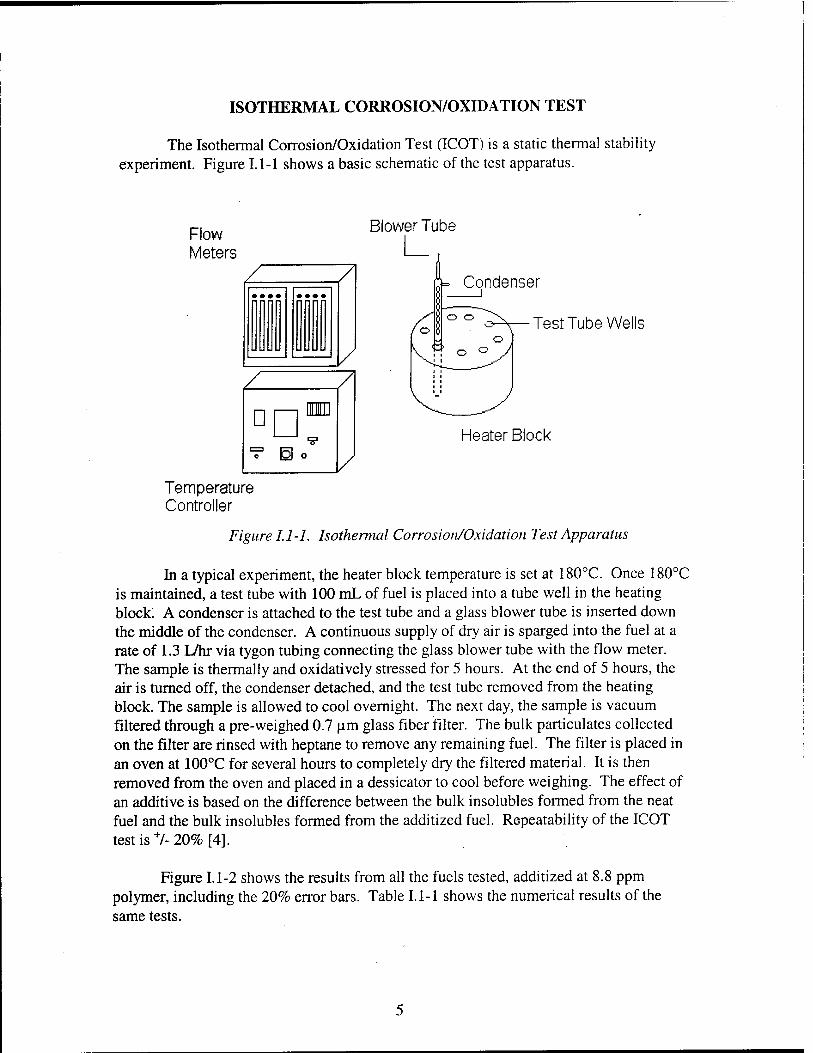
The Isothermal Corrosion/Oxidation Test (ICOT) is a static thermal stability experiment. Figure 1.1-1 shows a basic schematic of the test apparatus.
Flow Meters
Blower Tube
•••• • • » • Condenser
Test Tube Wells
Heater Block
Temperature Controller
Figure 1.1-1. Isothermal Corrosion/Oxidation Test Apparatus
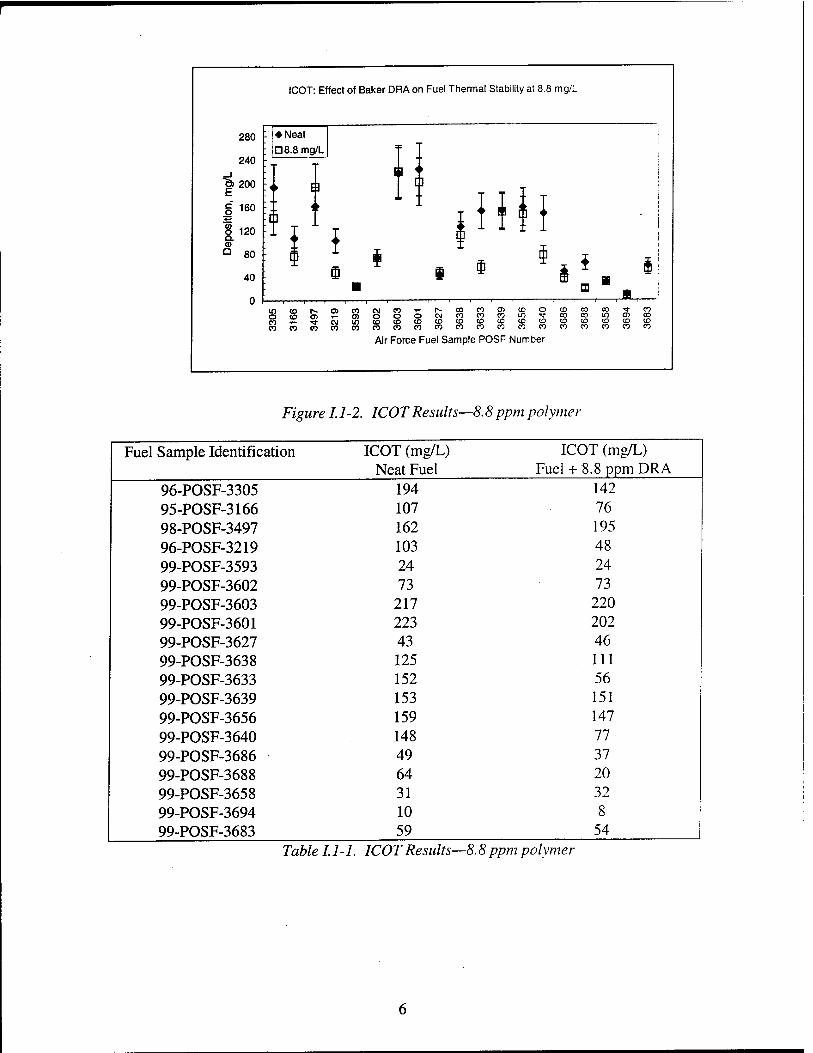
In a typical experiment, the heater block temperature is set at 180°C. Once 180°C is maintained, a test tube with 100 mL of fuel is placed into a tube well in the heating block; A condenser is attached to the test tube and a glass blower tube is inserted down the middle of the condenser. A continuous supply of dry air is sparged into the fuel at a rate of 1.3 L/hr via tygon tubing connecting the glass blower tube with the flow meter. The sample is thermally and oxidatively stressed for 5 hours. At the end of 5 hours, the air is turned off, the condenser detached, and the test tube removed from the heating block. The sample is allowed to cool overnight. The next day, the sample is vacuum filtered through a pre-weighed 0.7 pm glass fiber filter. The bulk particulates collected on the filter are rinsed with heptane to remove any remaining fuel. The filter is placed in an oven at 100°C for several hours to completely dry the filtered material. It is then removed from the oven and placed in a dessicator to cool before weighing. The effect of an additive is based on the difference between the bulk insolubles formed from the neat fuel and the bulk insolubles formed from the additized fuel. Repeatability of the ICOT test is+/-20% [4].
Figure 1.1-2 shows the results from all the fuels tested, additized at 8.8 ppm polymer, including the 20% error bars. Table 1.1-1 shows the numerical results of the same tests.
280
240
öi 200
ü" 16° 1 120 Q. CD a
ICOT: Effect of Baker DRA on Fuel Thermal Stability at 8.8 mg/L
80 ■
40
♦ Neat D 8.8 mg/L
E3
[]
[]
0 *
i m
m co r^ 0(0 01 co T- •«■ CO CO CO
o> co CM co T- t- o> o o o CM 10 co co co co co co
TJ- CO 00 lO 05 00 „_CDCDCOCOCDCDCDCOCOCD COCOCOCOCOCOCOCOCOCOCOCO
Air Force Fuel Sample POSF Number
Figure 1.1-2. ICOT Results—8.8 ppm polymer
Fuel Sample Identification ICOT (mg/L) ICOT (mg/L) Neat Fuel Fuel + 8.8 ppm DRA
96-POSF-3305 194 142 95-POSF-3166 107 76 98-POSF-3497 162 195 96-POSF-3219 103 48 99-POSF-3593 24 24 99-POSF-3602 73 73 99-POSF-3603 217 220 99-POSF-3601 223 202 99-POSF-3627 43 46 99-POSF-3638 125 111 99-POSF-3633 152 56 99-POSF-3639 153 151 99-POSF-3656 159 147 99-POSF-3640 148 77 99-POSF-3686 49 37 99-POSF-3688 64 20 99-POSF-3658 31 32 99-POSF-3694 10 8 99-POSF-3683 59 54
Table 1.1-1. ICOT Results—8.8 ppm polymer
Within the uncertainty of the test, the addition of 8.S ppm POSF-3597 results in ICOT insolubles that are the same as, or lower than, the baseline fuels. Thus, all the fuels tested at 8.8 ppm had acceptable results for this screening test.
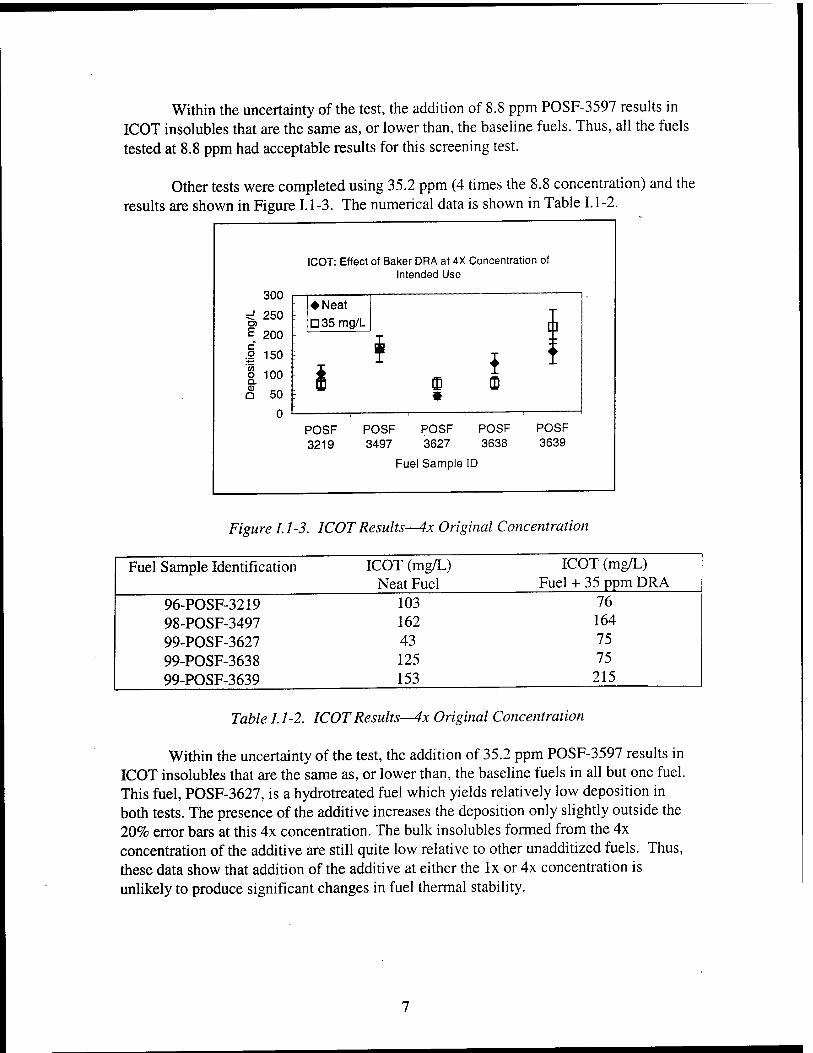
Other tests were completed using 35.2 ppm (4 times the 8.8 concentration) and the results are shown in Figure 1.1-3. The numerical data is shown in Table 1.1-2.
E c o '55 o Q. 03 Q
300
250
200
150
100
50
ICOT: Effect of Baker DRA at 4X Concentration of Intended Use
; I♦Neat : |D 35 mg/L
OP
[]
i * CD
: i §
: • 1 1 _ j
POSF 3219
POSF 3497
POSF 3627
Fuel Sample ID
POSF 3638
POSF 3639
Figure 1.1-3. ICOT Results—4x Original Concentration
Fuel Sample Identification ICOT (mg/L) Neat Fuel
ICOT (mg/L) Fuel + 35 ppm DRA
96-POSF-3219 98-POSF-3497 99-POSF-3627 99-POSF-3638 99-POSF-3639
103 162 43 125 153
76 164 75 75
215
Table 1.1-2. ICOT Results—4x Original Concentration
Within the uncertainty of the test, the addition of 35.2 ppm POSF-3597 results in ICOT insolubles that are the same as, or lower than, the baseline fuels in all but one fuel. This fuel, POSF-3627, is a hydrotreated fuel which yields relatively low deposition in both tests. The presence of the additive increases the deposition only slightly outside the 20% error bars at this 4x concentration. The bulk insolubles formed from the 4x concentration of the additive are still quite low relative to other unadditized fuels. Thus, these data show that addition of the additive at either the lx or 4x concentration is unlikely to produce significant changes in fuel thermal stability.
2. QUARTZ CRYSTAL MICROBALANCE
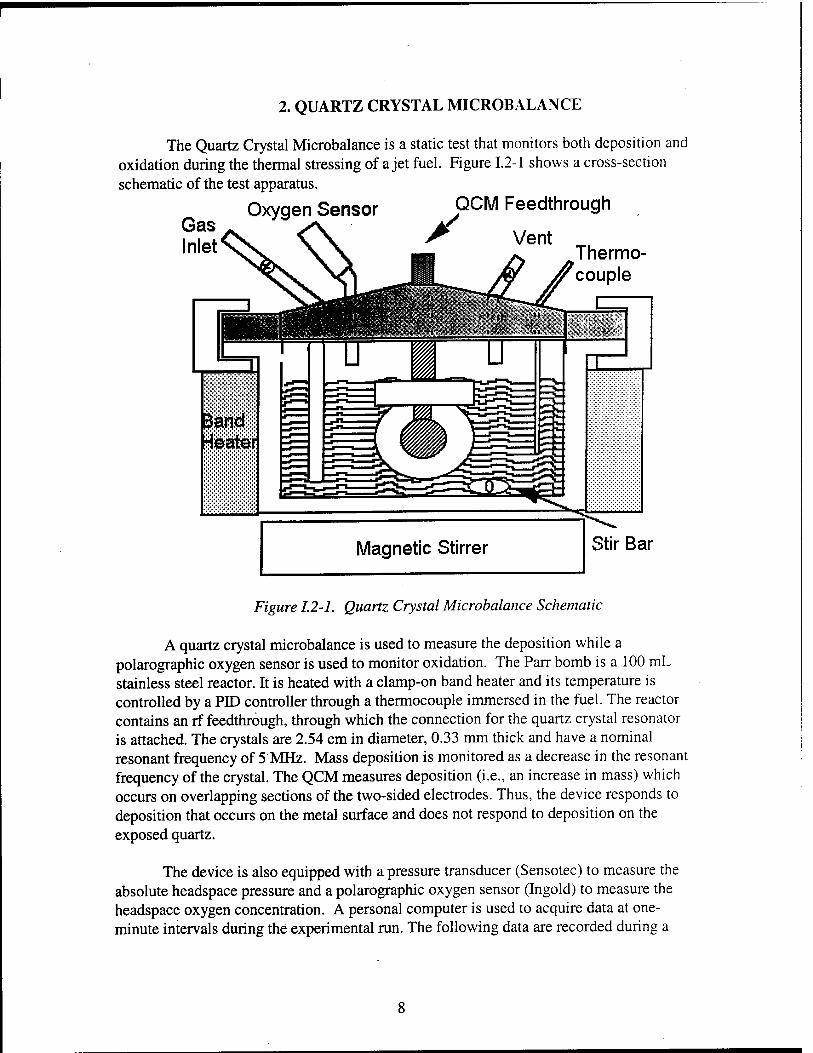
The Quartz Crystal Microbalance is a static test that monitors both deposition and oxidation during the thermal stressing of a jet fuel. Figure 1.2-1 shows a cross-section schematic of the test apparatus.
Oxygen Sensor QCM Feedthrough
X Vent Thermo- couple
Stir Bar
Figure 1.2-1. Quartz Crystal Microbalance Schematic
A quartz crystal microbalance is used to measure the deposition while a polarographic oxygen sensor is used to monitor oxidation. The Parr bomb is a 100 mL stainless steel reactor. It is heated with a clamp-on band heater and its temperature is controlled by a PID controller through a thermocouple immersed in the fuel. The reactor contains an rf feedthrough, through which the connection for the quartz crystal resonator is attached. The crystals are 2.54 cm in diameter, 0.33 mm thick and have a nominal resonant frequency of 5 MHz. Mass deposition is monitored as a decrease in the resonant frequency of the crystal. The QCM measures deposition (i.e., an increase in mass) which occurs on overlapping sections of the two-sided electrodes. Thus, the device responds to deposition that occurs on the metal surface and does not respond to deposition on the exposed quartz.
The device is also equipped with a pressure transducer (Sensotec) to measure the absolute headspace pressure and a polarographic oxygen sensor (Ingold) to measure the headspace oxygen concentration. A personal computer is used to acquire data at one- minute intervals during the experimental run. The following data are recorded during a
run: temperature, crystal frequency, headspace pressure, headspace oxygen concentration, and crystal damping voltage.
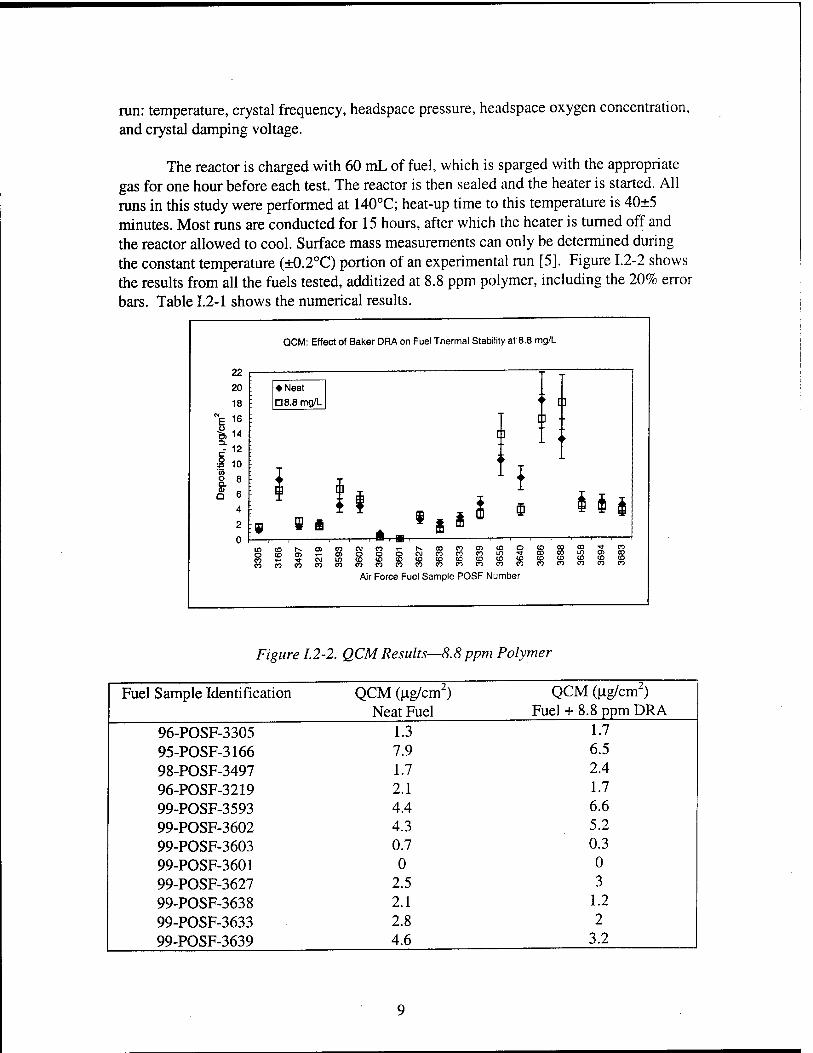
The reactor is charged with 60 mL of fuel, which is sparged with the appropriate gas for one hour before each test. The reactor is then sealed and the heater is started. All runs in this study were performed at 140°C; heat-up time to this temperature is 40±5 minutes. Most runs are conducted for 15 hours, after which the heater is turned off and the reactor allowed to cool. Surface mass measurements can only be determined during the constant temperature (±0.2°C) portion of an experimental run [5]. Figure 1.2-2 shows the results from all the fuels tested, additized at 8.8 ppm polymer, including the 20% error bars. Table 1.2-1 shows the numerical results.
22
20
18 W
E 16
•| 10 W
a 8
Q 6 4
2
0
QCM: Effect of Baker DRA on Fuel Thermal Stability at 8.8 mg/L
♦ Neat D 8.8 mg/L
[]
[]
9 9 i -i-
* S I I 9 i i O CO CO T- CO CO
en co CM co *- T- O) o o o C\J in CD CO CD CO CO CO CO CO
Air Force Fuel Sample POSF Number
Figure 1.2-2. QCM Results—8.8 ppm Polymer
Fuel Sample Identification QCM (ug/cmO Neat Fuel
96-POSF-3305 95-POSF-3166 98-POSF-3497 96-POSF-3219 99-POSF-3593 99-POSF-3602 99-POSF-3603 99-POSF-3601 99-POSF-3627 99-POSF-3638 99-POSF-3633 99-POSF-3639
1.3 7.9 1.7 2.1 4.4 4.3 0.7 0
2.5 2.1 2.8 4.6
QCM (ug/cmz) Fuel + 8.8 ppm DRA
1.7 6.5 2.4 1.7 6.6 5.2 0.3 0 3
1.2 2
3.2
99-POSF-3656 99-POSF-3640 99-POSF-3686 99-POSF-3688 99-POSF-3658 99-POSF-3694 99-POSF-3683
10.3 13.7 7.9 3.7 18.1 15.7 13 17.8 5 4.2
4.7 4.1 4.3 3.6 '
Table 1.2-1. QCMResults—8.8ppm polymer
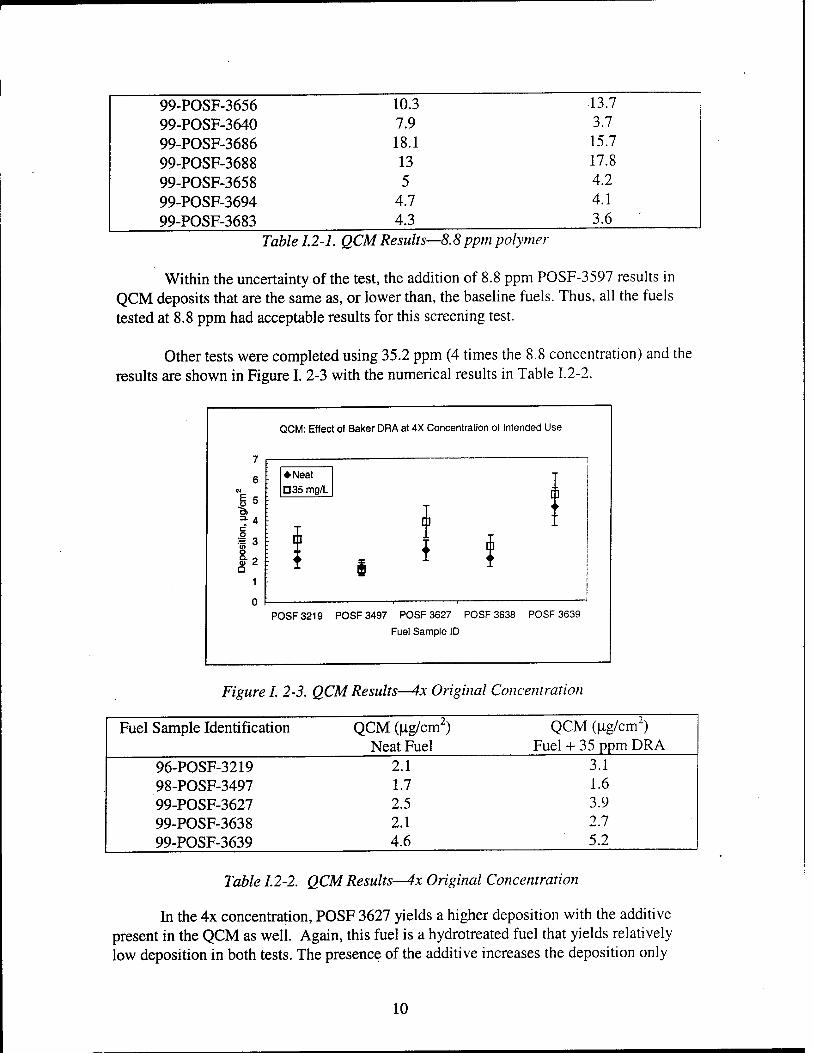
Within the uncertainty of the test, the addition of 8.8 ppm POSF-3597 results in QCM deposits that are the same as, or lower than, the baseline fuels. Thus, all the fuels tested at 8.8 ppm had acceptable results for this screening test.
Other tests were completed using 35.2 ppm (4 times the 8.8 concentration) and the results are shown in Figure I. 2-3 with the numerical results in Table 1.2-2.
QCM: Effect of Baker DRA at 4X Concentration of Intended Use
6
V =•4
|3 o <D 2 O
1
1
; ♦ Neat □35 mg/L f
[
<
3 <
i
]
<
<
] ►
P0SF3219 P0SF3497 POSF 3627 POSF 3638 POSF 3639
Fuel Sample ID
Figure I. 2-3. QCM Results—4x Original Concentration
Fuel Sample Identification QCM (ug/cm2) QCM (u-g/cm2) Neat Fuel Fuel + 35 ppm DRA
96-POSF-3219 2.1 3.1 98-POSF-3497 1.7 1.6 99-POSF-3627 2.5 3.9 99-POSF-3638 2.1 2.7 99-POSF-3639 4.6 5.2
Table 1.2-2. QCM Results—4x Original Concentration
In the 4x concentration, POSF 3627 yields a higher deposition with the additive present in the QCM as well. Again, this fuel is a hydrotreated fuel that yields relatively low deposition in both tests. The presence of the additive increases the deposition only
10
slightly outside the 20% error bars for both tests at the 4x concentration. Most importantly, the fuel deposition with the 4x concentration of the additive is still quite low relative to other unadditized fuels. For example, some fuels used by the Air Force in aircraft have had QCM deposition levels of 10 (ig/cm2 and above. Thus, these data show that addition of the additive at either the lx or 4x concentration is unlikely to produce significant changes in fuel thermal stability.
11

3. HOT LIQUID PROCESS SIMULATOR
The Hot Liquid Process Simulator (HLPS) is a derivative of the Jet Fuel Thermal Oxidation Tester (JFTOT) employed in ASTM D 3241 to rate the tendencies of aviation turbine fuels to form deposits under thermal-oxidative stress. A schematic of the HLPS is shown in Figure 1.3-1.
Constant Speed Metering Pump
Pressure Gauge
Nitrogen @ 500 psi
Fuel Reservoir
iFresh i Fuel
Membrane Prefilter
Heater Tube Test Section
Bus Connector and Cooler
Figure 1.3-1. Hot Liquid Process Simulator Schematic
The test conditions selected to evaluate additive performance are much more severe than those specified in the standard JFTOT procedure. Tests are performed at 335°C for 5 hours at a flow rate of 3 mL/min. Series 316 stainless steel tubes are substituted for the conventional aluminum tubes to permit quantitation of the deposit by carbon burnoff using a LECO RC-412 Carbon Analyzer [6]. Differences in deposition show additive effects. Figure 1.3-2 shows the results for all the fuels tested. Table 1.3-1 shows the numerical results for those tests.
12

HLPS: Effect of Baker DRA on Fuel Thermal Stability at 8.8 mg/L
250
200 CM
E .y 2 150 c g % 100 o Q. tt)
° 50
[]
«Neat
D 8.8 mg/L
[] -
$ t ID
*
[]
i if
E3 n []
[3
$ m 9 mCDr^OCOCMCOT-h-COCOOtDOCDCOCOTTCO OCDO)T-0>OOOC\JCOCOCOLOfOOOOL00100 CO-^^CJtOCDCDCDCOtDCDCDCOCDCDCDCDCOCD COCQCOOOCOCOCOCOCOCOCOCOCOCOCOCOCOCOCO
Air Force Fuel Sample POSF Number
Figure 13-2. HLPS Results—8.8 ppm polymer
Fuel Sample Identification HLPS (^ig/cm2) HLPS (|ig/cm2) Neat Fuel Fuel + 8.8 ppm DRA
96-POSF-3305 46 54 95-POSF-3166 155 192 98-POSF-3497 15 22 96-POSF-3219 60 57 99-POSF-3593 34 29 99-POSF-3602 76 36 99-POSF-3603 20 23 99-POSF-3601 88 24 99-POSF-3627 49 65 99-POSF-3638 123 182 99-POSF-3633 147 198 99-POSF-3639 126 101 99-POSF-3656 75 105 99-POSF-3640 139 117 99-POSF-3686 171 184 99-POSF-3688 29 40 99-POSF-3658 116 93 99-POSF-3694 22 22 99-POSF-3683 66 49
Table 1.3-1. HLPS Results—8.8 ppm polymer
13
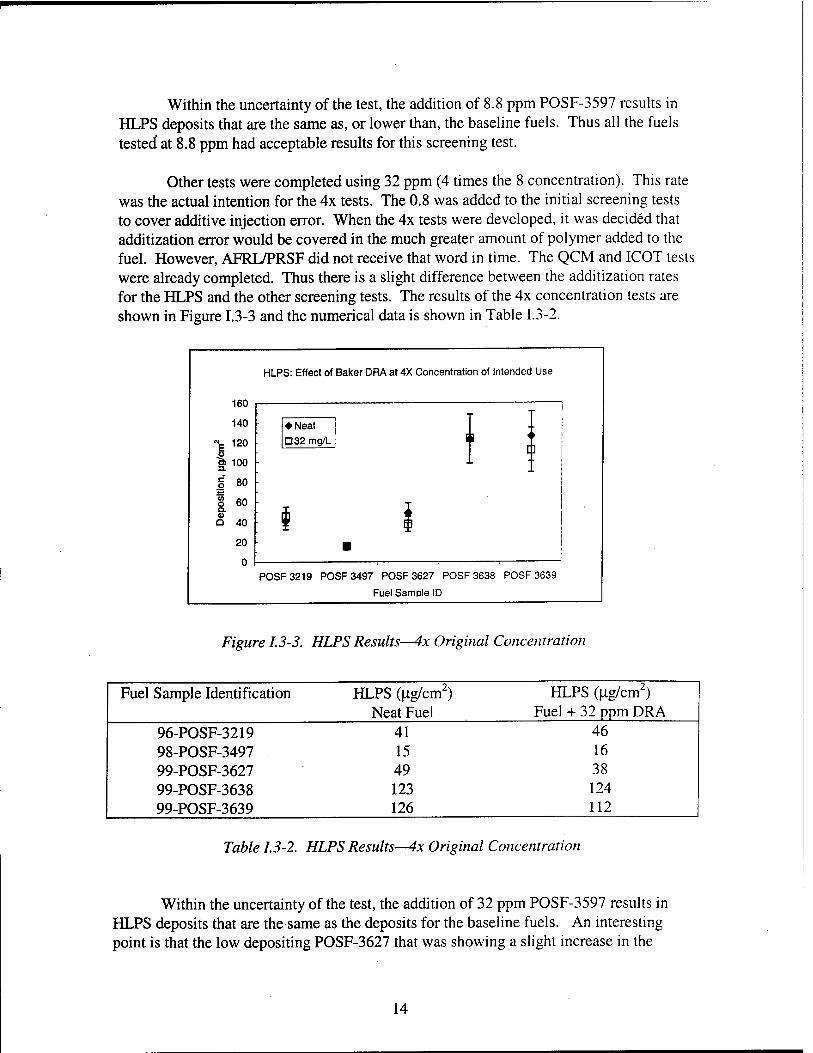
Within the uncertainty of the test, the addition of 8.8 ppm POSF-3597 results in HLPS deposits that are the same as, or lower than, the baseline fuels. Thus all the fuels testecf at 8.8 ppm had acceptable results for this screening test.
Other tests were completed using 32 ppm (4 times the 8 concentration). This rate was the actual intention for the 4x tests. The 0.8 was added to the initial screening tests to cover additive injection error. When the 4x tests were developed, it was decided that additization error would be covered in the much greater amount of polymer added to the fuel. However, AFRL/PRSF did not receive that word in time. The QCM and ICOT tests were already completed. Thus there is a slight difference between the additization rates for the HLPS and the other screening tests. The results of the 4x concentration tests are shown in Figure 1.3-3 and the numerical data is shown in Table 1.3-2.
HLPS: Effect of Baker DRA at 4X Concentration of Intended Use
leu
140 ♦ Neat i
Dep
ositi
on,
ug/c
m
o
o
o
o
o D32mg/L il ° !
1 "
; 1 20
0 ■
P0SF3219 POSF 3497 POSF 3627 POSF 3638 POSF 3639
Fuel Sample ID
Figure 1.3-3. HLPS Results—4x Original Concentration
Fuel Sample Identification HLPS (ug/cm2) HLPS (ug/cm2) Neat Fuel Fuel + 32 ppm DRA
96-POSF-3219 41 46 98-POSF-3497 15 16 99-POSF-3627 49 38 99-POSF-3638 123 124 99-POSF-3639 126 112
Table 1.3-2. HLPS Results—4x Original Concentration
Within the uncertainty of the test, the addition of 32 ppm POSF-3597 results in HLPS deposits that are the same as the deposits for the baseline fuels. An interesting point is that the low depositing POSF-3627 that was showing a slight increase in the
14

ICOT and QCM tests, did not show the same increase in the HLPS test. These data show that addition of the additive at either the lx or 4x concentration is unlikely to produce significant changes in fuel thermal stability.
15
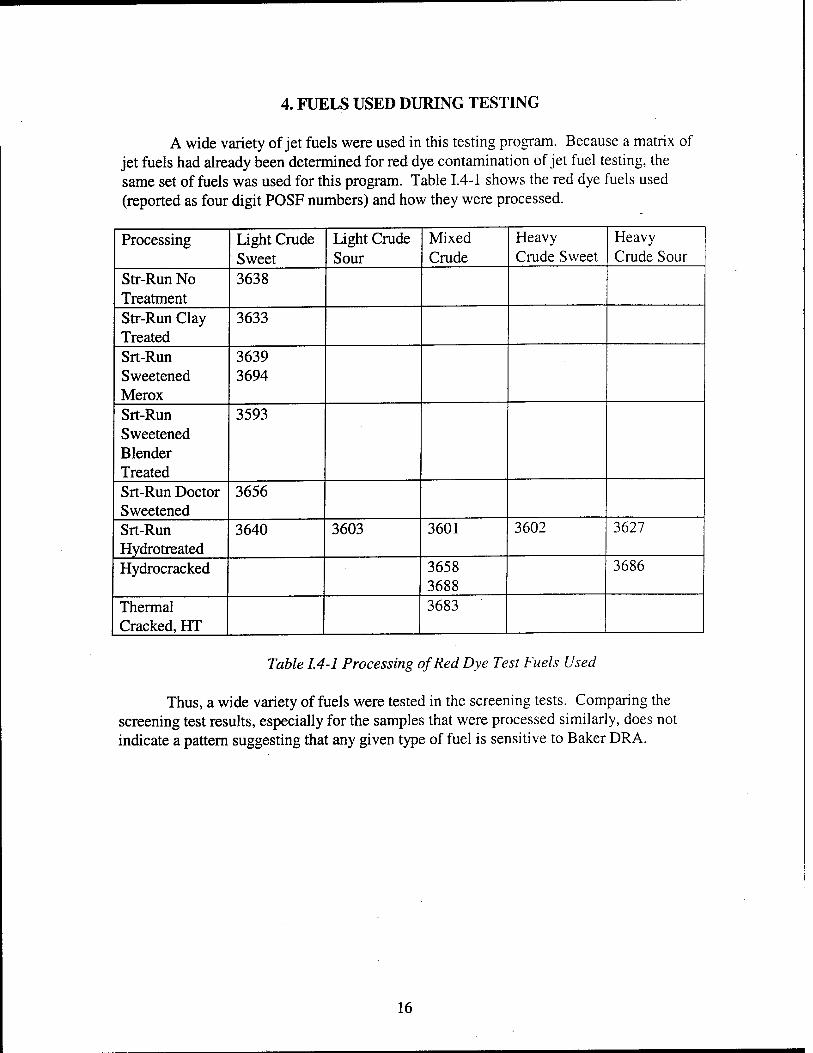
4. FUELS USED DURING TESTING
A wide variety of jet fuels were used in this testing program. Because a matrix of jet fuels had already been determined for red dye contamination of jet fuel testing, the same set of fuels was used for this program. Table 1.4-1 shows the red dye fuels used (reported as four digit POSF numbers) and how they were processed.
Processing Light Crude Sweet
Light Crude Sour
Mixed Crude
Heavy Crude Sweet
Heavy Crude Sour
Str-Run No Treatment
3638
Str-Run Clay Treated
3633
Srt-Run Sweetened Merox
3639 3694
Srt-Run Sweetened Blender Treated
3593
Srt-Run Doctor Sweetened
3656
Srt-Run Hydrotreated
3640 3603 3601 3602 3627
Hydrocracked 3658 3688
3686
Thermal Cracked, HT
3683
Table 1.4-1 Processing of Red Dye Test Fuels Used
Thus, a wide variety of fuels were tested in the screening tests. Comparing the screening test results, especially for the samples that were processed similarly, does not indicate a pattern suggesting that any given type of fuel is sensitive to Baker DRA.
16
METHODS, ASSUMPTIONS, and PROCEDURES
&
RESULTS and DISCUSSIONS
SECTION II. SIMULATION TESTS
17
1. EXTENDED DURATION THERMAL STABILITY TEST
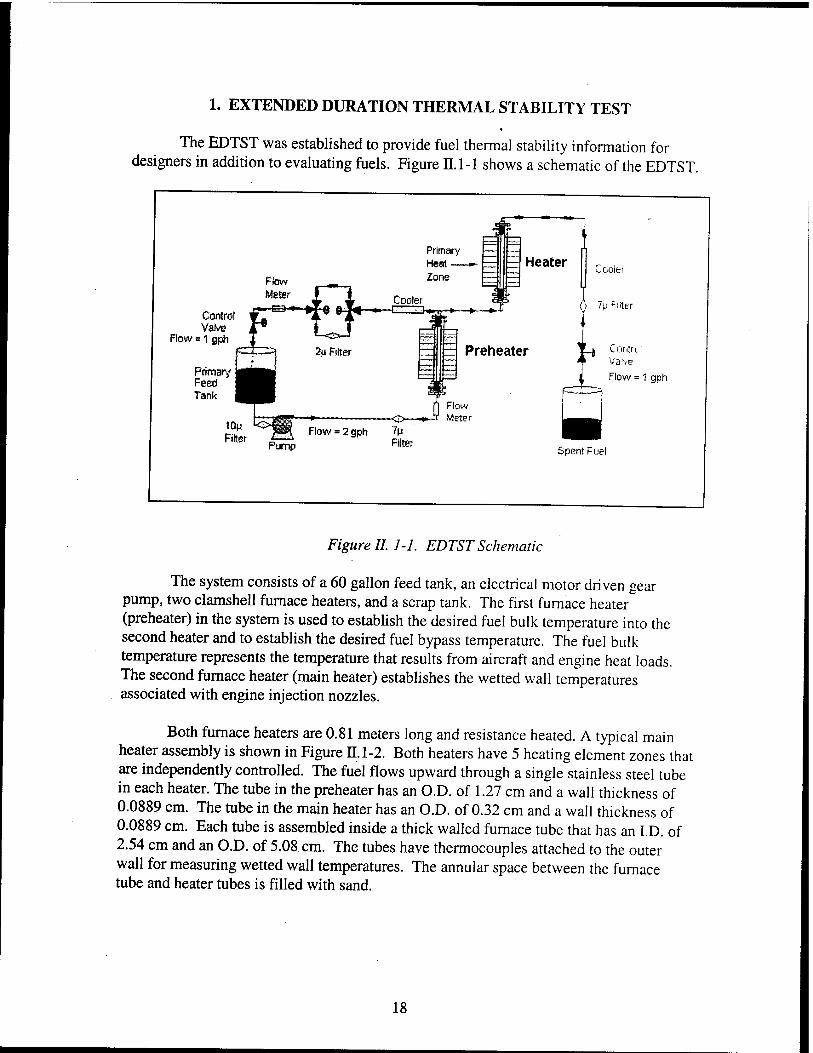
The EDTST was established to provide fuel thermal stability information for designers in addition to evaluating fuels. Figure II. 1-1 shows a schematic of the EDTST.
Control Valve
Flow = 1 gph
Primary Feed Tank
Primary Heat — Zone
Cooler
Heater
3E:
Cooler
ö 7p Fiiter
Preheater
Flow = 2 gph 7(J Purnp FilEer
Contnvl V3:ve Flow = 1 gph
Spent Fuel
Figure II. 1-1. EDTST Schematic
The system consists of a 60 gallon feed tank, an electrical motor driven gear pump, two clamshell furnace heaters, and a scrap tank. The first furnace heater (preheater) in the system is used to establish the desired fuel bulk temperature into the second heater and to establish the desired fuel bypass temperature. The fuel bulk temperature represents the temperature that results from aircraft and engine heat loads. The second furnace heater (main heater) establishes the wetted wall temperatures associated with engine injection nozzles.
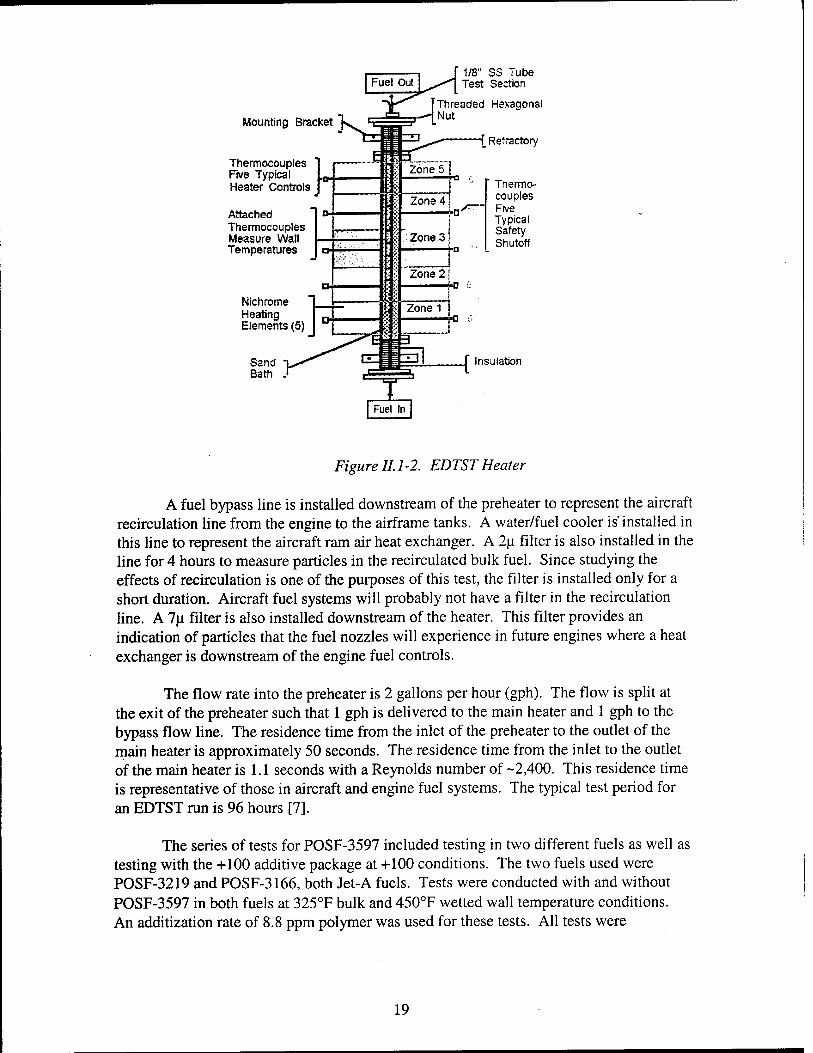
Both furnace heaters are 0.81 meters long and resistance heated. A typical main heater assembly is shown in Figure n.1-2. Both heaters have 5 heating element zones that are independently controlled. The fuel flows upward through a single stainless steel tube in each heater. The tube in the preheater has an O.D. of 1.27 cm and a wall thickness of 0.0889 cm. The tube in the main heater has an O.D. of 0.32 cm and a wall thickness of 0.0889 cm. Each tube is assembled inside a thick walled furnace tube that has an I.D. of 2.54 cm and an O.D. of 5.08 cm. The tubes have thermocouples attached to the outer wall for measuring wetted wall temperatures. The annular space between the furnace tube and heater tubes is filled with sand.
18
Mounting Bracket
Thermocouples Five Typical Heater Controls
Attached Thermocouples Measure Wall Temperatures
Nichrome Heating Elements (5)
Sand Bath .1
Fuel Out ^\
1/8" SS Tube Test Section
Threaded Hexagonal Nut
-f Refractory
Thermo- couples Five Typical Safety Shutoff
Insulation
Fuel In
Figure II 1 -2. EDTST Heater
A fuel bypass line is installed downstream of the preheater to represent the aircraft recirculation line from the engine to the airframe tanks. A water/fuel cooler is' installed in this line to represent the aircraft ram air heat exchanger. A 2u filter is also installed in the line for 4 hours to measure particles in the recirculated bulk fuel. Since studying the effects of recirculation is one of the purposes of this test, the filter is installed only for a short duration. Aircraft fuel systems will probably not have a filter in the recirculation line. A 7u filter is also installed downstream of the heater. This filter provides an indication of particles that the fuel nozzles will experience in future engines where a heat exchanger is downstream of the engine fuel controls.
The flow rate into the preheater is 2 gallons per hour (gph). The flow is split at the exit of the preheater such that 1 gph is delivered to the main heater and 1 gph to the bypass flow line. The residence time from the inlet of the preheater to the outlet of the main heater is approximately 50 seconds. The residence time from the inlet to the outlet of the main heater is 1.1 seconds with a Reynolds number of -2,400. This residence time is representative of those in aircraft and engine fuel systems. The typical test period for an EDTST run is 96 hours [7].
The series of tests for POSF-3597 included testing in two different fuels as well as testing with the +100 additive package at +100 conditions. The two fuels used were POSF-3219 and POSF-3166, both Jet-A fuels. Tests were conducted with and without POSF-3597 in both fuels at 325°F bulk and 450°F wetted wall temperature conditions. An additization rate of 8.8 ppm polymer was used for these tests. All tests were
19
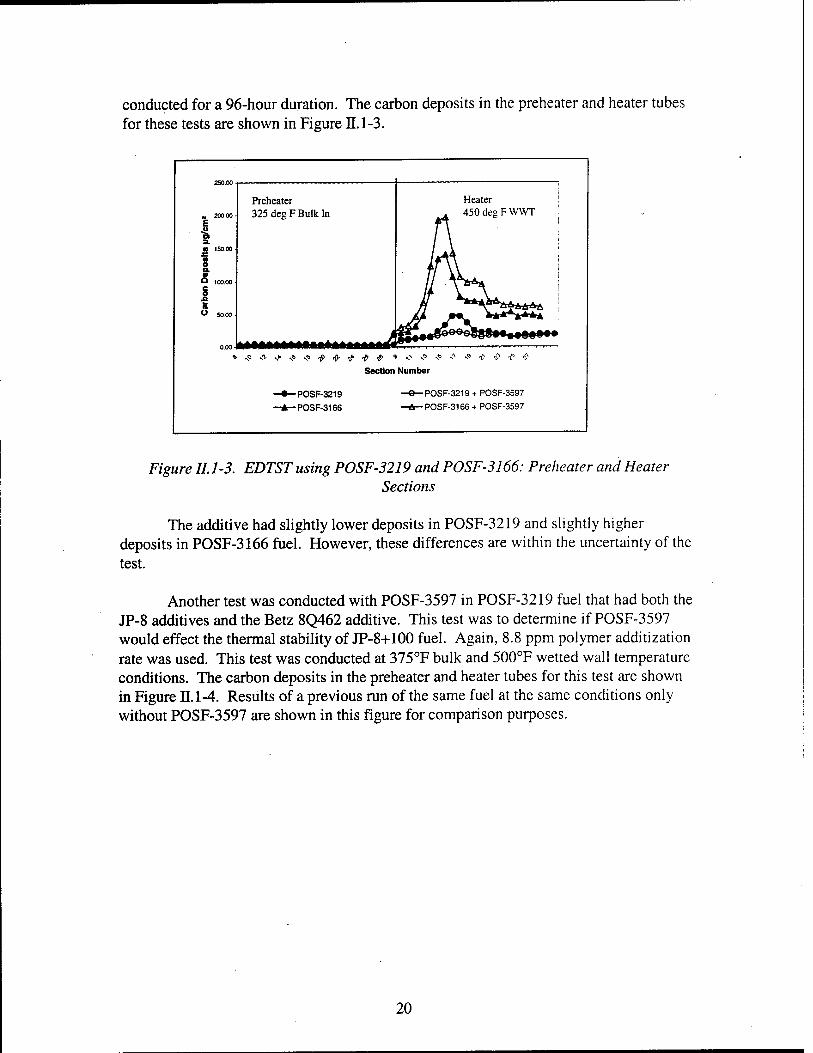
conducted for a 96-hour duration. The carbon deposits in the preheater and heater tubes for these tests are shown in Figure II. 1-3.
250.00
Preheater Heater
„ 200.00 E
* a.
325degFBuIkIn . 450 deg F WWT D
epos
its
8
S
8
8
i a O 50.00
0.00-
» sO & .,► .J> N» ,£> $. tf tf # V -9 ■? *
Section Number
-POSF-3219 -POSF-3166
-POSF-3219 + POSF-3597
-POSF-3166 + POSF-3597
Figure II.1-3. EDTST using POSF-3219 and POSF-3166: Preheater and Heater Sections
The additive had slightly lower deposits in POSF-3219 and slightly higher deposits in POSF-3166 fuel. However, these differences are within the uncertainty of the test.
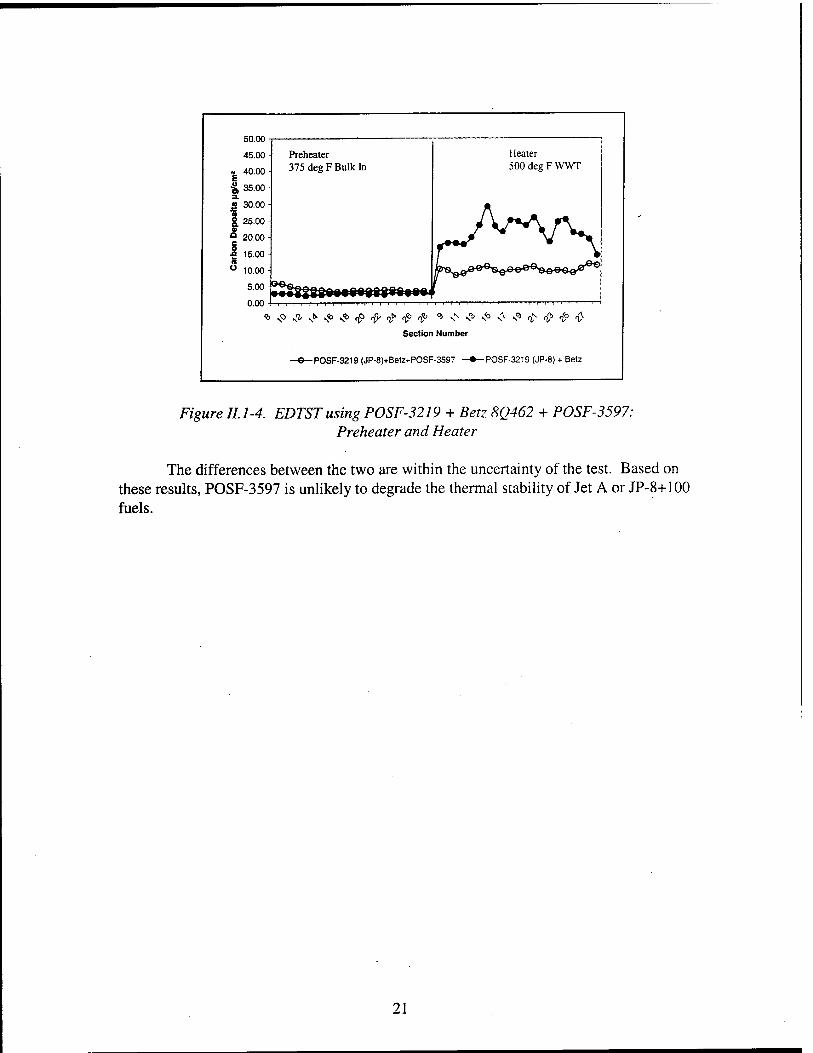
Another test was conducted with POSF-3597 in POSF-3219 fuel that had both the JP-8 additives and the Betz 8Q462 additive. This test was to determine if POSF-3597 would effect the thermal stability of JP-8+100 fuel. Again, 8.8 ppm polymer additization rate was used. This test was conducted at 375°F bulk and 500°F wetted wall temperature conditions. The carbon deposits in the preheater and heater tubes for this test are shown in Figure E.l-4. Results of a previous run of the same fuel at the same conditions only without POSF-3597 are shown in this figure for comparison purposes.
20
50.00-
45.00- Preheater Heater
- 40.00 -
1,35.00
« 30.00-
375 deg F Bulk In 500degFWWT
• g. 25.00 ArArv S 20.00- <S V A •2 15.00- r_'^^ 1 ° 10.00 - fjfs^Q0e^^^Q»^^B^&&Q^^u
5.00 - f • •MJM BWWÜllMWlItBii i
<b N0 & s* N<b «<b $> ft & <$> <$> <* N> ■? ■$> <\ •?<£><£><£ <£
Section Number
—e— POSF-3219 (JP-8)+Betz+POSF-3597 —•— POSF-3219 (JP-8) + Betz
Figure 11.1-4. EDTST using POSF-3219 + Betz 8Q462 + POSF-3597: Preheater and Heater
The differences between the two are within the uncertainty of the test. Based on these results, POSF-3597 is unlikely to degrade the thermal stability of Jet A or JP-8+100 fuels.
21
2. AUGMENTOR FOULING SIMULATOR
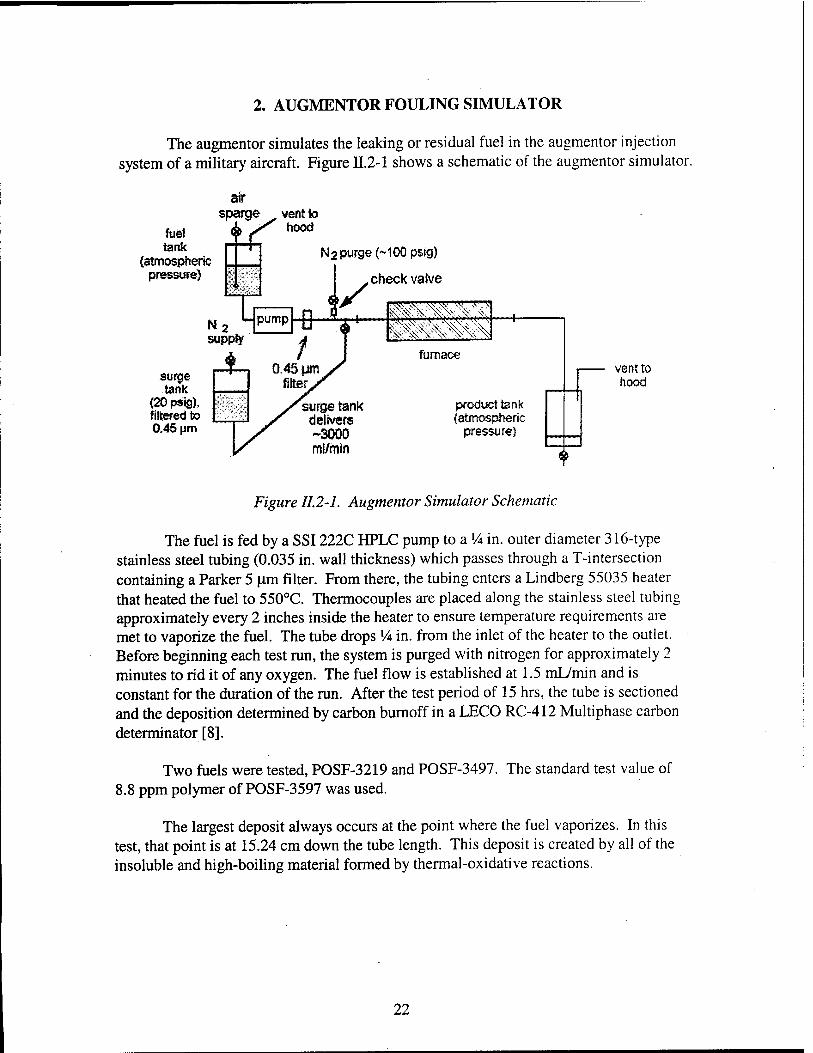
The augmentor simulates the leaking or residual fuel in the augmentor injection system of a military aircraft. Figure H2-1 shows a schematic of the augmentor simulator.
fuel tank
(atmospheric pressure)
vent to hood
surge tank
{20 psjg), filtered to 0.46 pm
N2 purge H 00 psig)
check valve
N2 supply
.' " ■—
furnace
surge tank delivers -3000 ml/min
product tank (atmospheric
pressure)
vent to hood
Figure II.2-1. Augmentor Simulator Schematic
The fuel is fed by a SSI 222C HPLC pump to a VA in. outer diameter 316-type stainless steel tubing (0.035 in. wall thickness) which passes through a T-intersection containing a Parker 5 u.m filter. From there, the tubing enters a Lindberg 55035 heater that heated the fuel to 550°C. Thermocouples are placed along the stainless steel tubing approximately every 2 inches inside the heater to ensure temperature requirements are met to vaporize the fuel. The tube drops VA in. from the inlet of the heater to the outlet. Before beginning each test run, the system is purged with nitrogen for approximately 2 minutes to rid it of any oxygen. The fuel flow is established at 1.5 mL/min and is constant for the duration of the run. After the test period of 15 hrs, the tube is sectioned and the deposition determined by carbon burnoff in a LECO RC-412 Multiphase carbon determinator [8].
Two fuels were tested, POSF-3219 and POSF-3497. The standard test value of 8.8 ppm polymer of POSF-3597 was used.
The largest deposit always occurs at the point where the fuel vaporizes. In this test, that point is at 15.24 cm down the tube length. This deposit is created by all of the insoluble and high-boiling material formed by thermal-oxidative reactions.
22
Deposition at 15.24cm
3497+PORA (avg) 3219+PDRA(avg)
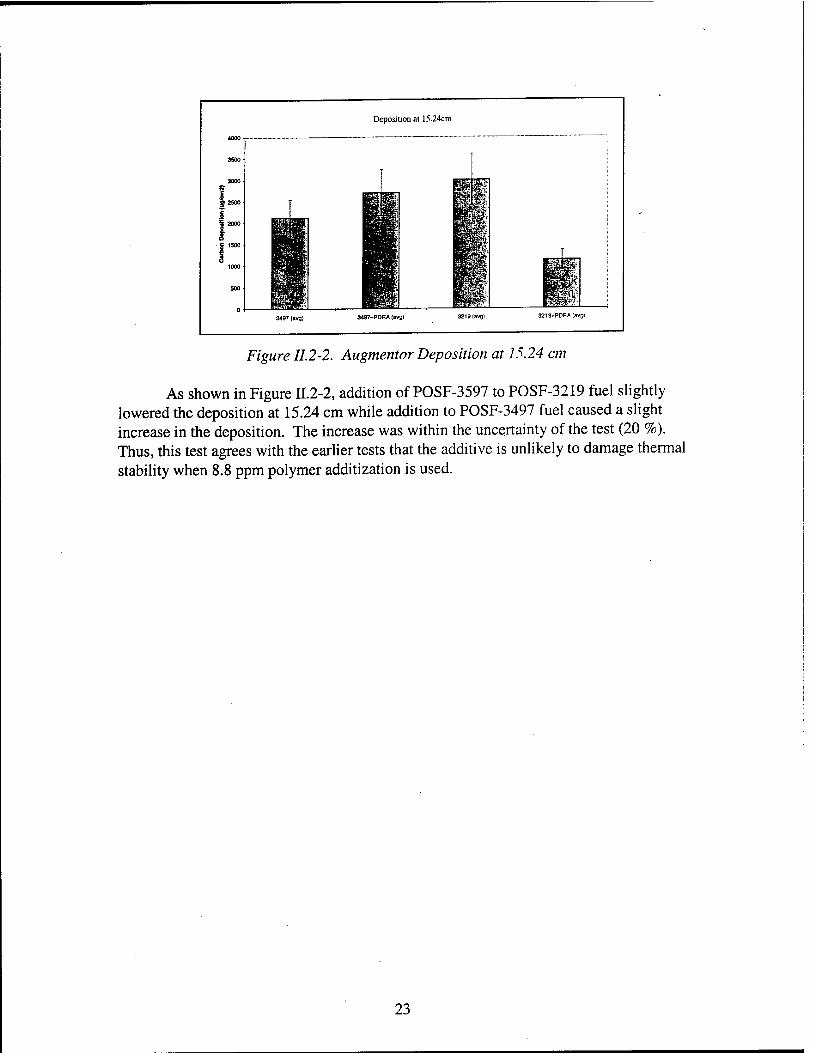
Figure 11.2-2. Augmentor Deposition at 15.24 an
As shown in Figure H.2-2, addition of POSF-3597 to POSF-3219 fuel slightly lowered the deposition at 15.24 cm while addition to POSF-3497 fuel caused a slight increase in the deposition. The increase was within the uncertainty of the test (20 %). Thus, this test agrees with the earlier tests that the additive is unlikely to damage thermal stability when 8.8 ppm polymer additization is used.
23
3. NEAR-ISOTHERMAL FLOWING TEST RIG
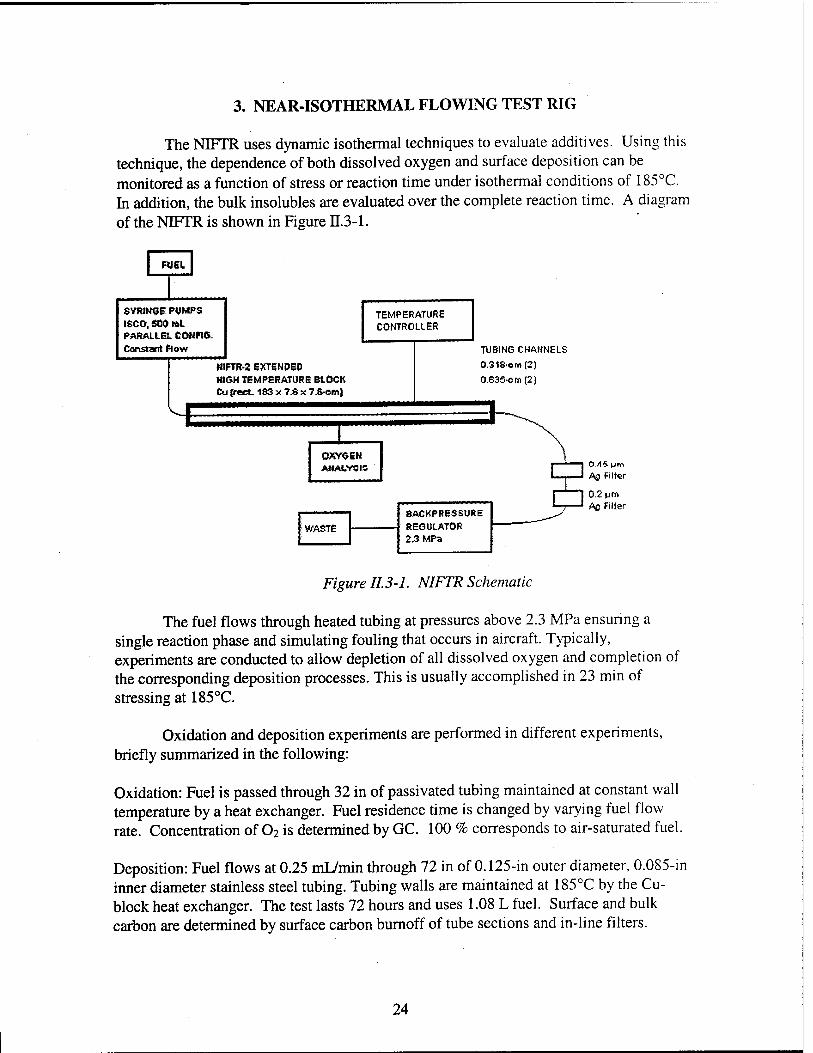
The NIFTR uses dynamic isothermal techniques to evaluate additives. Using this technique, the dependence of both dissolved oxygen and surface deposition can be monitored as a function of stress or reaction time under isothermal conditions of 185°C. In addition, the bulk insolubles are evaluated over the complete reaction time. A diagram of the NIFTR is shown in Figure H3-1.
FUEL
SVRIN8E PUMPS ISCO,SOO»L PARALLEL CONFIG. Constant flow
TEMPERATURE CONTROLLER
WFTR.2 EXTENBEO HIGH TEMPERATURE BLOCK Cu (feet- 1S3 x 7.8 X 7.6-em)
QXY6EN AMALYSIS
WASTE
TUBING CHANNELS
0.318'Orn(2)
OJ53S-cm{2)
BACKPRESSURE REGULATOR 2.3 MPa
CM5 M™ Ag Filter
0.2 pm Ag Filter
Figure 113-1. NIFTR Schematic
The fuel flows through heated tubing at pressures above 2.3 MPa ensuring a single reaction phase and simulating fouling that occurs in aircraft. Typically, experiments are conducted to allow depletion of all dissolved oxygen and completion of the corresponding deposition processes. This is usually accomplished in 23 min of stressing at 185°C.
Oxidation and deposition experiments are performed in different experiments, briefly summarized in the following:
Oxidation: Fuel is passed through 32 in of passivated tubing maintained at constant wall temperature by a heat exchanger. Fuel residence time is changed by varying fuel flow rate. Concentration of 02 is determined by GC. 100 % corresponds to air-saturated fuel.
Deposition: Fuel flows at 0.25 mL/min through 72 in of 0.125-in outer diameter, 0.085-in inner diameter stainless steel tubing. Tubing walls are maintained at 185°C by the Cu- block heat exchanger. The test lasts 72 hours and uses 1.08 L fuel. Surface and bulk carbon are determined by surface carbon burnoff of tube sections and in-line filters.
24

Stress duration is proportional to distance along the tube and is calculated assuming plug flow. Quantity of insolubles is expressed in units of ug/mL [9].
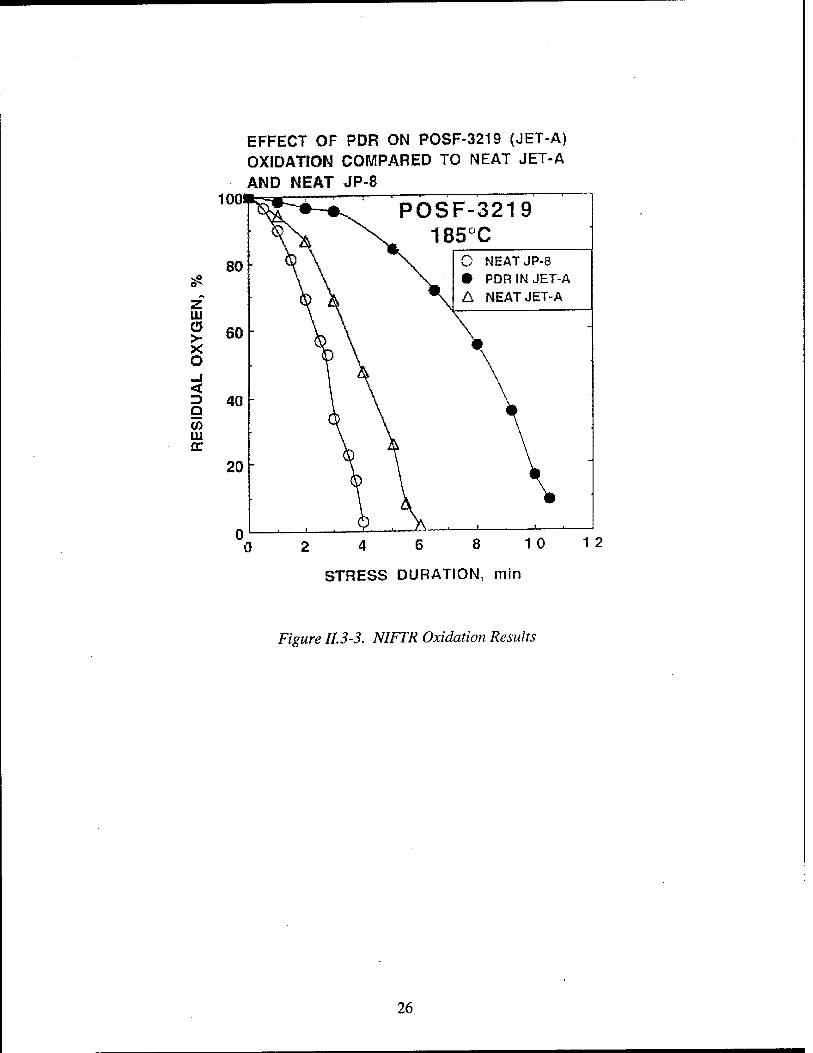
The NIFTR results for deposition and oxidation are shown in Figures H3-2 and n.3-3. From a deposition standpoint neat JP-8, Jet-A and additized Jet-A are approximately the same within experimental uncertainty yielding 1.53, 1.68, and 1.47 Ug/mL, respectively. The in-line bulk insolubles, however, are significantly reduced in the additized sample, compared to either the neat JP-8 or Jet-A (compare 0.11 with 0.64 and 0.84). These results suggest some detergent/dispersant properties of POSF-3597 in this fuel.
The JP-8 additive package tends to be slightly pro-oxidant as we have seen in other fuels. However, the oxidation changes from the POSF-3597 are more pronounced. The POSF-3597 has distinct antioxidant behavior at 185°C as evidenced by the factor of 2 delay in the oxidation time. Overall, POSF-3597 appears to enhance the fuel behavior.
£ =j.
■£ o 03
< o m o < LL, cc
CO
< I- O
EFFECT OF PDR ON POSF-3219 (JET-A) COMPARED TO NEAT JET-A and NEAT JP-8
2.0
1.6
1.2
0.8
0.4 -
0.0
POSF-3219 • 185°C >tf&^
Ssl.68, Qs0.64,T=2,32ug/mL^P w^=^Q
s^t .47, B=0.11.T=1.5BfigVmL p/ST ^^tß^^^
O NEAT JP-8 • PDR IN JET-A A NEAT JET-A
J&UzP S=1.S 3.BsD.84,T=2.37ji9/mL-
3^T 4 8 12 16 20
STRESS DURATION, min
24
Figure II. 3-2. NIFTR Deposition Results
25
z m >* x o MM!
<
9 CO Ui
EFFECT OF PDR ON POSF-3219 (JET-A) OXIDATION COMPARED TO NEAT JET-A
AND NEAT JP-8 1001 3219
C NEAT JP-8 PDR IN JET-A NEAT JET-A
0 2 4 6 8 10
STRESS DURATION, min
1 2
Figure 113-3. NIFTR Oxidation Results
26
4. ADVANCED REDUCED SCALE FUEL SYSTEM SIMULATOR
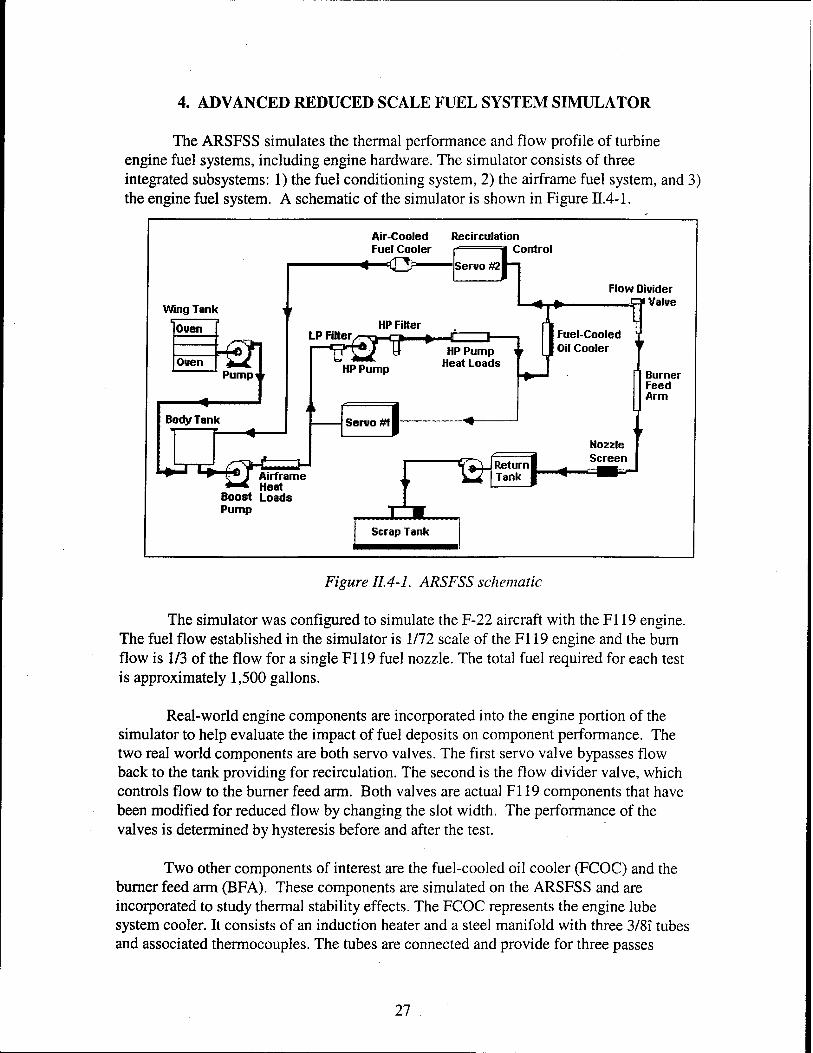
The ARSFSS simulates the thermal performance and flow profile of turbine engine fuel systems, including engine hardware. The simulator consists of three integrated subsystems: 1) the fuel conditioning system, 2) the airframe fuel system, and 3) the engine fuel system. A schematic of the simulator is shown in Figure H4-1.
Air-Cooled Recirculation
Wing Tank
Oven
Ouen ■-Q\ Pump
Body Tank
Fuel Cooler Control
«H-*- HP Fitter
LP "■»"•—j r-M % t
HP Pump
Servo #1 \
Flow Divider fp Valve
HP Pump Heat Loads
Fuel-Cooled Oil Cooler
T
Burner Feed Arm
Airframe Heat
Boost Loads Pump
VA^-Return I ^_
Nozzle Screen
Scrap Tank
Figure 11.4-1. ARSFSS schematic
The simulator was configured to simulate the F-22 aircraft with the Fl 19 engine. The fuel flow established in the simulator is 1/72 scale of the Fl 19 engine and the burn flow is 1/3 of the flow for a single F119 fuel nozzle. The total fuel required for each test is approximately 1,500 gallons.
Real-world engine components are incorporated into the engine portion of the simulator to help evaluate the impact of fuel deposits on component performance. The two real world components are both servo valves. The first servo valve bypasses flow back to the tank providing for recirculation. The second is the flow divider valve, which controls flow to the burner feed arm. Both valves are actual Fl 19 components that have been modified for reduced flow by changing the slot width. The performance of the valves is determined by hysteresis before and after the test.
Two other components of interest are the fuel-cooled oil cooler (FCOC) and the burner feed arm (BFA). These components are simulated on the ARSFSS and are incorporated to study thermal stability effects. The FCOC represents the engine lube system cooler. It consists of an induction heater and a steel manifold with three 3/8T tubes and associated thermocouples. The tubes are connected and provide for three passes
27

through the heater. The tube that is used for the final pass is removed after each test. It is cut into 2 inch segments and subjected to carbon analysis. The burner feed arm is RF induction heated. It consists of a steel clamshell with a 1/8 inch stainless steel tube installed in middle of the clamshell. Thermocouples on the outside of the tube are positioned along the entire length to measure the temperature profile of the tube. At the end of the tests, this tube is cut up into 1 inch segments and subjected to carbon analysis as well [7].
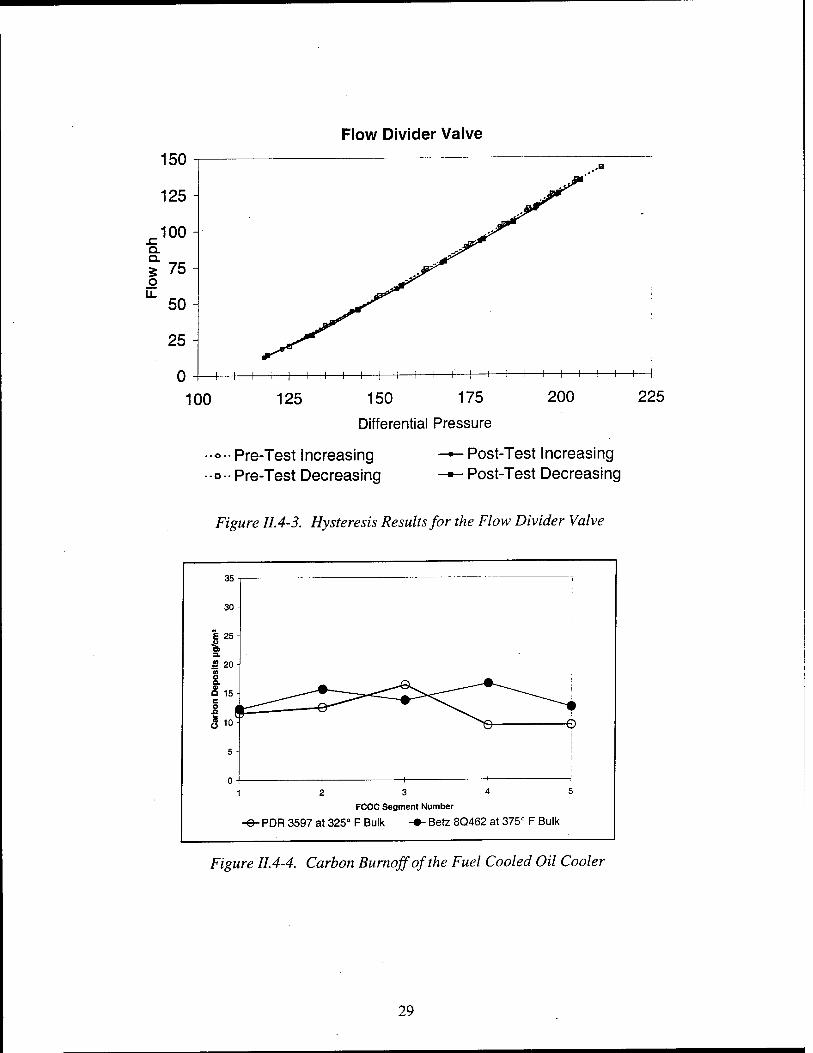
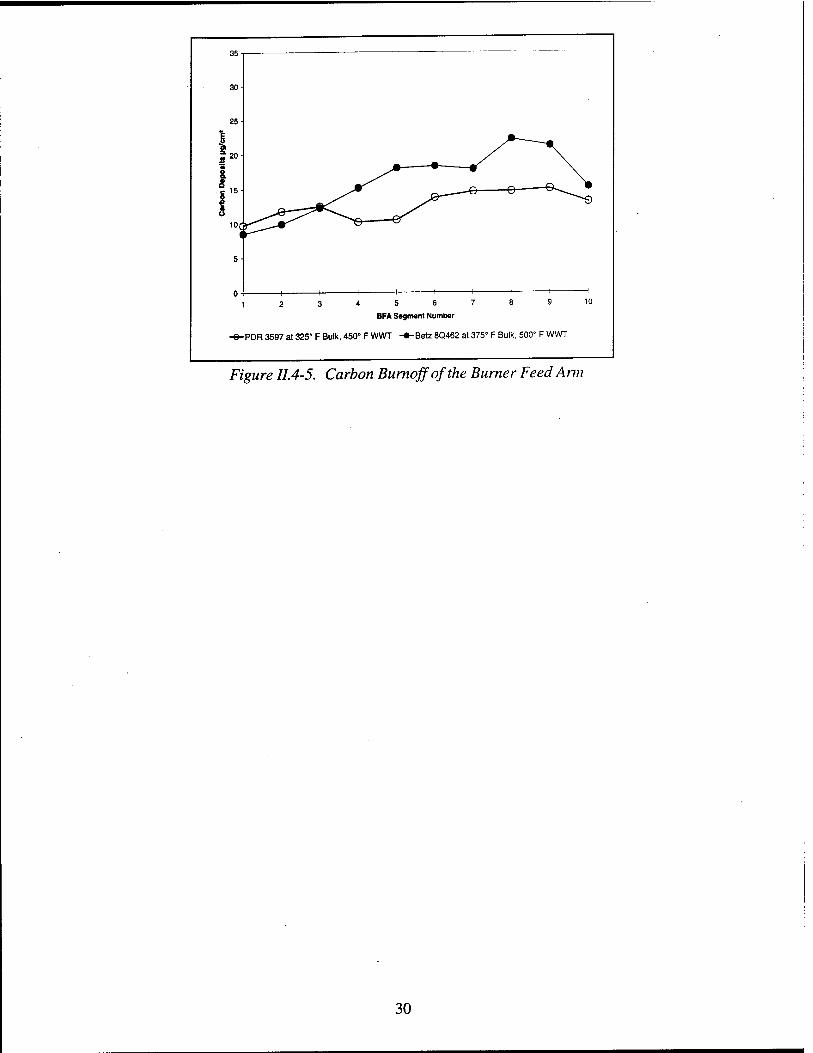
A test of POSF-3597 was evaluated at conditions of 325°F bulk fuel out of the FCOC and a wetted wall temperature of 450°F. These conditions were selected to simulate worst case conditions that today's engine experience using Jet-A fuels. This test was conducted with POSF-3219 fuel with the POSF-3597 drag reducer additive at 8.8 ppm. The modified duty cycle was used and 65 missions (approximately 150 hours) were conducted for this test. The servo and flow divider valves were disassembled after this test and were in as-new condition. The hysteresis tests of these valves also indicated no change in valve performance. Plots of these tests are shown in Figures JJ.4-2 and U.4-3. The carbon deposits on the FCOC and burner feed arm tubes are shown in Figures H4-4 and n.4-5. Data from a previous test of POSF-3219 fuel with the Betz 8Q462 additive is shown for reference purposes. The JP-8+100 test level demonstrates an acceptable amount of deposition. As seen in Figures H.4-4 and JJ.4-5, the carbon deposits from the POSF-3597 test were in the same acceptable range. Based on the results of this test, the drag reducer is considered to be thermally stable at bulk temperatures up to 325°F and 450°F wetted wall temperatures.
Servo Valve
Q. Q. 3 o u.
izu -
100 -
80 - >iv^
60 - ^iS;
40 -
20 -
0 - 1 1 1 1 1 1 H —I 1 1 1 1 1 1 1 ^fcw ,.ra.
100 125 150 Differential Pressure
175 200
•o-Pre-Test Increasing •a- Pre-Test Decreasing
Post-Test Increasing Post-Test Decreasing
Figure II.4-2. Hysteresis Results for Servo Valve
28
Flow Divider Valve
150
125
^100 Q. Q. 5 75 o
50
25 -
0
100
—I—i-
125
H—|—i—i—i—^
150 175
Differential Pressure
H—i—I—h H—I—H
200 225
..<>.. pre.Test Increasing --0-- Pre-Test Decreasing
Post-Test Increasing Post-Test Decreasing
Figure 11.4-3. Hysteresis Results for the Flow Divider Valve
35
30
E 25
a 20
12 3 4 5
FCOC Segment Number
-e- PDR 3597 at 325° F Bulk -♦- Betz 8Q462 at 375° F Bulk
Figure 11.4-4. Carbon Burnoffofthe Fuel Cooled Oil Cooler
29
30-
25-
5 6 7
BFA Segment Number
- PDR 3597 at 325° F Bulk, 450° F WWT -•- Betz 8Q462 at 375° F Bulk, 500° F WWT
Figure 11.4-5. Carbon Burnoffofthe Burner Feed Ami
30
METHODS, ASSUMPTIONS, and PROCEDURES
&
RESULTS and DISCUSSIONS
SECTION III. OTHER TESTS
31
1. MATERIAL COMPATIBILITY
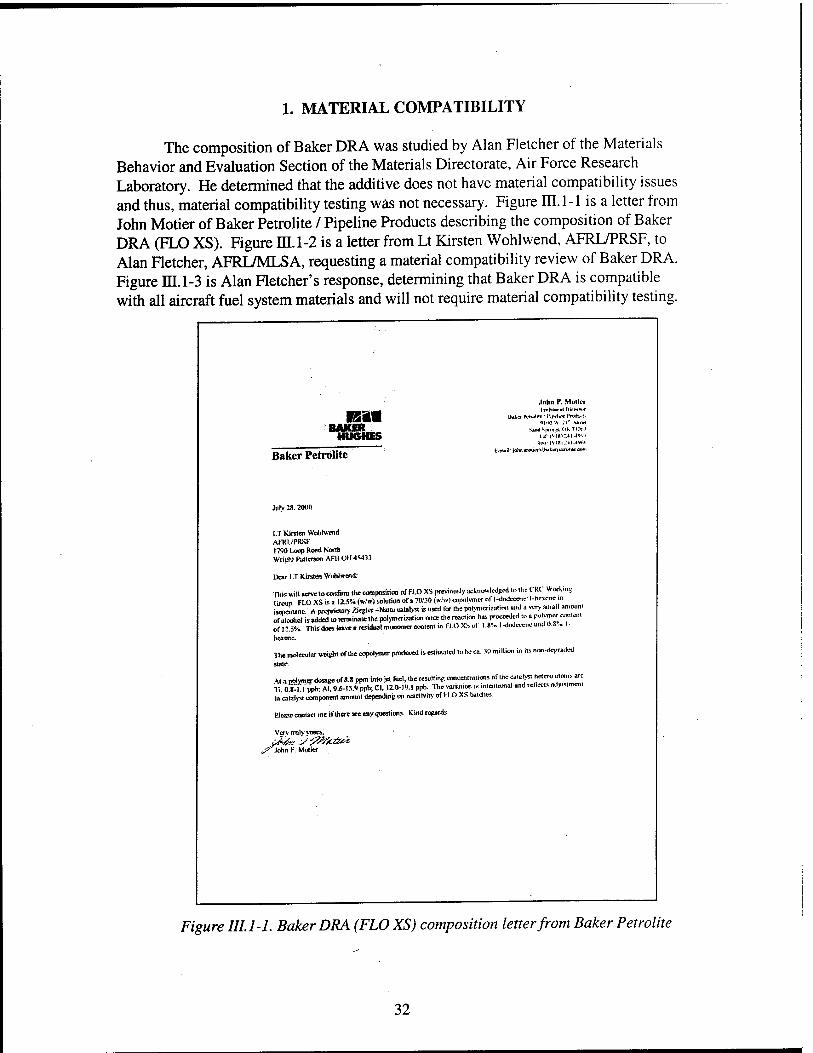
The composition of Baker DRA was studied by Alan Fletcher of the Materials Behavior and Evaluation Section of the Materials Directorate, Air Force Research Laboratory. He determined that the additive does not have material compatibility issues and thus, material compatibility testing was not necessary. Figure m. 1-1 is a letter from John Motier of Baker Petrolite / Pipeline Products describing the composition of Baker DRA (FLO XS). Figure D3.1-2 is a letter from Lt Kirsten Wohl wend, AFRL/PRSF, to Alan Fletcher, AFRL/MLSA, requesting a material compatibility review of Baker DRA. Figure JU.1-3 is Alan Fletcher's response, determining that Baker DRA is compatible with all aircraft fuel system materials and will not require material compatibility testing.
ISM BAKER
HUGHES
Baker Petrolite
.lohn F. Motier ItrtiMrat |>irrv«>r
Haler PcwnlH*.' i'ipdirw It«*..!'. "JI'iOW :i" Mirei
S»nd Spnni!*. OK Tv.tp» Id (M«.t?41-t=»7
l-i.« <7ISi;4MW>>. nail: John «HHwrii:hi*«i|vtn'*xc «*»
LT Kirsten Wohlwcnd AFRL/PRSF 1790 Loop Road Nor* Wridtl Patterson AFBOH<l5-t33
»ear ].T Kirsten Wohlraid:
ITlis »ill serve lo confirm the composition of FLO XS previously acln»v.M«.ed to the CRC Workin? Group FLO XS is a 12.5% (Vw) solution of a 70/.10 («;») cup..!™« «f 1-dodccenC I -hacnt in iwncnunc A procrielnrv Zicgler - Natci catalyst is used lor the polymeriiiatimt and a very snail amotini of alcohol is added to terminate the polymerization "'« *» action has proceeded to a pulyrner CMitenl ofH3%. Thisdoes leave »residual monomer content in I'l.OXS of l.«% l-dodeccmrandn.8.. 1-
hexene.
Tlic molecular »wl*t of the copolvmer produced is estimated to be ca. 30 million in its noo-degraded
state.
At a polymer dosage of 8.8 ppm into jet ftiel, Hie resulting concentralions of !hc catalyst hclero moms arc Ti, okV.iypb; Al, ».«-IS.» ppb; Cl, 12.0-lv.l ppb. The varuition is intentional and reilects ndiiistmenl in catalyst component amount depending on reactivity of FLO XS batches
Please contact me if there are any questions. Kind regards.
Verv trulv vows,
^ John P. Motier
Figure III. 1-1. Baker DRA (FLO XS) composition letter from Baker Petrolite
32

DEPARTMENT OF THE AIR FORCE A!« ttJRCE KRSfiAKCH LAWlfmOKV
WRlfitn' PATTEKSON AIR H>RCE BASL OHIO iur>
MEMORANDUM FOR AFRIVMLSA (ALAN FLETCHER)
FROM: AFRL/PRSF{1LT KIRSTEN WOHLWEND)
SUBJECT: Request for Material Compatibility Review
J. As part of CRADA #98-173-PR-01. AFRUPRSF is studying the Baker FLO-XS pipeline drag reducing additive (POSF-3597) and if it has detrimental effects to jet fuel thermal stability. Another issue is that of material compatibility of POSF-3597 with materials it would come in contact with in an aircraft.
2. POSF-3597 is a 12.5% solution of a 70/30 (w/w) copolymcr of 1 -dodecene/1-hexene in isopentane. A proprietary Zicgler-Natta type catalyst is used for the polymerization and a small amount of alcohol is added once the reaction has proceeded to 12.5% polymer to kill the catalyst. The catalyst is comprised of titanium salt and aluminum alkyl activator. At the expected polymer dosage of 8.8 ppm, the resulting concentrations of residual catalyst hetero aiornsin jet fuel are the following:
Ti 0.8-1.1 ppb Al 9.6-15.9 ppb Cl 12.0-19.1 ppb
3. Based on this information, does POSF-3597 require material compatibility testing? The POC for this project is Lt Kirsten Wohlwcm) who can be reached via email at Kirsten.Wohlwcndtg'wpafb.af.mil and via telephone at 5-3190. Thank you for your help in this matter.
KIRSTEN WOHL WEND, LT. USAF AEROSPACE FUELS CHEMIST
L
Figure III. 1 -2. Request to AFRL/MLSA for Material Compatibility Review
33

2 8 JUL 2000
DEPARTMENT OF THE AIR FORCE :: AIR FORCE RESEARCH LABORATORY
WiieHT-PATTERSON AIR FORCE BASE OHIO «M33
MEMORANDUM FOR AFRL/FRSF (1LT KIRSTEN WOHLWEND)
FROM. AFRl/MLSA
SUBJECT; Request for Material Compatibility Review
1. This letter is in response to your letter requesting a material compatibility review for POSF 3597 pipeline drag reducing additive. Based upon the information that you have provided concerning the chemical composition of the additive, this additive is compatible with all aircraft fuel system materials and will not require material compatibility testing. The additive is composed primarily of Organic compounds that are known to have no adverse effect on the materials used in an aircraft fuel system. There is »small amount of metallic catalyst, which also should have no detrimental effect to any fuel system material
2. Should you need further assistance or information, I can be reached at x574S I or [email protected].
ALAN J. FLETCHER. Materials Engineer Adhesives. Composites and Elastomer.« Team Materials Integrity Brand) Systems Support Division
Attachment AFRL/PRSFLetter(nd)
Figure III. 1 -3. Response from AFRL/MLSA
34
2. ADDITIVE/ADDITIVE COMPATIBILITY
A slightly modified ASTM Standard D 4054 procedure B was completed on POSF-3597 using POSF-3219 as the base fuel. First the base fuel was clay treated. The base fuel was separated into 100 mL portions. Baker FLO XS was added to one set of the portions at 35 ppm (4 times 8.8 ppm). Corrosion Inhibitor (DCI4A), Fuel System Icing Inhibitor and a static dissipator (Stadis 450) were all added at four times their respective maximum allowable concentration to the other portions of base fuel. Each 100 mL portion of base fuel plus FLO XS was then blended with the corresponding 100 portion of base fuel plus approved additives. These resulting mixtures had 2 times the maximum recommended concentration of FLO XS and 2 times the maximum allowable concentration of the mil spec additives. The sample was then divided into two 100 mL portions. The samples were then placed in cold storage (-15.5°C / 4°F) for 24 hours. The samples were visually inspected after removal to look for indications of incompatibility (precipitation, cloudiness, darkening, separation etc). The samples were then warmed, shaken to make sure components were still mixed, and placed in an oven (75°C / 164°F) for 24 hours. The samples were removed and inspected for visual indications of incompatibility. They were then allowed to cool to room temperature and again inspected. No indications of precipitation, cloudiness, darkening or other visual evidence of incompatibility ever appeared.
35

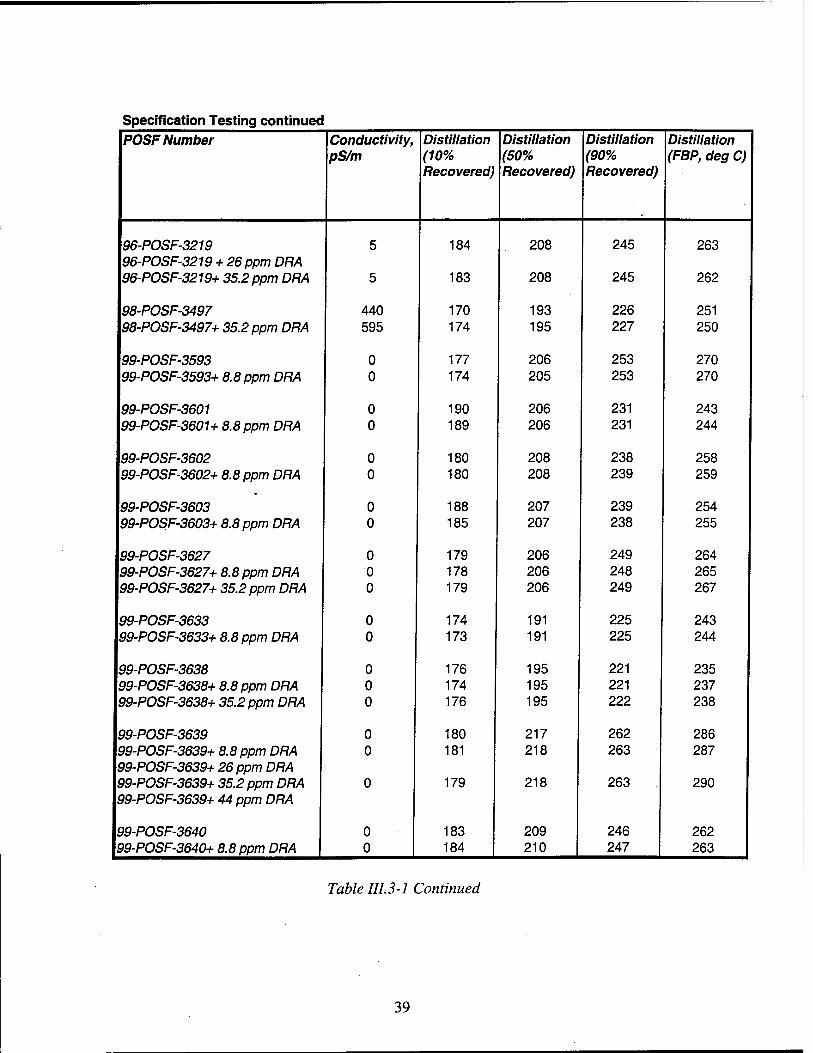
3. SPECIFICATION TESTING
Specification testing was completed on a variety of the fuels used in the screening tests. Screening tests were performed on eleven of the neat test fuels. Specification testing was completed on nine of those fuels additized with 8.8 ppm Baker FLO XS. Additional specification testing was completed on five of the fuels using a polymer concentration of 35.2 ppm. The results of those tests are shown in Table ÜI.3-1. "
The addition of Baker Flo XS did not cause any of the samples to become out of specification, even at the higher concentrations of the additive. One area of interest is existent gum. While the addition of Flo XS at 35.2 ppm did not cause the fuel to become out of specification, for four of the five fuels used for high concentration testing, there was an increase. Additional testing was completed on the two fuels with the largest difference. The increase hit a plateau at 26 ppm (3x concentration) and the plateau was confirmed at 44 ppm (5x concentration). The 2 x concentration level was not tested. Because the increase hit a plateau instead of continuing to increase as more additive was added, it is not a concern.
36
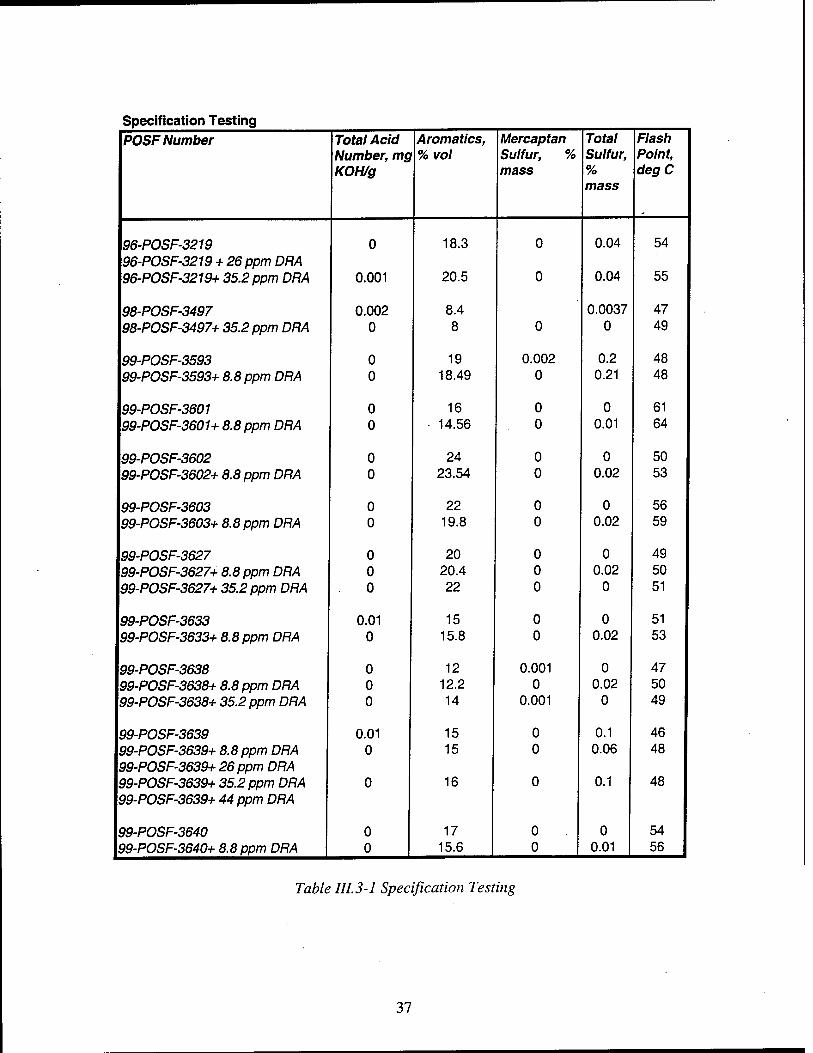
Specification Testing
POSF Number Total Acid Number, mg KOH/g
Aromatics, %vol
Mercaptan Sulfur, % mass
Total Sulfur, % mass
Flash Point, degC
96-POSF-3219 96-POSF-3219 + 26 ppm DRA 96-POSF-3219+ 35.2 ppm DRA
98-POSF-3497 98-POSF-3497+ 35.2 ppm DRA
99-POSF-3593 99-POSF-3593+ 8.8 ppm DRA
99-POSF-3601 99-POSF-3601+ 8.8 ppm DRA
99-POSF-3602 99-POSF-3602+ 8.8 ppm DRA
99-POSF-3603 99-POSF-3603+ 8.8 ppm DRA
99-POSF-3627 99-POSF-3627+ 8.8 ppm DRA 99-POSF-3627+ 35.2 ppm DRA
99-POSF-3633 99-POSF-3633+ 8.8 ppm DRA
99-POSF-3638 99-POSF-3638+ 8.8 ppm DRA 99-POSF-3638+ 35.2 ppm DRA
99-POSF-3639 99-POSF-3639+ 8.8 ppm DRA 99-POSF-3639+ 26 ppm DRA 99-POSF-3639+ 35.2 ppm DRA 99-POSF-3639+ 44 ppm DRA
99-POSF-3640 99-POSF-3640+ 8.8 ppm DRA
0
0.001
0.002 0
0 0
0 0
0 0
0 0
0 0 0
0.01 0
0 0 0
0.01 0
0 0
18.3
20.5
8.4 8
19 18.49
16 14.56
24 23.54
22 19.8
20 20.4 22
15 15.8
12 12.2 14
15 15
16
17 15.6
0
0
0
0.002 0
0 0
0 0
0 0
0 0 0
0 0
0.001 0
0.001
0 0
0 0
0.04
0.04
0.0037 0
0.2 0.21
0 0.01
0 0.02
0 0.02
0 0.02
0
0 0.02
0 0.02
0
0.1 0.06
0.1
0 0.01
54
55
47 49
48 48
61 64
50 53
56 59
49 50 51
51 53
47 50 49
46 48
48
54 56
Table 111.3-1 Specification Testing
37

Specification Testing continued POSF Number Freezing
Point, degC (Automatic)
Viscosity @ -20 deg C
Smoke Point, mm
Copper Strip Corrosion
Existent Gum, mg/100mL
Water Reaction
96-POSF-3219 96-POSF-3219 + 26 ppm DRA 96-POSF-3219+ 35.2 ppm DRA
-46
-46
5.2
5.2
21
21
1a
1a
0.8/4.6" 2.8
3.6 / 4.8 **
1
1
98-POSF-3497 98-POSF-3497+ 35.2 ppm DRA
-64 -61
4.1 4.2
25 26
1a 1b
2.6 2.4
1 1
99-POSF-3593 99-POSF-3593+ 8.8 ppm DRA
-43 -43
5.9 5.5
21 27
1a 1a
0.3 0.2
1b 1b
99-POSF-3601 99-POSF-3601+ 8.8 ppm DRA
-48 -48
5 5
24 27
1a 1a
0.1 0
1b 1b
99-POSF-3602 99-POSF-3602+ 8.8 ppm DRA
-54 -54
5.9 5.4
20 25
1a 1a
0 0
1b 1b
99-POSF-3603 99-POSF-3603+ 8.8 ppm DRA
-47 -48
5 5
19 26
1a 1a
0 0.2
1b 1b
99-POSF-3627 99-POSF-3627+ 8.8 ppm DRA 99-POSF-3627+ 35.2 ppm DRA
-50 -50 -50
6 5.6 5.3
20 20 19
1a 1a 1b
• 0 0.4 2.2
1b 1b
1
99-POSF-3633 99-POSF-3633+ 8.8 ppm DRA
-56 -55
4 23 23
1a 1a
1 0.2
1b 1b
99-POSF-3638 99-POSF-3638+ 8.8 ppm DRA 99-POSF-3638+ 35.2 ppm DRA
-53 -53 -53
4 4 4
25 24 22
1a 1a 1a
0.3 0
2.4
1b 1b 1
99-POSF-3639 99-POSF-3639+ 8.8 ppm DRA 99-POSF-3639+ 26 ppm DRA 99-POSF-3639+ 35.2 ppm DRA 99-POSF-3639+ 44 ppm DRA
-43 -43
-43
6.8 6.2
6.3
22 24
22
1a 1a
1b
0.7 0.4 5.2
5/5.2" 5.4
1b 1b
1
99-POSF-3640 99-POSF-3640+ 8.8 ppm DRA
-48 -46 |
5.4 5.9 I
20 24 |
1a 1a
0 0.2
1b 1b
shows repeated tests
Table III. 3-1 Continued
38
Specification Testing continued
POSF Number Conductivity, Distillation Distillation Distillation Distillation pS/m (10%
Recovered) (50% Recovered)
(90% Recovered)
(FBP, deg C)
96-POSF-3219 5 184 208 245 263 96-POSF-3219 + 26ppm DRA 96-POSF-3219+ 35.2 ppm DRA 5 183 208 245 262
98-POSF-3497 440 170 193 226 251 98-POSF-3497+ 35.2 ppm DRA 595 174 195 227 250
99-POSF-3593 0 177 206 253 270 99-POSF-3593+ 8.8 ppm DRA 0 174 205 253 270
99-POSF-3601 0 190 206 231 243 99-POSF-3601+ 8.8 ppm DRA 0 189 206 231 244
99-POSF-3602 0 180 208 238 258 99-POSF-3602+ 8.8 ppm DRA 0 180 208 239 259
99-POSF-3603 0 188 207 239 254 99-POSF-3603+ 8.8 ppm DRA 0 185 207 238 255
99-POSF-3627 0 179 206 249 264 99-POSF-3627+ 8.8 ppm DRA 0 178 206 248 265 99-POSF-3627+ 35.2 ppm DRA 0 179 206 249 267
99-POSF-3633 0 174 191 225 243 99-POSF-3633+ 8.8 ppm DRA 0 173 191 225 244
99-POSF-3638 0 176 195 221 235 99-POSF-3638+ 8.8 ppm DRA 0 174 195 221 237 99-POSF-3638+ 35.2 ppm DRA 0 176 195 222 238
99-POSF-3639 0 180 217 262 286 99-POSF-3639+ 8.8 ppm DRA 0 181 218 263 287 99-POSF-3639+ 26 ppm DRA 99-POSF-3639+ 35.2 ppm DRA 0 179 218 263 290 99-POSF-3639+ 44 ppm DRA
99-POSF-3640 0 183 209 246 262 99-POSF-3640+ 8.8 ppm DRA 0 184 210 247 I 263
Table 111.3-1 Continued
39

Specification Testing continued
POSF Number Distillation Distillation Lubricity Test Thermal Thermal Stability (Residue, (Loss, % vol) (BOCLE) wear Stability @ @ 260 deg C %vol) scar, mm 260 deg C
(Tube Rating Visual)
(Change in Press., mm Hg)
96-POSF-3219 1.1 1 0.55 2 1 96-POSF-3219 + 26 ppm DRA 96-POSF-3219+ 35.2 ppm DRA 1.2 1.1 0.57 1 5
98-POSF-3497 0.5 0.5 0.62 1 0 98-POSF-3497+ 35.2 ppm DRA 1.2 1.1 0.6 1 2
99-POSF-3593 1.5 1.1 0.73 2 3 99-POSF-3593+ 8.8 ppm DRA 1.5 1.4 0.74 2 2
99-POSF-3601 1.2 1.1 0.68 1 1 99-POSF-3601+ 8.8 ppm DRA 1.2 1.5 0.58 1 5
99-POSF-3602 1.2 1.2 0.69 2 3 99-POSF-3602+ 8.8 ppm DRA 1.3 0.7 0.65 1 1
99-POSF-3603 1.2 1.4 0.73 3 5 99-PÖSF-3603+ 8.8 ppm DRA 1.3 0.5 0.74 1 3
99-POSF-3627 1.3 1.4 0.64 1 1 99-POSF-3627+ 8.8 ppm DRA 1.4 0.8 1 4 99-POSF-3627+ 35.2 ppm DRA 0.9 1.1 0.69 2 4
99-POSF-3633 1 0.9 0.55 1 4 99-POSF-3633+ 8.8 ppm DRA 1.4 0.3 0.58 1 2
99-POSF-3638 1.3 1.1 0.58 1 5 99-POSF-3638+ 8.8 ppm DRA 1.2 0.8 1 0 99-POSF-3638+ 35.2 ppm DRA 1 0.9 0.58 1 3
99-POSF-3639 1.4 1.4 0.61 1 5 99-POSF-3639+ 8.8 ppm DRA 1.5 1.4 0.6 1 0 99-POSF-3639+ 26 ppm DRA 99-POSF-3639+ 35.2 ppm DRA 1.2 1.1 0.65 2 3 99-POSF-3639+ 44 ppm DRA
99-POSF-3640 1.2 1.4 0.58 1 0 99-POSF-3640+ 8.8 ppm DRA 1.2 1.6 0.6 1 2 I
Table III.3-1 Continued
40
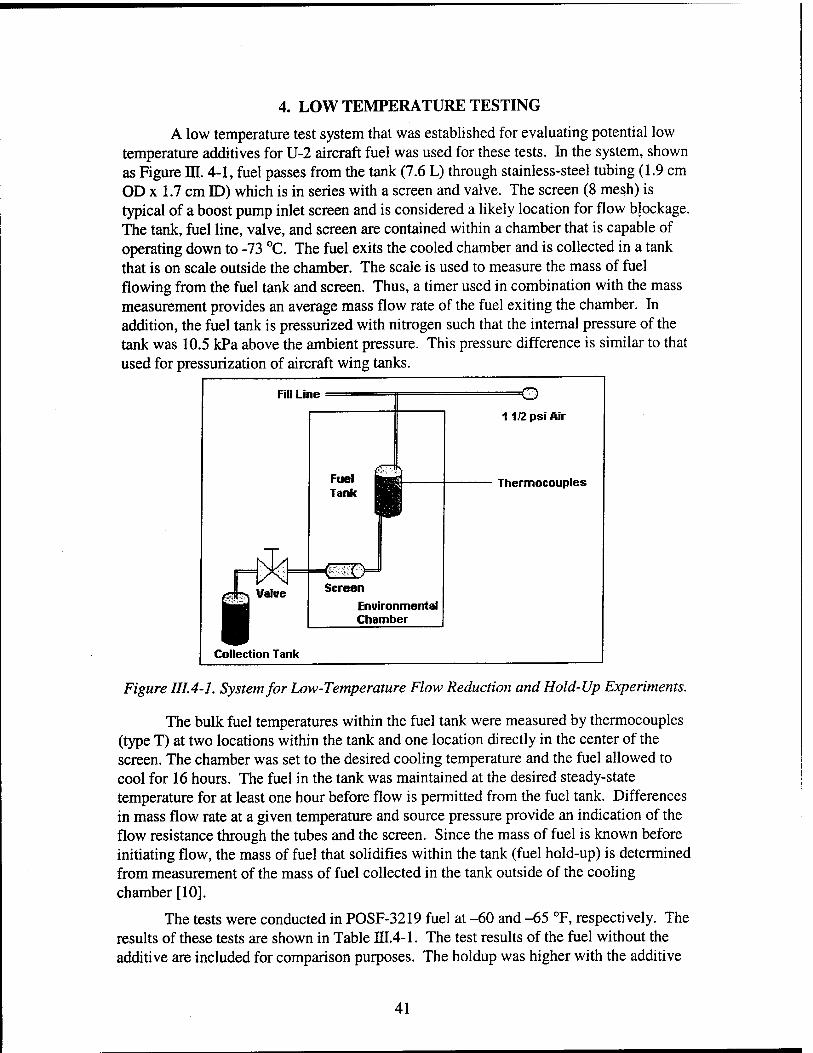
4. LOW TEMPERATURE TESTING
A low temperature test system that was established for evaluating potential low temperature additives for U-2 aircraft fuel was used for these tests. In the system, shown as Figure m. 4-1, fuel passes from the tank (7.6 L) through stainless-steel tubing (1.9 cm OD x 1.7 cm ID) which is in series with a screen and valve. The screen (8 mesh) is typical of a boost pump inlet screen and is considered a likely location for flow blockage. The tank, fuel line, valve, and screen are contained within a chamber that is capable of operating down to -73 °C. The fuel exits the cooled chamber and is collected in a tank that is on scale outside the chamber. The scale is used to measure the mass of fuel flowing from the fuel tank and screen. Thus, a timer used in combination with the mass measurement provides an average mass flow rate of the fuel exiting the chamber. In addition, the fuel tank is pressurized with nitrogen such that the internal pressure of the tank was 10.5 kPa above the ambient pressure. This pressure difference is similar to that used for pressurization of aircraft wing tanks.
Fill Line
Valve
Collection Tank
Fuel Tank
o
IH Screen
Environmental Chamber
11/2 psi Air
Thermocouples
Figure III.4-1. System for Low-Temperature Flow Reduction and Hold-Up Experiments.
The bulk fuel temperatures within the fuel tank were measured by thermocouples (type T) at two locations within the tank and one location directly in the center of the screen. The chamber was set to the desired cooling temperature and the fuel allowed to cool for 16 hours. The fuel in the tank was maintained at the desired steady-state temperature for at least one hour before flow is permitted from the fuel tank. Differences in mass flow rate at a given temperature and source pressure provide an indication of the flow resistance through the tubes and the screen. Since the mass of fuel is known before initiating flow, the mass of fuel that solidifies within the tank (fuel hold-up) is determined from measurement of the mass of fuel collected in the tank outside of the cooling chamber [10].
The tests were conducted in POSF-3219 fuel at -60 and -65 °F, respectively. The results of these tests are shown in Table HI.4-1. The test results of the fuel without the additive are included for comparison purposes. The holdup was higher with the additive
41
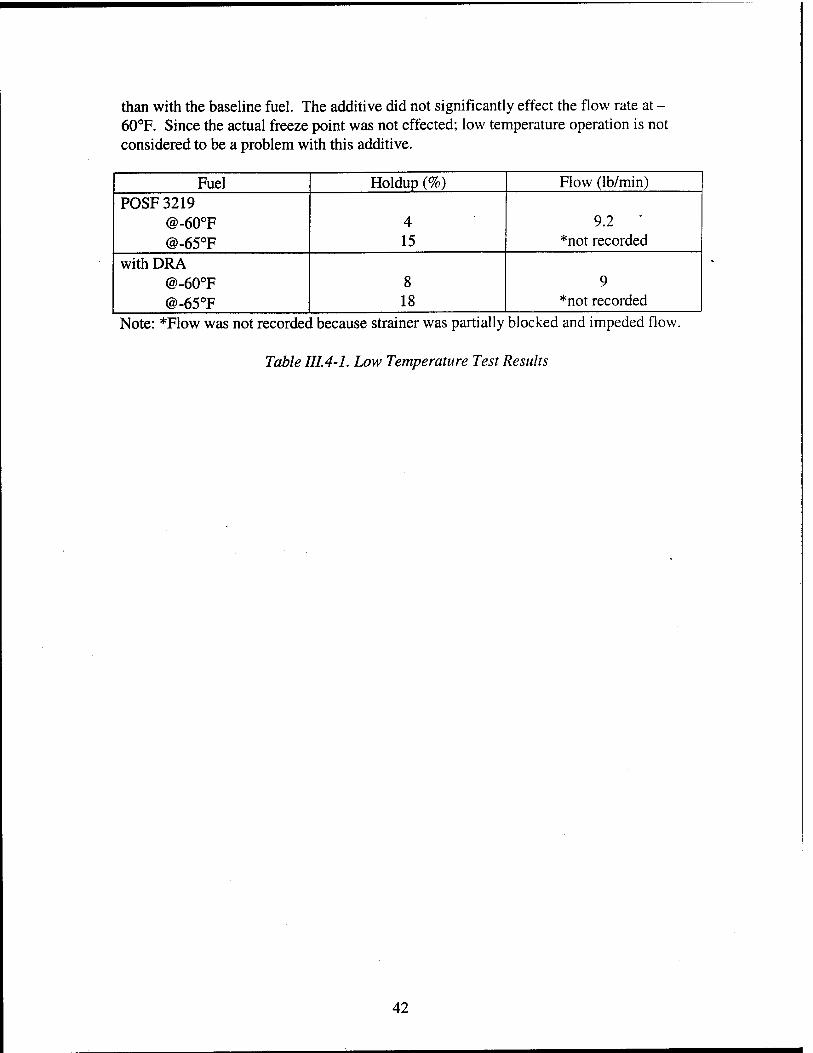
than with the baseline fuel. The additive did not significantly effect the flow rate at - 60°F. Since the actual freeze point was not effected; low temperature operation is not considered to be a problem with this additive.
Fuel Holdup (%) Flow (lb/min) POSF 3219
@-60°F @-65°F
4 15
9.2 ' *not recorded
with DRA @-60°F @-65°F
8 18
9 *not recorded
Note: *Flow was not recorded because strainer was partially blocked and impeded flow.
Table 111.4-1. Low Temperature Test Results
42

CONCLUSION
The Baker FLO XS Pipeline Drag Reducer was put through a series of tests developed over the course of the JP-8+100 program. These tests were found to be accurate in predicting the impact of an additive on the thermal stability of jet fuel.
Based on the results of testing at a polymer concentration of 8.8 ppm, the Baker FLO XS drag-reducing additive had no deleterious impact on thermal stability of jet fuel up to 325°F bulk and 450°F wetted wall temperature. When added to the +100 additive package at the same concentration, it had no deleterious impact on thermal stability up to 375°F bulk and 500°F wetted wall conditions. Based on the results of the screening tests using a wide variety of fuels, Baker FLO XS is not sensitive to fuel types or treatments.
REFERENCES
1. Matheson, M., American Petroleum Institute Survey of Member Pipelines (1997). 2. Heneghan, S.P., Zabarnick, S., Ballal, D.R., Harrison m, W.E., 1996, "JP-8+100:
The Development of High-Thermal-Stability Jet Fuel," Journal of Energy Resources Technology, Vol. 118, pp. 170-179.
3. Motier, J., letter in material compatibility section, 2000. 4. Grinstead, B., Energ. Fuels., 13, 756-760 (1999). 5. Zabarnick, S., Whitacre, S.D., J. Eng. Gas Turbines Power., 120, 519-525 (1998). 6. Pratt and Whitney Report # FR-24664, "JP-8+100 An Improved Thermally Stable JP-
8 Fuel for Current and Future Aircraft", August 1999, page 1-13, "Hot Liquid Process Simulator Measurements of the Betz 8Q462 Thermal Stability Additive Package".
7. Dieterle, G.L., Binns, K.E., 1997, "System Evaluation of JP-8+100 Additives at High Bulk Temperatures," ASME 97-GT-71, June 1997.
8. Edwards, T., 1994, "Fuel Effects in an Augmentor Fouling Simulator," AIAA 94- 2958, June 1994.
9. Jones, E.G., Balster, W.J., Post, M.E., 1995, "Degradation of a Jet A Fuel in a Single- Pass Heat Exchanger," Journal of Engineering for Gas Turbines and Power, Vol. 117, pp. 125-131.
10. J. S. Ervin, S. Zabarnick, E. Binns, G. Dieterle, D. Davis, and C. Obringer, "Effect of Jet Fuel Additives on Low-Temperature Fluidity and Tank Hold-Up," XTV International Society for Air Breathing Engines, Florence, Italy, September 1999.
43

LIST OF SYMBOLS, ABBREVIATIONS AND ACRONYMS
API ARSFSS BFA DRA EDTST FCOC FDV HLPS ICOT JFTOT NIFTR QCM
American Petroleum Institute Advanced Reduced Scale Fuel System Simulator Burner Feed Arm Drag Reducing Additive, same as Pipeline Drag Reducer (PDR) Extended Duration Thermal Stability Test Fuel Cooled Oil Cooler Flow Divider Valve Hot Liquid Process Simulator Isothermal Corrosion/Oxidation Test Jet Fuel Thermal Oxidative Tester Near Isothermal Flowing Test Rig Quartz Crystal Microbalance
44