Novel Methods for Predicting Photometric Redshifts … (Way).pdfNovel Methods for Predicting...
31
Novel Methods for Predicting Photometric Redshifts from Broad Band Photometry using Virtual Sensors M. J. Way NASA Ames Research Center, Space Sciences Division, MS 245-6, Moffett Field, CA 94035, USA A. N. Srivastava NASA Ames Research Center, Intelligent Systems Division, MS 269-4, Moffett Field, CA 94035, USA ABSTRACT We calculate photometric redshifts from the Sloan Digital Sky Survey Main Galaxy Sample, The Galaxy Evolution Explorer All Sky Survey, and The Two Micron All Sky Survey using two new training-set methods. We utilize the broad band photometry from the three surveys alongside Sloan Digital Sky Survey measures of photometric quality and galaxy morphology. Our first training-set method draws from the theory of ensemble learning while the second employs Gaussian process regression both of which allow for the estimation of redshift along with a measure of uncertainty in the estimation. The Gaussian process models the data very effectively with small training samples of approximately 1000 points or less. These two methods are compared to a well known Artificial Neural Network training-set method and to simple linear and quadratic regres- sion. We also demonstrate the need to provide confidence bands on the error estimation made by both classes of models. Our results indicate that variations due to the optimization procedure used for almost all neural networks, combined with the variations due to the data sample, can produce models with variations in accuracy that span an order of magnitude. A key contribution of this paper is to quantify the variability in the quality of results as a function of model and training sample. We show how simply choosing the “best” model given a data set and model class can produce misleading results. We also investigate supplemen- tal information provided by the Sloan Digital Sky Survey photometric pipeline related to photometric quality and galaxy morphology tracers. We show that, using these additional quality and morphology indicators rather than only the Sloan Digital Sky Survey broad band u,g,r,i,z imaging data commonly used, one can improve redshift accuracy by 10s of percent. Near Infrared j,h,k broad band
-
Upload
nguyenhanh -
Category
Documents
-
view
221 -
download
4
Transcript of Novel Methods for Predicting Photometric Redshifts … (Way).pdfNovel Methods for Predicting...

Novel Methods for Predicting Photometric Redshifts from Broad
Band Photometry using Virtual Sensors
M. J. Way
NASA Ames Research Center, Space Sciences Division, MS 245-6, Moffett Field, CA
94035, USA
A. N. Srivastava
NASA Ames Research Center, Intelligent Systems Division, MS 269-4, Moffett Field, CA
94035, USA
ABSTRACT
We calculate photometric redshifts from the Sloan Digital Sky Survey Main
Galaxy Sample, The Galaxy Evolution Explorer All Sky Survey, and The Two
Micron All Sky Survey using two new training-set methods. We utilize the broad
band photometry from the three surveys alongside Sloan Digital Sky Survey
measures of photometric quality and galaxy morphology. Our first training-set
method draws from the theory of ensemble learning while the second employs
Gaussian process regression both of which allow for the estimation of redshift
along with a measure of uncertainty in the estimation. The Gaussian process
models the data very effectively with small training samples of approximately
1000 points or less. These two methods are compared to a well known Artificial
Neural Network training-set method and to simple linear and quadratic regres-
sion. We also demonstrate the need to provide confidence bands on the error
estimation made by both classes of models. Our results indicate that variations
due to the optimization procedure used for almost all neural networks, combined
with the variations due to the data sample, can produce models with variations
in accuracy that span an order of magnitude. A key contribution of this paper
is to quantify the variability in the quality of results as a function of model and
training sample. We show how simply choosing the “best” model given a data set
and model class can produce misleading results. We also investigate supplemen-
tal information provided by the Sloan Digital Sky Survey photometric pipeline
related to photometric quality and galaxy morphology tracers. We show that,
using these additional quality and morphology indicators rather than only the
Sloan Digital Sky Survey broad band u,g,r,i,z imaging data commonly used, one
can improve redshift accuracy by 10s of percent. Near Infrared j,h,k broad band

– 2 –
photometry provided from the Two Micron All Sky Survey and near-ultraviolet
and far-ultraviolet broadband data from The Galaxy Evolution Explorer All Sky
Survey are also investigated where they overlap with the Sloan Digital Sky Survey.
Our results show that robust photometric redshift errors as low as 0.02 rms can
regularly be obtained. We believe these can be expanded to other photometric
surveys where sufficient redshift calibration objects exist.
Subject headings: Photometric Redshifts, Sloan Digital Sky Survey, Galaxy Evo-
lution Explorer All Sky Survey, Two Micron All Sky Survey
1. Introduction
Using broad-band photometry in multiple filters to estimate redshifts of galaxies was
likely first attempted by Baum (1962) on 25 galaxies in nine broad-band imaging filters in the
Visible and Near Infrared range. Then as now given the low throughput of spectrographs
much is to be gained by attempting to estimate galaxy redshifts from broad-band colors
rather than measurement of individual spectra. In the Sloan Digital Sky Survey (SDSS,
York et al. 2000) 100 million galaxies will have accurate broad-band ugriz photometry, but
only 1 million galaxy redshifts from this sample will be measured. If a method can be found
to obtain an accurate estimate of the redshift for the larger SDSS photometric catalog,
rather than the smaller spectroscopic one, much better constraints on the formation and
evolution of large scale structural elements such as galaxy clusters, filaments, and walls can
be obtained.
Two approaches, Spectral Energy Distribution fitting (SED fitting) and the training-set
method (TS method), have been used to obtain “photometric redshifts” over the past 30
years. In order to use either method galaxies with a similar range in magnitude and color
over the same possible redshift range must be used to estimate the redshifts from the broad-
band colors measured. SED fitting has historically been the preferred method (e.g. Koo
1985; Loh & Spillar 1986; Lanzetta et al. 1996; Kodama et al. 1999; Benıtez 2000). given the
typical low numbers of galaxies with spectroscopically confirmed redshifts in photometric
surveys of the universe.
There are many approaches to SED fitting. For example, Kodama et al. (1999) uses four
filter (BVRI) photometry and a Bayesian classifier using SED fitting which they have tested
out to z=1 and claim is valid beyond this redshift. The approach of Benıtez (2000) makes
use of additional information such as the shape of the redshift distributions and fractions
of different galaxy types. This may be helpful in instances where one has a limited sample

– 3 –
size at large redshifts, but it may also bias an estimator by making assumptions which one
cannot verify statistically.
TS methods rely on having a large enough sample of spectroscopic redshifts to represent
the magnitudes and colors of the broad-band photometric sample. Hence these methods
have been restricted to relatively nearby z<1 surveys such as the SDSS rather than much
deeper surveys like the Hubble Deep Field (Williams et al. 1996) which have a paucity of
measured galaxy redshifts at such extreme distances. In fact, for redshifts above 1 there are
typically not enough measured galaxy redshifts to use TS methods with any accuracy, hence
SED fitting has been used exclusively for z>1. See Benıtez (2000) for an excellent detailed
discussion of the differences and similarities between these two commonly used approaches.
In the past 10 years a large number of empirical fitting techniques for TS methods have
come into use and new techniques continue to be developed. Some examples of linear and
non-linear methods include: 2nd and 3rd order polynomial fitting (Brunner et al. 1997);
quadratic polynomial fitting (Connolly et al. 1995; Hsieh et al. 2005); Support Vector Ma-
chines (Wadadekar 2005); and the Artificial Neural Network method of Collister & Lahav
(2004).
We explore the problem of estimating redshifts from broad band photometric measure-
ments using the idea of a Virtual Sensor (Srivastava 2005; Srivastava & Stroeve 2003). These
methods allow for the estimation of unmeasured spectral phenomena based on learning the
potentially nonlinear correlations between observed sets of spectral measurements. In the
case of estimating redshifts, we can learn the nonlinear correlation between spectroscopically
measured redshifts and broad band colors. Statistically speaking, this amounts to building
a regression model to estimate the “photometric redshift”. However, the procedure is much
more complex that a simple regression, thus requiring significant effort in model building
and validation. The concept of Virtual Sensors applies to the entire chain of analytical steps
leading up to the prediction of the redshift. Figure 1 shows a schematic of the assump-
tions behind a Virtual Sensor next to a real-world case with The Galaxy Evolution Explorer
(GALEX, Martin et al. 2005)1 plus SDSS bandpasses and a sample galaxy spectrum.
As a baseline comparison results from a TS based Neural Network package called ANNz
(Collister & Lahav 2004) are presented and linear and quadratic fits along the lines discussed
in Connolly et al. (1995). However, bootstrap resampling Efron (1979); Efron & Tibshirani
(1993) is applied to the linear and quadratic fits and to the ANNz fits unlike all other previous
work.
1http://www.galex.caltech.edu/

– 4 –
We apply the TS methods discussed above to the SDSS five color (ugriz) imaging survey
known as the Main Galaxy Sample (MGS, Strauss et al. 2002) which has a large calibration
set of spectroscopic redshifts for the SDSS Data Release 2 (DR2, Abazajian et al. 2004)
and SDSS Data Release 3 (DR3, Abazajian et al. 2005). As well, The Two Micron All Sky
Survey2 extended source catalog along with GALEX are also used in conjunction with the
SDSS where all three overlap to create a combined catalog for use with our TS methods.
The datasets used in our analysis are discussed in § 2, discussion of the photometry and
spectroscopic quality of the datasets along with other photometric pipeline output properties
of interest in § 3, the classification schemes used to obtain photometric redshifts in § 4,
comparison of the results in § 5, and we summarize in § 6.
2. The Sloan Digital Sky Survey, The Two Micron All Sky Survey and The
Galaxy Evolution Explorer Datasets
Most of the work herein is related to the SDSS MGS DR2 and DR3, and the photomet-
ric quantities associated with them. For completeness we have added the 2MASS extended
source catalog and GALEX All Sky Survey photometric attributes where data exists for the
same SDSS MGS galaxies with corresponding redshifts. The 2MASS and GALEX data sam-
ples are small where they overlap with those of the SDSS MGS galaxies with corresponding
known spectroscopic redshifts in the DR2 and DR3. However, they appear copious enough
for TS methods as there is no evidence of overfitting of these smaller data samples.
The Sloan Digital Sky Survey (York et al. 2000) will eventually encompass roughly 1/4
of the entire sky collecting five band photometric data in 7700 deg2 down to 23rd magnitude
in r on of order 108 celestial objects. For about 1 in every 100 of these objects down to g∼20
a spectrum will be measured coming to a total of about 106 galaxy and quasar redshifts
over roughly the same area of the sky (7000 deg2) as the photometric survey (Stoughton
et al. 2002). The Five broad band filters used, u,g,r,i and z, cover the optical range of the
spectrum (Table 1).
We use several catalogs derived from the SDSS. The MGS (Strauss et al. 2002) of the
SDSS is a magnitude limited survey that targets all galaxies down to rPetrosian<17.77. We
use the MGS from DR2 and DR3 where spectroscopic redshifts exist in order to validate our
methods.
The 2MASS extended source catalog contains positions and magnitudes in j, h, and ks
2http://www.ipac.caltech.edu/2mass/

– 5 –
filters for 1,647,599 galaxies and other nebulae across the entire sky (Table 1). The extended
source magnitude limits in the 3 filters are j=15.0, h=14.3 and ks=13.5. See Jarrett et al.
(2000) for more detailed information on the extended source catalog.
The GALEX data release 1 (GR1)3 All-Sky photometry catalog contains positions and
magnitudes in two Ultraviolet bands called the Far Ultraviolet band (fuv) and the Near
Ultraviolet band (nuv). See Table 1 for details on these broad band pass filters. Limiting
magnitudes for the All-Sky (100 second integrations) fuv is 19.9 and 20.8 for the nuv. See
Morrissey et al. (2005) and references therein for more details of the in-orbit instrument
performance and Martin et al. (2005) for mission details. The All-Sky GR1 covers 2792 deg2
of the sky.
3. Photometric and redshift quality, morphological indicators and other
catalog properties
Historically most determinations of photometric redshifts from large photometric sur-
veys contain only broad band magnitudes without reference to other parameters that may
have been available from the photometric aperture reductions themselves. With the SDSS
most papers have utilized only the five band photometry (ugriz) while a host of additional
parameters like Petrosian radii (Strauss et al. 2002), measures of ellipticity (Stoughton et
al. 2002), and other derived quantities are readily available from the photometric pipeline
reductions.
This section explores the the most likely candidates to yield information related to the
prediction of redshifts in the Main Galaxy Sample (MGS) of the SDSS for our TS calculations.
This section will also explain the various quality flags used to obtain data from the SDSS
photometric and redshift catalogs, the photometric catalogs of the 2MASS extended source
catalog and the GALEX All Sky survey.
3.1. The SDSS photometric quality flags
The SDSS photometric pipeline (Lupton et al. 2001) produces a host of quality flags
(Stoughton et al. 2002, Table 9) giving additional information on how the photometry was
estimated. The primtarget flag was used to make sure the Main Galaxy Sample was chosen
and extinction corrected model magnitudes (Stoughton et al. 2002) were used throughout
3http://galex.stsci.edu/GR1/

– 6 –
this work (See query in Appendix I).
Herein we define GOOD and GREAT photometry as (see Table 2 for a description)
where ! means NOT:
GOOD: !BRIGHT and !BLENDED and !SATURATED
GREAT: GOOD and !CHILD and !COSMICRAY and !INTERP
In this manner one can determine if a difference in the quality of the photometry makes
any difference in the errors of the estimated photometric redshifts. The only reason not to
always use the very best photometry (what we call GREAT in this work) is that the total
number of galaxies can drop by orders of magnitude and hence one may end up sampling a
much smaller number of objects. However, not everyones needs are the same and hence the
quality can be weighted based on what is desirable. See Appendix I for the complete SDSS
skyserver4 queries used to obtain the data used in this paper.
3.2. The SDSS redshift quality flags
The SDSS spectroscopic survey (Stoughton et al. 2002; Newman et al. 2005) has several
flags to warn the user of poor quality redshifts that come from the spectroscopic pipeline
reductions (Stoughton et al. 2002). This is important because an inaccurate training-set will
result in poor results no matter which method is used. To this end we utilized an estimate
of the confidence of the spectroscopic redshift called zConf. Hence only those galaxies with
zConf>0.95 in the MGS were chosen. Other authors (e.g. Wadadekar 2005) have chosen to
use only the zWarning flag set to zero. Our studies found zConf values far below that of
0.95 when only the zWarning=0 flag was set. This may put into question the reliability of
such redshift estimates. In addition, by setting zConf to values greater than 0.95, as we have
done, the zWarning=0 flag is also included.
3.3. 2MASS photometric quality and cross-reference with the SDSS
Given the high quality constraints of the published photometry of the 2MASS extended
source public release catalog (Jarrett et al. 2000), only one quality flag was checked. The
extended source catalog confusion flag, “cc flg”, was required to be zero in all three band
passes in order to make sure all non-extended sources were eliminated from the final catalog.
4http://casjobs.sdss.org

– 7 –
Table 1: Survey filters and characteristics
Bandpass survey λeff ∆λ FWHM 1
(A) (A) (′′)FUV GALEX 1528 442 4.5
NUV GALEX 2271 1060 6.0
u SDSS 3551 600 1-2
g SDSS 4686 1400 1-2
r SDSS 6165 1400 1-2
i SDSS 7481 1500 1-2
z SDSS 8931 1200 1-2
j 2MASS 12500 1620 2-3
h 2MASS 16500 2510 2-3
k 2MASS 21700 2620 2-3
1Dependent upon seeing at time of observation for ground based data.
Table 2: Photometric Quality Flags used in this paper 1
Name bitmask Description
BRIGHT 0x00002 Object detected in first bright object finding step; generally brighter than r=17.5
BLENDED 0x00008 Object had multiple peaks detected within it
SATURATED 0x40000 Object contains one or more saturated pixels
CHILD 0x00010 Object product of attempt to deblend BLENDED object
COSMICRAY 0x01000 Contains pixel interpreted to be part of a cosmic ray
INTERP 0x20000 Object contains pixel(s) values determined by interpolation
1Stoughton et al. (2002)

– 8 –
The j m k20fe, h m k20fe, and k m k20fe isophotal fiducial elliptical aperture magni-
tudes were extracted for the respective j, h, and k 2MASS magnitudes used in this work.
The extended source catalog was loaded into our local SQL database containing the
SDSS DR2 to create a combined catalog (see next section).
3.4. GALEX photometric quality and cross-reference with the SDSS
Near-UV (nuv) and far-UV (fuv) broadband photometry was extracted from the GALEX
database for our use. Several quality flags were used to make sure the data were of the highest
quality. Bad photometry values in Near-UV photometry (nuv mag) and Far-UV photometry
(fuv mag) are given the value of -99 in the GR1 database and these were excluded from our
catalog if either or both filters contained such a value. The nuv artifact=0 flag was set to
avoid all objects with known bad photometry artifacts. Hence if nuv artifact has any value
other than zero the nuv mag was considered bad. Currently fuv artifact is always zero in the
GR1. The band=3 flag was used since it indicates detection in both nuv fuv bands. Finally,
fov radius<0.55 is the minimum recommended value to make sure the distance of the object
in degrees from the center of the field of view of the telescope was not too large, as this is
known to cause problems in the quality of the photometry obtained.
As with the 2MASS extended source catalog the GALEX All Sky data was loaded into
our local SQL database now containing the SDSS DR2 and 2MASS catalogs. The SDSS
MGS with redshifts and the 2MASS extended source catalogs were cross-referenced with
GALEX when all three catalog positions agreed to within 5′′. The methods and results
used were comparable to those of Seibert et al. (2005) hence we do not go further into a
description of the combined catalog. See Appendix I for a sample query.
3.5. SDSS Petrosian Radii, Inverse Concentration Index, FracDev, and Stokes
The photometry properties discussed below are available in all five SDSS bandpasses
(ugriz), but we used the r bandpass values for these quantities as in general it had the lowest
errors and gave more consistent results. This is also reasonable given the low redshifts used,
but this strategy would be questionable at higher redshifts when morphological features in
the rest frame r band starts to get more strongly shifted to the i and z bands.
It has been shown that using Petrosian (1976) 50% and 90% flux radii (Wadadekar
2005) in addition to the SDSS five band photometry one can improve results by as much as
15% (see Table 3). The Petrosian 50% (90%) radius is the radius where 50% (90%) of the
– 9 –
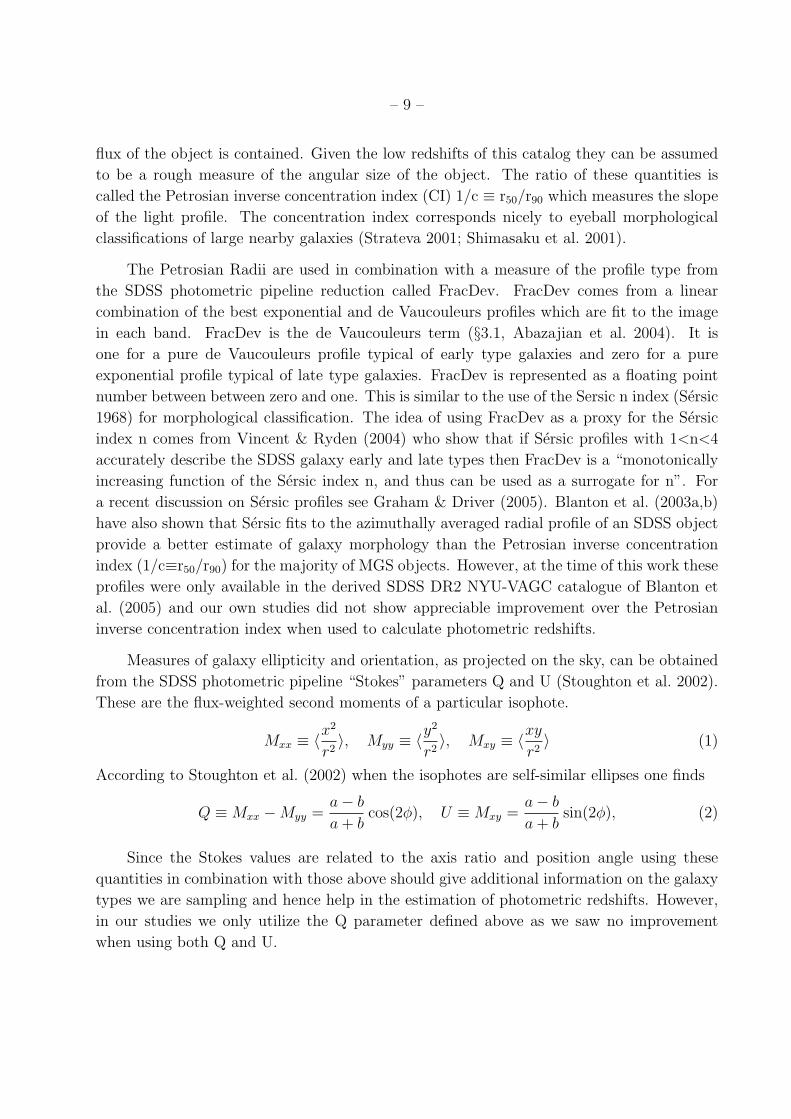
flux of the object is contained. Given the low redshifts of this catalog they can be assumed
to be a rough measure of the angular size of the object. The ratio of these quantities is
called the Petrosian inverse concentration index (CI) 1/c ≡ r50/r90 which measures the slope
of the light profile. The concentration index corresponds nicely to eyeball morphological
classifications of large nearby galaxies (Strateva 2001; Shimasaku et al. 2001).
The Petrosian Radii are used in combination with a measure of the profile type from
the SDSS photometric pipeline reduction called FracDev. FracDev comes from a linear
combination of the best exponential and de Vaucouleurs profiles which are fit to the image
in each band. FracDev is the de Vaucouleurs term (§3.1, Abazajian et al. 2004). It is
one for a pure de Vaucouleurs profile typical of early type galaxies and zero for a pure
exponential profile typical of late type galaxies. FracDev is represented as a floating point
number between between zero and one. This is similar to the use of the Sersic n index (Sersic
1968) for morphological classification. The idea of using FracDev as a proxy for the Sersic
index n comes from Vincent & Ryden (2004) who show that if Sersic profiles with 1<n<4
accurately describe the SDSS galaxy early and late types then FracDev is a “monotonically
increasing function of the Sersic index n, and thus can be used as a surrogate for n”. For
a recent discussion on Sersic profiles see Graham & Driver (2005). Blanton et al. (2003a,b)
have also shown that Sersic fits to the azimuthally averaged radial profile of an SDSS object
provide a better estimate of galaxy morphology than the Petrosian inverse concentration
index (1/c≡r50/r90) for the majority of MGS objects. However, at the time of this work these
profiles were only available in the derived SDSS DR2 NYU-VAGC catalogue of Blanton et
al. (2005) and our own studies did not show appreciable improvement over the Petrosian
inverse concentration index when used to calculate photometric redshifts.
Measures of galaxy ellipticity and orientation, as projected on the sky, can be obtained
from the SDSS photometric pipeline “Stokes” parameters Q and U (Stoughton et al. 2002).
These are the flux-weighted second moments of a particular isophote.
Mxx ≡ 〈x2
r2〉, Myy ≡ 〈y
2
r2〉, Mxy ≡ 〈xy
r2〉 (1)
According to Stoughton et al. (2002) when the isophotes are self-similar ellipses one finds
Q ≡ Mxx −Myy =a− b
a + bcos(2φ), U ≡ Mxy =
a− b
a + bsin(2φ), (2)
Since the Stokes values are related to the axis ratio and position angle using these
quantities in combination with those above should give additional information on the galaxy
types we are sampling and hence help in the estimation of photometric redshifts. However,
in our studies we only utilize the Q parameter defined above as we saw no improvement
when using both Q and U.

– 10 –
3.6. Description of the four dataset types used
Four classes of datasets are used in our analysis, based on the descriptions above.
Dataset 1: SDSS MGS GOOD quality photometry. All of the data comes from the SDSS
MGS with the GOOD quality flags set. There are 6 subsets in this dataset as seen in Figure 3.
1. u-g-r-i-z: contains only the SDSS five band extinction corrected magnitudes
2. u-g-r-i-z-petro50-petro90: contains the u-g-r-i-z data and the Petrosian 50% and 90%
radii.
3. u-g-r-i-z-petro50-petro90-ci: contains the u-g-r-i-z-petro50-petro90 data and the Pet-
rosian concentration index as described in the previous section.
4. u-g-r-i-z-petro50-petro90-ci-qr: contains the u-g-r-i-z-petro50-petro90-ci and the Stokes
Q parameter as described in the previous section.
5. u-g-r-i-z-petro50-petro90-fracdev: contains the u-g-r-i-z-petro50-petro90 and the FracDev
parameter as described in the previous section.
6. u-g-r-i-z-petro50-petro90-qr-fracdev: contains the u-g-r-i-z-petro50-petro90-fracdev and
the Stokes Q parameter as described in the previous section.
The total dataset consists of 202,297 galaxies.
Dataset 2: SDSS MGS GREAT quality photometry. All of the data, as seen in Figure 4,
comes from the SDSS MGS with the GREAT quality flags set. There are 6 subsets named
and described in the same way as for Dataset 1. The total dataset consists of 33,328 galaxies.
Dataset 3: GALEX GR1, SDSS MGS GOOD quality photometry, and the 2MASS extended
source catalogs labeled as nuv-fuv-ugriz-jhk. As seen in the left hand side of Figure 5, it
consists of the two Ultraviolet magnitudes from the GALEX GR1 database (nuv and fuv). It
has the five SDSS MGS extinction corrected magnitudes (u,g,r,i,z) with the GOOD quality
photometry flags set, but unlike Datasets 1 and 2 there are no other SDSS inputs used.
It also contains the three 2MASS extended source catalog magnitudes (j,h,k). The total
dataset consists of 3095 galaxies.
Dataset 4: GALEX GR1, SDSS MGS GREAT quality photometry, and the 2MASS extended
source catalogs. As shown on the right hand side of Figure 5 it is nearly the same as Dataset
3, except the SDSS MGS GREAT quality photometry flags are set. The total dataset consists
of 326 galaxies.

– 11 –
4. Training Methods
We estimated the photometric redshifts of the galaxies in the SDSS, 2MASS and GALEX
databases using several classes of algorithms: simple linear and quadratic fits, neural net-
works and Gaussian processes. These methods have different properties and make different
assumptions about the underlying data generating process which will be discussed below.
The Linear and Quadratic fits, ANNz, and E-Model methods below use 89% of the
entire dataset for training, 1% for validation, and 10% for testing. In order to put proper
confidence intervals on the error estimates from these methods bootstrap resampling Efron
(1979); Efron & Tibshirani (1993) was utilized on the training data. 90% of the training
data was used for each of 100 bootstraps.
For the Gaussian Processes the situation is different. Here 0.333% of the entire dataset
was used for training, 19.666% for validation and 80% for testing. Again 90% of the training
data was used for bootstrap resampling. The smaller training set is due to the fact that the
Gaussian Process calculation is of order N3 and hence small training sets were required to
complete this project in a reasonable time frame.
We report robust 90% confidence intervals around our 50% result for all of these methods
from the bootstrap resampling.
4.1. Linear and Quadratic fits
Linear and quadratic polynomial fitting along the lines of (Connolly et al. 1995; Hsieh
et al. 2005) were used as a way to benchmark the new methods discussed below. The linear
regression for the SDSS ugriz magnitudes would be given by an equation of the form:
Z = A + Bu + Cg + Dr + Ei + Fz (3)
Where A, B, C, D, E, and F result from the fit. All datapoints are weighted equally. Z
is the photometric redshift.
The quadratic form is similar and again all points are weighted equally.
Z = A+Bu+Cg+Dr+Ei+Fz+Guu+Hgg+Irr+Jii+Kzz+Lug+Mur+Nui+Ouz+Pgr+Qgi+Rgz+Sri+Trz+Uiz (4)

– 12 –
0 0.5 1 1.5 2 2.5 3 3.5 4 4.5 50
2
4
6
8
10
12
Wavelength (B1 and B
2)
Pow
er, Z
(B)
Spectral measurements from Sensor S2 (dotted lines)
Sensor measurements from Sensor S1 (solid lines)
We would like to estimatethe output of Sensor S1 for this wavelength.
3000 4000 5000 6000 7000 8000 9000 10000 110000
0.1
0.2
0.3
0.4
0.5u g r i z
Wavelength(Angstroms)
Rel
ativ
e In
tens
ity
Fig. 1.— The left figure is a cartoon to help illustrate the need for a Virtual Sensor. We have
spectral measurements from two sensors S1 and S2, (solid and dot-dashed lines, respectively).
We wish to estimate the output of sensor S1 for a wavelength where there is no actual
measurement from the sensor. Note that some sensor measurements overlap perfectly, as
in the case of wavelength = 3, and in other cases, such as wavelength = 1, there is some
overlap in the measurements. The right figure shows the sensitivity through an airmass of
1.3 for extended sources in the five SDSS (u,g,r,i,z) filter bandpasses with the spectrum of
NGC5102 (Storchi-Bergmann et al. 1995) purposely redshifted 1000A overlayed.
4.2. The Artificial Neural Networks approach
The Artificial Neural Network (ANNz) approach of (Collister & Lahav 2004) is specifi-
cally designed to calculate photometric redshifts from any galaxy properties the user deems
desirable. It has been demonstrated to work remarkably well on the SDSS DR1 (Collister
& Lahav 2004). The ANNz package contains code to run back-propagation neural networks
with arbitrary numbers of hidden units, layers and transfer functions. We chose 2 hidden
units, and 10 nodes in each of these units (see Figure 2).
4.3. Neural Networks
Back-propagation neural networks have been used extensively in a variety of applications
since their inception. A good summary of the methods we use can be found in Bishop (1995).
Neural networks are a form of nonlinear regression in which a mapping, defined as a linear
combination of nonlinear functions of the inputs, are used to approximate a desired target
value. The weights of the linear combination are usually set using an approach based on
gradient descent of a cost function that is defined between the target value and the estimated

– 13 –
value. The cost function usually has multiple local minima, and the model obtained at the
end of a training cycle usually corresponds to one such minima and not to a global minimum.
The global minimum would correspond to the model that best approximates the training set.
Generalization of the model on a test set (i.e. data that is not used during the model building
phase) can be shown to be poor if a global minimum is reached due to the phenomenon of
overfitting.
The following material is a standard demonstration that although the neural network
computes a nonlinear function of the inputs, distribution of errors follows a Gaussian if the
squared error cost function is minimized. The cost function encodes an underlying model of
the distribution of errors. For example, suppose we are given a data set of inputs X , targets
Y , and a model parameterized by Θ. The standard method of obtaining the parameter Θ
is by maximizing the likelihood of observing the data D = (X ,Y) with the model Θ. Thus,
we need to maximize:
P (Θ|D) =P (D|Θ)P (Θ)
P (D)
∝ P (D|Θ)P (Θ)
and we note that P (D|Θ) = P (X ,Y|Θ) and so:
P (X ,Y|Θ) = P (Y|X , Θ)P (X|Θ) (5)
The function P (Θ) represents the prior distribution over model parameters. If we have
knowledge about the ways in which the weights of the model are distributed before the data
arrives, such information can be encoded in the prior. Neal (1996) has shown that in the
limit of an infinitely large network, certain simple assumptions on the distribution of the
initial weights make a neural network converge to a Gaussian process. If we assume that
the errors are normally distributed, we can write the likelihood of an input pattern xi ∈ Xhaving target yi ∈ Y with variance σ2 as 5:
L(yi|xi, Θ) = P (yi|xi, Θ)
=1√2πσ
exp−(yi − yi)2
2σ2
The product of these likelihoods across the N data points in the data set D is the likelihood
of the entire data set:
P (Y|X , Θ) =N∏
i=1
P (yi|xi, Θ)
5We follow the convention that bold-faced notation indicates vectors and non-bold faced symbols indicatescalars

– 14 –
=N∏
i=1
1√2πσ
exp−(yi − yi)2
2σ2(6)
From this equation, it is straightforward to see that maximizing the log of this likelihood
function is equivalent to minimizing the squared error, which is the standard cost function
for feed-forward neural networks used in regression problems.
Neural networks are often depicted as a directed graph consisting of nodes and arcs as
shown in Figure 2. For a p dimensional input x the value at the k hidden nodes z is the
k × 1 vector:
z = s(W1x + b1) (7)
and the final estimate of the target y is given by y:
y = W2z + b2
= f(x, Θ) (8)
where W1 is a k × p matrix, b1 is a p × 1 vector, W2 is a k × l matrix and b2 is an l × 1
vector. In the case where the network only generates one output per input pattern as is the
case in the studies presented here, l = 1.
The function s is a nonlinear function and is chosen as a sigmoid:
s(a) ≡ 1
1 + exp(−a). (9)
Neural networks are trained to fit data by maximizing the likelihood of the data given
the parameters. The model obtained through this maximization process corresponds to a
single model sampled from the space of models parameterized by the model parameters
Θ. If we assume Gaussian errors, we have shown that the cost function is the well-known
sum-squared error criterion. The network is trained by performing gradient descent in the
parameter space Θ. The derivative of this cost function with respect to each weight in the
network is calculated and the weights are adjusted to reduce the error. Because the cost
function is non-convex, the optimization problem gets caught in local minima, thus making
training and model optimization difficult. In order to reduce the effects of local minima, we
performed bagging or Bootstrap AGgregation Breiman (1996). In this procedure, we sample
the data set D M times with replacement. For each sample, we build one neural network
in the ensemble of M neural networks. The final prediction is formed by taking the mean
prediction of all M neural networks:
y =1
M
M∑i=1
yi (10)

– 15 –
hiddenunits
x1
x2
x3
x4
z1
z2
z3
4z
y
y2
y3
1
inputs outputs
Fig. 2.— A graphical depiction of a neural network with 4 inputs 4 hidden units and 3
outputs. The outputs are nonlinear functions of the inputs.
Breiman (1996) showed that this procedure results in a regression model with lower error.
Our results, which we term our “Ensemble Model” (see Table 4 and 5) show the effects of
the local minima and the distribution of errors that result from this problem on the SDSS,
2MASS and GALEX data sets.
4.4. Kernel Methods and Gaussian Processes
In many ways, neural networks are attractive models for nonlinear regression problems
because they can scale to large data sets, and provide a good baseline from which to compare
other methods. In the machine learning literature, kernel methods have in many ways
subsumed neural networks because it was shown that as the number of hidden units increases,
if we assume that the weights and biases of the neural network are drawn from a Gaussian
distribution (thus assuming that P (Θ) is Gaussian), the prior distribution over functions
implied by such weights and biases converges to a Gaussian process (Neal 1996; Cristianini
& Shawe-Taylor 2000).
To describe a Gaussian process, we first note that in the case of a neural network, y
was defined as a specific nonlinear function of x, parametrized by Θ, y = f(x, Θ). In a
Gaussian process, we actually define a prior distribution over the space of functions f which
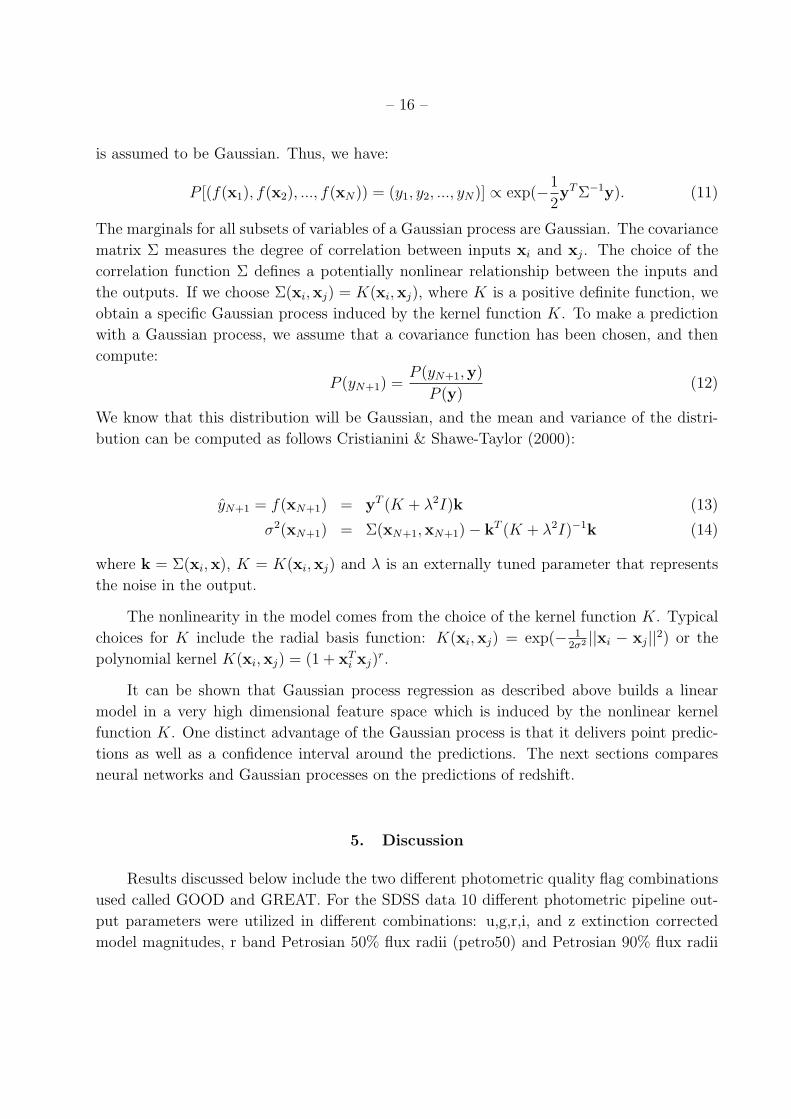
– 16 –
is assumed to be Gaussian. Thus, we have:
P [(f(x1), f(x2), ..., f(xN)) = (y1, y2, ..., yN)] ∝ exp(−1
2yT Σ−1y). (11)
The marginals for all subsets of variables of a Gaussian process are Gaussian. The covariance
matrix Σ measures the degree of correlation between inputs xi and xj. The choice of the
correlation function Σ defines a potentially nonlinear relationship between the inputs and
the outputs. If we choose Σ(xi,xj) = K(xi,xj), where K is a positive definite function, we
obtain a specific Gaussian process induced by the kernel function K. To make a prediction
with a Gaussian process, we assume that a covariance function has been chosen, and then
compute:
P (yN+1) =P (yN+1,y)
P (y)(12)
We know that this distribution will be Gaussian, and the mean and variance of the distri-
bution can be computed as follows Cristianini & Shawe-Taylor (2000):
yN+1 = f(xN+1) = yT (K + λ2I)k (13)
σ2(xN+1) = Σ(xN+1,xN+1)− kT (K + λ2I)−1k (14)
where k = Σ(xi,x), K = K(xi,xj) and λ is an externally tuned parameter that represents
the noise in the output.
The nonlinearity in the model comes from the choice of the kernel function K. Typical
choices for K include the radial basis function: K(xi,xj) = exp(− 12σ2 ||xi − xj||2) or the
polynomial kernel K(xi,xj) = (1 + xTi xj)
r.
It can be shown that Gaussian process regression as described above builds a linear
model in a very high dimensional feature space which is induced by the nonlinear kernel
function K. One distinct advantage of the Gaussian process is that it delivers point predic-
tions as well as a confidence interval around the predictions. The next sections compares
neural networks and Gaussian processes on the predictions of redshift.
5. Discussion
Results discussed below include the two different photometric quality flag combinations
used called GOOD and GREAT. For the SDSS data 10 different photometric pipeline out-
put parameters were utilized in different combinations: u,g,r,i, and z extinction corrected
model magnitudes, r band Petrosian 50% flux radii (petro50) and Petrosian 90% flux radii

– 17 –
0 20 40 60 80 100
0.02
0.025
0.03Linear
Quadratic
ANNZ
E−Model
GP
u−g−r−i−z
RM
S E
rror
0 20 40 60 80 100
0.02
0.025
0.03
u−g−r−i−z−petro50−petro90
0 20 40 60 80 100
0.02
0.025
0.03
u−g−r−i−z−petro50−petro90−ci
RM
S E
rror
0 20 40 60 80 100
0.02
0.025
0.03
u−g−r−i−z−petro50−petro90−ci−qr
0 20 40 60 80 100
0.02
0.025
0.03
u−g−r−i−z−petro50−petro90−fracdev
Model Number
RM
S E
rror
0 20 40 60 80 100
0.02
0.025
0.03
Model Number
u−g−r−i−z−petro50−petro90−qr−fracdev
0 20 40 60 80 100
0.02
0.025
0.03
Linear
RM
S E
rror
0 20 40 60 80 100
0.02
0.025
0.03
Quadratic
0 20 40 60 80 100
0.02
0.025
0.03
ANNZ
RM
S E
rror
0 20 40 60 80 100
0.02
0.025
0.03
E−Model
Model Number
0 20 40 60 80 100
0.02
0.025
0.03
GP
Model Number
RM
S E
rror
u−g−r−i−z
u−g−r−i−z−petro50−petro90
u−g−r−i−z−petro50−petro90−ci
u−g−r−i−z−petro50−petro90−ci−qr
u−g−r−i−z−petro50−petro90−fracdev
u−g−r−i−z−petro50−petro90−fracdev−qr
Fig. 3.— The six plots to the left contain the five training methods for each of the six inputs
applied to the SDSS GOOD datasets known as Dataset 1. The five plots to the right are our
training-set results for each of the five training methods applied to the six different SDSS
GOOD inputs.
(petro90), the Petrosian inverse concentration index (CI) derived from these two quantities,
the r band FracDev quantity (FD), and r band Stokes value all as defined in § 3.5 and 3.6.
Results are also discussed from the combined catalogs of the SDSS MGS (u,g,r,i,z magnitudes
only) galaxies with redshifts, the 2MASS extended source catalogue (j,h,k magnitudes), and
GALEX All-Sky (nuv,fuv magnitudes) data sets. The sample sizes for each of these datasets
are also given in Tables 4, 5 and 6.
In order to make our results as comparable as possible the same validation, training and
testing sizes were used in our analysis for ANNz, Ensemble Model, Linear and Quadratic
fits: training=89%, validation=1% and testing=10%. However, for the Gaussian Processes
the numbers for Dataset 2 were training=2%, validation=18%, and testing=80% and for
Dataset 1 were training=0.333%, validation=20-0.333% and testing=80%. This is because
the Gaussian processes require matrix inversion which is an O(N3) operation and Dataset
1 contains over 200,000 galaxies and their respective inputs. The mean and 90% confidence
levels are reported in all tables.
Tables 4, 5 and 6 list the rms errors and confidence levels of the photometric redshift
predictions using the five training-set methods discussed above. Figures 3, 4 and 5 show
the same information in a graphical format.
Table 4 and Figure 3 demonstrate our results on Dataset 1. The plots on in Figure 3
clearly demonstrate that the ANNz and E-Model neural network methods are superior in
their accuracy over nearly all bootstrap samples no matter which input quantities were used.
The linear and quadratic fits fair the worse as is expected. The Gaussian Process model is

– 18 –
0 20 40 60 80 1000.018
0.02
0.022
0.024
0.026
0.028 Linear
Quadratic
ANNZ
E−Model
GP
u−g−r−i−z
RM
S E
rror
0 20 40 60 80 1000.018
0.02
0.022
0.024
0.026
0.028
u−g−r−i−z−petro50−petro90
0 20 40 60 80 1000.018
0.02
0.022
0.024
0.026
0.028
u−g−r−i−z−petro50−petro90−ci
RM
S E
rror
0 20 40 60 80 1000.018
0.02
0.022
0.024
0.026
u−g−r−i−z−petro50−petro90−ci−qr
0 20 40 60 80 1000.018
0.02
0.022
0.024
0.026
0.028
u−g−r−i−z−petro50−petro90−fracdev
Model Number
RM
S E
rror
0 20 40 60 80 1000.018
0.02
0.022
0.024
0.026
0.028
Model Number
u−g−r−i−z−petro50−petro90−qr−fracdev
0 20 40 60 80 1000.018
0.02
0.022
0.024
0.026
0.028
Linear
RM
S E
rror
0 20 40 60 80 1000.018
0.02
0.022
0.024
0.026
0.028
Quadratic
0 20 40 60 80 1000.018
0.02
0.022
0.024
0.026
0.028
ANNZ
RM
S E
rror
0 20 40 60 80 1000.018
0.02
0.022
0.024
0.026
0.028
E−Model
Model Number
0 20 40 60 80 1000.018
0.02
0.022
0.024
0.026
0.028
GP
Model Number
RM
S E
rror
u−g−r−i−z
u−g−r−i−z−petro50−petro90
u−g−r−i−z−petro50−petro90−ci
u−g−r−i−z−petro50−petro90−ci−qr
u−g−r−i−z−petro50−petro90−fracdev
u−g−r−i−z−petro50−petro90−fracdev−qr
Fig. 4.— The six plots to the left each contains the five training methods for each of the six
inputs applied to the SDSS GREAT datasets known as Dataset 2. The five plots to the right
are our training-set results for each of the five training methods applied to the six different
SDSS GREAT inputs.
usually found in between. However, it must be remembered that only 1000 sample points
were used in each case and therefore it is possible that it is not sampling all of the possible
galaxy template types. Nonetheless it does an excellent job given the small data samples
used in comparison to the other methods. It is also clear that the inputs used reproduced
very similar results once one goes beyond the five band magnitudes of the SDSS and uses
things like the Petrosian concentration index or the Stokes measure of ellipticity. The best
methods, our Ensemble Model, regularly reproduces rms values of less than 0.019 no matter
the confidence level (or bootstrap sample) used.
Table 5 and Figure 4 for Dataset 2 give very similar results to that of Dataset 1 just
discussed. Lower rms errors are obtained than that of the GOOD quality data, but there
is more variation in the confidence intervals evidenced by increasing slope as a function of
bootstrap sample in Figure 4. As with Dataset 1, the rms error results were lower but similar
when the inputs were increased beyond the five band SDSS magnitudes to include things
like the Petrosian radii, or the FracDev measurement.
While Dataset 2 does on occasion have slightly better rms errors than Dataset 1 in
general there is little difference in the use of higher quality photometry and we would not
recommend the use of the higher quality photometry of Dataset 2 as described herein in
general.
Table 6 and Figure 5 are the results of using Datasets 2 and 3. The right hand side
of Figure 5 for the better photometric quality of Dataset 4 shows again an increase in the
variability of the rms error as a function of bootstrap sample larger than that of the GOOD

– 19 –
sample from Dataset 3 to the left. In general the right hand side plot with the better SDSS
photometry of Dataset 4 has rms errors either the same or worse than those from the SDSS
only Datasets 1 and 2 in Figures 3 and 4. The variability in the rms error as a function of
bootstrap and the generally large rms errors leads one to believe that the sample size is too
small to train on. Given that there were only 326 objects in the catalog it shouldn’t be too
surprising. The apparent ability of the Quadratic regression to do so well would point one
to possible overfitting of the data.
However, on the right hand side of Figure 5 the story is very different. Here the vari-
ability is much less as a function of bootstrap, the rms errors are generally quite low and the
prediction abilities of the different methods are consistent with those observed in the SDSS
Datasets 1 and 2 found in Figures 3 and 4. The Ensemble Model once again surpasses all
other methods for 95% of the bootstrap samples followed closely by the Gaussian Processes
and ANNz methods. Here one can see that the Gaussian Process method is more competitive
as it is likely to be sampling all possible templates of the 3095 input galaxies even with only
1000 samples per run.
In order to show the effects of sampling and local minima for the Ensemble Model on
the quality of redshift predictions we show a set of 100 neural networks and show their final
RMS errors in Figures 6 and 7. Each neural network was built by drawing a sample from the
training set with replacement and then performing the gradient descent maximization process
described earlier. We train until the model converges, which is defined as the gradient-descent
iteration at which the magnitude of the gradient drops below a preset threshold. This model
corresponds to one point on the top panel of Figures 6 and 7.
The lower panel of Figure 7 shows the cumulative distribution function for the errors
shown in the upper panel. The x-axis is the RMS error (e0), and the y-axis is P(RMS < e0).
The plot indicates that about 70% of the models we generated have an RMS error less than
0.1. This plot also indicates that reporting the minimum observed RMS value, which is done
throughout the literature on this topic (Collister & Lahav 2004, e.g. ANNz) is misleading.
For the models computed for this empirical cumulative distribution function, the quantity
P(RMS < e0) rapidly vanishes as e0 → 0.04. This implies that such models are not only
highly unlikely, but also highly non-robust.
In order to contrast this distribution with the empirical distributions observed on other
data sets, we chose to show Figure 6. This figure, unlike the previous figure discussed, shows
that the variation imposed by the optimization procedure, combined with the variations in
the data set, have a relatively small effect on the quality of predictions: nearly 70% of the
models have a very low error rate, with the distribution rapidly increasing after that. Notice
that the empirical cumulative distribution function shown in the lower panel rises sharply at

– 20 –
the onset of the curve. This indicates that 70% of the models have an error less than about
0.025. Again, this variation and apparent combined stability of the data set and optimization
procedure would be entirely lost if only the minimum value of the distribution was reported.
For comparison in Figure 8 one can see the known spectroscopic redshift plotted against
the calculated photometric redshift from the test data for our 5 algorithms used against
the ugriz-petro50-petro90-ci-qr GREAT dataset (part of Dataset 2) as presented in Table 4.
Notice that the Gaussian process plot (lower middle) has a larger number of points which is
due to the smaller training set and larger testing sets used in this algorithm. The 6th plot in
the lower right hand corner of Figure 8 contains the Gaussian Process Model results against
the GREAT nuv-fuv-ugriz-jhk Dataset 4 as presented in Table 6.
6. Conclusion
We have shown that photometric redshift accuracy of SDSS photometric data can be
improved over that of previous attempts through a careful choice of additional photomet-
ric pipeline outputs that are related to angular size and morphology. Adding additional
bandpasses from the Ultraviolet (GALEX) and Infrared (2MASS) can be even more helpful,
but the current sample sizes are presently too small to be useful for Large Scale Structure
studies.
We have also shown that there is little difference in the use of the higher quality SDSS
photometry as defined herein. Hence we would not recommend it use because it decreases
the sample size markedly and does not decrease the rms errors in the photometric redshift
prediction.
We wish to stress that when using a neural network model for studies of photometric
redshifts care must be taken when reporting the results of such models. There is a tendency
in the astronomical literature to report only the best fit model, which is highly unlikely to
be the one used to calculate the final photometric redshift estimates.
The effects of local minima on prediction has also been discussed in some detail and we
describe the way in which an ensemble of neural networks can reduce the problem.
We have also discussed the result of using Gaussian processes for regression, which
avoids many of the local minima problems that occur with neural networks. One of the
great strengths of Gaussian Processes as used herein is the ability to use small training sets,
which may be helpful in high redshift studies where very small numbers of measured redshifts
are available.

– 21 –
M.J.W. acknowledges useful discussions with Zeljko Ivezic on the SDSS photometric
quality flags, and Michael Blanton related to the NYU-VAGC catalogue which helped in un-
derstanding many aspects of the SDSS. M.J.W also acknowledges Alex Szalay, Ani Thakar,
Maria SanSebastien, and Jim Gray for their help in using the SDSS skyserver query inter-
face and in obtaining a local copy of the SDSS DR2. M.J.W. acknowledges funding received
from the NASA Applied Information Systems Research Program. A.N.S. acknowledges fund-
ing received from the NASA Intelligent Systems Program, Intelligent Data Understanding
Element and valuable discussions with William Macready.
The authors acknowledge support from the NASA/Ames Research Center Director’s
Discretionary Fund.
Funding for the Sloan Digital Sky Survey (SDSS) has been provided by the Alfred P.
Sloan Foundation, the Participating Institutions, the National Aeronautics and Space Ad-
ministration, the National Science Foundation, the U.S. Department of Energy, the Japanese
Monbukagakusho, and the Max Planck Society. The SDSS Web site is http://www.sdss.org/.
The SDSS is managed by the Astrophysical Research Consortium (ARC) for the Partic-
ipating Institutions. The Participating Institutions are The University of Chicago, Fermilab,
the Institute for Advanced Study, the Japan Participation Group, The Johns Hopkins Uni-
versity, Los Alamos National Laboratory, the Max-Planck-Institute for Astronomy (MPIA),
the Max-Planck-Institute for Astrophysics (MPA), New Mexico State University, University
of Pittsburgh, Princeton University, the United States Naval Observatory, and the University
of Washington.
This publication makes use of data products from the Two Micron All Sky Survey,
which is a joint project of the University of Massachusetts and the Infrared Processing and
Analysis Center/California Institute of Technology, funded by the National Aeronautics and
Space Administration and the National Science Foundation.
This research has made use of NASA’s Astrophysics Data System Bibliographic Services.
A. SDSS Queries
Below are the queries used against the SDSS DR2 and DR3 databases to obtain the
data used throughout this paper.
Query used to obtain the “GOOD” quality photometry from the SDSS MGS with spectro-
scopic redshifts:

– 22 –
Select p.ObjID, p.ra, p.dec,
p.dered u, p.dered g, p.dered r, p.dered i, p.dered z,
p.petroR50 r, p.petroR90 r, p.fracDeV r, p.q r,
p.Err u, p.Err g, p.Err r, p.Err i, p.Err z,
p.petroR50Err r, p.petroR90Err r, p.qErr r,
s.z, s.zErr, s.zConf
into mydb.dr3cfracdpetq from SpecOBJall s, PhotoObjall p
WHERE s.specobjid=p.specobjid
and s.zConf>0.95
and (p.primtarget & 0x00000040 > 0)
and ( ((flags & 0x8) = 0) and ((flags & 0x2) = 0) and ((flags & 0x40000) = 0)
Query used to obtain the GREAT quality photometry from the SDSS MGS with spectro-
scopic redshifts:
Select p.ObjID, p.ra, p.dec,
p.dered u, p.dered g, p.dered r, p.dered i, p.dered z,
p.petroR50 r, p.petroR90 r, p.fracDeV r, p.q r,
p.Err u, p.Err g, p.Err r, p.Err i, p.Err z,
p.petroR50Err r, p.petroR90Err r, p.qErr r,
s.z, s.zErr, s.zConf
into mydb.dr3cfracdpetq from SpecOBJall s, PhotoObjall p
WHERE s.specobjid=p.specobjid
and s.zConf>0.95
and (p.primtarget & 0x00000040 > 0)
and ( ((flags & 0x8) = 0) and ((flags & 0x2) = 0) and ((flags & 0x40000) = 0)
and ((flags & 0x10) =0) and ((flags & 0x1000)=0) and ((flags & 0x20000) = 0) )
Query used to obtain the “GOOD” quality photometry from the SDSS MGS DR2 with
spectroscopic redshifts, 2MASS photometry and GALEX photometry.
Select p.objID, p.ra, p.dec,
g.NUV MAG, g.NUV MAGERR, g.FUV MAG, g.FUV MAGERR,
p.u, p.Err u, p.g, p.Err g, p.r, p.Err r, p.i, p.Err i, p.z, p.Err z,
t.j m k20fe, t.j msig k20fe, t.h m k20fe, t.h msig k20fe, t.k m k20fe, t.k msig k20fe,
s.z, s.zErr, s.zConf
FROM TWOMASS.dbo.xsc t, BESTDR2.dbo.PhotoObjAll p, GALEXDRONE.dbo.nuvfuv
g, BESTDR2.dbo.SpecOBJall s

– 23 –
WHERE s.specobjid=p.specobjid
and s.zConf>0.95 and s.zWarning=0
and g.NUV MAG>-99 and g.FUV MAG>-99
and t.cc flg=’0’
and (p.primtarget & 0x00000040 > 0)
and ((flags & 0x8)=0) and ((flags & 0x2)=0) and ((flags & 0x40000)=0)
and p.objid=BESTDR2.dbo.fgetnearestobjideq(t.ra,t.dec,0.08333)
and p.objid=BESTDR2.dbo.fgetnearestobjideq(g.RA,g.DEC,0.08333)
REFERENCES
Abazajian, K., et al. 2003, AJ, 126, 2081
Abazajian, K., et al. 2004, AJ, 128, 502
Abazajian, K., et al. 2005, AJ, 129, 1755
Baum, W.A. 1962, IAUS, 15, 390
Benıtez, N. 2000 ApJ, 536, 571
Bishop, C.M. 1995 Neural networks for pattern recognition, Oxford University Press, New
York
Blanton, M.R., et al. 2003, ApJ, 594, 186
Blanton, M.R., Eisenstein, D., Hogg, D.W., Schlegel, D.J., & Brinkmann, J. 2003, astro-
ph/0310453
Blanton, M.R., et al 2005, AJ, 129, 2562
Breiman, L. 1996, Bagging predictors, Machine Learning, 24, no. 2, 123–140.
Brunner, R.J., Connolly, A.J., Szalay, A.S., & Bershady, M.A. 1997, ApJ, 482, L21
Collister, A.A. & Lahav, O. 2004, PASP, 116, 345
Connolly A.J., Csabai, I., Szalay, A.S., Koo, D.C., Kron, R.G., & Munn, J.A. 1995, AJ, 110,
2655

– 24 –
Cristianini, N. & Shawe-Taylor, J. 2000, An introduction to support vector machines, Cam-
bridge University Press
Csabai, I., et al. 2003, AJ, 125, 580
Efron, B. 1979. Bootstrap methods: Another look at the jackknife. The Annals of Statistics,
7, 1-26.
Efron, B. & Tibshirani, R.J. 1993. An introduction to the bootstrap. New York, Chapman
& Hall
Graham, A.W. & Driver, S.P. 2005, astro-ph/0503176
Hsieh, B.C., Yee, H.K.C., Lin, H., & Gladders, M.D. 2005, ApJS, 158, 161
Jarrett, T.H., Chester, T., Cutri, R., Schneider, S., Skrutskie, M. & Huchra, J.P. 2000, AJ,
119, 2498
Kodama, T., Bell, E.F., & Bower, R.G. 1999, ASP Conf. Ser. 191, Photometric Redshifts
and High Redshift Galaxies, ed. R.J. Weymann, L.J. Storrie-Lombardi, M. Sawicki,
& R.J. Brunner, 160
Koo, D.C. 1985 AJ, 90, 418
Lupton, R.H., Gunn, J.E., Ivezic, Z., Knapp, G.R., Kent, S., & Yasuda, N. 2001, ASP Conf
Proc. 238, Astronomical Data Analysis Software and Systems X, ed. F.R. Harnden
Jr., F.A. Primini, & H.E. Payne, 269
Neal R.M. 1996, Bayesian learning for neural networks, Springer-Verlag New York, Inc.,
Secaucus, NJ, USA
Lanzetta, K.M., Yahil, A., & Fernandez-Soto, A. 1996, Nature, 381, 759
Loh, E.D., & Spillar, E.J. 1986, ApJ303, 154
Martin, D. C., et al. 2005, ApJ, 619, L1
Morrissey, P., et al. 2005, ApJ, 619, L7
Newman, P., et al. 2005, astro-ph/0408167
Petrosian, V. 1976, ApJ, 209, L1
Seibert, M., et al. 2005 ApJ, 619, L23

– 25 –
Sersic, J.L. 1968, Atlas de Galaxias Australes (Cordoba: Obs. Astron.)
Shimasaku, K., et al. 2001, AJ, 122, 1238
Srivastava, A.N. & Stroeve, J. 2003, Onboard detection of snow, ice, clouds, and other geo-
physical processes using kernel methods, Proceedings of the ICML 2003 Workshop on
Machine Learning Technologies for Autonomous Space Applications
Srivastava, A.N., Oza, N.C. & Stroeve, J. 2005, Virtual sensors: Using data mining tech-
niques to efficiently estimate remote sensing spectra, IEEE Transactions on Geoscience
and Remote Sensing, 43, no. 3
Storchi-Bergmann, T., Kinney, A.L. & Challis, P. 1995, ApJS, 98, 103
Stoughton, C., et al. 2002, AJ, 123, 485
Strauss, M.A., et al. 2002, AJ, 124, 1810
Strateva, I., et al. 2001, AJ, 122, 1861
Suchkov, A.A., Hanisch, R.J., & Margon, B. 2005, AJ, 130, 2439
Vincent, R.A., & Ryden, B. 2004, astro-ph/0501221
Wadadekar, Y. 2005, PASP, 117, 79
Williams R.E., et al. 1996, AJ, 112, 1335
York, D.G., et al. 2000, AJ, 120, 1579
This preprint was prepared with the AAS LATEX macros v5.0.

– 26 –
0 20 40 60 80 1000.015
0.02
0.025
0.03
0.035
0.04
0.045
0.05GALEX+SDSS−GOOD+2MASS
Model Number
RM
S E
rror
LinearQuadraticANNZE−ModelGP
0 20 40 60 80 1000.015
0.02
0.025
0.03
0.035
0.04
0.045
0.05GALEX+SDSS−GREAT+2MASS
Model NumberR
MS
Err
or
LinearQuadraticANNZE−ModelGP
Fig. 5.— Two plots showing the five training methods for each of two different GOOD and
GREAT quality input sets nuvfuv-ugriz-jhk called Datasets 3 and 4.
0 10 20 30 40 50 60 70 80 90 100
10−1.7
10−1.3
RM
S E
rror
Model Number
0.015 0.02 0.025 0.03 0.035 0.04 0.045 0.05 0.0550
0.5
1
RMS Error
CD
F o
f RM
S E
rror
0.015 0.02 0.025 0.03 0.035 0.04 0.045 0.05 0.0550
50
100
RMS Error
PD
F o
f RM
S E
rror
Fig. 6.— The top panel of this figure shows the distribution of errors for 100 neural networks
on the GREAT E-Model ugriz-petro50-petro90-qr-fracdev Dataset 2 (see Table 4). The
middle panel shows the empirical cumulative distribution function for the RMS errors for
the 100 models shown in the top panel. The bottom panel shows the probability distribution
function of the rms error. See § 5 for more details.

– 27 –
0 10 20 30 40 50 60 70 80 90 10010
−1.6
10−1.2
RM
S E
rror
Model Number
0.02 0.025 0.03 0.035 0.04 0.045 0.05 0.055 0.06 0.0650
0.5
1
RMS Error
CD
F o
f RM
S E
rror
0.02 0.025 0.03 0.035 0.04 0.045 0.05 0.055 0.06 0.0650
10
20
30
RMS Error
PD
F o
f RM
S E
rror
Fig. 7.— The top panel of this figure shows the distribution of errors for 100 neural networks
on the GREAT E-Model nuv-fuv-ugriz-jhk Dataset 4 (see Table 4). The middle panel shows
the empirical cumulative distribution function for the RMS errors for the 100 models shown
in the top panel. The bottom panel shows the probability distribution function of the rms
error. See § 5 for more details.
0 0.2 0.40
0.1
0.2
0.3
0.4
Pho
tom
etric
Red
shift
Linear
0 0.2 0.40
0.1
0.2
0.3
0.4Quadratic
0 0.2 0.40
0.1
0.2
0.3
0.4ANNZ
0 0.2 0.40
0.1
0.2
0.3
0.4
Spectroscopic Redshift
Pho
tom
etric
Red
shift
E−Model
0 0.2 0.40
0.1
0.2
0.3
0.4
Spectroscopic Redshift
GP
0 0.2 0.40
0.1
0.2
0.3
0.4
Spectroscopic Redshift
GP: GALEX−SDSS−2MASS
Fig. 8.— Spectroscopic redshift is plotted versus calculated photometric redshift for the
GREAT ugriz-petro50-petro90-ci-qr Dataset 2 with 5 algorithms while the 6th plot uses the
Gaussian Process model for the nuv-fuv-ugriz-jhk GREAT Dataset 4. See Table 4 for details

– 28 –
Table 3: Different Photometric Redshift Techniques and Accuracies.
Method Name σrms Dataset1 Inputs2 Source
CWW 0.0666 SDSS-EDR ugriz Csabai et al. (2003)
Bruzual-Charlot 0.0552 SDSS-EDR ugriz Csabai et al. (2003)
ClassX 0.0340 SDSS-DR2 ugriz Suchkov et al. (2005)
Polynomial 0.0318 SDSS-EDR ugriz Csabai et al. (2003)
Support Vector Machine 0.0270 SDSS-DR2 ugriz Wadadekar (2005)
Kd-tree 0.0254 SDSS-EDR ugriz Csabai et al. (2003)
Support Vector Machine 0.0230 SDSS-DR2 ugriz+r50+r90 Wadadekar (2005)
Artificial Neural Network 0.0229 SDSS-DR1 ugriz Collister & Lahav (2004)
1SDSS-EDR Early Data Release (Stoughton et al. 2002), SDSS-DR1 Data Release 1 (Abazajian et al. 2003),SDSS-DR2 Data Release 2 (Abazajian et al. 2004)
2ugriz=5 SDSS magnitudes, r50=Petrosian 50% light radius in r band, r90=Petrosian 90% light radius in rband.

– 29 –
Tab
le4.
Phot
omet
ric
Red
shift
pre
dic
tion
rms
erro
rsw
ith
confiden
cele
vels
for
SD
SS
“GO
OD
”phot
omet
ry,20
2,29
7ob
ject
sa
Input-
para
met
ers1
Lin
ear
Quadra
tic
AN
Nz
E-M
odel
GP
2
(50%
)(1
0%
)(9
0%
)(5
0%
)(1
0%
)(9
0%
)(5
0%
)(1
0%
)(9
0%
)(5
0%
)(1
0%
)(9
0%
)(5
0%
)(1
0%
)(9
0%
)
ugri
z0.0
283
0.0
282
0.0
284
0.0
255
0.0
255
0.0
255
0.0
206
0.0
205
0.0
208
0.0
201
0.0
198
0.0
205
0.0
227
0.0
225
0.0
230
ugri
z+r5
0+
r90
0.0
288
0.0
288
0.0
289
0.0
245
0.0
244
0.0
245
0.0
194
0.0
192
0.0
196
0.0
189
0.0
187
0.0
194
0.0
236
0.0
233
0.0
241
ugri
z+r5
0+
r90+
CI
0.0
286
0.0
285
0.0
286
0.0
264
0.0
263
0.0
265
0.0
194
0.0
191
0.0
195
0.0
187
0.0
185
0.0
190
0.0
239
0.0
236
0.0
243
ugri
z+r5
0+
r90+
CI+
QR
0.0
296
0.0
295
0.0
296
0.0
245
0.0
244
0.0
246
0.0
192
0.0
189
0.0
194
0.0
186
0.0
184
0.0
190
0.0
241
0.0
238
0.0
245
ugri
z+r5
0+
r90+
FD
0.0
286
0.0
286
0.0
287
0.0
263
0.0
261
0.0
266
0.0
189
0.0
188
0.0
192
0.0
183
0.0
181
0.0
187
0.0
236
0.0
233
0.0
241
ugri
z+r5
0+
r90+
FD
+Q
R0.0
290
0.0
289
0.0
290
0.0
243
0.0
242
0.0
243
0.0
189
0.0
187
0.0
191
0.0
185
0.0
183
0.0
186
0.0
239
0.0
235
0.0
242
aIn
puts
:tr
ain
ing=
89%
,validati
on=
1%
and
test
ing=
10%
1ugri
z=5
SD
SS
magnit
udes
,r5
0=
Pet
rosi
an
50%
light
radiu
sin
rband,
r90=
Pet
rosi
an
90%
light
radiu
sin
rband,
CI=
Pet
rosi
an
Inver
seC
once
ntr
ati
on
Index
,FD
=Fra
cDev
valu
e,Q
R=
Sto
kes
valu
e.See
text
for
more
det
ails.
2In
puts
:tr
ain
ing=
0.3
33%
,validati
on=
19.6
66%
and
test
ing=
80%

– 30 –
Tab
le5.
Phot
omet
ric
Red
shift
pre
dic
tion
rms
erro
rsw
ith
confiden
cele
vels
for
SD
SS
“GR
EA
T”
phot
omet
ry,33
,328
obje
ctsa
Input-
para
met
ers1
Lin
ear
Quadra
tic
AN
Nz
E-M
odel
GP
2
(50%
)(1
0%
)(9
0%
)(5
0%
)(1
0%
)(9
0%
)(5
0%
)(1
0%
)(9
0%
)(5
0%
)(1
0%
)(9
0%
)(5
0%
)(1
0%
)(9
0%
)
ugri
z0.0
242
0.0
241
0.0
242
0.0
225
0.0
225
0.0
225
0.0
208
0.0
207
0.0
209
0.0
197
0.0
194
0.0
200
0.0
243
0.0
237
0.0
248
ugri
z+r5
0+
r90
0.0
227
0.0
227
0.0
227
0.0
217
0.0
216
0.0
217
0.0
201
0.0
199
0.0
202
0.0
194
0.0
192
0.0
198
0.0
237
0.0
232
0.0
241
ugri
z+r5
0+
r90+
CI
0.0
240
0.0
240
0.0
240
0.0
226
0.0
226
0.0
226
0.0
200
0.0
199
0.0
202
0.0
192
0.0
191
0.0
194
0.0
242
0.0
238
0.0
247
ugri
z+r5
0+
r90+
CI+
QR
0.0
235
0.0
235
0.0
235
0.0
213
0.0
213
0.0
213
0.0
197
0.0
195
0.0
198
0.0
185
0.0
183
0.0
189
0.0
243
0.0
237
0.0
255
ugri
z+r5
0+
r90+
FD
0.0
243
0.0
243
0.0
243
0.0
220
0.0
219
0.0
220
0.0
196
0.0
195
0.0
198
0.0
185
0.0
183
0.0
189
0.0
230
0.0
226
0.0
233
ugri
z+r5
0+
r90+
FD
+Q
R0.0
234
0.0
233
0.0
234
0.0
220
0.0
219
0.0
220
0.0
194
0.0
193
0.0
196
0.0
185
0.0
184
0.0
188
0.0
242
0.0
238
0.0
245
aIn
puts
:tr
ain
ing=
89%
,validati
on=
1%
and
test
ing=
10%
1ugri
z=5
SD
SS
magnit
udes
,r5
0=
Pet
rosi
an
50%
light
radiu
sin
rband,
r90=
Pet
rosi
an
90%
light
radiu
sin
rband,
CI=
Pet
rosi
an
Inver
seC
once
ntr
ati
on
Index
,FD
=Fra
cDev
valu
e,Q
R=
Sto
kes
valu
e.See
text
for
more
det
ails.
2In
puts
:tr
ain
ing=
2%
,validati
on=
18%
and
test
ing=
80%

– 31 –
Tab
le6.
Phot
omet
ric
Red
shift
pre
dic
tion
rms
erro
rsw
ith
confiden
cele
vels
for
SD
SS+
GA
LE
X+
2MA
SS
GO
OD
and
GR
EA
Tqual
ity
phot
omet
rya
Input-
para
met
ers1
Lin
ear
Quadra
tic
AN
Nz
E-M
odel
GP
(50%
)(1
0%
)(9
0%
)(5
0%
)(1
0%
)(9
0%
)(5
0%
)(1
0%
)(9
0%
)(5
0%
)(1
0%
)(9
0%
)(5
0%
)(1
0%
)(9
0%
)
nuv+
fuv+
ugri
z+jh
k2
0.0
254
0.0
249
0.0
259
0.0
220
0.0
214
0.0
229
0.0
209
0.0
204
0.0
222
0.0
369
0.0
296
0.0
475
0.0
267
0.0
249
0.0
291
nuv+
fuv+
ugri
z+jh
k3
0.0
201
0.0
200
0.0
201
0.0
200
0.0
199
0.0
202
0.0
191
0.0
188
0.0
194
0.0
171
0.0
161
0.0
195
0.0
195
0.0
189
0.0
203
aIn
puts
:tr
ain
ing=
89%
,validati
on=
1%
and
test
ing=
10%
1ugri
z=5
SD
SS
magnit
udes
,nuv=
GA
LE
XN
UV
magnit
ude,
fuv=
GA
LE
XFU
Vm
agnit
ude,
jhk=
2M
ASS
jkh
magnit
udes
.See
text
for
more
det
ails.
2G
RE
AT
quality
,326
com
bin
edca
talo
gobje
cts
3G
OO
Dquality
,3095
com
bin
edca
talo
gobje
cts
![arXiv:1601.01739v1 [astro-ph.IM] 8 Jan 2016estimation. The dataset was constructed by Zhang et al. (2013) for estimating photometric redshifts of quasars. They used the samples of](https://static.fdocuments.net/doc/165x107/6031e6baaa6fc51d94775770/arxiv160101739v1-astro-phim-8-jan-2016-estimation-the-dataset-was-constructed.jpg)