Novel mechanisms and biomarkers in alcohol-induced organ ...
224
University of Louisville inkIR: e University of Louisville's Institutional Repository Electronic eses and Dissertations 5-2019 Novel mechanisms and biomarkers in alcohol- induced organ injury. Christine E. Dolin University of Louisville Follow this and additional works at: hps://ir.library.louisville.edu/etd Part of the Diagnosis Commons , Digestive System Diseases Commons , Hepatology Commons , Medical Molecular Biology Commons , Medical Toxicology Commons , and the Nephrology Commons is Doctoral Dissertation is brought to you for free and open access by inkIR: e University of Louisville's Institutional Repository. It has been accepted for inclusion in Electronic eses and Dissertations by an authorized administrator of inkIR: e University of Louisville's Institutional Repository. is title appears here courtesy of the author, who has retained all other copyrights. For more information, please contact [email protected]. Recommended Citation Dolin, Christine E., "Novel mechanisms and biomarkers in alcohol-induced organ injury." (2019). Electronic eses and Dissertations. Paper 3195. hps://doi.org/10.18297/etd/3195
Transcript of Novel mechanisms and biomarkers in alcohol-induced organ ...

University of LouisvilleThinkIR: The University of Louisville's Institutional Repository
Electronic Theses and Dissertations
5-2019
Novel mechanisms and biomarkers in alcohol-induced organ injury.Christine E. DolinUniversity of Louisville
Follow this and additional works at: https://ir.library.louisville.edu/etdPart of the Diagnosis Commons, Digestive System Diseases Commons, Hepatology Commons,
Medical Molecular Biology Commons, Medical Toxicology Commons, and the NephrologyCommons
This Doctoral Dissertation is brought to you for free and open access by ThinkIR: The University of Louisville's Institutional Repository. It has beenaccepted for inclusion in Electronic Theses and Dissertations by an authorized administrator of ThinkIR: The University of Louisville's InstitutionalRepository. This title appears here courtesy of the author, who has retained all other copyrights. For more information, please [email protected].
Recommended CitationDolin, Christine E., "Novel mechanisms and biomarkers in alcohol-induced organ injury." (2019). Electronic Theses and Dissertations.Paper 3195.https://doi.org/10.18297/etd/3195

NOVEL MECHANISMS AND BIOMARKERS IN ALCOHOL-INDUCED ORGAN
INJURY
By
Christine E. Dolin
B.S. University of Louisville, 2015
M.S., University of Louisville, 2017
A Dissertation
Submitted to the Faculty of the
School of Medicine of the University of Louisville
In Partial Fulfillment of the Requirements
for the Degree of
Doctor of Philosophy in Pharmacology and Toxicology
Department of Pharmacology and Toxicology
University of Louisville
Louisville, KY
May 2019


ii
NOVEL MECHANISMS AND BIOMARKERS IN ALCOHOL-INDUCED ORGAN
INJURY
By Christine E. Dolin
B.S., University of Louisville, 2015
M.S. University of Louisville, 2017
Dissertation Approved on
04/12/2019
By the following Committee:
__________________________________
Michael L. Merchant, Ph.D. (Mentor)
__________________________________ Gavin E. Arteel, Ph.D. (Co-Mentor)
__________________________________ Michelle T. Barati, Ph.D.
__________________________________ Juliane I. Beier, Ph.D.
__________________________________ Jonathan H. Freedman, Ph.D.
__________________________________ Gary W. Hoyle, Ph.D.

iii
DEDICATION
This dissertation is lovingly dedicated
to my parents
Owen and Ann Dolin
And to my husband
Neal Taylor
for their constant love, encouragement and support
In all my endeavors.

iv
ACKNOWLEDGEMENTS
First, I would like to thank my mentors, Dr. Gavin Arteel and Dr. Michael
Merchant, for their steadfast guidance and support in my research and learning.
Their encouragement, patience and confidence in my abilities during my first
scientific investigations and throughout my graduate career has been
instrumental in the success of my research. I would also like to thank my
dissertation committee members, Dr. Michelle Barati, Dr. Juliane Beier, Dr.
Jonathan Freedman, and Dr. Gary Hoyle, for their guidance and support
throughout my graduate career.
I would like to thank Dr. Craig McClain and Dr. Vatsalya Vatsalya for their
help in providing the alcoholic hepatitis samples and clinical data. I would also
like to thank Dr. Shesh Rai and Dr. Sudhir Srivastava for their statistical support.
I would also like to thank Dr. Wolfgang Zacharias, Sabine Waigel, and Vennila
Arumugam for their help with RNA-seq, and Dr. Eric Rouchka and Dr. Julia
Chariker for bioinformatics support.
Many thanks to my lab mates who have been an instrumental part of my
graduate experience: Daniel Wilkey, for his proteomics expertise, Susan Isaacs,
for her expertise in immunoblot, Ming Li, Kim Head, and Deanna Siow for their
guidance and lab management, Dr. Veronica Massey, Dr. Lauren Poole, Dr.
Shanice Hudson, Dr. Anna Lang, Dr. Liya Chen, Regina Schnegelberger, Brenna

v
Kaelin, and Calvin Nguyen-Ho for their peer mentorship and their help with
various experiments.
Thank you to everyone in the University of Louisville Department of
Pharmacology and Toxicology, Alcohol Research Center, and Division of
Nephrology for your support. Thanks also to my cohort mates for making
coursework more enjoyable.
Finally, I would also like to thank my friends and family for their support
through my years in graduate school. Special thanks to Kelsey Durrenberg and
Adrienne Bushau-Sprinkle for their steadfast friendship. I would like to thank my
husband, Neal Taylor, for his endless love, patience and encouragement. Many
thanks to my family- Owen, Ann, Matt, and Brad Dolin– for all of their loving
support throughout my life that made me who I am. I thank God for each of
these individuals, and for the opportunity and ability to do the work that is
summarized herein.

vi
ABSTRACT
NOVEL MECHANISMS AND BIOMARKERS IN ALCOHOL-INDUCED ORGAN
INJURY
Christine E. Dolin
April 12, 2019
Background. Ethanol (EtOH) consumption is known to affect multiple organs;
this is unsurprising, as the concentration of EtOH in the blood at relevant doses
reaches the millimolar range. The overarching goal of this dissertation was to
elucidate mechanisms of alcohol-induced organ injury, specifically the effects of
alcohol on the hepatic extracellular matrix (ECM) proteome, the alcoholic
hepatitis (AH) plasma peptidome, and the effects of alcohol on the renal cortex
proteome and transcriptome. Methods. Mice were pair-fed ethanol-containing
liquid diet chronically, and then some mice were administered lipopolysaccharide
(LPS). Liver sections from these mice were processed in a series of increasingly
rigorous extraction buffers to separate proteins by ‘age’ and crosslinking.
Extracted proteins were identified using liquid chromatography-tandem mass
spectrometry (LC-MS/MS). For the AH study, a workflow was developed for the
peptidomic analysis of plasma from healthy participants or AH patients. AH
severity was stratified by MELD score as mild (<12; n=45), moderate (12-19;
vii
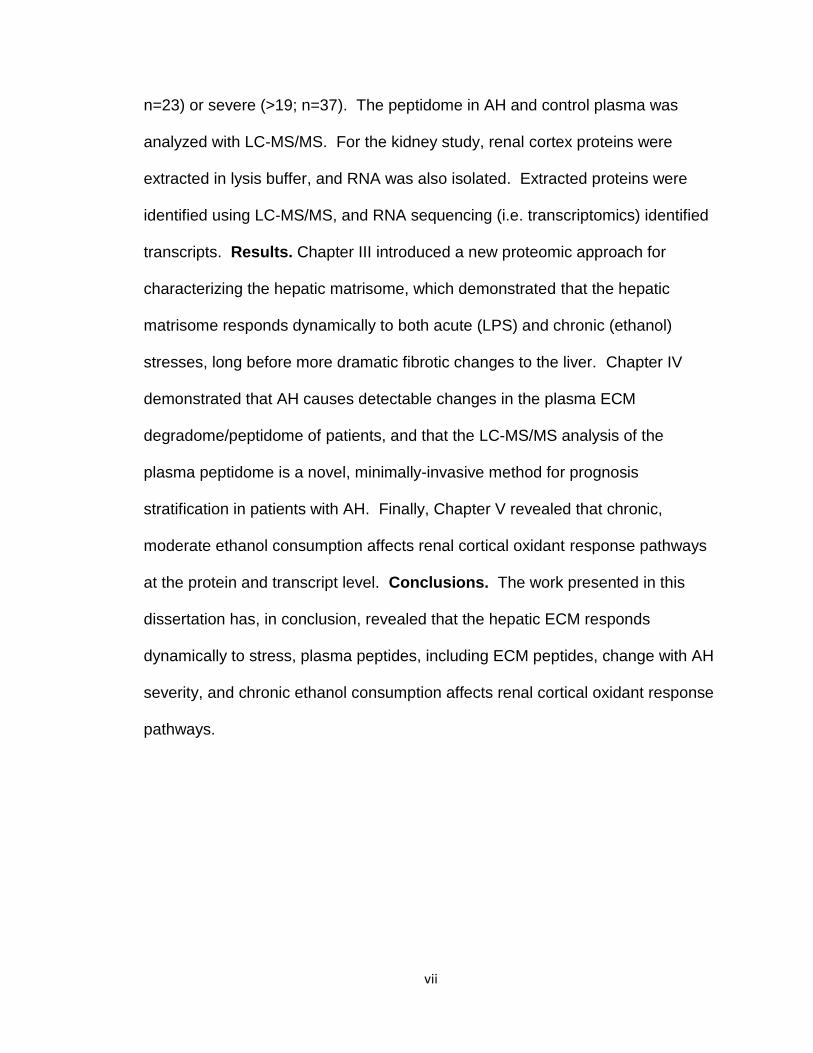
n=23) or severe (>19; n=37). The peptidome in AH and control plasma was
analyzed with LC-MS/MS. For the kidney study, renal cortex proteins were
extracted in lysis buffer, and RNA was also isolated. Extracted proteins were
identified using LC-MS/MS, and RNA sequencing (i.e. transcriptomics) identified
transcripts. Results. Chapter III introduced a new proteomic approach for
characterizing the hepatic matrisome, which demonstrated that the hepatic
matrisome responds dynamically to both acute (LPS) and chronic (ethanol)
stresses, long before more dramatic fibrotic changes to the liver. Chapter IV
demonstrated that AH causes detectable changes in the plasma ECM
degradome/peptidome of patients, and that the LC-MS/MS analysis of the
plasma peptidome is a novel, minimally-invasive method for prognosis
stratification in patients with AH. Finally, Chapter V revealed that chronic,
moderate ethanol consumption affects renal cortical oxidant response pathways
at the protein and transcript level. Conclusions. The work presented in this
dissertation has, in conclusion, revealed that the hepatic ECM responds
dynamically to stress, plasma peptides, including ECM peptides, change with AH
severity, and chronic ethanol consumption affects renal cortical oxidant response
pathways.

viii
TABLE OF CONTENTS DEDICATION…………………………………………………………………………. iii ACKNOWLEDGEMENTS…………………………………………………………… iv ABSTRACT…………………………………………………………………………… vi LIST OF TABLES…………………….………………………………………………. xv LIST OF FIGURES………………….………………………………………………. xvi CHAPTER
I. INTRODUCTION
A. Background and rationale for this study...…………………………………… 1
1. Alcohol consumption and human health……………..………………… 1
2. The extracellular matrix: more than a scaffold …..……..………………2
3. The role of the ECM in inflammation and disease..…………………... 4
4. ECM remodeling and the “degradome”………………………………... 7
5. Natural history of liver disease.…………………………………………. 8
6. Alcoholic liver disease.…...………………………………………………. 9
7. Alcoholic hepatitis ………………………………………………………... 11
8. Alcohol and the kidney..…………………………………….....……….... 12
9. Statement of goals.…………………………………………………....... 13
B. Aims and proposals……………………………………………………………. 13
1. Characterization of alcohol-induced matrisome changes in liver …. 13
2. Novel biomarkers in alcoholic hepatitis: analysis of the plasma
peptidome/degradome …………………………..……………………………. 14
3. Pathways affected by alcohol in the kidney......................................... 16

ix
II. EXPERIMENTAL PROCEDURES…………………………………………… 18
A. Animals and exposures……………………………………………………….. 18
1. Animal sacrifice, tissue collection and storage..………………………. 18
2. Carbon tetrachloride model of hepatic fibrosis………………………... 18
3. Chronic model of alcohol exposure……………………………………... 19
4. Chronic+binge model of alcohol exposure………………………………20
B. Proteomics……………………………………………………………………… 21
1. 3-step ECM extraction…………………………………………………… 21
2. Total protein extraction…………………………………………………….23
3. Sample cleanup and preparation for liquid chromatography and mass
spectrometry………………………………………………………….………… 24
4. TMT labeling………………….…………………………………………….25
5. Liquid chromatography and tandem mass spectrometry…………..… 26
6. Informatics…………………………………………………………………..28
C. Immunoblots……………………………………………………………………. 29
1. Dot blot……………………………………………………………………...29
2. Western blot……………………………………………………………......30
D. Transcriptomics………………………………………………………………… 30
1. RNA isolation……………………………………………………………… 30
2. RNA sequencing……….………………................................................ 30
3. RNASeq data analysis…………………………………………………… 31
E. Histology and Immunohistochemistry..…………………………………….. 31
1. Histology…………………………………………………………….………31

x
2. Immunohistochemistry..…………………………………………………...31
F. Clinical chemistry………………………………………………………………. 32
1. Blood urea nitrogen analysis…………………………………………...…32
G. Clinical study……………………………………………………………………. 32
1. Study participants…………………………………..………………………32
2. Inclusion criteria…………………………………………………………… 33
3. Study paradigm…………………………………………………………….33
4. Collection of clinical data………………………………………………….34
5. Plasma collection.……..………………………………………………..... 34
H. Peptidomics……...…………………………………………………………….. 35
1. Peptidomic workflow optimization………………………………………..35
2. Plasma peptide purification……………………………………………….36
3. Peptide sample cleanup and preparation for liquid chromatography and
mass spectrometry………………..…………………………………………….36
4. Liquid chromatography and tandem mass spectrometry…………...…37
I. Informatics……...…………………………………………………………….. 38
1. Liver ECM proteomic data analysis.……………………………………..38
2. Renal cortex proteomic data analysis..………………………………….38
3. Multivariate analysis of renal cortex proteomic and transcriptomic data
sets……………………………………………………………………………….39
4. AH plasma peptidome data analysis…………………………………….39
J. Statistics……...…………………………………………………………….. 40
1. Statistical analysis of liver ECM proteomic data…………..…………….40

xi
2. Statistical analysis of alcoholic hepatitis plasma peptidomic data…….41
3. Statistical analysis of renal cortex proteomic and transcriptomic data..42
III. THE HEPATIC “MATRISOME” RESPONDS DYNAMICALLY TO INJURY:
CHARACTERIZATION OF TRANSITIONAL CHANGES TO THE
EXTRACELLULAR MATRIX IN MICE……………………………………….. 44
A. Introduction……………………………………………………………………… 44
B. Experimental procedures……………………………………………………… 46
1. Animals and exposures…………………………………………………... 46
2. Three-step ECM extraction…………………………...………………….. 49
3. Sample cleanup and preparation for LC-MS/MS……………………... 49
4. Liquid chromatography and mass spectrometry ……………..…….…. 49
5. Data analysis ……………………………………………………………… 49
6. Statistical analysis………………………………………………………….49
C. Results……………………………..……………………………………………. 50
1. Analysis of changes to the ECM proteome caused by carbon
tetrachloride-induced hepatic fibrosis…………………………………… 50
2. Ethanol and LPS exposure cause global changes to the hepatic
matrisome……………..…………………………………………………… 53
3. Three-step serial extraction creates distinct protein profiles………..... 53
4. Qualitative changes to the ECM proteome in response to stress….... 74
5. Quantitative changes to the ECM proteome in response to stress….. 80
D. Discussion…………………………………………………………………...….. 95

xii
IV. NOVEL BIOMARKERS IN ALCOHOLIC HEPATITIS: ANALYSIS OF THE
PLASMA PEPTIDOME/DEGRADOME………………..…………………….103
A. Introduction…………………………………………………………………..…103
B. Experimental procedures……………………………………………………...104
1. Study participants and inclusion criteria…….………………………….104
2. Study paradigm……………………………………………………………104
3. Plasma collection.....………………………..……..…………..…………105
4. Plasma peptide purification.....………………………………..…………105
5. Liquid chromatography and tandem mass spectrometry……………..105
6. Data analysis………………………………………………………………105
7. Statistical analysis……………………………………………………..…105
C. Results…………………………………………………………………………..108
1. Patient demographics...……………………………………...…………..108
2. Plasma peptides change between MELD groups………..……………108
3. ECM peptides change between MELD groups………………………. 114
D. Discussion…………………………..…………………………………………. 122
V. CHRONIC MODERATE ALCOHOL CONSUMPTION INFLUENCES RENAL
CORTICAL OXIDANT RESPONSE PATHWAYS…………………………..126
A. Introduction……………………………………………………………………...126
B. Experimental procedures……………………………………………………...128
1. Animals and exposures…………………………………………………..128
2. Histology and immunohistochemistry..…………………………………128
3. Blood urea nitrogen analysis……………………………………….……128

xiii
4. Proteomic sample handling………………………………………………128
5. Liquid chromatography and tandem mass spectrometry ……….……129
6. RNA seq analysis..……………………………………………………..…129
7. Multivariate analysis of proteomic and transcriptomic data………..…129
8. Immunoblot analysis…………………………………………………...…129
9. Statistical analyses……………………………………………………..…130
C. Results…………………………………………………………………………..130
1. Ethanol, LPS, and the combination increase blood urea nitrogen..…130
2. Ethanol alone contributes little-to-no morphological changes to mouse
renal cortex……………………………………………………………..………130
3. Ethanol attenuates LPS-induced cortical recruitment of MPO-positive
cells…………………………………………………………………………135
4. Ethanol and LPS each cause unique protein abundance patterns.…135
5. RNA seq data support proteomic data for LPS effect……………..….140
6. Ethanol alone downregulates Nrf2-mediated oxidative stress response
pathway at the protein level and transcript level……………………………143
7. Effects of ethanol and LPS on catalase abundance…………………..148
8. Data sharing……………………………………………………………….148
D. Discussion………………………………………………………………………151
VI. DISCUSSION AND CONCLUSIONS………………………………………. 158
A. Restatement of goals and questions………………………………………... 158
B. Major findings of this dissertation…………………………………………… 158
1. The hepatic “matrisome” responds dynamically to stress..…………. 158

xiv
2. The plasma ECM degradome profile of alcoholic hepatitis patients
changes between MELD groups …………………………………..… 160
3. Alcohol consumption alters renal cortical oxidant response
pathways………………………………………………………………….. 162
C. Significance of new findings…………………………………………………. 163
D. Strengths and weaknesses of this dissertation……………………………. 165
1. Strengths…………………………………………………………………. 165
2. Weaknesses……………………………………………………………… 168
E. Future directions………………………………………………………………. 170
1. Does targeting the regulated “matrisome” proteins identified in Chapter
III prevent, halt, or reverse alcohol-induced organ injury?................. 170
2. Do the regulated peptides and features identified in Chapter IV predict
alcoholic hepatitis patient outcome and/or response to treatment in
longitudinal studies?........................................................................... 171
3. Do the regulated peptide features identified in Chapter V predict
alcoholic hepatitis patient outcome and/or response to treatment in
longitudinal studies?........................................................................... 171
F. Summary and Conclusions……………………………………………………172
REFERENCES……………………………………………………………….………174 PUBLISHER’S NOTICE OF APPROVAL.……………………………..………… 192 ABBREVIATIONS………………………………………………………..………… 192 CURRICULUM VITAE……………………………………………………………. 198

xv
LIST OF TABLES TABLES
Table 3.1: Qualitative presence of ECM proteins in sample extracts .................. 57
Table 3.2: Clustering of proteins in response to ethanol and/or LPS .................. 91
Table 4.1: Patient demographics ...................................................................... 109
Table 4.2: Pairwise comparison of peptidomes ................................................ 115
Table 4.3: ECM matrisome annotation for pairwise regulated peptides………..119
Table 5.1: Effects of EtOH and LPS on differentially regulated cortical RNA
transcripts, differentially regulated genes, and one-hit/two-hit associated Top-5
Gene Ontology (GO) terms............................................................................... 146

xvi
LIST OF FIGURES FIGURES
Figure 3.1: Scheme of transitional ECM changes and extraction methodology .. 47
Figure 3.2: Validation of extraction technique with CCl4 model of fibrosis ......... 51
Figure 3.3: Liver extracts have unique protein profiles based on fraction type and
experimental group ............................................................................................. 54
Figure 3.4: Ethanol and LPS cause dynamic changes in the matrisome………..75
Figure 3.5: Shared and unique changes to the hepatic matrisome………………78
Figure 3.6: Quantitative changes to the matrisome………………………………..81
Figure 3.7: Clustered profiles of protein abundances for proteins identified in the
NaCl fraction…………...…………………………………………………..….……….83
Figure 3.8: Clustered profiles of protein abundances for proteins identified in the
SDS fraction………………………………..…………………………………………..85
Figure 3.9: Clustered profiles of protein abundances for proteins identified in the
GnHCl fraction……………………………………….………………….……………..87
Figure 3.10: Clustered profiles of protein abundances for proteins identified in the
pellet ……….………………………..…………………………………………..……..89
Figure 4.1: Scheme of peptidomic workflow ..................................................... 106
Figure 4.2: Multivariate analysis of the plasma peptidome using principal
component analysis biplots and heat maps with hierarchical clustering ........... 112

xvii
Figure 4.3: Pairwise comparison of the peptidomes of patients with different AH
severity by volcano plots .................................................................................. 116
Figure 4.4: Regulated peptides common to HC to AH pairwise comparisons
include ECM peptides ....................................................................................... 120
Figure 5.1: Effects of chronic moderate EtOH feeding and low dose (10mg/kg
intra-peritoneal (i.p.) lipopolysaccharide (LPS) on blood urea nitrogen (BUN) . 131
Figure 5.2: Mild effects of EtOH and/or LPS on renal architecture ................... 133
Figure 5.3: LPS induced infiltration of myeloperoxidase (MPO) positive cells into
the renal parenchyma ....................................................................................... 136
Figure 5.4: Workflow and characterization of the global effect of EtOH and LPS
on the cortical proteome ................................................................................... 138
Figure 5.5: Quantitative cluster analysis reveals EtOH-regulated protein clusters
......................................................................................................................... 141
Figure 5.6: Workflow and characterization of the EtOH and 4h LPS regulated
transcriptomes .................................................................................................. 144
Figure 5.7: Effects of EtOH feeding on Cat abundance in the renal cortex ...... 149

1
CHAPTER I
INTRODUCTION
A. Background and rationale for this study
1. Alcohol consumption and human health
Alcoholic beverages were valued in ancient cultures as an antimicrobial
agent, a source of hydration and nourishment, as well as a “social lubricant” (1).
Today, alcohol consumption is nearly ubiquitous worldwide. In the United States
alone, 86.4% of adults report consuming alcohol at some point in their lives (2).
Just as alcohol use is common worldwide, so is alcohol abuse. Chronic,
compulsive alcohol abuse characterizes clinically recognized alcohol use
disorder (AUD), which is defined with specific criteria in the Diagnostic and
Statistical Manual of Mental Disorders (DSM). AUDs affect approximately 15
million adults in the United States (2). Worldwide, an estimated 64 million people
are dependent on alcohol (3).
While AUD is, in itself, a brain disorder, the serious health consequences
of alcohol abuse are much more extensive. In addition to the brain (4), chronic
alcohol consumption/abuse directly damages several organs, including the liver
(5), lung (6), skeletal muscle and heart (7), and pancreas (8). Alcohol

2
consumption is a risk factor for over 200 health conditions (9). Alcohol
consumption accounts for ~6% of all disability-adjusted life years lost in the
United States, and alcohol-related disease and disability costs the United States
approximately 250 billion dollars annually (2). There is a great need for
mechanism-based therapies to treat and/or protect against alcohol-induced
organ damage, especially given the high rate of relapse of AUDs (10).
Unfortunately, current therapies for alcohol-induced organ damage are palliative,
at best, and do not prevent or reverse the progression of organ injuries. The
overarching goal of this project is to develop such means of detection and
treatment of alcohol-induced end organ damage.
2. The extracellular matrix: more than a scaffold
The extracellular matrix (ECM) is a non-cellular three-dimensional scaffold
within all tissues and organs (11) that is critical for structure and cell signaling.
Genetic mutations in matrix components can cause a myriad of connective tissue
pathologies (12-14), if not embryonic lethality (15, 16). Therefore, the ECM is
essential to normal tissue homeostasis.
The most obvious function of the ECM is to physically support cells and
thereby provide structure to tissue. The composition of the ECM allows for its
structural role. A network of collagens, which provides tensile strength, is a
major component of the ECM of the basement membranes and interstitial
matrices in all physiological domains (17). In all solid organs, fibroblasts secrete

3
fibrous glycoproteins and proteoglycans that adhere to this collagen scaffold in a
highly cross-linked meshwork (17).
In addition to its structural role, the ECM can also play a role in cell signaling.
The heparin and heparan sulfate components of many proteoglycans readily bind
soluble growth factors, cytokines, and chemokines and can even regulate their
activation and presentation to cells (18). Additionally, these signaling molecules
can become spatially distributed and form gradients by binding to the ECM (18).
These gradients are important for tissue development and inflammatory cell
migration (18).
In addition to binding signaling molecules, ECM proteins can directly engage
in signaling. Indeed, ECM proteins are ligands of cell surface receptors,
including integrins, which bind specific ECM protein domains (e.g., the RGD
motif) (19). Through interaction with cell-surface receptors, the ECM can activate
intracellular signaling (19)
The ECM is far from static; it is full of activities required to maintain
homeostasis or (mal)adapt to insult. Proteases and protease inhibitors are key
players in maintaining and regulating other ECM components (20). Proteases
may deposit (e.g., proteases involved in the complement and coagulation
cascades) or degrade (e.g. matrix metalloproteinases, MMPs) matrix
components to facilitate rapid changes in ECM organization. Alterations in the
extracellular landscape, including changes in ECM topography, crosslinking, and
biochemistry, can affect cell migration, adhesion, and activation (21). Indeed,
protease-mediated modification of the ECM can have physical and/or

4
biochemical significance. For example, ECM proteolytic degradation can create
physical space through which cells can migrate (22). Alternatively, ECM
proteolysis can expose or remove binding sites; for example, protease cleavage
of laminin-5 exposes integrin-binding sites that are necessary for cell adhesion
(23). Proteases can also contribute to ECM dynamics by modulating the activity
of other enzymes (e.g., proteinase precursors (24) and soluble mediators (e.g.,
IL-8, (21)). Degradation of ECM components, such as the glycosaminoglycan
components of proteoglycans, can release growth factors (18). The broad,
consequential activity of proteases necessitates intricate, and often redundant,
mechanisms of regulation. Indeed, proteases are not only regulated at the levels
of transcription and secretion, but also at the level of activity (25). Proteases are
often activated through cleavage by another protease, and can be targeted by
inhibitors, such as tissue inhibitors of matrix metalloproteinases (TIMPs) (22).
Therefore, regulation of the ECM is important for the function of tissues and
organs.
3. The role of the ECM in inflammation and disease
As previously discussed, tight regulation of the ECM is critical for normal
tissue homeostasis. Such regulation also facilitates rapid changes that allow the
ECM to play a dynamic and responsive role during inflammation and tissue
repair. Perturbations in the ECM during either of these physiological states can
contribute to disease initiation and progression. Indeed, ECM dysregulation is
often a hallmark of tissue pathology (16).
5
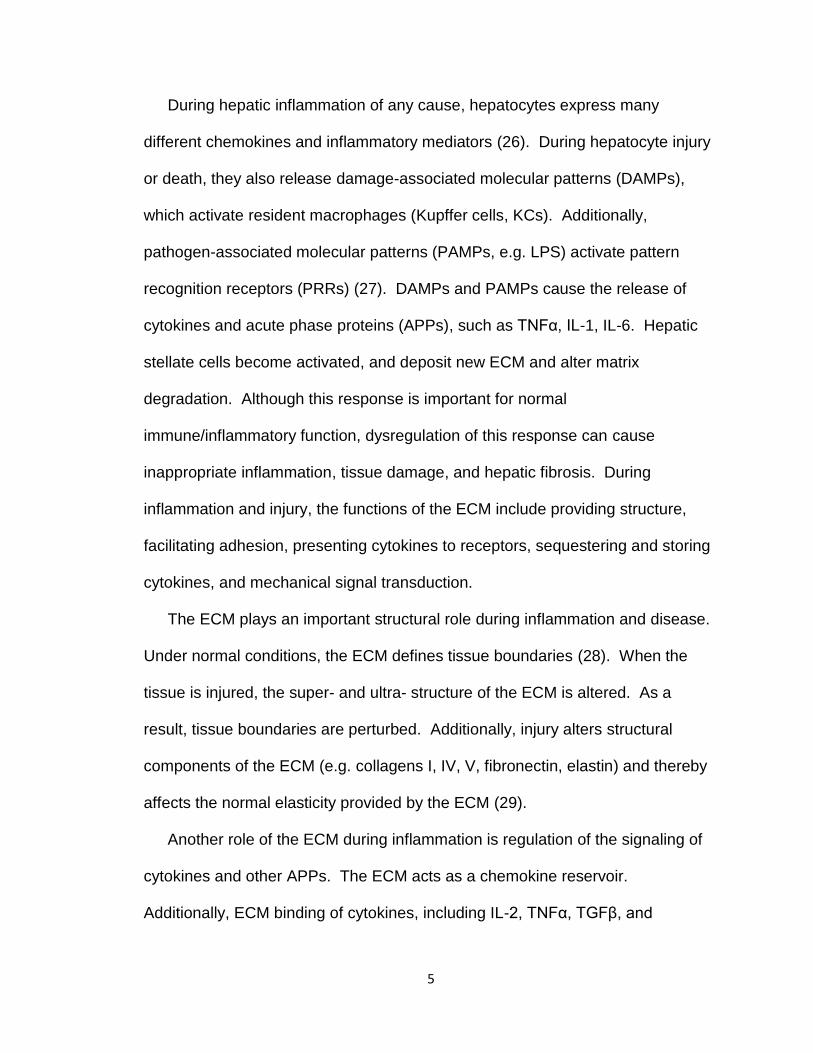
During hepatic inflammation of any cause, hepatocytes express many
different chemokines and inflammatory mediators (26). During hepatocyte injury
or death, they also release damage-associated molecular patterns (DAMPs),
which activate resident macrophages (Kupffer cells, KCs). Additionally,
pathogen-associated molecular patterns (PAMPs, e.g. LPS) activate pattern
recognition receptors (PRRs) (27). DAMPs and PAMPs cause the release of
cytokines and acute phase proteins (APPs), such as TNFα, IL-1, IL-6. Hepatic
stellate cells become activated, and deposit new ECM and alter matrix
degradation. Although this response is important for normal
immune/inflammatory function, dysregulation of this response can cause
inappropriate inflammation, tissue damage, and hepatic fibrosis. During
inflammation and injury, the functions of the ECM include providing structure,
facilitating adhesion, presenting cytokines to receptors, sequestering and storing
cytokines, and mechanical signal transduction.
The ECM plays an important structural role during inflammation and disease.
Under normal conditions, the ECM defines tissue boundaries (28). When the
tissue is injured, the super- and ultra- structure of the ECM is altered. As a
result, tissue boundaries are perturbed. Additionally, injury alters structural
components of the ECM (e.g. collagens I, IV, V, fibronectin, elastin) and thereby
affects the normal elasticity provided by the ECM (29).
Another role of the ECM during inflammation is regulation of the signaling of
cytokines and other APPs. The ECM acts as a chemokine reservoir.
Additionally, ECM binding of cytokines, including IL-2, TNFα, TGFβ, and

6
RANTES ((30-32), has been shown to regulate cell activation, adhesion, and
migration. For example, CCL2 is concentrated in the ECM at the site of injury.
Furthermore, glycosaminoglycan binding of chemokines can protect them from
proteolytic cleavage.
The ECM also acts as an adhesive substrate during inflammation. The ECM
directs inflammatory cells. For example, the ECM is critical in the process of
leukocyte adhesion and transmigration (33). Initial leukocyte capture and rolling
is mediated by selectins, arrest is medicated by integrins, and transmigration
involves adhesion molecules. The aforementioned chemokine gradients
mediated by the ECM also play an important role in directing immune cells.
During inflammation, the ECM also plays an important role in mechanical
signaling. During an acute inflammatory response, the ECM plays a pivotal role
by serving as a structural barrier. The ECM defines mechanical properties
permissive and/or instructive to inflammation. Indeed, studies have shown that
neutrophil transmigration is greater through vascular areas with lower ECM
concentration (34). The interaction between the ECM and cell infiltration is
bidirectional; as leukocytes integrate structural and biochemical signals from the
ECM, they in turn release matrix-degrading proteases (35) which alter the
extracellular composition and allow for easier cell migration.
ECM dysregulation during chronic inflammation can cause pathological tissue
remodeling. Over time, this remodeling can culminate in disease states such as
hepatic fibrosis (36, 37), pulmonary fibrosis (38-40), atherosclerosis (41, 42), and
cancer (43, 44). Dysregulated ECM synthesis and/or degradation can lead to

7
altered matrix accumulation, which is the etiologic basis of these pathologies.
For example, robustly increased collagen Iα1 secretion by hepatic stellate cells
(HSCs) (45), increased crosslinking, and a decrease in enzymatic degradation
(46) all characterize hepatic fibrosis. These dynamic ECM changes can initiate
and perpetuate disease through multiple mechanisms, including altered tissue
biomechanics (i.e. tissue stiffness) (47, 48), increased integrin-mediated cell
adhesion (49) and activation of immune cells (50).
4. ECM remodeling and the “degradome”
As discussed previously, the ECM always has some level of dynamicity, even
under normal conditions, but can undergo more dramatic, rapid changes (i.e.
remodeling) during inflammation and disease. Changes in ECM components can
occur at all different levels, from protein synthesis to crosslinking or activation.
One important means of regulation of ECM components is through proteases
(e.g. MMPs). At different stages of liver injury, hepatic stellate cells express and
secrete different profiles of proteases and inhibitors (51), as do hepatocytes (52),
neutrophils (53), and macrophages (54). These proteases can release cytokines
from the matrix (55), but can also release a myriad of other peptides that may or
may not be bioactive. The roles of protease degradation products (i.e. the
‘degradome’) in various diseases are becoming increasingly understood. For
example, ECM degradation rate, the production rate of matrix degrading
enzymes (MDE), and the conversion of ECM into soluble ECM have been
demonstrated to strongly influence tumor growth and morphology (56).

8
Understanding the role of the ECM degradome in disease is facilitated by
modern mass spectrometry methods that allow widespread characterization of
the degradome (i.e. peptidomics or ‘degradomics’) (57). Even if degradation
products do not play a critical role in disease mechanisms, they may be useful
surrogate biomarkers. These peptides are particularly attractive biomarker
candidates because they are often secreted into bodily fluids (58, 59). This
means that they could be detected using minimally invasive procedures (e.g.
blood draw).
5. Natural history of liver disease
No matter their etiology, liver diseases share a common natural history that
has been thoroughly documented. This natural history is comprised of a
spectrum of disease states including earlier stages of fatty accumulation and
inflammation, such as steatosis and steatohepatitis, and later stages of disease
such as fibrosis and cirrhosis (60, 61). Simple steatosis is the earliest stage of
liver disease and is characterized by micro- and macro-vesicular fat
accumulation. Steatosis may be reversible with lifestyle modifications or
progress to steatohepatitis. Steatohepatitis is characterized by persistent fat
accumulation, chronic inflammation, and necrosis (27). Fibrosis and cirrhosis,
the later stages of liver disease, are characterized by accumulation of fibrillar
collagens and regenerative nodules, respectively (61, 62).
Although there is a great need for and large amount of money spent on liver
disease treatment, therapeutic options are palliative at best. Currently there is no

9
FDA-approved therapy to halt or reverse liver disease progression. A better
understanding of mechanisms of disease progression is needed, and new
therapeutic targets must be identified if a rational, targeted therapy is to be
developed.
6. Alcoholic liver disease
The liver is the primary site of alcohol metabolism and therefore the primary
target organ of alcohol toxicity. Indeed, after absorption from the small intestine,
milli-molar concentrations of ethanol flow through the portal circulation and to the
liver for degradation. Ethanol is at least 2-3 times more concentrated in portal
blood than in systemic circulation (63). Oxidative metabolism of ethanol in
hepatocytes by alcohol dehydrogenase (Adh) and cytochrome P450 2E1
(Cyp2e1) produces toxic intermediate metabolites (e.g., acetaldehyde). Ethanol
metabolism also causes a robust increase in the NADH/NAD+ ratio, which
creates a more reduced cellular environment. This reduced microenvironment
blocks the beta-oxidation of fatty acids and increases fatty acid esterification.
The accumulation of excess fatty acids, which are stored in lipid droplets,
characterizes steatosis, the earliest stage of alcoholic liver disease (ALD).
Most individuals who consume moderate amounts of alcohol develop
steatosis. Steatosis most often has no health consequences, and may even be
considered a protective mechanism, as it prevents plasma lipid levels from rising.
However, chronic alcohol consumption can cause progression to later stages of
ALD, including alcoholic steatohepatitis (ASH), fibrosis, and cirrhosis. Only a

10
minority of even the heaviest drinkers will develop the most serious stages of
ALD. This suggests a 2-hit hypothesis in which progression to later stages of
liver disease requires multiple insults, or ‘hits’ (64, 65). The first ‘hit,’ such as
hepatic steatosis, sensitizes the liver to a second hit such as oxidative stress (65)
or inflammatory cytokine signaling (66), both of which are increased by ethanol
consumption.
Therefore, alcohol is one of the most commonly recognized causes of liver
disease. ALD affects more than 10 million Americans each year with medical
costs of more than $166 billion annually (67). There are no targeted therapies for
ALD, and current therapy focuses on achieving and maintaining abstinence.
Individuals with severe ALD are at risk of such acute alcoholic hepatitis (AH) or
cirrhosis (68). These sequelae of ALD have a poor prognosis and limited
therapeutic options. Without a successful liver transplant, patients typically die
from the effects of decompensation (e.g., hepatorenal syndrome) (69).
Additionally, cirrhosis increases the overall risk for hepatocellular carcinoma
(HCC) by roughly 20-fold, even in the case of compensated cirrhosis (70). Once
the HCC is symptomatic, it is usually unresectable (71). This cancer has a
dismal prognosis, with a median survival of less than 6 months and a five year
survival of almost nil (71). While the stages of ALD have been well-
characterized, targeted therapies to prevent or reverse this process in humans
are still needed. Therefore, additional research is needed to improve
understanding of risk factors and mechanisms of disease progression and to
develop rational therapies to prevent or reverse ALD.

11
Alcoholic hepatitis
AH is characterized by severe, acute hepatic inflammation, liver failure, and
jaundice (72). It is a sequelae of ALD that typically occurs after many years of
heavy alcohol consumption, and it has a high mortality rate (30-50% at 3 months,
(73)). Cause of death in AH patients is usually due to multiple organ failure
secondary to liver injury (74). AH patients are also at risk of systemic
inflammatory response syndrome (SIRS), which is associated with increased
mortality (75).
Therapeutic options for AH are limited. Liver transplantation for AH is
controversial and is currently not recommended, largely due to organ shortages
(76). Current pharmacologic treatment options for AH are limited to
corticosteroids or pentoxifylline, although the outcomes from the therapies are
poor. The benefits of anti-inflammatory pharmaceuticals only outweigh the risks
(e.g. infection) in patients with more severe AH (72). For this reason, assessing
AH severity and predicting patient outcome is important.
Predicting outcomes of AH patients is challenging. AH patients typically have
an AST/ALT greater than 2, but this measure is neither specific nor sensitive
(77). Alternatively, several clinical scoring systems have been developed. The
Maddrey discriminant function (DF) is based on serum bilirubin and PT/INR (78)
which are independent predictors of short‐term mortality in AH (79). The Model
for End‐Stage Liver Disease (MELD) score similarly utilizes serum bilirubin and
INR, but also considers creatinine. MELD has been shown to more accurately
12
predict short‐term mortality in AH compared to DF (80). Other validated scores
include ABIC, Glasgow Alcoholic Hepatitis Score, the Child-Turcotte-Pugh score;
these have similar prognostic efficiency as MELD (81-83). These models are
highly limited in patients with coexisting kidney disease or chronic hemolysis not
related to the underlying liver disease (78). Furthermore, scores such as MELD
are more limited in predicting outcome of patients with more moderate AH (84).
7. Alcohol and the kidney
It is well established that ethanol is both directly toxic to the liver and can
sensitize the liver to a second-hit insult. Although the liver is the primary target
organ of ethanol toxicity, it is becoming increasingly understood that ethanol has
some level of toxicity in other organs, such as the brain, gut, lungs, and
pancreas. Chronic, heavy ethanol consumption causes kidney damage
secondary to hepatic cirrhosis, a phenomenon known as hepato-renal syndrome.
Moderate alcohol consumption, however, is currently not considered a risk factor
for chronic kidney disease. Furthermore, population based studies have shown
moderate alcohol consumption to be inversely associated with kidney injury (85).
However, the direct renal effects of chronic moderate EtOH consumption and
sensitization to secondary hits are unclear. Rodent studies have identified
several mechanisms of alcohol-induced kidney injury that parallel those observed
in the liver (86-88). These investigations have been driven by the hypothesis that
alcohol affects the kidneys similarly to the liver. It certainly is not surprising that
these parallel mechanisms have been confirmed, considering similarities

13
between these two organs, such as the expression of CYP2E1 (86). However, it
is certainly possible that ethanol affects the kidneys by mechanisms that do not
parallel those in the liver. Therefore, further investigation into the effects of
ethanol on the kidneys is needed. Additionally, it is not known whether ethanol
exposure alters renal response to a second inflammatory ‘hit’, as has been
observed in the liver.
8. Statement of goals
It is well established that ethanol is toxic to the liver, and the natural history of
ALD is well characterized. However, there are no targeted therapies to halt or
reverse liver disease. Development of such therapies requires a better
understanding of mechanisms of disease progression as well as identification of
novel drug targets. Therefore, one goal of this dissertation is to shed new insight
into mechanisms of progression of ALD. In contrast to the liver, the effects of
ethanol on the kidneys are largely unknown. Therefore, another goal of this
dissertation is to elucidate mechanisms by which ethanol affects the kidneys.
Taken together, the goal of this dissertation is to examine new potential
mechanisms by which ethanol affects the liver and kidneys.
B. Aims and proposals
1. Characterization of alcohol-induced matrisome changes in liver

14
As discussed in earlier sections, the role of the ECM in later stages of liver
disease (i.e., fibrosis) is well established. Previous studies from our group and
others have also demonstrated changes in the ECM in early liver disease, prior
to fibrogenesis (89-91). These studies suggest that these transitional ECM
changes may play an important role in the sensitization of the liver to insult.
While several matrix proteins have been implicated as players in liver injury and
inflammation (i.e., fibrin, fibronectin), this is only a small portion of the >1000
known ECM related proteins (92). Indeed, other ECM proteins likely also
contribute to hepatic injury. Identification of new ECM proteins that ethanol
exposure alters would help elucidate mechanisms of ALD progression. There
are likely changes in the hepatic ECM that have not yet been identified, due to
the insolubility of matrix proteins that makes them difficult to extract and analyze.
A limitation of previous studies focused on the role of the ECM in ALD is that they
generally studied changes in one ECM protein at a time and did not consider
structural changes that may accompany altered ECM protein turnover.
Additionally, the study of alterations to the hepatic ECM has primarily been
hypothesis-driven, which limits the discovery of novel potential players. This
study couples a serial extraction method that allows solubilization and
enrichment of tightly cross-linked proteins with LC-MS/MS analysis. This
approach allows analysis of global changes in the hepatic ECM.
2. Novel biomarkers in alcoholic hepatitis: analysis of the plasma
peptidome/degradome

15
AH is characterized by acute liver inflammation and liver failure. It was
hypothesized that this inflammation would involve transitional remodeling of the
hepatic ECM, and that this remodeling would cause the accumulation of ECM
degradation products (peptides) in the blood. Therefore, the plasma peptidome
in AH patients was analyzed. This builds upon the work in Aim 1 of this
dissertation, which will demonstrated that the hepatic ECM undergoes significant
remodeling during inflammatory liver injury (93). This remodeling involves
protease cleavage of ECM proteins, which yields ECM peptide fragments (94).
During remodeling, peptide fragments of the degraded ECM have been shown to
increase in biologic fluids (e.g. plasma) (58, 59). Peptidomic analysis of the
degraded ECM (i.e., ‘degradome) has been identified as a useful
diagnostic/prognostic tool in other diseases of ECM remodeling, such as chronic
obstructive pulmonary disease (COPD) (58) and metastatic cancers (59).
Current methods of predicting AH outcome (i.e. clinical scores, e.g. MELD) are
limited in their abilities to predict at-risk patients with moderate disease (84).
Therefore, the purpose of this study was to test the hypothesis that the severe
inflammatory liver injury caused by AH would yield a unique degradome profile in
patient plasma. This was done using a peptidomic workflow analysis of plasma
from healthy participants or AH patients. This is expected to reveal unique
patterns of ECM peptides or ‘features’ across different severity groups of AH
patients This analysis lays the groundwork for further studies investigating the
plasma ECM degradome as potential surrogate or mechanistic biomarkers for

16
AH patient outcome. The characterization of the AH plasma degradome also
supports future mechanistic studies on the role of ECM remodeling in AH.
3. Pathways affected by alcohol in the kidney
The effects of ethanol consumption on the kidneys are poorly understood in
contrast to the liver. Some human studies have reported benefits of chronic
moderate EtOH consumption for preservation of renal function (85, 95).
However, the small number of rodent studies on the effects of ethanol on the
kidneys have reported that chronic ethanol consumption upregulates Cyp2e1
(88), causes neutrophil infiltration (88), and increases acetylation of mitochondrial
proteins (86) in the kidney. However, these previous studies have been limited
by the hypothesis that ethanol affects the kidneys by mechanisms parallel to
those in the liver. It was hypothesized that there are additional mechanisms by
which ethanol affects the kidneys that do not necessarily parallel mechanisms in
the liver. Aim 3 of this dissertation tests this hypothesis using a discovery-based
proteomic and transcriptomic approach to discover novel players and pathways
affected by ethanol and LPS in the renal cortex.
Overall aim of this dissertation.
The overall aim of this dissertation is to provide new insight into mechanisms
of alcohol-induced organ injury. To this end, a novel method of analyzing the
hepatic matrisome will be used to determine the effects of chronic, moderate
ethanol consumption and acute inflammation on the hepatic matrisome in mice

17
(Aim 1). Next, ECM degradome (peptidome) in AH patient plasma will be
analyzed (Aim 2), allowing for future investigation into the use of plasma ECM
peptides as surrogate or mechanistic biomarkers. Finally, a discovery based
‘omics approach will be used to elucidate the effects of ethanol consumption on
the kidneys (Aim 3). Taken together, this work will shed new mechanistic insight
into alcohol-induced organ injury.

18
CHAPTER II
EXPERIMENTAL PROCEDURES
A. Animals and exposures
Animal experiments were carried out by the Arteel laboratory. Mice were
housed in a pathogen-free barrier facility accredited by the Association for
Assessment and Accreditation of Laboratory Animal Care, and procedures were
approved by the University of Louisville’s Institutional Animal Care and Use
Committee.
1. Animal sacrifice, tissue collection and storage
At time of sacrifice, animals were anesthetized with ketamine/xylazine
(100/15 mg/kg, intraperitoneally (i.p.)). Blood was collected from the vena cava
just before sacrifice. Citrated plasma was stored at -80 ⁰C for further analysis.
Portions of liver and renal cortex tissue were snap-frozen in liquid nitrogen, fixed
in 10% neutral buffered formalin for subsequent sectioning and mounting on
microscope slides, or frozen-fixed in Tissue Tek OCT-Compound (Sakura
Finetek, Torrance, CA).
2. Carbon tetrachloride model of hepatic fibrosis

19
Male (4-6 weeks old) C57BL6/J mice were purchased from Jackson
Laboratory (Bar Harbor, ME). Mice were injected with CCl4 (1 mL/kg i.p.; diluted
1:4 in olive oil; Sigma-Aldrich, St. Louis, MO) or vehicle
twice a week for 4 weeks (96).
3. Chronic model of alcohol exposure
Male (8 weeks old) C57BL6/J mice were purchased from the Jackson
Laboratory (Bar Harbor, ME). Mice were given ethanol-containing Lieber-DeCarli
diet (Dyets, Inc.) ad libitum or pair-fed isocaloric/isovolumetric maltose-dextrin
control diet (97). During the exposure period, animals were housed in pairs in
shoebox cages in a room held at 75 °F. Diet was provided in vacuum tubes and
replaced between 4 and 5 pm daily. Both ethanol-fed animals and their pair-fed
counterparts received control diet for the first two days of liquid diet feeding to
allow acclimation to the liquid diet feeders. After 2 days of acclimation, ethanol
concentrations increased incrementally over the course of three weeks before
reaching the highest ethanol concentration, 6% (vol/vol) for the final three weeks
of exposure. Ethanol concentrations in the ethanol-containing diets were as
follows: 0% for two days of acclimation, 1% for two days, 2% for two days, 4% for
one week, 5% for one week, and 6% for three weeks. Ethanol-containing diet
was provided ad libitum for the entire course of the study. Because of the
relatively high caloric content of ethanol, pair-fed control animals received an iso-
caloric control diet; the calories in the iso-caloric diet were matched by adding a
calorie-equivalent of maltose-dextrin. To account for the reduced food

20
consumption of ethanol-fed mice, pair-fed mice were given the volume of diet
consumed by their ethanol-fed counterparts the night before. At the conclusion of
the feeding period, the two diet groups were further separated into additional
groups that received either LPS (Escherichia coli; 10 mg/kg i.p. Sigma, St. Louis,
MO) or vehicle (saline). Animals were euthanized 4 or 24 h after LPS (or vehicle)
injection (97). 6 control mice, 5 ethanol mice, 6 24-h LPS mice, and 4
ethanol+24h LPS mice were used for the hepatic matrisome analysis. 3 control
mice, 3 ethanol mice, 3 4h LPS mice, and 3 ethanol+4h LPS mice were used for
the renal cortex proteomic and transcriptomic analyses. The same mice were
used for the renal cortex proteomics and transcriptomics, except for 1 4h LPS
mouse and 1 ethanol+4h LPS mouse that were different.
4. Chronic+binge model of alcohol exposure
Male (10 weeks old) C57BL6/J mice were purchased from the Jackson
Laboratory (Bar Harbor, ME). Mice were exposed to ethanol as described by
Bertola et al. (98). During the exposure period, animals were housed in pairs in
shoebox cages in a room held at 75 °F. Diet was provided in vacuum tubes and
replaced between 4:00 and 5:00 PM daily. Animals were acclimatized to control
(0% EtOH) Lieber-DeCarli liquid diet (Dyets, Inc., Bethlehem, PA) for 5 days.
Mice were then split into two groups fed ethanol-containing (5% v/v) or iso-caloric
control liquid diet for 10 days. To account for the reduced food consumption of
ethanol-fed mice, pair-fed mice were given the volume of diet consumed by their
ethanol-fed counterparts the night before. On day 11, mice received ethanol (5

21
g/kg) or iso-caloric maltose dextran binge via oral gavage. Mice were sacrificed
9 hours post-gavage. Tissues were collected as described in section A1.
B. Proteomics
1. 3-step ECM extraction
Sequential extraction of the hepatic ECM was performed as described by
de Castro Bras et al. for heart tissue (99), with minor modifications for liver.
Sample preparation and wash. Snap frozen liver tissue (75-100 mg) was
immediately added to ice-cold phosphate-buffered saline (pH 7.4) wash buffer
containing commercially available protease and phosphatase inhibitors (Sigma
Aldrich) and 25 mM EDTA to inhibit proteinase and metalloproteinase activity,
respectively. While immersed in wash buffer, liver tissue was diced into small
fragments using a scalpel. The diced sample was washed 5 times to remove
contaminants. Between washes, samples were pelleted by centrifugation
(12,000×g, 5 min), and wash buffer was decanted.
NaCl extraction. Diced samples were incubated in 10 volumes of 0.5 M
NaCl buffer, containing 10 mM Tris HCl (pH 7.5), proteinase/phosphatase
inhibitors, and 25 mM EDTA. The samples were mildly mixed on a plate shaker
(800 rpm) overnight at room temperature. The following day, the remaining
tissue pieces were pelleted by centrifugation (10,000×g for 10 min). The pellet
was used for the SDS extraction (see below). The supernatant was collected
and desalted using ZebaSpin columns (Pierce) according to manufacturer’s
instructions. To precipitate proteins, desalted supernatant was incubated with 5x

22
supernatant volume of 100% acetone overnight at -20 °C, centrifuged (16,000×g,
45 min), and dried in a rotary evaporator. Proteins were resuspended in
deglycosylation buffer. SDS extraction. The pellet from the NaCl extraction was
subsequently incubated in 10 volumes (based on original weight) of 1% SDS
solution, containing proteinase/phosphatase inhibitors and 25 mM EDTA. The
samples were mildly mixed on a plate shaker (800 rpm) overnight at room
temperature. The following day, the remaining tissue pieces were pelleted by
centrifugation at 10,000×g for 10 min. The pellet was used for the GnHCl
extraction (see below). The supernatant was collected and desalted using
ZebaSpin columns (Pierce) according to manufacturer’s instructions. To
precipitate proteins, desalted supernatant was incubated with 5× supernatant
volume of 100% acetone overnight at -20 °C, centrifuged (16,000×g, 45 min),
and dried in a rotary evaporator. Proteins were resuspended in deglycosylation
buffer. Guanidine HCl extraction. The pellet from the SDS extraction was
incubated with 5 volumes (based on original weight) of a denaturing guanidine
buffer containing 4 M guanidine HCl (pH 5.8), 50 mM sodium acetate, 25 mM
EDTA, and proteinase/phosphatase inhibitors. The samples were vigorously
mixed on a plate shaker at 1200 rpm for 48 hours at room temperature; vigorous
shaking is necessary at this step to aid in the mechanical disruption of ECM
components. The remaining insoluble components were pelleted by
centrifugation at 10,000×g for 10 minutes. This insoluble pellet was retained and
solubilized as described below. To precipitate proteins, the supernatant was
mixed with 6× supernatant volume of 100% ice cold ethanol overnight at 20 °C,

23
centrifuged (16,000×g, 45 min), and washed with 90% ethanol. Pellets were
dried in a rotary evaporator and resuspended in deglycosylation buffer.
Deglycosylation and solubilization. The supernatants from each extraction were
dried in a rotary evaporator and resuspended in deglycosylation buffer containing
150 mM NaCl, 50 mM sodium acetate, 10 mM EDTA, and
proteinase/phosphatase inhibitors. Resuspended samples were desalted using
ZebaSpin columns (Pierce) according to manufacturer’s instructions. The
desalted extracts were then mixed with 5 volumes of 100% acetone and stored at
-20°C overnight to precipitate proteins. The precipitated proteins were pelleted
by centrifugation at 16,000×g for 45 minutes. Acetone was evaporated by
vacuum drying in a rotary evaporator for 1 hour. Dried protein pellets were
resuspended in 500 µL deglycosylation buffer containing 150 mM NaCl, 50 mM
sodium acetate, pH 6.8, 10 mM EDTA, and proteinase/phosphatase inhibitors
that contained chondroitinase ABC (P. vulgaris; 0.025 U/sample), endo-beta-
galactosidase (B. fragilis; 0.01 U/sample) and heparitinase II (F. heparinum;
0.025 U/sample). Samples were incubated overnight at 37°C. 20 uL DMSO was
added to the insoluble fraction (pellet from guanidine HCl extraction) to aide in
solubilization. Protein concentrations were estimated by absorbance at 280 nm
using bovine serum albumin (BSA) in deglycosylation buffer for reference
standards.
2. Total protein extraction

24
This extraction was carried out in the Merchant laboratory. Proteins were
extracted from snap frozen renal cortex tissue using lysis buffer (1:1 w/v)
containing 10% glycerol, 50 mM HEPES, 100 mM KCl, 2 mM EDTA, 0.1%
Nonidet p-40 (NP-40), 2 mM DTT, 10 mM NaF, 0.25 mM NaVO3, and 1x Halt
Protease and Phosphatase Inhibitor Cocktail (ThermoFisher). Samples were
placed in a sonication bath for 5 minutes, incubated on ice for 1 hour, and
centrifuged at 12,000×g for 30 minutes. Extract was removed from insoluble
matter. Protein concentrations were assayed using standard Bradford assay with
BSA for reference standards.
3. Sample cleanup and preparation for liquid chromatography and
mass spectrometry
Liver ECM extracts in deglycosylation buffer were pooled by experimental
group and subsequently analyzed by the University of Louisville Proteomics
Biomarkers Discovery Core (PBDC). At the PBDC, samples in deglycosylation
buffer were thawed to room temperature and clarified by centrifugation at
5,000xg for 5 min at 4°C. 50 µL (25 µg) of each sample were reduced by adding
5.55 µL of 1 M DTT and incubating at 60°C for 30 min. 144.45 µL of 8 M urea in
0.1 M Tris-HCl, pH 8.5, was added to each sample. Each reduced and diluted
sample was digested with a modified Filter-Aided Sample Preparation (FASP)
method developed by Jacek R. Wisniewski, et al. (100). Recovered material was
dried in a rotary evaporator and redissolved in 200 μL of 2% (v/v) acetonitrile
(ACN)/0.4% formic acid (FA). The samples were then trap-cleaned with a C18

25
PROTOTM 300Å Ultra MicroSpin Column (The Nest Group, Southborough, MA).
The sample eluates were stored at -80°C for 30 min, dried in a rotary evaporator,
and stored at -80°C. Before liquid chromatography, dried samples were warmed
to room temperature and dissolved in 2% (v/v) ACN/0.1% FA to a final
concentration of 0.25 μg/μL. 16 μL (4 μg) of sample was injected into the
Orbitrap Elite.
Renal cortical proteins (100µg) were digested using a FASP protocol (100)
to remove NP-40 detergent used for sample preparation. Proteomic analysis of
tissue lysates was conducted as previously described (101) with the following
modifications. Proteins were digested with Lys-c (Promega #V167A) and trypsin
(Promega #V5111), each at a 1:100 w/w enzyme:protein ratio. Peptides were
desalted using HLB extraction (Waters Oasis HLB 1cc, WAT094225) (102). 50
µg peptide were dried and resuspended in 100µL 100mM triethylammonium
bicarbonate (TEABC). Peptide concentrations were measured using an A205
nm assay with an external peptide standard curve.
4. TMT labeling
Tandem mass tag (TMT) 10-plex labeling (Thermo 90111) of renal cortical
digests was carried out according to manufacturer’s instructions. 50 µg peptide
in 100 µL 100 mM TEABC were added to each label tube. Labeled samples
were admixed, dried, and resuspended in 800 µL 0.1% v/v FA. Peptide
concentrations were measured using an A205 nm assay with an external peptide
standard curve. 200 µg peptide were fractionated by strong cation exchange

26
using 30-300 µg capacity SCX MacroSpin Columns (SMM HIL-SCX.25, Nest
Group, Inc. Southborough, MA, USA) according to manufacturer’s instructions.
Sample cleanup was performed using C18 PROTO, 300 Å Ultra Microspin
Columns (Nest Group, Inc., Southborough, MA, USA).
5. Liquid chromatography and tandem mass spectrometry
At the PBDC, liver digest samples were separated on a Dionex Acclaim
PepMap 100 75 μm x 2 cm nanoViper (C18, 3 µm, 100 Å) trap and Dionex
Acclaim PepMap RSLC 50 μM x 15 cm nanoViper (C18, 2 µm, 100 Å) separating
columns. An EASY n-LC (Thermo, Waltham, MA) UHPLC system was used with
buffer A = 2% (v/v) ACN/ 0.1% (v/v) FA and buffer B = 80% (v/v) ACN / 0.1%
(v/v) FA as mobile phases. Following injection of the sample onto the trap,
separation was accomplished with a 140 min linear gradient from 0% B to 50%
B, followed by a 30 min linear gradient from 50% B to 95% B, and lastly a 10 min
wash with 95% B. A 40 mm stainless steel emitter (Thermo, Waltham, MA; P/N
ES542) was coupled to the outlet of the separating column. A Nanospray Flex
source (Thermo, Waltham, MA) was used to position the end of the emitter near
the ion transfer capillary of the mass spectrometer. The ion transfer capillary
temperature of the mass spectrometer was set at 225°C, and the spray voltage
was set at 1.6 kV.
An Orbitrap Elite – ETD mass spectrometer (Thermo) was used to collect
data from the LC eluate. An Nth Order Double Play with ETD Decision Tree
method was created in Xcalibur v2.2. Scan event one of the method obtained an

27
FTMS MS1 scan for the range 300-2000 m/z. Scan event two obtained ITMS
MS2 scans on up to ten peaks that had a minimum signal threshold of 10,000
counts from scan event one. A decision tree was used to determine whether
collision induced dissociation (CID) or electron transfer dissociation (ETD)
activation was used. An ETD scan was triggered if any of the following held: an
ion had charge state 3 and m/z less than 650, an ion had charge state 4 and m/z
less than 900, an ion had charge state 5 and m/z less than 950, or an ion had
charge state greater than 5; a CID scan was triggered in all other cases. The
lock mass option was enabled (0% lock mass abundance) using the 371.101236
m/z polysiloxane peak as an internal calibrant.
TMT-labeled renal cortex tryptic digest SCX fractions underwent 1D-LC-
MS/MS analysis using a Proxeon EASY-nLC 1000 UHPLC and nanoelectrospray
ionization into an Orbitrap Elite mass spectrometer (Thermo) using a transfer
capillary temperature set of 225°C and the spray voltage of 1.6kV. An Nth Order
Double Play method was used with scan event one. An FTMS MS1 scan
(normal mass range; 60,000 resolution; full scan type) for the 400-2000 m/z
range was used, with charge state screening and monoisotopic precursor
selection enabled. Charge state rejection was enabled for unassigned charge
states and +1 charge states. The lock mass option was enabled (0% lock mass
abundance) using the 445.120028 m/z polysiloxane peak as an internal calibrant.
Scan event two obtained HCD FTMS MS2 scans (normal mass range; 60,000
resolution; centroid data type) on up to twelve peaks that had a minimum signal
threshold of 5,000 counts from scan event one. Dynamic exclusion was enabled

28
with a repeat count of one, a repeat duration of 60 seconds, an exclusion list size
of 500, an exclusion duration of 60 seconds, and an exclusion mass width of
±0.001% relative to reference mass (93).
6. Informatics
The hepatic ECM mass spectrometry data were analyzed at the University of
Louisville PBDC using Proteome Discoverer v1.4.0.288. The database used in
Mascot v2.4 and SequestHT searches was the 6/2/2015 version of the UniprotKB
Mus musculus reference proteome canonical and isoform sequences. +57 on C
(Carbamidomethylation) was selected as a fixed modification, and +1 on N (Asn-
>Asp) and +16 on MP (Oxidation) were selected as variable modifications. A
maximum of two missed cleavages were allowed. A Target Decoy PSM
Validator node was included in the Proteome Discoverer workflow in order to
estimate the false discovery rate (FDR).
The Proteome Discoverer analysis workflow allows for extraction of MS2
scan data from the Xcalibur RAW file, separate searches of CID and ETD MS2
scans in Mascot and Sequest, and collection of the results into a single file (.msf
extension). The resulting .msf files from Proteome Discoverer were loaded into
Scaffold Q+S v4.3.2. Scaffold was used to calculate the FDR using the Peptide
and Protein Prophet algorithms. Protein identification probability of the
sequences was set to >95% on the software. The results were annotated with
mouse GO information from the Gene Ontology Annotations Database.
29
Renal cortex mass spectrometry data were analyzed at the University of
Louisville PBDC using Proteome Discoverer v1.4.0.288 and Scaffold Q+S v4.3.2
with the 6/2/2014 version of the UniprotKB Mus musculus reference proteome
canonical and isoform sequences. A Target Decoy PSM Validator node was
used to control the FDR and a Reporter Ions Quantifier node was included for
quantification of the TMT reporter ions considering TMT purity correction factors
obtained from the manufacturer. Intensity based normalization of reporter ions
was achieved using the mean calculation type, modeled on unique peptides, and
using an average protein reference. Scaffold was used to calculate the FDR
using the Peptide and Protein Prophet algorithms.
C. Immunoblots
1. Dot blot
Liver samples from the chronic EtOH model were homogenized in
radioimmunoprecipitation assay (RIPA) buffer containing protease and
phosphatase inhibitor cocktails (Sigma; St. Louis, MO). 10 μg protein in 100 μl
RIPA buffer were loaded onto nitrocellulose membranes (GE Healthcare) using a
vacuum-assisted microfiltration system (Bio-Dot; Bio-Rad, Hercules, CA). The
membrane was blocked for one hour with 5% non-fat milk in TBST. Primary
antibodies against collagen type I α1 (Meridian T40777R) and GAPDH (Santa
Cruz SC-25778) were used. Densitometric analysis was performed using UN-
SCAN-IT gel (Silk Scientific Inc., Orem, Utah) software.

30
2. Western blot
Renal cortex immunoblot was carried out as described previously (103) using
a primary antibody against Cat (Cell Signaling D5N7V). Densitometry of
exposed film was analyzed using the ImageJ software (ImageJ, NIH,
http://rsb.info.nih.gov/ij/).
D. Transcriptomics
1. RNA isolation
Snap frozen renal cortex sections were stored at -80° C and then incubated in
RNAlater-ICE (Life Technologies, Carlsbad, CA) at -20° C for 72 hours prior to
RNA extraction. RNA was isolated using the mirVana kit (Life Technologies,
Carlsbad, CA) according to manufacturer’s instructions for total RNA isolation.
RNA quality was evaluated by Nanodrop ND-1000 (Thermo Fisher Scientific,
Grand Island, NY) and Agilent 2100 Bioanalyzer (Agilent, Santa Clara, CA)
analysis. Ribosomal depletion was carried out at the University of Louisville
Center for Genetics and Molecular Medicine (CGeMM) prior to RNA seq
analysis.
2. RNA sequencing
RNA libraries were prepared using the TruSe Stranded Total RNA LT
sample preparation Kit- Set A with Ribo-Zero Gold. Sequencing was performed
on the University of Louisville CGeMM’s Illumina NextSeq 500/550 75 cycle High
Output Kit v2.

31
3. RNASeq data analysis
RNA Seq data were analyzed at the University of Louisville CGeMM using
the Tuxedo suite data analysis pipeline. Differentially expressed transcripts were
identified by filtering by analysis of variance (ANOVA) p-value cutoff (p<0.05), a
more stringent Benjamini-Hochberg (BH) q-value cutoff (q<0.01) and FC cutoffs
of 1.2 (to explore pathways analysis) and 2 (to address larger changes in RNA
expression).
E. Histology and Immunohistochemistry
1. Histology
In the Arteel laboratory, paraffin-embedded, formalin fixed liver sections from
the CCl4 study were stained with Sirius Red/Fast Green to visualize fibrosis (96).
Paraffin-embedded, formalin fixed renal cortex sections from the chronic
EtOH study were periodic acid-Schiff (PAS) stained (103) in collaboration with
Dr. Michelle Barati. Blinded histology was reviewed by a fellowship-trained,
board certified pathologist. It was determined that there were no differences
between groups, and so staining was not quantified.
2. Immunohistochemistry
In collaboration with Dr. Michelle Barati, immunohistochemistry (IHC) was
carried out on renal cortex sections using a primary antibody against
myeloperoxidase (Mpo, Abcam ab9535) and catalase (Cat, Cell Signaling

32
D5N7V) (103). Mpo staining was quantified as average number of Mpo positive
cells per visual field (40x) with an average number of 33 ± 4 visual fields per
kidney section. An n of 3 samples in each experimental group were analyzed.
Differences between groups were determined by 2-way ANOVA and post-hoc t-
tests.
F. Clinical chemistry
1. Blood urea nitrogen analysis
Blood urea nitrogen (BUN) in mouse plasma from the chronic and
chronic+binge EtOH studies was measured using the Urea Assay Kit (Abnova
KA1652) according to manufacturer’s instructions.
G. Clinical study
1. Study participants
Plasma samples and clinical data from the following study were provided
through collaboration with Dr. Craig McClain and Dr. Vatsalya Vatsalya. This
study was approved by the Institutional Review Boards at all the participating
centers. This study was a part of a large national multisite clinical trial indexed at
clinicaltrials.gov: NCT01922895 and NCT01809132. All moderate and severe AH
patients were enrolled at the University of Louisville, the University of
Massachusetts Medical School, the University of Texas-Southwestern and the
Cleveland Clinic. All AUD (“mild”) patients were enrolled at NIAAA, NIH. All
healthy volunteers were recruited at the Louisville site. All AH patients were

33
diagnosed using clinical and laboratory criteria described by the NIAAA
consortium on AH (104). Individuals with or without liver injury met the criteria for
AUD based on DSM 4 XR or DSM 5 manual. All healthy participants were free of
any clinically diagnosed disease (liver or organ systems) that might contribute to
altered laboratory values in comparison analyses. All patient specimens and
data were analyzed at the University of Louisville.
2. Inclusion criteria
Eligible participants were 21 years old or older. The following individuals
were ineligible for participation 1) those unwilling or unable to provide informed
consent; and/or 2) those who had significant comorbid conditions (heart, kidney,
lung, neurological or psychiatric illnesses, sepsis) and/or active drug abuse;
and/or 3) pregnant/lactating women; and/or 4) prisoners or other vulnerable
persons.
3. Study paradigm
112 adult male and female individuals participated in this NIH-funded study.
This investigation was a single time point assessment of patients between the
study cohorts. The cohorts included healthy participants (n=7), patients with
AUDs (“mild” , MELD<12; n=45), patients with “moderate” AH (MELD=12-19;
n=23), patients with “severe” AH (>19; n=37). The mild/AUD group was both
analyzed as whole and also as sub-groups without liver injury (“mild-A”, serum
alanine aminotransferase (ALT)<40, n=14) and with liver injury (“mild-B”,

34
ALT≥40, n=31). Informed consent was obtained from all study participants
before collection of data and bodily samples. Clinical data, relevant medical
history, measures of severity of ALD, and drinking history [using the Alcohol Use
Disorders Identification Test (AUDIT) (105) (only in moderate and severe AH
patients) and lifetime drinking history (LTDH) in all AH and AUD patients (106)
were collected. The study was designed to analyze plasma peptides for
comparison between healthy volunteers, AUD patients (with or without liver
injury), patients with moderate AH, and patients with severe AH for potential
associations between parameters. All data collected from the enrolled study
participants were de-identified, coded, and analyzed.
4. Collection of clinical data
Clinical data include participant demographics [age, sex, body mass index
(BMI)], drinking history (AUDIT and LTDH), medical assessments at admission
(after obtaining consent, specific for the study to exclude any condition that might
affect liver tests), and medical history. Confirmatory tests for AH (laboratory and
imaging), and markers of liver disease severity [Child-Turcotte-Pugh (CTP),
MELD, Maddrey DF] were also obtained. Laboratory tests included a
comprehensive metabolic profile with indices of liver injury [including serum ALT),
aspartate aminotransferase (AST), total bilirubin (Tbili)] and coagulation.
5. Plasma collection

35
Blood samples were collected from each study participant following consent.
Blood was collected in lavender- top Vacutainer tubes containing K3 EDTA.
Blood was separated by centrifugation, and plasma was apportioned into 1 mL
aliquots and stored at -80 °C until use. Freeze-thaw cycles were avoided to
maintain the integrity of the plasma.
H. Peptidomics
1. Peptidomic workflow optimization
During workflow optimization, peptides were purified by ACN precipitation.
100 µL plasma were acidified with 100 µL 10% v/v acetic acid. To precipitate
proteins and impurities, 600 µL 99.9% v/v ACN / 0.1% v/v trifluoroacetic acid was
added to each sample, on ice. Samples were vortexed for 30 seconds, and
precipitate was pelleted by centrifugation at 15,000 × g for 15 minutes at 4 °C.
Pellets were discarded. Supernatants were collected and centrifuged again as
before. Again, supernatants were collected, and pellets were discarded.
Samples underwent cleanup and LC-MS/MS analysis as described in
sections 3 and 4. The LC-MS/MS analysis determined that the purity of the
peptide samples was unsatisfactory for the relative quantification of peptide
abundance. For this reason, the ACN precipitation method was abandoned. The
trichloroacetic acid (TCA) precipitation approach developed by Parker et al,
described below, was adopted (107). Parker et al. demonstrated that TCA
precipitation yields more peptides compared to ACN precipitation, acetone
precipitation, and size-exclusion 10 kDa MWCO filtration.
36
2. Plasma peptide purification
To avoid systematic bias, the plasma samples were handled as four sample
flights (flight 1-4), each composed of balanced proportions of all groups with the
sample order interwoven into a randomized fashion. Total plasma peptides were
purified by TCA precipitation based on Parker et al. (107). 100 µL PBS with K3
EDTA was added to 100 µL plasma. Samples were mixed and incubated at RT
for 5 minutes. Samples were placed on ice, and 200 µL 20% w/v TCA (prechilled
to 4 °C) were mixed into each sample. Samples were allowed to incubate for 1
hour on ice. Precipitate was pelleted by centrifugation at 16,000 × g for 10
minutes at 4 °C; pellets were discarded. Supernatant collection, centrifugation
and discarding of pellets was repeated twice to ensure efficient removal of high
molecular weight proteins.
3. Peptide sample cleanup and preparation for liquid chromatography
and mass spectrometry
275 µL of each sample was desalted and concentrated using solid phase
extraction (Waters Oasis HLB µElution 30 µm plate, part no. 186001828BA) as
previously described by Keshishian, et al. (102). Solid phase extraction eluates
were dried in a rotary evaporator, and dried peptides were resuspended in 25 µL
2% v/v ACN/ 0.1% v/v FA. Peptide concentrations were measured by
absorbance at 250 nm.

37
4. Liquid chromatography and tandem mass spectrometry
A high mass accuracy approach was used for relative quantification of plasma
peptides isolated from AH patients, AUD patients with and without liver injury,
and healthy volunteers plasma samples using a label-free approach. Peptides
were prepared to a concentration of 0.1 µg/µL in 2% v/v ACN/ 0.1% v/v FA. A
commercial mixture of 11 synthetic peptides (iRT1-11, Biognosis USA, Beverly,
MA) eluting across the chromatographic retention time spectrum were spiked into
each sample following peptidome resuspension. Peptides were separated by
reverse phase chromatography on a Proxeon EASY-nLC 1000 UHPLC system.
2 µL (0.2 µg) of each peptide sample was injected in random order. The trap
column used was a 75µm i.d. x 2cm Acclaim PepMapTM 100 nanoViper
cartridge packed with C18, 3µm, 100Å material(Thermo); the separating column
used was a 75µm i.d. x 50cm Acclaim PepMap RSLC nanoViper column packed
with C18, 2µm, 100Å material (Thermo). The separation was performed with a
gradient of solvent A = 2% v/v ACN / 0.1% v/v FA and solvent B = 80% v/v ACN /
0.1% v/v FA. After loading the sample onto the trap for 6min at 2µL/min in
solvent A, the sample was eluted and separated at 250nL/min with a gradient
from 0% to 55% solvent B over 165min. Following the gradient, the columns
were washed at 300nL/min for 10min with 95% solvent B and then returned to
initial conditions.
Liquid chromatography eluate was analyzed with an Orbitrap Elite mass
spectrometer with nanoelectrospray ionization. An Nth Order Double Play was
created in Xcalibur v2.2. Scan event one of the method obtained an FTMS MS1
38
scan (normal mass range; 240,000 resolution, full scan type, positive polarity,
profile data type) for the range 300-2000m/z. Scan event two obtained ITMS
MS2 scans (normal mass range, rapid scan rate, centroid data type) on up to
twenty peaks that had a minimum signal threshold of 5,000 counts from scan
event one. The lock mass option was enabled (0% lock mass abundance) using
the 371.101236m/z polysiloxane peak as an internal calibrant.
I. Informatics
1. Liver ECM proteomic data analysis
Hepatic protein enrichment was quantified using total ion current (TIC).
Within Scaffold, proteins were filtered for extracellular GO annotation. The NaCl,
SDS, GnHCl, and pellet fractions contained 89, 63, 84, and 46 extracellular
proteins, respectively. Additional analysis was only performed on these proteins
that were classified as extracellular by GO annotation. The extracellular proteins
were further categorized into four classes based on their role in the extracellular
space as determined by a comprehensive literature search. These four ECM
groups include class 1) glycoproteins and proteoglycans, class 2) other ECM-
associated proteins, class 3) proteases and protease inhibitors, and class 4)
collagens. If no record could be found supporting the hypothesis that a protein
was associated with the ECM, the protein was placed into (5), other proteins.
2. Renal cortex proteomic data analysis

39
Renal cortex data were filtered by BH corrected ANOVA p-value <0.05 and
fold change (FC) ≥ 1.2. Ingenuity Pathways Analysis (IPA) was used to identify
pathways changed by EtOH, LPS, and/or the combination. The PANTHER web
application was used to identify statistically overrepresented GO cellular
compartments in groups of proteins that were significantly regulated by EtOH,
LPS, and EtOH + LPS compared to control. The statistical overrepresentation
test was carried out for (A) GO cellular component complete, (B) within each
cellular compartment, and (C) for GO biological process complete and with
Bonferroni correction using default settings.
3. Multivariate analysis of renal cortex proteomic and transcriptomic
data sets
Hierarchical clustering of the top-20 GO biological process terms for the
proteomic and the transcriptomic data sets were conducted using the
Heatmapper web application (www.heatmapper.ca). Data were clustered using
an average linkage method and a Spearman Rank Correlation distance
measurement method.
4. AH plasma peptidome data analysis
Peptide spectra collected in a data dependent fashion were interpreted using
a de novo spectrum assignment approach that enabled shotgun analysis of
peptide post-translational modification. The AUC for high resolution extracted ion
chromatograms were used as a label-free relative quantification of the peptide

40
abundances. Quantitative and qualitative feature data were extracted and
analyzed using PEAKS Studio (v8.5). Data were normalized to TIC. The
following data analysis was done in collaboration with Dr. Shesh Rai and Dr.
Sudhir Srivastava. There were 1730 peptides initially. In each group, a peptide
was discarded if all observations were missing. Therefore, peptides having at
least one observation across all samples in each group were retained for further
analysis. After this filtering, 1273 peptides remained. Data were normalized by
taking log base 2 of raw data followed by quantile normalization using
“normalize.quantiles” function (108) available in R package “preprocessors”.
Missing values were imputed using the “SVD” (109) method under the
assumption of MAR. The R package “imputeLCMD” was used for imputing the
missing values. We used the imputed data for further analysis (see section J2).
J. Statistics
1. Statistical analysis of liver ECM proteomic data
Heat maps were compiled in the Arteel laboratory by Dr. Shanice Hudson in
the open-source statistical programming language R (R Development Core
Team. R: A language and environment for statistical computing.Vienna, Austria:
R Foundation for Statistical Computing, 2008.). ECM proteome output as Log2
FC of control was analyzed with the heatmap.2 function of the gplots package,
using the methods described by Key et al. (110) Pearson’s correlation coefficient
was used to measure distance, and the Ward method (ward.D) was the
agglomeration method for row and column clustering. In addition, protein

41
distribution patterns across the four treatment groups were clustered using
hierarchical clustering (function hclust within R package cluster) (Cluster analysis
basics and extensions: R package version [computer program]. Version 1.15.3
2014). Patterns were clustered separately for each fraction, and the optimal
number of clusters was determined using a combination of statistical measures
(R package clValid) (Brock G, Pihur V, Datta S, Datta S. clValid: An R package
for cluster validation. Journal of Statistical Software 2008;25:1-22.) and biological
interpretability. Since interest was in the pattern of abundance across the
treatment groups, abundance values for each protein were standardized to mean
zero and standard deviation one for each protein prior to clustering.
2. Statistical analysis of alcoholic hepatitis plasma peptidomic data
Statistical analyses of the peptidomic data were carried out in collaboration
with Dr. Shesh Rai and Dr. Sudhir Srivastava. A non-discriminant data reduction
method termed principal components analysis (PCA) was used to evaluate the
data at the patient level and determine the ability of the data to ‘self-sort’ into
discrete groups. To evaluate the data more discretely at the peptide level, a
multivariate analysis approach using hierarchical clustering and heat-map
annotation was used incorporating linear mixed modeling of the data to control
for fixed and random variables. Lastly, univariate (pair-wise t-tests with
Benjamini-Hochberg correction for multiple comparisons) were used to establish
differences in peptide groups and individual peptides across patient cohorts.
Peptide abundance differences were plotted as log2FC versus –log10 BH-

42
corrected p-value. Peptides with BH-corrected p-value < 0.05 and log2FC ≥ 1
were considered significantly upregulated, and peptides with BH-corrected p-
value <0.05 and log2FC ≤ -1 were considered significantly downregulated. The
Tukey's HSD test was used for all pairwise comparisons. Pairwise comparisons
were illustrated for the major comparators of: A. Healthy vs. Mild-A, B. Healthy
vs. Mild-B, C. Healthy vs. Moderate, D. Healthy vs. Severe, E. Mild-A vs Mild-B,
F. Moderate vs. Severe. Prior to statistical comparisons, these data were
adjusted for (a) random effects by correcting in a sample dependent fashion to
iRT peptide AUCs and sample flight number and (b) fixed effects by correcting
for age and sex. The peptides demonstrating differential abundance (regulated)
in the pair-wise t-testing (BH-corrected p-value <0.05) were aggregated and
filtered using the Matrix Annotator (http://matrisomeproject.mit.edu/analytical-
tools/matrisome-annotator/) by GO assignment for ECM. The identification of
regulated ECM peptides common to all or unique between AH, AUD, and healthy
control groups were determined graphically (regulated ECM peptidome).
3. Statistical analysis of renal cortex proteomic and transcriptomic data
Statistical analyses of proteomic and transcriptomic data used one-way
ANOVA and post-hoc t-tests corrected for multiple comparisons by the method of
Benjamini-Hochberg, and a corrected p-value (q-value) of less than 0.05 was
considered significant. Analysis of immunoblot data used two-way ANOVA to
determine interaction effects of diet (EtOH) and treatment (LPS) with post-hoc t-
test to determine significance of differences between group means with a p-value

43
≤ 0.05 considered significant. Statistical analyses used to determine significance
of proteins or genes with canonical pathways, gene ontological associations, and
pathway clustering were as embedded within Ingenuity Pathways Analyses
(analysis.ingenuity.com), MetaCore (genego.com), Gene Ontology/GO
(patherdb.org) and Heatmapper (heatmapper.ca).

44
CHAPTER III
THE HEPATIC “MATRISOME” RESPONDS DYNAMICALLY TO INJURY:
CHARACTERIZATION OF TRANSITIONAL CHANGES TO THE
EXTRACELLULAR MATRIX IN MICE1
A. Introduction
Although the structural role of the ECM is well known, this compartment
contains a diverse range of components that work bidirectionally with
surrounding cells to create a dynamic and responsive microenvironment. This
microenvironment, in turn, regulates cell and tissue homeostasis. ECM
components are directly involved in signaling through interactions with cell-
surface receptors. The ECM also indirectly impacts cell-to-cell communication by
binding and retaining soluble mediators, including cytokines, chemokines, and
growth factors (18). Proteases and protease inhibitors interact with the ECM to
maintain homeostasis or respond to stress or injury.(21) A broader definition of
the ECM proteome (i.e., “‘matrisome”‘) has been established to encompass not
1 Published in 93. Massey VL, Dolin CE, Poole LG, Hudson SV, Siow DL, Brock GN, Merchant ML, Wilkey DW, Arteel GE. The hepatic "matrisome" responds dynamically to injury: Characterization of transitional changes to the extracellular matrix in mice. Hepatology. 2017;65(3):969-82. Epub 2016/12/31. doi: 10.1002/hep.28918. PubMed PMID: 28035785; PMCID: PMC5319876. Reprint with permission.

45
only fibrillar ECM proteins, but also the proteins that contribute to the
homeostasis of the ECM proteome.(18)
In some contexts, changes to the ECM are well recognized and understood;
for example, the formation of collagenous scars in tissue is almost a canonical
response to unresolved chronic injury. Hepatic fibrosis (HF) is a well-known
example of this scarring process,(45) given that fibrotic livers develop easily
detectable collagenous scars. Given the dominance of these changes in the
hepatic ECM during fibrogenesis, many studies have focused on the
mechanisms that underlie the increases in collagen deposition. However, the
alterations of the hepatic ECM during fibrosis are much more diverse than simply
an increase in collagen. Indeed, fibrosis is characterized by changes in the
deposition and distribution of a myriad of other ECM proteins (e.g., laminin and
vitronectin).(111) Whereas many of these changes are described, there are still
gaps in our understanding. Specifically, the magnitude and impact of these
changes on overall liver (dys)function are incompletely understood at this time.
ECM remodeling limited to chronic fibrogenesis, but also plays a role in early
injury responses; the wound-healing response is a well-known example of this.
The term “transitional tissue remodeling” describes changes to the ECM that do
not alter the overall architecture of the organ (Fig. 3.1A). For example, changes
in the hepatic abundance of ECM proteins, such as fibronectin(90) and fibrin,(89,
112) have been observed in models of hepatic inflammation. Importantly,
blocking these ECM changes blunts, at least in part, hepatic injury in these
models. Therefore, transitional changes to the ECM may contribute to early

46
disease initiation and/or progression before the onset of fibrogenesis (Fig. 3.1A).
The nature, breadth, and magnitude of these ECM changes are currently poorly
understood. A better understanding could forward new mechanisms and/or
biomarkers for diseases.
Although previous studies have shown that subtle changes in the ECM
may contribute to the development of inflammatory liver injury, the research in
this area has generally been restricted to study of single ECM proteins (e.g.,
fibrin). (89, 112) A proteomic approach was hindered by the challenges of low
abundance and insolubility of many ECM proteins, until the recent development
of a new method. This method involves a sequential protein extraction using
increasingly rigorous solubilization buffers along with LC-MS/MS analysis.(92,
99, 113) The sequential extraction was specifically designed to enrich and
characterize ECM proteins in solid organs. This approach also potentially
accounts for proteins that can exist in different solubility states, based on
posttranslational modifications (e.g., cleavage, cross-linking, and degradation).
The goals of the current study were 2-fold: (1) to characterize the sequential
extraction method for hepatic matrisome and (2) to compare the impact of
inflammatory liver injury (before fibrosis) on the hepatic matrisome.
B. Experimental Procedures
1. Animals and exposures
Mice were exposed to CCl4 as described in Chapter II. Mice were exposed to

47
Figure 3.1: Scheme of transitional ECM changes and extraction methodology.
Remodeling in response to chronic injury (i.e., fibrosis) is well known; however,
the hepatic ECM also responses dynamically to acute stress. These acute
responses can be viewed as an arm of the wound‐healing response and facilitate
recovery from damage, which resolves once the damage is repaired. However,
under conditions of chronic injury, these changes contribute to activation of a
significant remodeling response that leads to scar formation (i.e., fibrosis).

48
NaCl GnHClSDS
Tissue
sample
Pellet
Loosely bound
ECM proteinsFibrillar ECM proteins
Crosslinking and ‘age’
Healthy Liver
ECM
Homeostasis
Acute InjuryTransitional ECM
Inflammation
Injury
Injury Resolution
Chronic InjuryFibrotic ECM
A
B

49
ethanol and/or LPS also as described in Chapter II. 6 control mice, 5 ethanol
mice, 6 24h LPS mice, and 4 ethanol+24h LPS mice were used for the hepatic
matrisome analysis.
2. Three-step ECM extraction
Liver tissue was submitted to a 3-step extraction process that allows
sequential isolation of loosely-bound extracellular proteins, cellular proteins,
tightly bound extracellular proteins, and highly crosslinked, insoluble proteins to
be differentially separated as described in Chapter II.
3. Sample cleanup and preparation for liquid chromatography and
mass spectrometry
Liver tissue extracts were prepared for LC-MS/MS analysis as described in
Chapter II.
4. Liquid chromatography and mass spectrometry
Liver tissue extracts underwent LC-MS/MS analysis as described in Chapter
II.
5. Data analysis
LC-MS/MS data were analyzed as described in Chapter II.
6. Statistical analysis

50
Statistical analysis was performed as described in Chapter II.
C. Results
1. Analysis of changes to the ECM proteome caused by CCl4-induced
hepatic fibrosis
Previous studies have investigated the matrisome profile for aortic vessel and
cardiac tissue (99, 114). However, this method has never been employed for
liver tissue. The first objective of this work was to validate this multi-step
extraction and proteomic analysis of the hepatic matrisome; toward this end, a
model that causes robust changes to the hepatic ECM (i.e., fibrosis) was used.
Specifically, the impact of 4 weeks of CCl4 exposure (see Experimental
Procedures) on the ECM proteome was determined (Fig. 3.2). As expected,(96)
CCl4 exposure caused robust ECM deposition that was easily detected with
standard collagen staining (Sirius Red/Fast Green; Fig. 3.2A), dot blot, and
hydroxyproline content (Fig. 3.2B). The proteomic approach reinforced an
increase in collagen 1α1 abundance with CCl4 (Fig. 3.2C). Additionally, the
proteomic approach demonstrated that CCl4 exposure also increased abundance
of collagens type III, IV, and V (Fig. 3.2C).
Proteomic analysis is typically carried out on total protein extracts, as
opposed to extracts from multi-step fractionation. To simulate this approach,
qualitative proteomic data from the different fractions (see Experimental
Procedures) were pooled. The majority of ECM proteins were detected in
extracts of livers of both naïve and CCl4‐exposed mice. Specifically, CCl4

51
Figure 3.2: Validation of extraction technique with CCl4 model of fibrosis.
Animals were injected with CCl4 or vehicle for 4 weeks. Collagen type I
accumulation was determined by Sirius Red staining (A) and by dot blot (control
n=4, CCl4 n=4) and hydroxyproline content (control n=4, CCl4 n=6) (B).
Quantitative changes in other collagens were also determined in the ECM
extraction fractions (control n=1 pooled sample of 6, CCl4, 1 pooled sample of 5)
(C). Abbreviations: COL, collagen; GAPDH, glyceraldehyde 3‐phosphate
dehydrogenase.
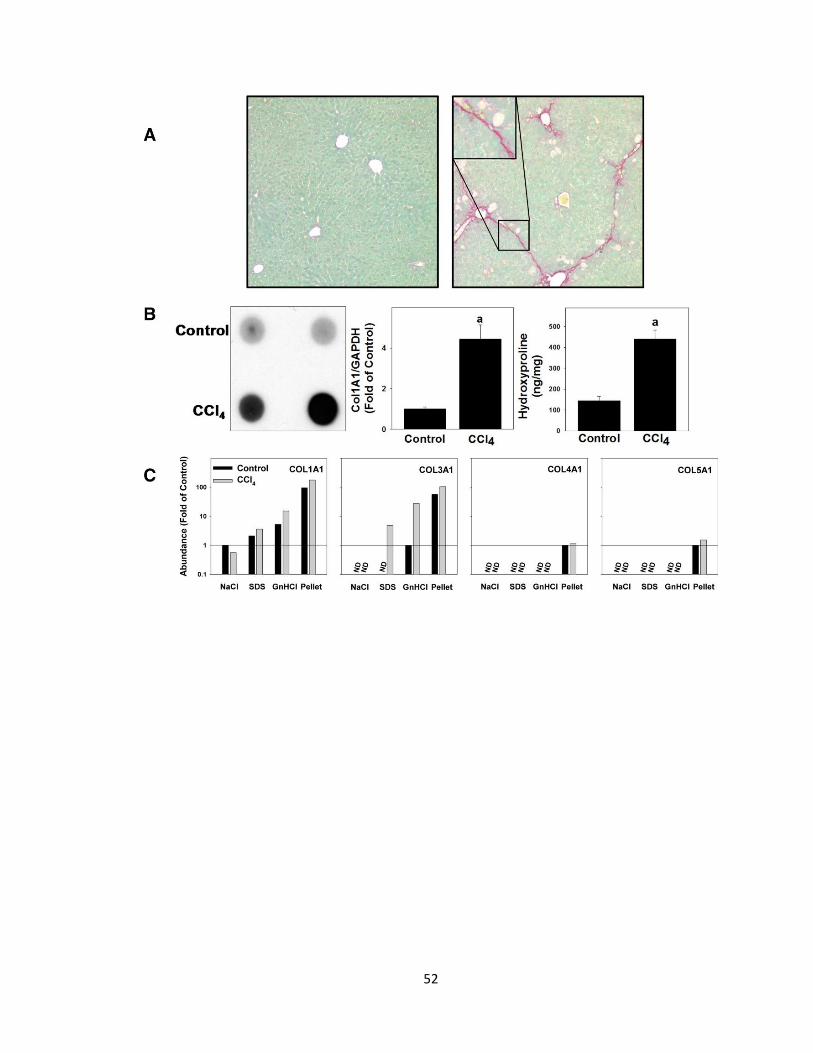
52

53
exposure increased the number of ECM proteins by 7, and only one protein was
lost compared to the control group (data not shown). These data indicate that,
when analyzed as a whole, there are few qualitative changes (i.e.,
disappearance or appearance of proteins) in the hepatic matrisome, even under
conditions of significant histological ECM changes (e.g., fibrosis; Fig. 3.2A).
2. Ethanol and LPS exposure cause global changes to the hepatic
matrisome
After validation of the multi-step extraction method with CCl4‐challenged livers
(Fig. 3.2), a more detailed analysis of the effects of ethanol and LPS was carried
out. Figure 3.3A shows a heatmap comparing the quantitative changes in the
ECM proteome between the four exposure groups (±ethanol diet, ±LPS injection)
after fractions were combined ‘in silico’; the most up‐regulated or down‐regulated
ECM proteins were used to compare the groups. Heatmap visualization of the
ECM proteomes demonstrates distinct segregation between the control group
and exposure groups, with ethanol and LPS exposure groups producing varying
patterns; ethanol + LPS produced patterns similar to both exposures alone, but
also demonstrated unique patterns (Fig. 3.3A). However, similar to the CCl4
qualitative analysis (see above and Fig. 3.2), ethanol and/or LPS caused only a
small number of proteins to change qualitatively.
3. Three-step serial extraction creates distinct protein profiles

54
Figure 3.3: Liver extracts have unique protein profiles based on fraction type and experimental group. A heatmap depicting quantitative changes to the total ECM proteome in response
to ethanol or LPS is shown in (A). The number of proteins unique to, or shared
by, all four extractions of pair-fed animals is shown (B). Bubble graphs are used
to show presence of plasminogen, Annexin A1 and fibrin(ogen) gamma chain
across the four extracts (x-axis) and the four experimental groups (y-axis; C).

55

56
ECM proteins are not only regulated at the level of de novo synthesis, but
also at the level of enzymatic activation, degradation, and crosslinking. To gain
insight into protein location and structure, previous studies have used a three‐
step ECM extraction method (Fig. 3.1B) in other organs. (99, 114) Here, that
same approach was adapted for use with liver tissue. In the first step of this
extraction, NaCl extraction solubilizes loosely bound proteins by displacing
polyionic interactions. (115) Following NaCl extraction, the remaining liver tissue
was decellularized using 1% sodium dodecyl sulfate (SDS). SDS solubilizes
cytoplasmic and nuclear membranes, thereby releasing cellular proteins.
Insoluble matter remaining after the decellularization then underwent extraction
with a denaturing 4 M GnHCl buffer.(116) Following the denaturing extraction,
an insoluble pellet enriched in heavily cross‐linked matrix proteins
remained.(114) Fig. 3.3B shows a qualitative comparison of the four extracts of
ECM proteins from control animals. Each extract yielded a distinct ECM protein
profile consisting of not only ECM proteins that were shared among all four
extracts, but also proteins unique to specific extracts (Fig. 3.3B). Analysis of the
CCl4 extracts for collagen isoforms (Fig. 3.2C) indicated that, as expected, these
proteins tended to accumulate in the later extraction fractions. These results
indicate that the extraction approach effectively separated ECM proteins.
When ECM proteins were compared between experimental groups,
interesting patterns of distribution across the extracts were revealed (Table 3.1);
representative examples of some of these patterns are shown in Fig. 3.3C. For
example, some proteins (e.g., plasminogen) changed in overall “presence” or

57
Table 3.1: Qualitative presence of ECM proteins in sample extracts
Protein name Accession
Number MW
(kDa) ECM function Ref Presence of protein
Proteoglycans and glycoproteins
Con EtOH LPS EtOH +LPS
Alpha-1-acid glycoprotein 1 A1AG1_MOUSE 24 Acute phase serum protein (201) NaCl █ █ █
SDS
GnHCl
Pellet
Alpha-2-HS-glycoprotein FETUA_MOUSE 37 Inhibitor of ECM mineralization (202) NaCl █ █ █ █
SDS
GnHCl █ █ █ █
Pellet
Arylsulfatase A ARSA_MOUSE 54 ECM structure (203) NaCl █
SDS
GnHCl
Pellet
Beta-2-glycoprotein APOH_MOUSE 39 Coagulation, phospholipid binding
(204) NaCl
SDS
GnHCl █ █ █ █
Pellet
Biglycan PGS1_MOUSE 42 Regulation of collagen fibril formation, ECM-cell interactions
(205) NaCl
SDS
GnHCl █ █ █ █
Pellet
Corneodesmosin CDSN_MOUSE 54 Adhesive protein (206) NaCl
SDS
GnHCl
Pellet █ █
Cysteine-rich with EGF-like domain protein 2
CREL2_MOUSE 38 Extracellular protein heavily glycosylated. ECM function unknown
(207) NaCl █ █ █ █
SDS
GnHCl █ █ █ █
Pellet

58
Decorin PGS2_MOUSE 40 ECM-cell interactions, ECM assembly
(208) NaCl
SDS
GnHCl █ █ █ █
Pellet
Dermatopontin DERM_MOUSE 24 ECM-cell interactions, ECM assembly
(209) NaCl
SDS
GnHCl █ █ █ █
Pellet
Dystroglycan DAG1_MOUSE 97 Matrix organization, basement membrane assembly
(210) NaCl █ █ █ █
SDS
GnHCl █ █ █
Pellet
Fibrinogen alpha chain E9PV24_MOUSE 87 Hemostasis, cell signaling (fibrin(ogen) alpha chain)
(211) NaCl █ █
SDS █ █
GnHCl █ █ █
Pellet █
Fibrinogen beta chain FIBB_MOUSE 55 Hemostasis, cell signaling (211) NaCl █ █ █
SDS
GnHCl
Pellet
Fibrinogen gamma chain FIBG_MOUSE 49 Hemostasis, fibrinogen polymerization
(212) NaCl █ █ █
SDS █ █
GnHCl █ █ █ █
Pellet █ █
Fibronectin FINC_MOUSE 273 Scaffolding, ECM organization, regulation of ECM-cell interactions
(213) NaCl
SDS
GnHCl █ █ █ █
Pellet
Galectin-1 LEG1_MOUSE 15 Matrix crosslinking, matrix organization
(214) NaCl █ █ █
SDS █
GnHCl █ █ █ █
Pellet
Galectin-3-binding protein LG3BP_MOUSE 64 Cell-matrix adhesion (215) NaCl █ █ █ █
SDS █ █ █
GnHCl █ █ █
Pellet

59
Granulins GRN_MOUSE 63 Cell-matrix signaling (216) NaCl █ █ █ █
SDS █ █ █ █
GnHCl █ █ █ █
Pellet
Haptoglobin HPT_MOUSE 39 Inhibition of collagen degradation, cell migration
(217) NaCl █ █ █ █
SDS █ █ █ █
GnHCl █ █ █ █
Pellet █ █ █
Insulin-like growth factor-binding protein 2
IBP2_MOUSE 33 Binding/retainment of ILGF in the extracellular space
(218) NaCl
SDS
GnHCl █ █
Pellet
Insulin-like growth factor-binding protein 4
IBP4_MOUSE 28 Binding/retainment of ILGF in the extracellular space
(218) NaCl
SDS
GnHCl █ █
Pellet
Keratin, type I cytoskeletal 13 K1C13_MOUSE 48 Cell-matrix adhesion, cell migration
(219) NaCl █ █
SDS
GnHCl
Pellet █
Leucine-rich HEV glycoprotein
Q91XL1_MOUSE 37 Cell-matrix adhesion (220) NaCl █ █
SDS
GnHCl
Pellet
Lumican LUM_MOUSE 38 Regulation of collagen fibril formation
(221) NaCl
SDS
GnHCl █ █ █ █
Pellet █ █ █
Microfibrillar-associated protein 5
MFAP5_MOUSE 18 Elastic fiber assembly, binding of fibrillin-1 and fibrillin-2
(222) NaCl
SDS
GnHCl █ █
Pellet
Fibrinogen alpha chain E9PV24_MOUSE 87 Hemostasis, cell signaling (fibrin(ogen) alpha chain)
(211) NaCl █ █
SDS █ █
GnHCl █ █ █
Pellet █

60
Ribonuclease inhibitor RINI_MOUSE 50 Extracellular inhibitor of angiogenin which can degrade BM
(223) NaCl █
SDS
GnHCl
Pellet
Sulfated glycoprotein 1 SAP_MOUSE 61 Cell survival, cell signaling (224, 225)
NaCl
SDS █ █ █ █
GnHCl █ █ █ █
Pellet █ █ █ █
Syndecan-4 SDC4_MOUSE 21 ECM organization, signal transduction, cell adhesion
(226) NaCl █ █ █
SDS █ █ █ █
GnHCl █ █ █ █
Pellet
Tubulointerstitial nephritis antigen-like
TINAL_MOUSE 52 Protein binding - fibronectins, collagens
(227) NaCl █ █ █ █
SDS
GnHCl █ █ █
Pellet
Vitronectin VTNC_MOUSE 55 ECM-cell signal transduction, cell adhesion
(228) NaCl █ █ █ █
SDS
GnHCl █ █ █
Pellet
Other ECM-associated proteins
Con EtOH LPS EtOH +LPS
14-3-3 protein epsilon 1433E_MOUSE 29 Protein binding (229) NaCl █ █ █ █
SDS
GnHCl
Pellet █
14-3-3 protein gamma 1433G_MOUSE 28 Protein binding (229) NaCl █ █ █ █
SDS
GnHCl █ █ █
Pellet
14-3-3 protein sigma 1433S_MOUSE 28 Protein binding (229) NaCl
SDS
GnHCl
Pellet █ █

61
14-3-3 protein zeta/delta 1433Z_MOUSE 28 Protein binding (229) NaCl █ █ █ █
SDS █ █ █
GnHCl
Pellet █
Actin, cytoplasmic 1 ACTB_MOUSE 42 Cortical cytoskeleton (230, 231)
NaCl █ █ █ █
SDS █ █ █ █
GnHCl
Pellet █ █ █ █
Actin, cytoplasmic 2 ACTG_MOUSE 42 Cortical cytoskeleton (230, 231)
NaCl
SDS
GnHCl █ █ █ █
Pellet
Alpha-2-macroglobulin receptor-
associated protein
AMRP_MOUSE 42 Protein binding, soluble mediator internalization
(232) NaCl █ █ █
SDS █ █ █
GnHCl █ █ █ █
Pellet
Alpha-actinin-4 ACTN4_MOUSE 105 Focal adhesion, cell adhesion (233, 234)
NaCl █ █ █ █
SDS
GnHCl
Pellet █
Annexin A1 ANXA1_MOUSE 39 ECM binding, fibrinolysis (235) NaCl █
SDS
GnHCl █
Pellet
Annexin A2 ANXA2_MOUSE 39 ECM binding, fibrinolysis (236) NaCl █ █ █ █
SDS █ █
GnHCl
Pellet █ █ █ █
Annexin A5 ANXA5_MOUSE 36 ECM binding (collagen) (237) NaCl █ █ █ █
SDS
GnHCl
Pellet
Apolipoprotein A-I APOA1_MOUSE 31 ECM binding (collagen, fibronectin)
(238) NaCl █ █ █ █
SDS █ █ █ █
GnHCl █ █ █ █
Pellet █ █ █ █

62
Apolipoprotein A-IV APOA4_MOUSE 45 Lipid metabolism (239) NaCl █ █ █ █
SDS █ █
GnHCl █ █ █
Pellet █ █ █
Apolipoprotein E APOE_MOUSE 36 Lipid metabolism, cell signaling (240) NaCl █ █ █ █
SDS
GnHCl █ █ █
Pellet
Apolipoprotein O-like APOOL_MOUSE 29 NaCl █ █ █ █
SDS █ █ █
GnHCl
Pellet
Beta-2-microglobulin B2MG_MOUSE 14 Protein binding, cell-ECM interaction
(241) NaCl
SDS █ █ █ █
GnHCl █ █ █ █
Pellet
Calreticulin CALR_MOUSE 48 Protein binding (collagens, laminin)
(242) NaCl █ █ █ █
SDS █ █ █ █
GnHCl █ █ █ █
Pellet
Calumenin CALU_MOUSE 37 Pprotein binding, stabilization of fibulin-1
(243) NaCl █ █ █ █
SDS
GnHCl
Pellet █ █ █
Carbonic anhydrase 2 CAH2_MOUSE 29 pH regulation of ECM (other isozymes)
(244) NaCl █ █ █ █
SDS
GnHCl
Pellet
Ceruloplasmin CERU_MOUSE 121 Iron, copper binding (245) NaCl █ █ █
SDS
GnHCl
Pellet
Chitinase-like protein 3 CHIL3_MOUSE 44 ECM turnover (246) NaCl █ █
SDS
GnHCl
Pellet

63
Clusterin CLUS_MOUSE 52 Extracellular protein chaperone (247) NaCl
SDS █ █
GnHCl █ █ █
Pellet
Cofilin-1 COF1_MOUSE 19 Cortical cytoskeleton, cell motility
(248) NaCl
SDS
GnHCl █ █ █ █
Pellet
C-reactive protein CRP_MOUSE 25 Protein binding (fibronectin) (249) NaCl █ █ █ █
SDS █ █
GnHCl
Pellet
C-X-C motif chemokine 9 CXCL9_MOUSE 14 Soluble mediator (angiostatic cytokine)
(250, 251)
NaCl █ █ █ █
SDS
GnHCl █
Pellet
Endoplasmin ENPL_MOUSE 92 Soluble mediator (TLR signaling)
(252) NaCl █ █ █ █
SDS █ █ █ █
GnHCl
Pellet █ █ █ █
Estradiol 17-beta-dehydrogenase 12
DHB12_MOUSE 35 Protein binding (heparin, fibronectin, collagen)
(253) NaCl
SDS █ █
GnHCl
Pellet
Ferritin heavy chain FRIH_MOUSE 21 Cell migration (254) NaCl █ █ █ █
SDS █ █ █ █
GnHCl █ █ █
Pellet
Ferritin light chain 1 FRIL1_MOUSE 21 Cell migration (254) NaCl █ █ █ █
SDS █ █ █ █
GnHCl █ █ █ █
Pellet
Glucose-6-phosphate isomerase
G6PI_MOUSE 63 Cell motility (255) NaCl █ █ █ █
SDS
GnHCl
Pellet

64
Hepatoma-derived growth factor
HDGF_MOUSE 26 Decreted heparin-binding growth factor
(256) NaCl █ █ █ █
SDS
GnHCl █ █ █ █
Pellet
High mobility group protein B1
HMGB1_MOUSE 25 Heparin binding, cytokine (257, 258)
NaCl █ █ █ █
SDS
GnHCl █ █ █ █
Pellet
High mobility group protein B2
HMGB2_MOUSE 24 Heparin binding, cytokine (257, 258)
NaCl █ █ █
SDS
GnHCl
Pellet
Lumican LUM_MOUSE 38 Regulation of collagen fibril formation
(221) NaCl █ █
SDS
GnHCl
Pellet
Moesin MOES_MOUSE 68 Cell cortex organization (259) NaCl █ █ █ █
SDS
GnHCl
Pellet
Myosin-9 MYH9_MOUSE 226 Cell migration, cortical actin organization
(260) NaCl █ █
SDS █ █ █ █
GnHCl █ █ █ █
Pellet
Neutrophil gelatinase-associated
lipocalin
NGAL_MOUSE 23 ECM remodeling (modulation of MMP9 activity)
(261) NaCl █ █
SDS
GnHCl █ █
Pellet
Nucleobindin-2 NUCB2_MOUSE 50 Matrix maturation (262) NaCl
SDS
GnHCl █
Pellet
Peptidyl-prolyl cis-trans isomerase A
PPIA_MOUSE 18 Matrix assembly of hensin (263) NaCl █ █ █ █
SDS █ █ █ █
GnHCl █ █ █ █
Pellet █ █

65
Pro-cathepsin H CATH_MOUSE 37 Matrix degradation (264) NaCl █ █ █ █
SDS
GnHCl
Pellet
S100-A13 S10AD_MOUSE 11 Calcium binding (265) NaCl █ █ █ █
SDS
GnHCl
Pellet
S100-A9 NaCl █ █ █
SDS █ █ █ █
GnHCl █ █ █
Pellet
Serum amyloid A-1 SAA1_MOUSE 14 Cell adhesion (266) NaCl █ █
SDS
GnHCl █ █ █
Pellet █ █
Serum amyloid A-2 SAA2_MOUSE 14 Cell adhesion (266) NaCl █ █
SDS
GnHCl █ █ █
Pellet █
Serum amyloid A-3 SAA3_MOUSE 14 Cell adhesion (266) NaCl
SDS
GnHCl █ █
Pellet
Serum amyloid P-component SAMP_MOUSE 26 Protein binding (type IV collagen, laminin)
(267, 268)
NaCl █
SDS
GnHCl
Pellet
Superoxide dismutase [Cu-Zn]
SODC_MOUSE 16 Protein binding (heparin/heparan sulfate, type 1 collage)
(269) NaCl █ █ █ █
SDS █ █ █ █
GnHCl █ █ █ █
Pellet █ █ █ █
Thioredoxin THIO_MOUSE 12 Soluble mediator (immunomodulatory cytokine)
(258) NaCl █ █ █ █
SDS
GnHCl █ █ █ █
Pellet █ █ █ █

66
Tubulin beta-5 chain TBB5_MOUSE 50 Microtubule formation, modified via ECM interactions
(231) NaCl
SDS
GnHCl █ █ █ █
Pellet
UPF0556 protein C19orf10 homolog
CS010_MOUSE 18 Soluble mediator (cytokine) (270) NaCl █ █ █ █
SDS
GnHCl
Pellet
Vimentin VIME_MOUSE 54 Microtubule formation (271) NaCl █ █ █ █
SDS
GnHCl █ █ █ █
Pellet █ █ █
Vitamin D-binding protein VTDB_MOUSE 54 Vitamin D binding (272) NaCl █ █ █ █
SDS █ █ █ █
GnHCl █ █ █ █
Pellet
Proteases and protease inhibitors
Con EtOH LPS EtOH +LPS
Alpha-1-antitrypsin 1-1 A1AT1_MOUSE 46 Inhibition of ECM proteases; inhibition of trypsin
(273) NaCl █ █ █
SDS
GnHCl █ █ █
Pellet █ █ █
Alpha-1-antitrypsin 1-4 A1AT4_MOUSE 46 Inhibition of ECM proteases; inhibition of trypsin
(273) NaCl █ █ █ █
SDS █ █ █ █
GnHCl
Pellet
AMBP AMBP_MOUSE 39 Precursor of protein HC (protein-ECM interactions) & bikunin (protease inhibitor),
(274-276)
NaCl █ █
SDS
GnHCl █ █ █ █
Pellet
Alpha-2-macroglobulin A2M_MOUSE 166 Inhibition of ECM proteases, inhibition of ADAMTS-7 and ADAMTS-12
(277) NaCl █ █ █
SDS
GnHCl
Pellet

67
Antithrombin-III ANT3_MOUSE 52 Inhibition of ECM proteases, inhibition of thrombin
(278) NaCl █ █ █ █
SDS █ █ █
GnHCl █ █
Pellet
Cathelin-related antimicrobial peptide
CRAMP_MOUSE 20 Inhibition of ECM proteases, inhibition of cathepsin L-cysteine protease activity
(279) NaCl █ █ █
SDS █ █
GnHCl █ █ █
Pellet
Cathepsin B CATB_MOUSE 37 ECM degradation (264) NaCl █ █ █ █
SDS █
GnHCl
Pellet
Cathepsin D CATD_MOUSE 45 ECM degradation, activation of cathepsin B
(280) NaCl █ █ █ █
SDS
GnHCl █
Pellet
Cathepsin Z CATZ_MOUSE 34 ECM degradation, integrin signaling
(281, 282)
NaCl █ █ █ █
SDS █ █ █
GnHCl █ █
Pellet
Complement C3 CO3_MOUSE 186 Activation of complement system
(283) NaCl █ █
SDS █ █ █ █
GnHCl
Pellet
Dipeptidyl peptidase 4 DPP4_MOUSE 87 Protein cleavage (cytokines, chemokines), protein binding (collagen)
(284) NaCl
SDS █ █
GnHCl █
Pellet
Ectonucleoside triphosphate diphosphohydrolase 5
ENTP5_MOUSE 47 Hydrolysis of extracellular ATP (285) NaCl █
SDS
GnHCl
Pellet
Fetuin-B FETUB_MOUSE 43 Cysteine protease inhibitor, metalloprotease inhibitor, matrix mineralization
(286, 287)
NaCl █ █ █ █
SDS
GnHCl
Pellet

68
Gelsolin GELS_MOUSE 86 Actin filament capping (288) NaCl █ █ █ █
SDS
GnHCl █ █
Pellet
Ectonucleoside triphosphate diphosphohydrolase 5
ENTP5_MOUSE 47 Hydrolysis of extracellular ATP/ADP (signaling)
(286) NaCl █ █
SDS
GnHCl
Pellet
Hemopexin HEMO_MOUSE 51 Heme binding (289) NaCl █ █ █ █
SDS
GnHCl █ █ █ █
Pellet
Insulin-degrading enzyme IDE_MOUSE 118 Metalloendopeptidase (290) NaCl
SDS
GnHCl
Pellet █
Inter alpha-trypsin inhibitor, heavy chain 4
ITIH4_MOUSE 100 Chain of ITI (protease inhibitor) (291) NaCl █
SDS
GnHCl
Pellet
Lysozyme C-1 LYZ1_MOUSE 17 Antibacterial, hydrolysis of β-1, 4-glycosidic linkages
(292) NaCl
SDS
GnHCl
Pellet █ █ █ █
Lysozyme C-2 LYZ2_MOUSE 17 Antibacterial, hydrolysis of β-1, 4-glycosidic linkages
(292) NaCl █ █ █
SDS
GnHCl
Pellet
Murinoglobulin-1 MUG1_MOUSE 165 Protease inhibitor (293, 294)
NaCl █ █ █ █
SDS
GnHCl █ █ █ █
Pellet
Myeloid bactenecin (F1) O08692_MOUSE 19 Cysteine protease inhibitor (295) NaCl █ █ █
SDS █ █ █
GnHCl █ █ █
Pellet

69
Phosphatidylethanolamine-binding protein 1
PEBP1_MOUSE 21 Serine protease inhibitor (296) NaCl █ █ █ █
SDS █ █ █
GnHCl █ █ █ █
Pellet
Plasminogen PLMN_MOUSE 91 Precursor of plasmin (serine protease)
(297) NaCl
SDS
GnHCl █ █ █
Pellet
Probable carboxypeptidase PM20D1
P20D1_MOUSE 56 NaCl █ █ █ █
SDS █ █ █
GnHCl
Pellet
Serpinb9 O08797_MOUSE 42 Serine protease inhibitor, granzyme inhibitor)
(298) NaCl █
SDS
GnHCl
Pellet
Serine protease inhibitor A3K
SPA3K_MOUSE 47 Serine protease inhibitor, chymotrypsin inhibitor
(299) NaCl █ █ █ █
SDS █ █
GnHCl
Pellet
Serine protease inhibitor A3N
SPA3N_MOUSE 47 Serine protease inhibitor, chymotrypsin inhibitor
(299) NaCl █ █
SDS
GnHCl
Pellet
Serpin B5 SPB5_MOUSE 42 Serine protease inhibitor, (299) NaCl
SDS
GnHCl
Pellet █
Thioredoxin THIO_MOUSE 12 Activation of transglutaminase (300) NaCl
SDS █ █ █ █
GnHCl
Pellet
Transthyretin TTHY_MOUSE 16 Hormone binding protein, cryptic protease, peptidase
(301) (302)
NaCl
SDS █ █ █ █
GnHCl █ █ █ █
Pellet

70
Collagens
Con EtOH LPS EtOH +LPS
Adiponectin ADIPO_MOUSE 27 Inhibition of vascular matrix degradation (contains collagen-like domain)
(303, 304)
NaCl █ █ █ █
SDS
GnHCl
Pellet
Collagen alpha-1(I) chain CO1A1_MOUSE 138 Component of collagen fibrins (303) NaCl
SDS █ █ █ █
GnHCl █ █ █ █
Pellet █ █ █ █
Collagen alpha-1(III) chain CO3A1_MOUSE 139 Component of collagen fibrils (303) NaCl
SDS
GnHCl █ █ █ █
Pellet █ █ █ █
Collagen alpha-1(IV) chain CO4A1_MOUSE 161 Component of collagen network (303) NaCl
SDS
GnHCl █ █
Pellet █ █ █ █
Collagen alpha-1(V) chain CO5A1_MOUSE 184 Fibrillogenesis, crosslinking (303) NaCl
SDS
GnHCl
Pellet █
Collagen alpha-2(I) chain CO1A2_MOUSE 130 Component of collagen fibrils (contains collage-like domain)
(303) NaCl
SDS █ █
GnHCl █ █ █ █
Pellet █ █ █ █
Collagen alpha-2(IV) chain CO4A2_MOUSE 167 Component of collagen network (303) NaCl
SDS
GnHCl
Pellet █ █
Collagen alpha-2(V) chain CO5A2_MOUSE 145 Fibrillogenesis, crosslinking (303) NaCl
SDS
GnHCl █
Pellet █ █ █
Mannose binding protein MBL2_MOUSE 26 soluble pattern recognition receptor
(305) NaCl
SDS
GnHCl █ █ █ █
Pellet

71
Extracellular - ECM interactions unknown
60 heat shock protein, mitochondrial
CH60_MOUSE 61
78 glucose-regulated protein
GRP78_MOUSE 72
Aminoacyl tRNA synthase complex-interacting multifunctional
protein 1
AIMP1_MOUSE 34
Arginase-1 ARGI1_MOUSE 35
BolA-like protein 1 BOLA1_MOUSE 14
BolA-like protein 3 BOLA3_MOUSE 12
Carboxylesterase 1C EST1C_MOUSE 61
Clathrin heavy chain 1 CLH1_MOUSE 192
Epididymal secretory protein E1
NPC2_MOUSE 16
Group XIIB secretory phospholipase A2-like protein
Q8VC81_MOUSE 22
Heat shock cognate 71 protein
HSP7C_MOUSE 71
Hepcidin HEPC_MOUSE 9
Hypoxia up-regulated protein 1
HYOU1_MOUSE 111

72
Interferon-inducible GTPase 1
IIGP1_MOUSE 48
Lactotransferrin TRFL_MOUSE 78
Macrophage migration inhibitory factor
MIF_MOUSE 13
Major urinary protein 12 A2CEK7_MOUSE 21
Major urinary protein 17 MUP17_MOUSE 21
Major urinary protein 20 MUP20_MOUSE 21
Major urinary protein 3 MUP3_MOUSE 21
Major vault protein MVP_MOUSE 96
Monocyte differentiation antigen CD14
CD14_MOUSE 39
Multiple coagulation factor deficiency protein 2 homolog
MCFD2_MOUSE 16
Myeloperoxidase PERM_MOUSE 81
Nuclease-sensitive element-binding protein 1
YBOX1_MOUSE 36
Polymeric immunoglobulin receptor
PIGR_MOUSE 85
Profilin-1 PROF1_MOUSE 15

73
Protein CREG1 CREG1_MOUSE 24
Protein Gm20425 E9Q035_MOUSE 108
Pyruvate kinase PKM KPYM_MOUSE 58
RNA binding motif protein, X-linked-like-1
RMXL1_MOUSE 42
Serotransferrin TRFE_MOUSE 77
Serum albumin ALBU_MOUSE 69
Serum paraoxonase/arylesterase 1
PON1_MOUSE 40
Translationally-controlled tumor protein
TCTP_MOUSE 19
UPF0369 protein C6orf57 homolog
CF057_MOUSE 12
Xanthine dehydrogenase/oxidase
XDH_MOUSE 147

74
“absence” in response to exposures, but localized consistently to the same
fraction when present. Ethanol and/or LPS exposure caused other proteins to
appear in different extracts in simple or complex patterns. For example, whereas
Annexin A1 was found in the insoluble pellet from control animals, it was not
detected in any fraction from animals exposed to ethanol or LPS alone; however,
the combination of ethanol and LPS caused this protein to accumulate in the
NaCl fraction. Similarly, fibrin(ogen) gamma chain was found in all experimental
groups, but its fractionation pattern was unique to each exposure condition.
These patterns likely represent differences in the synthesis, degradation, and/or
maturity of the ECM proteins.
4. Qualitative changes to the ECM proteome in response to stress
Figure 3.4 summarizes the abundance of ECM proteins, organized by
category (i.e., glycoproteins and proteoglycans (Fig. 3.4A), ECM‐associated
proteins (Fig. 3.4B), proteases and inhibitors (Fig 3.4C), and collagens (Fig.
3.4D)) across the four extraction conditions. The majority of the proteins in the
NaCl and SDS extracts were ECM‐associated proteins (Fig. 3.4A); this was
unsurprising, given that proteins in this category are generally loosely associated
with the ECM and are therefore easily solubilized. Additionally, the low
abundance of collagens in the NaCl and SDS fractions (Fig. 3.4D) was not
surprising, given that collagens are often tightly cross‐linked and require
denaturing conditions for solubilization. As expected, the denaturing conditions

75
Figure 3.4: Ethanol and LPS cause dynamic changes in the matrisome. The impact of ethanol diet (left panels) and 24-hour LPS (right panels) on the
types of proteins found in the ECM proteome are shown. Proteins are
categorized by class (A-D) and organized by extraction fraction (NaCl, SDS,
GnHCl, and pellet). Red proteins indicate those that appeared with exposure,
whereas green proteins indicate those that were lost with exposure, compared to
control.

76

77
created by GnHCl more than doubled the number of proteoglycans and
glycoproteins in that extract compared to the NaCl and SDS fractions. The
number of collagens in the GnHCl extract was also dramatically increased
compared to the NaCl and SDS fractions. The pellet fraction contained the
fewest proteins of all four extracts but contained the greatest number of
collagens.
Ethanol and/or LPS exposure did not change the general pattern of proteins
found in the various extracts (Fig. 3.4), but both tended to increase the total
number of ECM proteins in the fractions combined. For example, ethanol
exposure caused a net increase in the number of ECM proteins by ∼25%. These
changes were predominantly spread across the first three protein classes, with
the NaCl, SDS, and GnHCl extracts all increasing evenly. The pellet fraction
responded the least dynamically to ethanol or LPS exposure and actually
showed a net loss in total proteins. Likewise, collagens were the least
responsive protein class (Fig. 3.4D). Figure 3.5 (left panels) shows the
distribution of the proteins in the various extracts between all four exposure
groups.
In addition to proteins that changed in their extraction pattern in response
to ethanol (e.g., see Fig. 3.3C), there were several proteins that were uniquely
detected with ethanol exposure compared to control (Figs. 3.4 and 3.5); these
include fibrin(ogen) α and β chains, cytokeratin 13, vitronectin, plasminogen, high
mobility group protein B2, and collagens IVα2 and Vα2 (see Table 3.1). Similarly,
LPS exposure caused the appearance of several proteins that were unique
78
Figure 3.5: Shared and unique changes to the hepatic matrisome.
Venn diagrams (left column) show all ECM proteins within each of the four
extracts and indicate the number that are shared between, or that are unique to,
the four experimental groups. Bubble plots (right column) show quantitative
changes in abundance of proteins that were shared by all four experimental
groups. The bubble plots show fold of control in protein abundance caused by
LPS (y-axis), ethanol (x-axis), and the combination of ethanol + LPS (bubble
size). Each bubble represents a protein; bubble color indicates the protein’s
class.

79

80
compared to control (Figs. 3.4 and 3.5). Several of these proteins were the same
as those detected with ethanol exposure, but several were unique to LPS,
including serpine B5 (maspin), serine protease inhibitor A3N, and CXC motif
chemokine ligand 9 (see Fig. 3.5; Table 3.1).
Previous work has shown that ethanol preexposure sensitizes the liver to
inflammatory injury caused by a second insult (i.e., LPS) (26, 117). Furthermore,
previous studies have suggested that changes in ECM composition can
contribute to the sensitizing effect of ethanol preexposure (89). In this study, the
combination of chronic ethanol exposure and a second hit of LPS caused unique
changes in the ECM protein profile of the liver. The combination of EtOH+LPS
resulted in the appearance of four unique proteins that were not detected in livers
from animals exposed to either ethanol or LPS alone, including serum amyloid P
and serpine B9.
5. Quantitative changes to the ECM proteome in response to stress
Dramatic changes to the ECM (i.e., “lost” or “gained” proteins) can
significantly affect overall organ function; it is not surprising that the majority of
the matrisome did not change at the qualitative level. However, several of these
proteins did change in relative abundance in response to ethanol and/or LPS
compared to control (Figs. 3.5 and 3.6). Figs. 3.7‐3.10 provide results of the
clustering analysis of the protein abundances for each fraction. Based on this
analysis, six clusters were identified as the best visual representation of the data.
Table 3.2 identifies the membership of each protein within each cluster. Notable

81
Figure 3.6: Quantitative changes to the matrisome.
Heatmap analysis of the quantitative changes in abundance of proteins that were
shared by all four experimental groups (see Fig. 3.5) are shown for the NaCl (A),
SDS (B), GnHCl (C), and pellet (D) extraction fractions.

82

83
Figure 3.7: Clustered profiles of protein abundances for proteins identified
in the NaCl fraction.
Abundance values for each protein were first standardized to a mean of zero and
a standard deviation of one prior to clustering. See also Table 3.2.

84

85
Figure 3.8: Clustered profiles of protein abundances for proteins identified in the SDS fraction. Abundance values for each protein were first standardized to a mean of zero and
a standard deviation of one prior to clustering. See also Table 3.2.

86

87
Figure 3.9: Clustered profiles of protein abundances for proteins identified
in the GnHCl fraction.
Protein abundances were first standardized to a mean zero and a standard
deviation one for each protein prior to clustering. See also Table 3.2.

88

89
Figure 3.10: Clustered profiles of protein concentrations for proteins
identified in the pellet.
Abundance values for each protein were standardized to a mean of zero and a
standard deviation of one prior to clustering. See also Table 3.2.

90

91
Table 3.2: Clustering of proteins in response to ethanol and/or LPS
NaCl fraction
Protein Class Cluster
14-3-3 protein epsilon other ECM proteins 1
Apolipoprotein A-I other ECM proteins 1
Carbonic anhydrase 2 other ECM proteins 1
Cysteine-rich with EGF-like domain protein proteoglycans and glycoproteins 1
Granulins proteoglycans and glycoproteins 1
Hepatoma-derived growth factor other ECM proteins 1
Moesin other ECM proteins 1
Murinoglobulin-1 proteases and protease inhibitors 1
Peptidyl-prolyl cis-trans isomerase A other ECM proteins 1
Antithrombin-III proteases and protease inhibitors 2
Dystroglycan proteoglycans and glycoproteins 2
Ferritin light chain 1 other ECM proteins 2
Phosphatidylethanolamine-binding protein 1
Serine protease inhibitor A3K
proteases and protease inhibitors 2
proteases and protease inhibitors 2
Superoxide dismutase [Cu-Zn] other ECM proteins 2
Thioredoxin other ECM proteins 2
Transthyretin proteases and protease inhibitors 2
14-3-3 protein zeta/delta other ECM proteins 3
Actin, cytoplasmic 1 other ECM proteins 3
Alpha-actinin-4 other ECM proteins 3
Cathepsin B proteases and protease inhibitors 3
Cathepsin Z proteases and protease inhibitors 3
Ferritin heavy chain other ECM proteins 3

92
Haptoglobin proteoglycans and glycoproteins 3
Hemopexin proteases and protease inhibitors 3
High mobility group protein B1 other ECM proteins 3
Pro-cathepsin H other ECM proteins 3
14-3-3 protein gamma other ECM proteins 4
Annexin A5 other ECM proteins 4
Calumenin other ECM proteins 4
Endoplasmin other ECM proteins 4
Annexin A2 other ECM proteins 5
Cathepsin D proteases and protease inhibitors 5
Glucose-6-phosphate isomerase other ECM proteins 5
Alpha-1-antitrypsin 1-4 proteases and protease inhibitors 6
Calreticulin other ECM proteins 6
C-reactive protein other ECM proteins 6
UPF0556 protein C19orf10 homolog other ECM proteins 6
Vitamin D-binding protein other ECM proteins 6
Adiponectin collagens 6
SDS fraction
Cysteine-rich with EGF-like domain protein 2 proteoglycans and glycoproteins 1
Ferritin light chain 1 other ECM proteins 1
Syndecan-4 proteoglycans and glycoproteins other
ECM proteins 1
Actin, alpha skeletal muscle 2
Apolipoprotein A-I other ECM proteins 2
Apolipoprotein E other ECM proteins 2
Collagen alpha-1(I) chain collagens 2
Collagen alpha-2(I) chain collagens 2 Granulins proteoglycans and glycoproteins 2
Peptidyl-prolyl cis-trans isomerase A other ECM proteins 2 Complement C3 proteases and protease
inhibitors 3
Ferritin heavy chain other ECM proteins 3
Haptoglobin proteoglycans and glycoproteins 3
Myosin-9 other ECM proteins 3

93
Vimentin other ECM proteins 3 Sulfated glycoprotein 1 proteoglycans and glycoproteins 4
Actin, cytoplasmic 1 other ECM proteins 5
Calreticulin other ECM proteins 5
Endoplasmin other ECM proteins 5 Thioredoxin proteases and protease inhibitors 5
Beta-2-microglobulin other ECM proteins 6
Superoxide dismutase [Cu-Zn] other ECM proteins 6 Transthyretin proteases and protease inhibitors 6
Vitamin D-binding protein other ECM proteins 6
GnHCl fraction
Alpha-2-HS-glycoprotein proteoglycans and glycoproteins 1
Beta-2-glycoprotein 1 proteoglycans and glycoproteins 1
Decorin proteoglycans and glycoproteins 1
Ferritin light chain 1 other ECM proteins 1
Lumican proteoglycans and glycoproteins
collagens
1
Mannose-binding protein C 1
Tubulin beta-5 chain other ECM proteins 1
Vitamin D-binding protein other ECM proteins 1
Actin, cytoplasmic 2 other ECM proteins 2
Biglycan proteoglycans and glycoproteins 2
Fibrinogen gamma chain proteoglycans and glycoproteins 2 Fibronectin proteoglycans and glycoproteins 2 Haptoglobin proteoglycans and glycoproteins 2
Hemopexin proteases and protease inhibitors 2
Myosin-9 other ECM proteins 2 Protein AMBP proteases and protease inhibitors 2
Sulfated glycoprotein 1 proteoglycans and glycoproteins 2
Vimentin other ECM proteins 2
Cysteine-rich with EGF-like domain protein 2
Apolipoprotein A-I
proteoglycans and glycoproteins 3
other ECM proteins 4
Beta-2-microglobulin other ECM proteins 4 Dermatopontin proteoglycans and glycoproteins 4
Galectin-1 proteoglycans and glycoproteins 4
Granulins proteoglycans and glycoproteins 4 Hepatoma-derived growth factor other ECM proteins 4

94
Peptidyl-prolyl cis-trans isomerase A other ECM proteins 4
Superoxide dismutase [Cu-Zn] other ECM proteins 4 Thioredoxin other ECM proteins 4
Collagen alpha-1(I) chain collagens 5
Collagen alpha-2(I) chain collagens 5 Syndecan-4 proteoglycans and glycoproteins 5
Alpha-2-macroglobulin receptor-associated
protein other ECM proteins 6
Calreticulin other ECM proteins 6
Cofilin-1 other ECM proteins 6
Collagen alpha-1(III) chain collagens 6
High mobility group protein B1 other ECM proteins 6
Phosphatidylethanolamine-binding protein 1 proteases and protease inhibitors 6 Transthyretin proteases and protease inhibitors 6
Pellet fraction
Apolipoprotein A-I other ECM proteins 1
Apolipoprotein E other ECM proteins 1
Collagen alpha-1(IV) chain collagens 1
Granulins proteoglycans and glycoproteins 1
Endoplasmin other ECM proteins 2
Sulfated glycoprotein 1 proteoglycans and glycoproteins 2
Actin, alpha skeletal muscle other ECM proteins 3
Actin, cytoplasmic 1 other ECM proteins 3
Annexin A2 other ECM proteins 3 Collagen alpha-1(III) chain collagens 4
Superoxide dismutase [Cu-Zn] other ECM proteins 4
Thioredoxin other ECM proteins 5 Collagen alpha-1(I) chain collagens 6
Collagen alpha-2(I) chain collagens 6

95
(>4‐fold increase) changes caused by LPS included ferritin heavy chain (15‐fold
increase) in the NaCl fraction, haptoglobin and myosin‐9 (11‐ and 9‐fold,
respectively) in the SDS fraction, and fibrinogen γ chain and haptoglobin (14‐ and
7‐fold, respectively) in the GnHCl fraction. Likewise, ethanol exposure increased
the abundance of several proteins, including myosin‐9 (6‐fold) and cysteine‐rich
with EGF‐like domain protein 2 (CREDL2; 6‐fold) in the SDS fraction. As was
observed for qualitative analysis (Fig. 3.4), ethanol and/or LPS affected proteins
in the pellet fraction the least of all fractions.
While ethanol alone and LPS alone each changed the abundance of certain
proteins, the combination of the two exposures caused its own unique effects on
the matrisome (Figs. 3.7-3.10). For example, although LPS alone did not change
endoplasmin abundance compared to control, and ethanol only increased it 3‐
fold, the combination of ethanol and LPS increased this endoplasmin abundance
11‐fold in the NaCl fraction (Figs. 3.5 and 3.6). Similarly, the combination of
ethanol and LPS increased granulin abundance 5-fold in the SDS fraction,
despite no effect by ethanol alone and only a 2‐fold increase by LPS (Figs. 3.5
and 3.6). Additionally, although both ethanol alone and LPS alone increased
CRELD2, the combination of ethanol and LPS decreased CRELD2 abundance in
the SDS fraction. Proteins that were differentially regulated by the combination
of ethanol and LPS in the GnHCl fraction include hemopexin and alpha‐1‐
microglobulin/bikunin precursor.
D. DISCUSSION

96
This work had two primary goals: (1) to characterize and validate an
extraction and analysis method for the hepatic matrisome that would provide both
the sensitivity to identify low‐abundance proteins and the power to observe global
changes and (2) to use this method to explore transitional (i.e., prefibrotic)
changes to the hepatic matrisome caused by ethanol diet and/or LPS exposure.
As discussed in the Introduction, the study of the hepatic ECM has largely been
“collagenocentric” and “fibrosocentric”—that is, centered on the dramatic
increase in collagen deposition during fibrosis, a quasi‐permanent scarring of the
organ. However, the matrisome of both healthy and diseased liver is exceedingly
more diverse than collagen ECM. Indeed, studies have revealed that in addition
to collagen, laminin (118) and vitronectin (119, 120) are also increased during
fibrogenesis. Furthermore, proteomic studies in other organs have shown that
matrisome composition responds dynamically after insult well before organ
fibrosis.(99, 114, 121) Previously, this group showed that fibrin ECM
accumulation correlates with inflammatory liver injury in several models and may
play a causal role in hepatic damage.(89) Additionally, Gillis et al. (90) have
demonstrated a similar role for fibronectin ECM in experimental ALD. However,
global changes in the hepatic ECM during inflammatory liver injury have not yet
been characterized. The models herein employed (Lieber‐DeCarli ethanol diet
and acute LPS) are well known to cause significant liver damage, but do not
result in histologically detectable changes to the ECM.
Global ECM changes may affect tissue function through three general types
of mechanisms: physical, biochemical, and signaling. Physical properties of the

97
ECM include the matrix topography, cross‐linking, and organization.(21) These
physical properties are not only essential to the structural role of the ECM, but
also allow the ECM to either obstruct or facilitate cell migration.(49) Fibrin
matrices have been demonstrated to be permissive to monocyte and leukocyte
chemotaxis and activation.(122, 123) Physical alterations in the ECM can cause
tissue rigidity, resulting in decreased organ function. Although such physical
changes to the ECM can indirectly affect the biochemistry of the liver (e.g.,
hemostasis‐induced hypoxia), matrisome changes can also directly cause
biochemical changes that are independent of structural changes. For example,
ECM components can facilitate ligand-receptor interactions, (124) bind and retain
chemokines,(18) and regulate activation of growth factors (i.e., transforming
growth factor beta). (18) ECM molecules can also directly serve as signaling
molecules through interactions with cell‐surface receptors, including integrins.
(125) Because of the multifaceted roles of many ECM molecules, any single
change in the ECM can, in principle, trigger a cascade of dependent changes
that influence the composition and properties of the ECM. For example, biglycan
acts as a structural component that regulates collagen fiber assembly, but, upon
release from the matrix, can act as a signaling molecule binding to Toll‐like
receptor 4 (TLR4) receptors.(126)
The current study determined the individual and combined effects of two
experimental exposures (ethanol and LPS) on the hepatic matrisome. LPS was
selected because it induces robust hepatic inflammation. The liver is often
exposed to LPS during several pathophysiologic states, including after alcohol

98
consumption.(127) Whereas inflammatory responses triggered by small doses of
LPS are typically noninjurious, other stresses can synergistically enhance the
hepatotoxic response to LPS. Indeed, ethanol not only increases circulating
LPS, but also enhances inflammation and liver damage caused by acute LPS
exposure.(117) This “two‐hit” paradigm is common in fatty liver diseases. (64)
In the current study, both stresses caused the hepatic matrisome to respond
dynamically, not only increasing the number of matrisome proteins , but also
differentially changing protein abundance (Fig. 3.5) and likely structure or
location (Figs. 3.4 and 3.5).
Several of the protein changes reported here reiterate results of previous
hypothesis‐driven studies. For example, this work validated that LPS dramatically
alters the fibrin(ogen) ECM, and that ethanol preexposure enhances this effect.
In the current study, LPS exposure increased the relative abundance of
fibrinogen gamma chain in the GnHCl extract. The fibrin(ogen) gamma chain is a
major component of fibrin clots given that it is polymerized into insoluble fibrin
fibers.(128) Therefore, the localization of this robust increase in fibrinogen
gamma chain in the GnHCl fractions suggests that there was an increase in
fibrin(ogen) gamma chain polymerization into a less‐soluble, more highly cross‐
linked form. Furthermore, the combination of ethanol and LPS resulted in
detection of the fibrin(ogen) gamma chain in the insoluble pellet, which suggests
additional modifications that decreased solubility (e.g., cross‐linking). The
appearance of serum amyloid A‐1 and A‐2 proteins in response to LPS was also
confirmed here. (129, 130) In fact, LPS exposure increased the abundance of
99
several other acute‐phase proteins, including haptoglobin, complement C, and
ceruloplasmin, which are all known to be increased by LPS exposure. (131-133)
This work also validates previous studies which reported ethanol increased
fibronectin deposition before the onset of fibrosis. (90)
The work herin also identified novel changes caused by ethanol and LPS. For
example, previous studies have shown an association between vitronectin
accumulation and HF/end‐stage liver disease.(119, 120) The results of the
current study suggest that more subtle changes in vitronectin abundance occur
before the onset of fibrosis and hepatic decompensation. Ethanol exposure also
resulted in the detection of galectin‐1. Galectin‐1 is a glycosaminoglycan‐binding
lectin associated with cell proliferation and adhesion through modulation of
glycoprotein cross‐linking. Galectin‐1 may also play a role in hepatic
inflammation and fibrinogenesis.(134) These data suggest that ethanol and/or
LPS likely contribute to a multitude of changes in the ECM composition, many of
which have not yet been fully investigated.
Changes in abundance of protease and protease inhibitors can also
contribute to inflammatory liver injury and fibrogenesis. In the current study,
several ECM‐associated proteases were increased in response to stress,
including plasmin(ogen), antithrombin III, dipeptidyl peptidase, and alpha‐1‐
antitrypsin. Stress also resulted in the presence of protease inhibitors, such as
serpine B5 (maspin) and plasminogen activator inhibitor‐1 (PAI‐1). Ethanol
and/or LPS increased several other proteases and protease inhibitors that may
be critical for ECM homeostasis (e.g., transthyretin, phosphatidylethanolamin‐

100
binding protein‐1 [PEBP1], and serine protease inhibitor A2K). These data
support the notion that transitional remodeling of the hepatic matrisome is
bidirectional, driven by both increased secretion of matrix proteins as well as
altered ECM degradation.
As mentioned above, ethanol is well known to synergize liver damage caused
by LPS exposure. In the current study, the combination of ethanol and LPS
resulted in unique changes to the hepatic matrisome compared to either ethanol
or LPS alone. Indeed, coexposure differentially increased fibronectin and
biglycan abundance (Fig. 3.3; Table 3.1). Fibronectin accumulation caused by
ethanol may contribute to hepatic inflammation through stimulation of Kupffer
cells (KCs). (135) Biglycan is a small proteoglycan that was first recognized as a
structural component and signaling molecule in the ECM (136). Biglycan has
also been implicated in inflammation, (137) possibly by retaining proinflammatory
cytokines,(138) and/or by activating TLR4 signaling.(138) These data suggest
that biglycan abundance may be increased in prefibrotic stages of liver disease.
In contrast, the combination of ethanol and LPS synergistically decreased
PEBP1; this enzyme has been shown to inhibit trypsin‐like serine proteases,
including thrombin, but not trypsin or tissue‐type plasminogen activator.(139)
Multiple studies have identified PEBP1 as a critical player in metastasis (140)
and have defined it as a metastasis suppressor gene.(141) These changes
represent dynamic (and potentially unique) responses of hepatic ECM to stress
that may serve as a basis for future biomarker and/or mechanistic studies.

101
Whereas it is well established that myofibroblast‐like cells (e.g., hepatic
stellate cells) are the primary source of fibrillar ECM during HF, most, if not all,
hepatic cells contribute to overall matrisome homeostasis. For example, hepatic
sinusoidal endothelial cells are almost solely responsible for the metabolism and
degradation of hyaluronic acid. Furthermore, stress causes inflammatory cells
(e.g., KCs) and hepatocytes release proteases and protease inhibitors (e.g., PAI‐
1) that can affect the ECM. Extrahepatic sources (e.g., the coagulation and
complement cascades) can also affect the hepatic matrisome. The ECM not only
serves as a physical structure, but also binds/interacts with several biomolecules
that can directly or indirectly alter responses. For example, ECM/integrin
interactions mediate rapid and dynamic responses to changes in the
environment. It is known that fibrotic ECM is known to influence cell phenotype,
inflammation, and metastasis in the liver.(142-144) The effects of the ECM
changes observed here on earlier stages of liver injury should be investigated.
In summary, the results of this work demonstrate that the hepatic matrisome
responds dynamically to both chronic (ethanol) and acute (LPS) stresses,
preceding more‐dramatic fibrotic changes to the liver. It is likely that these
transitional changes to the hepatic ECM contribute to the pathological responses
to these stresses. It is also interesting that several ECM proteins responded
similarly to both stresses, suggesting a shared mechanism in both models.
Protein changes that were unique to either ethanol or LPS exposure alone (or
their combination) also represent potential new biomarkers or targets. These

102
results therefore serve as a foundation for future analyses in models of liver
disease.

103
CHAPTER IV
NOVEL BIOMARKERS IN ALCOHOLIC HEPATITIS: ANALYSIS OF THE
PLASMA PEPTIDOME/DEGRADOME
A. Introduction
AH is an acute sequela of alcoholic liver disease with a high mortality rate
of 30-50% at 3 months and 40% at 6 months.(72, 73) AH is characterized by
jaundice and liver failure.(145) AH occurs in patients with heavy chronic alcohol
consumption (80-100 g per day) and severe ASH with or without advanced
fibrosis and/or cirrhosis.(145, 146) AH can be the first manifestation of clinically
silent ALD or an exacerbation of pre-existing cirrhosis.(145)
Accurately predicting AH patient outcome is important for clinical decision-
making. For example, AH patients with higher risk are better candidates for
corticosteroid treatment, and patients with lower risk could be candidates for
long-term clinical studies.(72, 145) While identifying AH patients at risk of liver
inflammatory injury and failure is important, it is also difficult. Currently, the best
approach for predicting outcome is combining static scores, such as the modified
Maddrey’s discriminant-function, MELD, ABIC (Age, Bilirubin, INR and
Creatinine) and/or Glasgow with the dynamic Lille scoring system.(147) These

104
clinical scores are useful for predicting outcome in patients with severe disease,
but are more limited in predicting outcome in patients with moderate AH.(84)
Our group recently demonstrated significant ECM remodeling during
inflammatory liver injury (93). During such remodeling, peptide fragments of the
degraded ECM increase in biologic fluids (e.g., plasma) (58). Peptidomic analysis
of the degraded ECM (i.e., ‘degradome’) is a useful diagnostic/prognostic tool in
metastatic cancers and other diseases of ECM remodeling (58).
It was hypothesized that the severe inflammatory liver injury caused by AH
would yield a unique degradome profile in human patient plasma, and that ECM
peptides would change between patient groups. The goals of this work are
twofold: 1.) to identify novel candidate biomarkers for AH, and 2.) to develop new
mechanistic hypotheses by predicting proteases that generated the observed
degradome.
B. Experimental procedures
1. Study participants and inclusion criteria
AH patients, AUD patients, and healthy volunteers were enrolled in the study
as described in Chapter II.
2. Study paradigm
Relevant clinical data were collected as described in Chapter II. As provided
in the workflow scheme in Figure 4.1, this study was designed to analyze plasma
peptides for comparison between healthy volunteers, AUD patients (“mild”, with

105
or without liver injury), patients with moderate AH, and patients with severe AH
for potential associations between parameters.
3. Plasma collection
Plasma was collected from study participants as described in Chapter II.
4. Plasma peptide purification
Plasma peptide purification was optimized and carried out as described in
Chapter II.
5. Liquid chromatography and tandem mass spectrometry
LC-MS/MS analysis was carried out as described in Chapter II
6. Data analysis
Peptidomic data analysis was performed as described in Chapter II.
7. Statistical analysis
Peptidomic data were log2 transformed prior to statistical analysis. Statistical
analysis was performed as described in Chapter II.
C. Results
1. Patient demographics
A total of 114 participants including healthy volunteers (n=7) and AH (n=107)
patients stratified by MELD scores into three categories were studied. AH

106
Figure 4.1: Scheme of peptidomic workflow. Plasma samples were handled randomly in balanced proportions between
groups to avoid systematic bias. Plasma peptides were purified by TCA
precipitation and underwent LC-MS/MS analysis with de novo spectrum
assignment. We identified peptides significantly changing between MELD
groups.

107
Sev >19(37)
Mod 12-19(25)
Mild <12(45)
HC(7)
MELD
Study population
Flight 1
Flight 2
Flight 3
TCA p p t n
HLB SPE
Nan od r op
Sample handling and data collection
Feature extraction and
de novo spectrum assignment
Univariate/Multivariate
Statistical Analyses
Identification of ECM peptides Hypothesis
Generation
Data Processing and Informatics
Flight 4

108
patients with AUDs having a MELD score less than 12 were assigned to the mild
category (n=45), patients having a MELD score between 12 and 19 were
assigned to the moderate category (n=25), and patients having a MELD score
greater than 19 were assigned to the severe category (n=37). The AUD/mild
category was further subdivided into patients without liver injury (ALT<40, “Mild-
A”, n= 14) with liver injury (ALT≥40, “Mild-B”, n=31). A variety of clinical data was
gathered for these patients, including transaminases, alkaline phosphatase, and
total bilirubin. Table 4.1 shows a list of demographics and clinical data for the
healthy, AUD (‘mild’), moderate AH, and severe AH participants.
2. Plasma peptides change between MELD groups
To visualize differences in the patients based on the peptidomic data, PCA
was carried out (Fig. 4.2). Principal components 1 and 2 accounted for 51.59%
and 5.14% of the variability between the five peptidome cohorts. PCA1 was the
component explaining the largest set of variability (51.59%) in the data as could
be attributed to the differences between Mild-A + Mild-B versus Moderate +
Severe peptidomes. PCA2 was the component explaining the second largest set
of variability in the data (5.14%). This component was 10-fold less than PCA1
and could be attributed to the differences between Healthy Controls versus AH
(Mild-A + Mild-B + Moderate + Severe). The hierarchical clustering of the
peptidome as grouped patient samples by similar MELD scores (Healthy Control;
Mild-A and Mild-B; Moderate and Severe) identified three primary clusters of

109
Table 4.1: Patient demographics
Age
Groups Healthy volunteer Mild-A* Mild-B** Moderate*** Severe***
# Samples 7 14 31 25 37
# Missing 0 0 0 2 0
Mean 28.14 40.02 44.05 49.83 48.92
Median 26.00 37.30 44.00 51.00 50.00
Std. Dev. 4.74 11.74 10.26 9.97 10.67
Min. 25.00 25.30 23.19 31.00 27.00
Max. 38.00 62.90 67.00 63.00 66.00
AST (SGOT) (IU/L)
Groups Healthy volunteer Mild-ANS Mild-B** Moderate** Severe**
# Samples 7 14 31 25 37
# Missing 2 0 0 2 0
Mean 24.40 36.00 131.55 135.30 141.08
Median 25.00 26.00 96.00 114.00 122.00
Std. Dev. 2.88 20.00 103.71 77.66 71.26
Min. 21.00 17.00 21.00 18.00 41.00
Max. 28.00 87.00 388.00 347.00 370.00
ALT (SGPT) (IU/L)
Groups Healthy volunteer Mild-ANS Mild-B**** ModerateNS SevereNS
# Samples 7 14 31 25 37
# Missing 2 0 0 2 0
Mean 20.40 27.57 97.68 59.78 48.95
Median 17.00 27.00 83.00 46.00 40.00
Std. Dev. 5.18 8.05 59.31 45.63 30.11
Min. 16.00 14.00 40.00 15.00 12.00
Max. 27.00 39.00 312.00 194.00 159.00
Alkaline phosphatase (IU/L)
Groups Healthy volunteer Mild-ANS Mild-BNS Moderate*** Severe***
# Samples 7 14 31 25 37
# Missing 2 0 0 2 0
Mean 48.80 68.50 93.52 175.91 180.65
Median 54.00 64.50 91.00 147.00 157.00
Std. Dev. 10.92 27.05 25.62 109.32 83.90
Min. 37.00 44.00 56.00 41.00 72.00
Max. 59.00 147.00 150.00 483.00 443.00

110
Bilirubin (mg/dL)
Groups Healthy volunteer Mild-ANS Mild-BNS Moderate* Severe****
# Samples 7 14 31 25 37
# Missing 2 0 0 2 0
Mean 0.52 0.86 0.74 7.22 18.31
Median 0.50 0.60 0.60 5.10 18.20
Std. Dev. 0.13 0.93 0.57 7.66 7.69
Min. 0.40 0.20 0.20 0.60 4.70
Max. 0.70 4.00 2.60 35.00 34.20
Albumin (g/L)
Groups Healthy volunteer Mild-ANS Mild-BNS Moderate**** Severe****
# Samples 7 14 31 25 37
# Missing 2 0 0 2 0
Mean 4.06 4.03 4.17 2.77 2.51
Median 4.20 4.10 4.20 2.80 2.40
Std. Dev. 0.31 0.34 0.50 0.68 0.46
Min. 3.60 3.20 2.60 1.70 1.60
Max. 4.40 4.50 5.20 4.50 3.50
Sex
Groups Healthy volunteer Mild-AND Mild-BND ModerateND SevereND
# Samples 7 14 31 25 37
# Missing 0 0 0 2 0
# Males 1 7 26 15 24
# Females 6 7 5 8 13
Ascites
Groups Healthy volunteer Mild-AND Mild-BND ModerateND SevereND
# Samples 7 14 31 25 37
# Missing 0 0 0 3 0
# None 7 14 30 11 5
# Mild/Moderate
0 0 1 11 25
# Severe 0 0 0 0 7
Plasma color
Groups Healthy volunteer Mild-AND Mild-BND ModerateND SevereND
# Samples 7 14 31 25 37
# Missing 0 1 2 11 10
# Light yellow 5 12 26 1 0
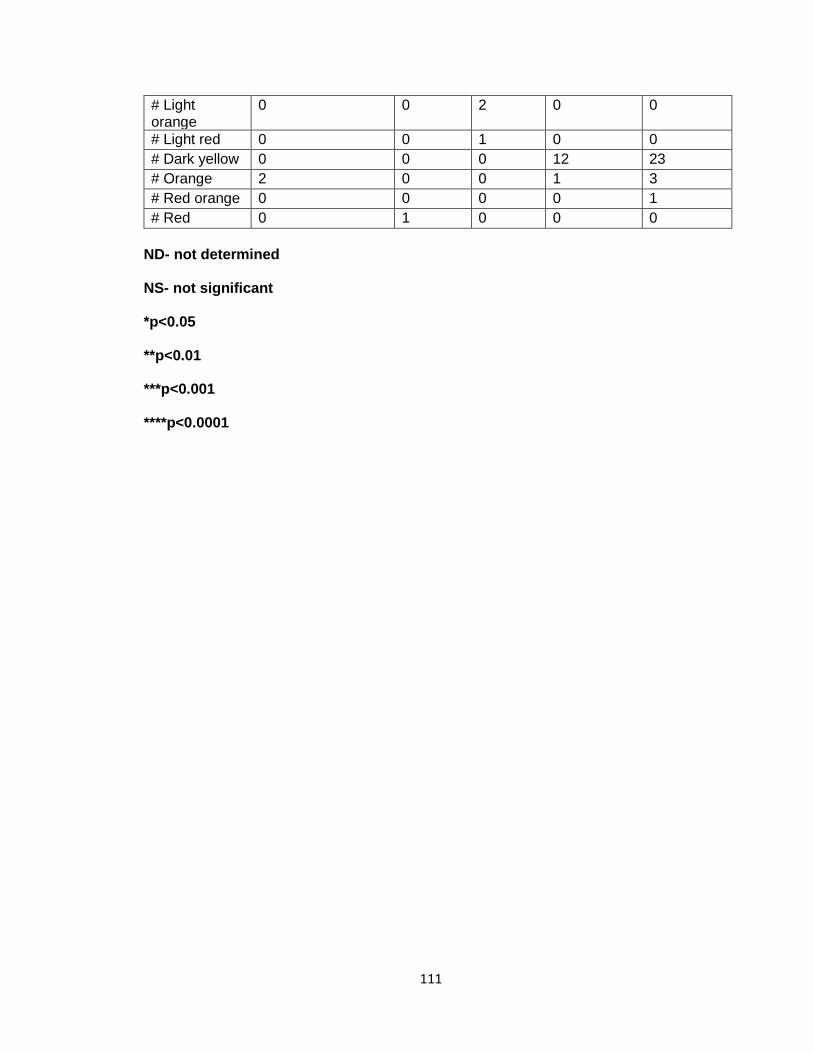
111
# Light orange
0 0 2 0 0
# Light red 0 0 1 0 0
# Dark yellow 0 0 0 12 23
# Orange 2 0 0 1 3
# Red orange 0 0 0 0 1
# Red 0 1 0 0 0
ND- not determined
NS- not significant
*p<0.05
**p<0.01
***p<0.001
****p<0.0001

112
Figure 4.2: Multivariate analysis of the plasma peptidome using principal
component analysis biplots and heat maps with hierarchical clustering.
Patient differences for different AH severity groups based on peptidome were
visualized using (Fig 5A) PCA and heat maps with hierarchical clustering (Fig
5B). PCA was carried out for significantly changed peptides (BH corrected p-
value <0.05) using a linear mixed model approach. “Age” and “Sex” were
considered fixed variables, and “Flight” and iRT1-11 peptide standards were
considered random variables.

113
Healthy
volunteer
Mild-A Mild-B SevereModerate
A.
B.

114
peptides . The first cluster was interpreted as peptide abundances in order of
HC > Mild-A = Mild-B > Moderate = Severe. The second cluster was interpreted
as peptides abundances in order of Mild-A = Mild-B > HC = Moderate = Severe.
The third cluster was interpreted as peptide abundances in order of Moderate =
Severe > HC > Mild-A = Mild-B; thus each disease severity stage yielded a
unique peptidome pattern (Figure 4.3).
Linear discriminate modeling of the cohort peptide abundances following
adjustment for age, sex, iRT internal standards, and sample analysis flight
identified 12-497 differentially regulated peptides (Table 4.2). These pairwise
differences were in agreement with PCA loading comparisons demonstrating
very small numbers of significantly regulated peptides between Mild-A and Mild-B
while large differences between HC and each AH cohort member. Individual
pairwise comparisons by volcano plots were used to illustrate peptides that are
differentially abundant by both statistical significance and fold change (Figure
4.3).
3. ECM peptides change between MELD groups
To address the working hypothesis that surrogate markers of AH would be
associated with altered matrisome metabolism, the regulated peptides (q-value
<0.05) identified from the iterative pairwise comparisons of Healthy Control (HC)
versus AH cohort (Mild-A, Mild-B, Moderate and Severe) as well as the
comparisons of Mild-A to Mild-B and of Moderate to Severe were assembled into

115
Table 4.2: Pairwise comparisons of peptidomes.
Comparison # Differentially
expressed # Up
regulated # Down
regulated
Healthy volunteer vs. Mild-A
497 130 301
Healthy volunteer vs. Mild-B
392 112 226
Healthy volunteer vs. Moderate
207 32 152
Healthy volunteer vs. Severe
344 109 205
Mild-A vs Mild-B 12 1 1
Moderate vs. Severe 94 37 11
116
Figure 4.3: Pairwise comparison of the peptidomes of patients with
different AH severity by volcano plots.
Peptide abundance differences were plotted as log2 of the fold-change versus –
log10 BH-corrected p-value. Peptides with BH-corrected p-value < 0.05 and
log2FC ≥ 1 were considered significantly upregulated, and peptides with BH-
corrected p-value <0.05 and log2FC ≤ -1 were considered significantly
downregulated. The Tukey's HSD test was used for all pairwise comparisons.
Pairwise comparisons were illustrated for the major comparators of: A. Healthy
vs. Mild-A, B. Healthy vs. Mild-B, C. Healthy vs. Moderate, D. Healthy vs.
Severe, E. Mild-A vs Mild-B, F. Moderate vs. Severe.

117
A B
C D
E F
118
a spreadsheet. The gene names associated with each differentially regulated
peptide were submitted for annotation by matrisome category and division using
the matrix-annotator tool at the MIT Matrisome project website
(http://matrisomeproject.mit.edu/analytical-tools/matrisome-annotator/). These
gene names were annotated by the matrisome-annotator tool as a component of
the core matrisome (collagen, ECM glycoprotein, proteoglycan) or the matrisome
associated compartment (ECM regulators, ECM-affiliated proteins, secreted
factors). The regulated ECM peptidome (Table 4.3) by absolute numbers were
ranked in the following order: (HC versus Mild-A or Mild-B) >>> (HC versus
Moderate or Severe) >>> (Moderate versus Severe) or (Mild-A versus Mild-B).
These data suggest that the plasma peptidome may be able to discretely
differentiate HC versus Mild AH and Moderate versus Severe AH.
The regulated ECM peptides for the HC versus AH cohorts (Mild-A, Mild-B,
Moderate, and Severe) were compared by Venn Diagram (Fig. 4.4 inset) and
regulated peptides to all four comparisons were identified. The annotation of
these gene names by matrisome-annotator identified 4 ECM peptides out of 101.
These four peptides included: one peptide derived from collagen (I) alpha 2
labeled as COL1A2-394 with the sequence
612SGP(OH)PGPDGNKGEP(OH)GVVGAVGTAGP635, two peptides from
fibrinogen alpha chain FGA-649 (426REYHTEKLVTSKGDKEL442), FGA-1238
(581KQFTSSTSY589), one peptide SRGN-392 from serglycin
(135SLDRNLPSDSQDLG148), and one peptide from kininogen-1 (KNG1-123),

119
Table 4.3: ECM-Matrisome Annotation for Pairwise Regulated Peptides.
Peptidome
Healthy Control versus Mild-A
Healthy
Control versus Mild-A2
Healthy Control versus
Moderate
Healthy
Control versus Severe
Mild-A versu
s Mild-B
Moderate
versus Severe
Total Peptides 497 392 207 344 12 94
Non-ECM 246 (49)
207 (53)
172 (83) 204 (59)
9 (75) 23 (24)
ECM Peptides 251 (45)
185 (47)
35 (17) 140 (41)
3 (25) 71 (76)
Core Matrisome Peptides
226 (45) 169 (43)
31 (15) 127 (37)
2 (17) 67 (71)
-Collagens 104 59 21 81 0 52
-ECM Glycoproteins 118 107 6 39 2 14
-Proteoglycans 4 3 4 7 0 1
Matrisome-associated 25 (5) 16 (4) 4 (2) 13 (4) 1 (8) 4 (4)
-ECM Regulators 24 16 4 11 1 4
-ECM-affiliated Proteins
1 0 0 1 0 0
-Secreted Factors 0 0 0 1 0 0
(percentage)

120
Figure 4.4: Regulated peptides common to HC to AH pairwise comparisons
include ECM peptides.
Regulated peptides were identified using data from volcano plots of HC vs. Mild-
A, HC vs. Mild-B, HC vs. Moderate, and HC vs. Severe were compared by Venn
diagram analysis (inset). Peptides common to all comparisons (n=101) were
annotated for GO and the relative fold difference of the HC to AH-cohort plotted
for all ECM peptides.

121
Mild
-A:H
C
Mild
-B:H
C
Mo
dera
te:H
C
Severe
:HC
Mild
-B:M
ild
-A
Severe
:Mo
dera
te
0 .7
0 .8
0 .9
1 .0
1 .1
1 .2
Fo
ld-C
ha
ng
e L
og
2 N
orm
ali
ze
d
Ex
tra
cte
d I
on
Ch
ro
ma
tog
ra
m A
re
a U
nd
er t
he
Cu
rv
e
C O L 1 A 2 -3 9 4
F G A -6 4 9
F G A -1 2 3 8
S R G N -3 9 2
K N G 1 -1 2 3

122
245RPPGFSP251 (also known as bradykinin 1-7). As illustrated in Figure 4.4, two
peptides (COL1A2-394, SRGN-392, and KNG1-123) increased with AH severity,
one peptide (FGA-1238) decreased with AH severity and two peptides (FGA-649
and SRGN-392) were reduced across all AH cohorts and did not change with AH
severity. These data demonstrate the response of select matrisome
compartments across the AH spectrum.
D. Discussion
AH is a diagnosis of acute hepatic inflammation and liver failure based on
AST, AST/ALT, serum bilirubin, INR, neutrophilia, ascites, and history of
AUD.(72) AH has a 3-month mortality rate of 30-50%.(73) Both AH diagnosis
and prognosis could be impacted by the development of more sensitive and
specific biomarkers. Our group previously demonstrated that inflammatory stress
causes the hepatic ECM to undergo dynamic transitional remodeling.(93) Others
have shown that ECM remodeling causes degradation products to be secreted
into blood and that analysis of these peptides (i.e. the ECM degradome) is a
useful prognostic tool in diseases that involve ECM remodeling.(58, 59)
Therefore, the work in this pilot study aimed to test the hypothesis that the
plasma ECM degradome changes with AH severity.
To this end, peptides were purified from AH patient plasma and analyzed
using LC-MS/MS. Internal standards (non-human peptides, iRT, Biognosis USA,
Beverly, MA) spiked into samples enabled normalizing of day-to-day instrument
performance during the statistical modeling using linear mixed model approach.

123
Patients were divided into groups based on AH severity (MELD score) and the
changes in the peptidome patterns across groups were examined with
multivariate analyses, considering age and sex as fixed variables, and flight and
the 11 peptide standards as random variables. The PCA approach to data
analysis is based on data reduction and collapses all data points within a sample
into a single x,y coordinate. This approach allowed for an unbiased self-sorting at
the patient level, not the discrete peptide level, based on the intrinsic nature of
the data. These data demonstrated that differences in the peptidome can
separate patients by AH severity group. Principal component 1, which accounted
for 51.59% of variability in the data, generally separated Mild-A and Mild B from
Moderate and Severe, with the Healthy group in the middle. Principal component
2, which accounted for 5.14% of variability in the data, appeared to separate
healthy patients from all AH patients. PCA showed little difference between Mild-
A and Mild-B or between Moderate and Severe. The subsequent multivariate
approach for modeling the peptidome data was hierarchical clustering with heap
maps grouping the relative peptide abundances into unique patterns in the
peptidome between AH severity groups. The hierarchical clustering of the
complete dataset identified three strong groupings of peptide abundance patterns
that reflected combinations of (A) increased peptide levels in healthy controls, (B)
increased peptide levels in Moderate + Severe and (C) increased peptide levels
in Mild-A + Mild-B AH cohorts. These data supported the justification to conduct
pair-wise comparisons of the mean peptide differences between HC and AH
cohorts. Post-hoc filtering of the differentially abundant peptides identified strong

124
relative abundance changes in ECM peptides with strong differences noted in the
collagen and fibrinogen peptides. Consistent with the multivariate analysis, the
largest changes in the peptidome were observed between mild vs. healthy and
severe vs. healthy. While each pairwise comparison is heavily dominated by
ECM fragments, the regulated peptides common to all HC to AH comparisons
only contained 5 ECM peptides out of a possible 101. While these pilot data
provide strong evidence that altered ECM turnover is associated with the AH
spectrum additional research is required to confirm these findings.
While the sample handling, sample analysis and statistical modeling
integrated methods for sample handling randomization, inclusion of internal
standards and statistical modeling to account for random or fixed effect variables
there are still several limitations to these studies that should be noted. The
balance of HC to AH cohort is imbalances in “n” values and this may be
insufficient to adequately power the study. Additionally, the potential for a
“clinical site effect” is present. The HC plasma samples were recruited at the
University of Louisville. The Mild-A and Mild-B plasma samples were recruited at
the NIH-NIAAA. The Moderate and Severe plasma samples were recruited at
the University of Louisville, the University of Massachusetts Medical School, the
University of Texas-Southwestern and the Cleveland Clinic. Therefore, the
potential for a “clinical site effect” is present. Despite these study limitations the
statistical modeling and informatics filtering of the peptidomics data supports the
hypothesis that the ECM plasma degradome is associated with the AH spectrum.

125
These patterns of select peptidome “features” can be investigated further in
future studies as biomarkers for AH severity and outcome.

126
CHAPTER V
CHRONIC MODERATE ALCOHOL CONSUMPTION INFLUENCES RENAL
CORTICAL OXIDANT RESPONSE PATHWAYS
A. Introduction
Ethanol (EtOH) is arguably the most common substance voluntarily
consumed at toxic doses by humans. Pharmacologically relevant concentrations
of EtOH affect multiple organs,(148, 149) and EtOH consumption is a known risk
factor in over 200 health conditions (9). Despite this knowledge, the ability to
reverse EtOH-induced organ damage or predict at-risk individuals for EtOH-
induced organ damage is limited even in well-known target organs (e.g. the liver)
(150). In contrast to the liver, it is unclear if the kidney is a direct target of EtOH
toxicity. Heavy EtOH consumption is well recognized to be associated with
enhanced risk for renal failure secondary to hepatic cirrhosis, a phenomenon
known as hepatorenal syndrome (HRS) (151). Renal failure associated with HRS
is a complication in 14.4% of AH patients having MELD scores ≥22 (152). The
widespread view that this renal failure is strictly secondary to hepatic cirrhosis
with no role for direct EtOH nephrotoxicity may largely be an artifact of clinical
charting, as was the case for alcoholic pancreatic damage (153). Moderate
EtOH consumption is, however, absent from listed risk factors for chronic kidney

127
disease (154), and connections between alcohol use disorders and kidney
damage are controversial (155). Studies on moderate EtOH consumption have
shown EtOH to be (1) inversely associated with development or progression of
chronic kidney disease (85, 95, 156, 157) and (2) associated with improved
outcomes in renal transplant patient populations (158, 159). However, these
studies were not specifically designed to address the question as to whether or
not EtOH consumption damages the kidneys, and a mechanistic explanation for
these observations has not been explored. Overall, a more in-depth investigation
is justified to discern both the direct and indirect effects of EtOH on the kidney.
Rodent studies have identified detrimental effects of EtOH to kidney at the
tissue and subcellular, including increased tissue markers of oxidative damage
and myeloperoxidase expression in rats (87) and increased Cyp2e1
induction(88), and mitochondrial protein hyper-acetylation in mice (86). These
investigations have been driven by the hypothesis that the effect of EtOH on the
kidneys mirrors its effects on the liver. Confirmation of these parallel mechanisms
between these two organs may be due to similarities in expression of EtOH
metabolizing enzymes Cat and Cyp2e1. However, while the liver and kidney are
the major organs for EtOH detoxification, significant differences in structure,
function, and parenchymal composition exist.
We used discovery-based proteomic and transcriptomic approaches to study
the effects of EtOH on the renal cortex and secondarily the effects of EtOH pre-
exposure on the response (4h and 24h) to LPS (10mg/kg i.p.). Integrated IPA
studies demonstrated significant EtOH-alone effects on multiple canonical

128
signaling pathways including decreased activation of the Nuclear factor
(erythroid-derived 2)-like 2 (Nrf2) and increased activation of the aryl
hydrocarbon receptor (Ahr) oxidative stress responses pathways. These studies
suggested an EtOH-dependent, selective dysregulation of cortical oxidant
response pathways.
B. Experimental procedures
1. Animals and exposures
Mice were exposed to chronic ethanol and/or LPS as described in Chapter II.
Mice were exposed to chronic ethanol and/or ethanol binge as described in
Chapter II.
2. Histology and immunohistochemistry
Renal cortex tissue was stained with PAS as described in Chapter II. IHC for
Mpo and Cat was conducted on renal cortex tissue as described in Chapter II.
4. Blood urea nitrogen analysis
BUN in mouse plasma was determined using a standard kit as described in
Chapter II.
5. Proteomic sample handling
3 control mice, 3 ethanol mice, 3 4h LPS mice, and 3 ethanol+4h LPS mice
were used for the renal cortex proteomic analysis. Proteins were extracted from

129
renal cortex tissue, digested, labeled, and prepared for LC-MS/MS analysis as
described in Chapter II.
6. Liquid chromatography and tandem mass spectrometry
1D-LC-MS/MS analysis and subsequent data analysis were carried out as
described in Chapter II
7. RNA seq analysis
3 control mice, 3 ethanol mice, 3 4h LPS mice, and 3 ethanol+4h LPS mice
were used for the renal cortex transcriptomic analysis. The same mice were
used for the renal cortex proteomics and transcriptomics, except for 1 4h LPS
mouse and 1 ethanol+4h LPS mouse that were different. RNA was isolated from
renal cortex sections and RNA Seq analysis was carried out as described in
Chapter II. RNA Seq data were analyzed as described in Chapter II.
8. Multivariate analysis of proteomic and transcriptomic data
Multivariate analysis of proteomic and transcriptomic data was completed as
described in Chapter II.
9. Immunoblot analysis
Western blot analysis was carried out on protein extracted from renal cortex
tissue as described in Chapter II. Primary antibodies against Nqo1, Sod1, Sod2,
Gclc, and Cat were used.

130
10. Statistical analyses
Statistical analyses of proteomic and transcriptomic data were carried out as
described in Chapter II.
C. Results
1. Ethanol, LPS, and the combination increase blood urea nitrogen
The Lieber-DeCarli model (Fig. 5.1A) of chronic moderate EtOH consumption
was used to examine the effects of EtOH ± LPS on the kidneys of male mice.
This is an established model that causes early alcohol-induced liver injury and
sensitizes the liver to a subsequent inflammatory insult, such as LPS.(93).
Ethanol consumption caused a small but significant increase in BUN levels
(p<0.05) in mice in the absence of an LPS challenge (Fig. 5.1B). LPS injection
significantly increased BUN levels (p<0.005) 24h after injection; ethanol exposure
did not significantly alter the increase in BUN caused by LPS administration.
2. Ethanol alone contributes little-to-no morphological changes to
mouse renal cortex
Analysis Hematoxylin and Eosin- (H&E, not shown) and PAS-stained (Fig.
5.2) tissue sections identified mild proximal tubular brush border loss with LPS
and increased infiltration of polymorphonuclear leukocytes (PMNs, as noted by
yellow arrows). However, little-to-no obvious histologic differences were detected

131
Figure 5.1: Effects of chronic moderate EtOH feeding and low dose
(10mg/kg intra-peritoneal (i.p.) lipopolysaccharide (LPS) on blood urea
nitrogen (BUN).
(A) To model chronic moderate EtOH consumption the Lieber DeCarli diet model
of a four week escalation followed by a two week hold at 6% EtOH in the liquid
diet was used. Control animals received a isocaloric substitute of maltose-dextrin
in the liquid diet. A LPS (10mg/kg) LPS or saline injection given i.p. either 4h or
24h prior to sacrifice. (B) Baseline differences in BUN were observed with EtOH
feeding as well as an LPS effect at 24h. Statistical differences were determined
using students t-test or two-way ANOVA, *p≤0.05, **p≤0.005.

132
A
B
S a lin e 4 h L P S 2 4 h L P S
0
5 0
1 0 0
1 5 0
2 0 0
Blo
od
U
re
a
Nit
ro
ge
n
(mg
/dL
)
C o n tro l
E tO H
*
* *
* *

133
Figure 5.2: Mild effects of EtOH and/or LPS on renal architecture.
Histologic evaluation by periodic acid-shiff (PAS) stain (100x) demonstrates
unremarkable effects on renal parenchymal architecture of control (left column,
n=3) versus EtOH fed (right column, n=3) animals. Following low-dose
(10mg/kg) i.p. LPS renal cortical sections demonstrate low to moderate levels of
tubular dilation, vacuolization, brush border loss and PMN infiltration at 4h
(middle row) and 24h (bottom row). Glomerular infiltration by
polymorphonucleated cells is noted by yellow arrows (→).

134
Control EtOH
Saline (i.p.)
LPS-Post (4h)
(10mg/kg i.p.)
LPS-Post (24h)
(10mg/kg i.p.)

135
in kidneys from mice exposed to EtOH versus control or EtOH + LPS versus LPS
alone, suggesting at the gross level there was no need for tissue scoring of
kidney histology.
3. Ethanol attenuates LPS-induced cortical recruitment of MPO-positive
cells
Although gross histology was unaffected by exposure regimen, the PAS stain
demonstrated that LPS exposure increased the number of infiltrating neutrophils
and caused brush border loss both 4 and 24h after challenge in the EtOH and
control cohorts. Based on quantitative IHC, control and EtOH-fed mouse kidneys
were similar and unremarkably different for Mpo staining (Fig. 5.3). LPS induced
a strong, significant recruitment of Mpo-positive cells into the cortex. Moreover,
EtOH significantly attenuated the recruitment of Mpo-positive cells caused by
LPS at 4h but not 24h post-injection (Fig. 5.3).
4. Ethanol and LPS each cause unique protein abundance patterns.
Proteomic analysis of TMT 10-plex labeled cortical digests (Fig. 5.4A)
resulted in identification of over 2,400 proteins (Fig. 5.4B) by two or more
peptides. Chronic, moderate EtOH consumption increased the abundance of 22
proteins and decreased the abundance of 70 proteins (Fig. 5.4C). Significant
protein abundance changes in the LPS compared to control animals were
greatest at 24h (108 increased, 10 decreased) compared to 4h-post LPS
challenge (43 increased and 19 decreased) (Fig. 5.4D-E).

136
Figure 5.3: LPS induced infiltration of myeloperoxidase (MPO) positive
cells into the renal parenchyma.
(A) Infiltration of MPO positive cells was quantified by IHC staining and counting
of MPO-positive cells (40x) in glomerular (→) and tubular (→) compartments
(33±4 visual fields per kidney section). (B) Infiltration was significantly increased
at both 4h (n=3) and 24h after LPS (n=3), compared to baseline (n=3). There
was significant difference between control (n=3) and EtOH fed animals (n=3) at
4h post low dose LPS i.p. challenge. Statistical differences were determined
using students t-test or two-way ANOVA, *p≤0.01, **p≤0.005, @p≤0.0001.

137
LPS (10mg/kg i.p.)
Control
EtOH
Saline Post (4h) Post (24h)
S a lin e L P S (4 h ) L P S (2 4 h )0
5
1 0
1 5
Co
rti
ca
l M
PO
/vis
ua
l fi
eld
C o n tro l
E tO H
p < 1 .0
**p < 0 .0 0 5
p = 0 .3 3
@p < 0 .0 0 0 1
*p < 0 .0 1
#p < 0 .0 0 1
A
B

138
Figure 5.4: Workflow and characterization of the global effect of EtOH and
LPS on the cortical proteome.
Using a TMT workflow (5.4A) the renal proteomic dataset included 2,487 proteins
(>98% at ≥2-peptide level, (5.4B) detected with high confidence. Differences of
relative abundance are shown as Log2 fold change (FC) and are evaluated in
volcano plots (5.4C-G) with a FC >1.2 and corrected ANOVA p-value<0.05
considered significant. As a primary hit, the effects of EtOH and LPS are
comparable in magnitude. This time dependent effect was maintained (5.4F-G)
with the two-hit comparison of EtOH on an LPS background (EtOH+LPS versus
LPS) with smaller differences observed by log2 FC (EtOH+4hLPS to 4hLPS)
compared to log2FC (EtOH+24hLPS to 24hLPS).

139
Renal Cortex Proteome
log2(EtOH+24h LPS/24h LPS)
-2 -1 0 1 2
-lo
g10(p
valu
e)
0
1
2
3
4
Renal Cortex Proteome
log2(24h LPS/Control)
-3 -2 -1 0 1 2 3
-lo
g1
0(p
va
lue
)
0
1
2
3
4
Renal Cortex Proteome
log2(4h LPS/Control)
-2 -1 0 1 2
-lo
g1
0(p
valu
e)
0
1
2
3
4
Renal Cortex Proteome
log2(EtOH/Control)
-2 -1 0 1 2
-lo
g1
0(p
valu
e)
0
1
2
3
4
4319
2270
Frequency
0 200 400 600 800 1000
Nu
mb
er
of
pep
tid
es
pe
r p
rote
in
1
2
3-5
6-10
11-20
21-50
51-100
101-150
41
430 952
485
52
276
211
7
Extraction
Digestion
TMT-labeling
LC-MS/MS
Proteome-DiscovererScaffold Q+S v4.8.5
A B
D E
C
EtOH- +
0 h4 h24 h
LPS
10810
Renal Cortex Proteome
log2(EtOH+4h LPS/4h LPS)
-2 -1 0 1 2
-lo
g1
0(p
va
lue
)
0
1
2
3
4
104 7138
F G

140
value) <0.05) trends in protein abundance fold-changes (Log2FC>0.5 or
Log2FC<-0.5) with larger fold changes between two or more conditions. A four
protein grouping (Ehhadh, Acad11, Sqstm1, and Hnrnpc) had diminished
abundance with EtOH versus control (Fig. 5.5A, dotted box) but the differences
were normalized at 4h- and 24h-post LPS. A second grouping of ribosomal
proteins (Rpl6, Rpl8, Rpl13a, and Rps15) had increased abundance in EtOH-fed
animals on a background of 24h LPS (Fig. 5.5B, dotted box).
5. RNA seq data support proteomic data for LPS effect.
To study the early two-hit effects of EtOH ± LPS, the RNA were isolated from
EtOH, control, 4h LPS and EtOH+4h LPS animals only. The RNA integrity
number (RIN) values for RNA isolated from mouse kidneys averaged 7.8 ± 0.5.
Following ribosomal depletion, RNA library preparation and high throughput
sequencing, a total of 47,719 transcripts were observed including 24,405
detected in all samples. Of 47,719 detected transcripts, EtOH increased the
expression of 88 and decreased the expression of 99 (Fig. 5.6D/Table 5.1A).
LPS increased the expression of 1,468 and decreased the expression of 911
transcripts (Fig. 5.6E/Table 5.1A). Hence, 4h LPS, compared to EtOH, induced
approximately a 10-fold increase of differentially abundant transcripts relative to
the control animals (Fig. 5.6E-G). As shown in Table 1, EtOH significantly (q ≤
0.05; Log2FC≥1) altered the expression of six (6) transcripts apparently
independent of LPS.

141
Figure 5.5: Quantitative cluster analysis reveals EtOH-regulated protein
clusters.
Log2 FC values are plotted relative to the pooled internal standard reporter ions.
(A) EtOH-dependent, LPS-independent protein abundance changes. Significant
differences (q-value <0.05) were observed for a protein cluster in control versus
EtOH (black dotted boxes). (B) EtOH-dependent and late (24h) low dose LPS
protein abundance changes of ribosomal-related gene product cluster.
Significant differences (q-value <0.05) were observed for LPS 24h versus EtOH
+LPS 24h (black dotted boxes).

142
Co
ntr
ol
LP
S (
4h
)
LP
S (
24h
)
EtO
H
EtO
H +
4h
LP
S
EtO
H +
24h
LP
S
-1 .0
-0 .5
0 .0
0 .5
1 .0
1 .5
E tO H -d e p e n d e n t P ro te o m e C h a n g e s
Lo
g2
F
old
Ch
an
ge
TM
T R
ep
orte
r I
on
E h h a d h
A c a d 1 1
S q s tm 1
H n rn p c
* (q < 0 .0 5 )
Co
ntr
ol
LP
S (
4h
)
LP
S (
24h
)
EtO
H
EtO
H +
4h
LP
S
EtO
H +
24h
LP
S
-1 .0
-0 .5
0 .0
0 .5
1 .0
E tO H a n d L P S In te ra c tio n
R ib o s o m a l R e la te d G e n e P ro d u c ts
Lo
g2
F
old
Ch
an
ge
TM
T R
ep
orte
r I
on
R p l6
R p l1 3 a
R p l8
R p s 1 5
( * q < 0 .0 5 )
B
A

143
6. Ethanol alone downregulates Nrf2-mediated oxidative stress
response pathways at the protein level and transcript level.
A multivariate comparison by IPA of the top-20 canonical signaling pathways
for the proteome and transcriptome by single-hit (EtOH compared to control,
4hLPS compared to control) and two-hit comparisons (EtOH + 4h LPS compared
to 4h LPS; EtOH +4h LPS compared to EtOH) are shown in Fig. 5.5A. The
effects of EtOH feeding ± LPS exposure on signaling pathways (Fig 5.5A) or
individual protein abundance levels (Fig 5.5B) are illustrated as heat maps.
Heat-map colors are assigned dichotomously to illustrate activation (positive Z-
score, red/orange) or inactivation (negative Z-score, green/blue) based on the
Log2 relative abundance changes for proteins or transcripts within the pathway
as previously discribed.(160, 161) Six overlapping canonical pathways (noted by
asterisks) for EtOH alone include effects on cell-cell interactions, oxidant stress
response, actin reorganization, protein unfolding stress response and protein
translation.
In the EtOH vs. control comparison for both the proteomic and
transcriptomic analyses, Ahr signaling had a positive z-score (i.e. overall pathway
activation) largely due to decreased abundance of heat shock protein 90-α and –
ß proteins, increased abundances Ahr-targets Nqo1, Aldh isoforms and Gst
enzymes. Nrf2-mediated oxidative stress response canonical pathway had a
negative z score (i.e. overall pathway deactivation, Fig. 5.7A-B) due to large
decreases in Nrf2 targets such as Sod1, Sqstm1/p62, and Gclc. LPS caused
overall strong positive z-scores for the acute phase response signaling pathway

144
Figure 5.6: Workflow and characterization of the EtOH and 4h LPS
regulated transcriptomes.
Of 47,719 detected transcripts (36,571 in Venn Diagrams) after filtering for
corrected p-value (Benjamini-Hochberg q-value <0.05), (D) EtOH increased the
expression of 88 (red points) and decreased the expression of 99 (green points).
(E) LPS increased the expression of 1,468 (red points) and decreased the
expression of 911 (green points) transcripts. (F) EtOH on a background of 4h
LPS increased the expression of 79 (red points) and decreased the expression of
68 (green points) transcripts.
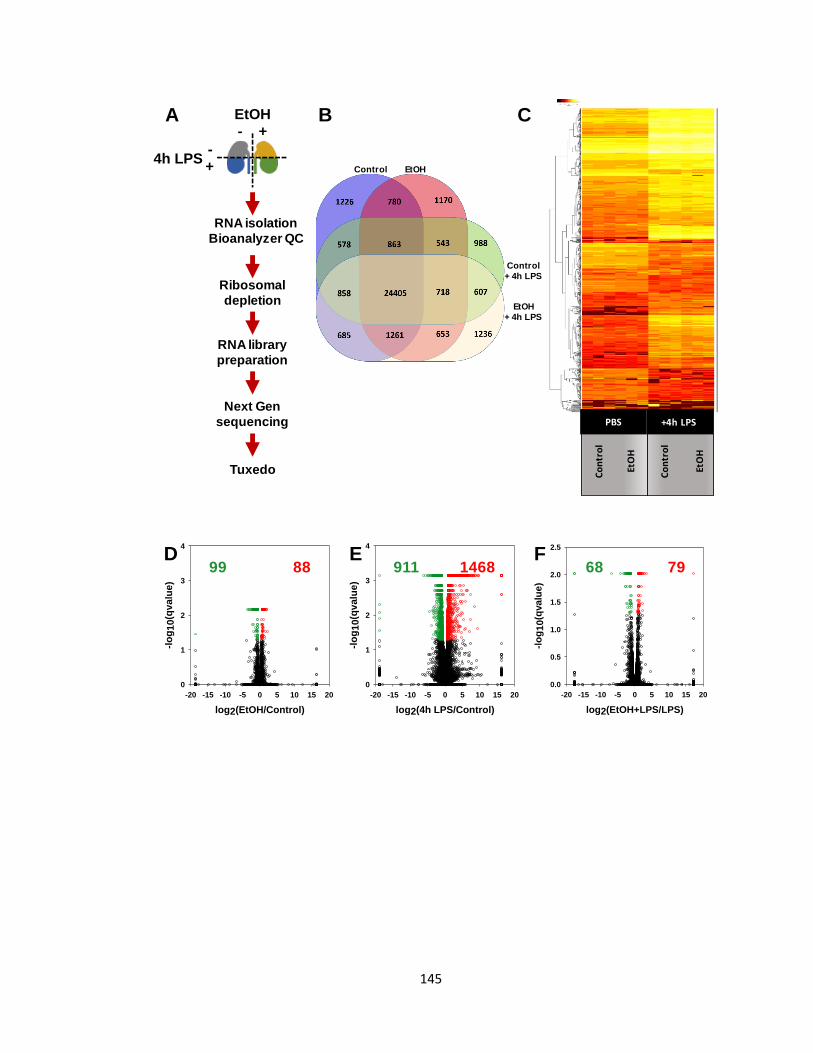
145
Renal Cortex Transcriptome
log2(EtOH/Control)
-20 -15 -10 -5 0 5 10 15 20
-lo
g1
0(q
va
lue
)
0
1
2
3
4
8899D
A CEtOH- +
-+
4h LPS
RNA isolation
Bioanalyzer QC
Ribosomal
depletion
RNA library
preparation
Next Gen
sequencing
Tuxedo
B
Renal Cortex Transcriptome
log2(4h LPS/Control)
-20 -15 -10 -5 0 5 10 15 20
-lo
g1
0(q
valu
e)
0
1
2
3
4
1468911E
Co
ntr
ol
EtO
H
Co
ntr
ol
EtO
H
+4h LPSPBS
Renal Cortex Transcriptome
log2(EtOH+LPS/LPS)
-20 -15 -10 -5 0 5 10 15 20
-lo
g10(q
valu
e)
0.0
0.5
1.0
1.5
2.0
2.5
7968F
Control EtOH
Control
+ 4h LPS
EtOH
+ 4h LPS

146
Table 5.1: Effects of EtOH and LPS on differentially regulated cortical RNA
transcripts, differentially regulated genes, and one-hit/two-hit associated
Top-5 Gene Ontology (GO) terms.

147
Transcriptional Responses Differentially Expressed Genes (DEGs)
Treatment Comparator
Multiple Comparison
Correction
Relative Fold-Change
Filtered
p ≤ 0.05 q ≤ 0.05 p ≤ 0.05 q ≤ 0.05; logFC≥1
EtOH Control 187 (88↑, 99↓) 66 (22↑, 44↓)
4h LPS Control 2379 (1468↑, 911↓) 1814 (1141↑, 673↓)
EtOH+4h LPS EtOH 2695 (1538↑, 1157↓) 1842 (1114↑, 728↓)
EtOH + 4h LPS 4hLPS 147 (79↑, 68↓) 135 (68↑, 67↓)
Regulated Transcripts: Treatment versus Control (One-hit)
Treatment GO Term Description Genes q-value
EtOH
response to interferon-gamma 2 0.011
skeletal muscle tissue development 3 0.012
innate immune response 5 0.012
regulation of body fluid levels 4 0.014
skeletal muscle organ development 3 0.014
4h LPS
innate immune response* 146 8.43E-50
response to cytokine* 130 4.94E-36
regulation of cytokine production* 128 1.96E-34
defense response to other organism* 123 4.76E-34
positive regulation of cytokine production 97 4.24E-31
Regulated Transcripts: Treatment versus [EtOH + 4h LPS] (Two-hit)
Treatment GO Term Description Genes q-value
EtOH
innate immune response* 149 4.34E-51
response to cytokine* 140 6.71E-42
defense response to other organism* 122 1.22E-32
regulation of cytokine production* 126 2.18E-32
cellular response to cytokine stimulus 107 1.08E-29
4h LPS
positive regulation of smooth muscle cell proliferation 6 6.24E-06
positive regulation of cell migration 11 1.42E-05
positive regulation of cell motility 11 1.91E-05
wound healing 10 2.16E-05
positive regulation of cellular component movement 11 2.37E-05
DEG Expression Regulation Trends (q ≤ 0.05; logFC≥1)
mRNA Expression Changes by EtOH diet independent of 4h LPS exposure
Kynu ↑
Slc7a12a↑
Cntnap5↓
Cyp4a12a↓
Gm6300↓
Kif20b↓
mRNA Expression Changes by 4h LPS exposure independent of EtOH diet
Ifit1 ↑
Ifit2↑
Saa2↑
Lcn2↑
Camp ↑
Cxcl1↑
Cxcl10↑
Gm28347↑
Mx1↑
Slfn4↑
Trem1↑
Bsnd↓
Cd300lg↓
Cldn15↓
Clec14a↓
Cyp26b1↓
Exoc3l2↓
Myct1↓
Rasgrp3↓
Slc9a3r2↓
Sox17↓

148
and the LXR/RXR activation pathway, whether or not mice were fed an EtOH
diet.
7. Effects of ethanol and LPS on catalase abundance.
Cat IB analysis confirmed proteomic findings, demonstrating a significant (2-
way ANOVA, *p-value<0.05) decrease of approximately 40-50% in the renal
cortical tissue of EtOH fed mice with an insignificant LPS-effect (Fig. 5.10A-B).
Additional Cat IB analyses lysates from a chronic-plus-binge study of alcohol
feeding demonstrated similar effects on Cat abundance following 10-day EtOH
feeding or, strikingly, 9h post-EtOH gavage (Fig. 5.10C). This data suggested the
effect of EtOH on Cat abundance was not associated with the chronicity of EtOH
feeding, IB.
8. Data Sharing
Proteomic files including acquired LCMS data (.RAW), search engine files
(.mgf), and search results aggregated into a Scaffold3 (.sf3,
ProteomeSoftware.com) have been deposited with MassIVE
(http://massive.ucsd.edu/) data repository with the Center for Computational
Mass Spectrometry at the University of California, San Diego (MSV000083053)
and shared with the ProteomeXchange (www.proteomexchange.org)
(PDX011429). Experimental details for NextGen sequencing and sequencing

149
Figure 5.7: | Effects of EtOH feeding on Cat abundance in the renal cortex.
Cat immunoblot analysis (A) demonstrates a significant reduction of Cat protein
with EtOH feeding (n=3) compared to control (n=3) without LPS administration
(two-way ANOVA *p-value<0.001). IHC staining (10X) for Cat (B) demonstrated
comparable EtOH-associated decreases in the cortical tissue
(cortical/juxtamedullary boundary noted by red dashed line) of LPS-naïve (n=3)
mice compared to control (n=3) and LPS-challenged mice (n=3) compared to
LPS alone (n=3). (C) Similar EtOH effects on Cat abundance were observed
using a separate more severe model of EtOH feeding (NIAAA chronic plus binge
model; control n=3, chronic EtOH n=3, EtOH gavage n=3, chronic EtOH+EtOH
gavage n=3).

150
A
C o n tro l E tO H0 .0
0 .5
1 .0
1 .5
2 .0
De
ns
ito
me
try
Ra
tio
(no
rm
ali
ze
d t
o
GA
PD
H) / S a lin e
/ L P S (4 h )
*p < 0 .0 0 0 1
Catalase
Gapdh Co
ntr
ol
EtO
H
Catalase IHC 10x PBS +4hLPS
B
C
Catalase
Gapdh
Diet MD Et MD Et
Gavage MD MD Et Et
M D -g a v a g e E tO H -g a v a g e
0 .0
0 .5
1 .0
1 .5
De
ns
ito
me
tric
Ra
tio
(no
rm
ali
ze
d t
o G
ap
dh
)
M D -d ie t
E tO H -d ie t
*
* *
*

151
results have been deposited with the NCBI Gene Expression Omnibus (162)
(https://www.ncbi.nlm.nih.gov/geo) as the study GSE81947.
D. Discussion
Ethanol consumption is a risk factor in numerous health conditions, yet it is
still unclear if the kidney is a direct target of EtOH toxicity. Hypothesis-driven
studies on the effects of EtOH consumption on renal parenchyma are limited.
We hypothesized that chronic, moderate EtOH consumption affects the kidney
through pre- or post-translational regulation of protein abundance. Furthermore,
these modifications contribute to the kidneys response to a second acute
nephrotoxic event, such as experimental endotoxemia (163, 164). The current
study addresses the hypothesis that chronic, moderate EtOH consumption
significantly affects proteins, transcripts and canonical pathways in the kidney
and the canonical response is modified by acute experimental endotoxemia (i.e.
low dose LPS (10mg/kg) i.p.).
First, we examined the effects of EtOH and LPS on renal function and tissue
structure. EtOH significantly increased BUN, a marker of kidney injury, as in a
similar rodent model (87). LPS increased BUN (24h > 4h) in the presence or
absence of EtOH, consistent with other studies of the same dose of LPS in mice
(165). The effects of chronic, moderate EtOH consumption on the kidney at the
tissue level were largely indiscernible, as shown by PAS histology. Our data
show no significant effect of EtOH recruitment of MPO-positive cells into the
kidney unlike differing reports in the rat Lieber-DeCarli model (87). The effect of

152
EtOH on LPS recruitment of MPO positive cells demonstrated a significant
decrease at 4h post i.p. challenge that was lost at 24h. It is not clear if this
difference was mitigated at the level of recruitment or clearance. However, EtOH
is known to enhance neutrophil apoptosis, which suggests that our observations
may result from increased neutrophil clearance in the EtOH fed mice (165).
Next, a discovery-based ‘omics (Fig. 2A) approach was used to unbiasedly
identify proteins, transcripts, and canonical signaling pathways affected by
chronic, moderate EtOH consumption. EtOH significantly changed 92, 14, and
109 proteins on a control, 4h LPS, and 24h LPS background, respectively. It is
known that TMT-based proteomic studies may underestimate fold-change
differences (166), and therefore these numbers may underestimate the impact of
chronic EtOH exposure on the renal proteome. Specifically, a cluster of proteins
that EtOH significantly decreased in abundance compared to control included
Ehhadh, Acad11, Sqstm1, and Hnrnpc. Ehhadh, Acad11 and Sqstm1 are
important peroxisomal proteins involved in oxidation of fatty acids and regulation
of peroxisomal matrix composition. Many other proteins changed by EtOH are
not known to play a role in EtOH-induced mechanisms in the kidney or other
organs (Supplemental Data). However, EtOH also increased the abundance of a
cluster of ribosomal proteins (Rpl6, Rpl8, Rpl13a, and Rps15) on a background
of 24h LPS. Rpl13a (ribosomal protein L13a) has previously been described as
a critical component of the interferon (IFN)-γ-activated inhibitor of translation or
‘GAIT’ system (166). The GAIT system is comprised of glutamyl-prolyl tRNA
synthetase, NS1-associated protein 1, Rpl13a, and glyceraldehyde-3-phosphate
153
dehydrogenase. The increased abundance of a critical GAIT component in the
EtOH + 24h LPS animals compared to the 24h LPS animals could contribute to
an attenuated renal IFN-γ response in the two-hit model. Further investigation
would be needed to confirm up-regulation of the GAIT system as a protective
measure for experimental endotoxemia in Lieber-DeCarli EtOH-fed animals.
The transcriptomic study identified renal transcripts and pathways affected by
EtOH and/or the early acute phase period following 4h LPS. Hierarchical
clustering of transcriptomic data demonstrates 6-7 major dendrogram arms of
robust LPS-dependent transcriptomic changes (Fig. 5.4C). For the renal
transcriptome LPS had a 10-fold larger effect on regulated transcripts (q<0.05)
and with larger fold-changes as compared to EtOH as the single hit (Table 1A).
Quantitatively, chronic EtOH consumption consistently affected a sub-set of
regulated transcripts (e.g. increased- KYNU, SLC7A12, decreased- CNTNAP5,
CYP4A12A, GM6300, and KIF20B) even on a background of LPS exposure.
The KYNU gene encodes the enzyme L-kynureninase that hydrolyzes
kynurenine into anthranilate + L-alanine. Tryptophan metabolites such as
kynurenine have been reported to inhibit aldehyde dehydrogenase (Aldh) activity
(167), and increased KYNU expression suggests an EtOH-dependent
compensatory mechanism to increase the kidneys capacity to metabolize
acetaldehyde, a toxic intermediate in the oxidation of EtOH. SLC7A12 is an Asc-
type cationic amino acid transporter (y+ system) and increased arginine uptake
by endothelial Asc-type cationic amino acid transporters has been shown to blunt
oxidative stress (168). GM6300 is a SLC7 pseudogene adjacent to SLC7A12 in

154
the murine genome. Transcriptomic studies of 15-week old OVE26 kidneys
identified 638 genes regulated by the diabetic state. The single largest increased
(SLC7A12) and decreased (GM6300) genes by informatics analyses were
associated with endoplasmic reticulum (ER) stress (169). EtOH-
independent/LPS-dependent mRNA expression (Table 5.1) changes modeled
proteomic findings for acute phase stress response (Fga, Fgb, Fgg) or interferon-
responsive gene products (Ifit1, Ifit2, Saa2, and Lcn2). Unlike previous studies in
the liver and lung, LPS did not induce an EtOH-dependent synergistic increase
the acute phase response gene products PAI-1 (1, 170). Our data for significant
EtOH induction of renal CXCL1 (KC) (and CXCL10) transcript add to our prior
report in plasma, liver and lung of the Lieber-DeCarli model requiring a two hit
(EtOH + LPS) induction of KC (170). The comparison of GO terms impacted by
transcript regulation by EtOH suggested coordinated effects on a few transcripts
associated with interferon response, innate immunity response and skeletal
muscle development. Consideration of GO features for transcripts regulated by
EtOH pre-exposure on the LPS background clustered on terms for muscle cell
proliferation and cell movement. LPS as a single hit or second hit induced large
changes in transcript numbers, affecting expected GO terms: innate immune
response, cytokine response and positive regulation of cytokine production. This
more robust effect of 4h LPS on the transcriptome compared to EtOH is
unsurprising, since LPS is well known to enhance and activate gene programs of
transcription factors such as NF-κB (171, 172). Overall, the transcriptomic effect

155
of EtOH is muted as compared to the proteomic effect but in some regards
parallels other murine disease models associated with ER stress.
The proteomic and transcriptomic effects of EtOH and/or LPS were integrated
using pathways analysis. The integrated data revealed that EtOH, LPS, and
EtOH + LPS have differential effects on unique protein canonical signaling
pathways (Fig. 5.5A-B) related to transcription and translational signaling
pathways, as well as stress response pathways, for example: inactivation of Nrf2
(EtOH) and activation of the acute phase response or LXR/RXR (LPS) pathways.
Activation of hepatic LXRα is associated fatty liver pathogensis (172). Activation
of renal LXR has been shown to decrease cystic fibrosis transmembrane
conductance regulator (CFTR)-mediated chloride transport (173) and
downregulate sodium-phosphate cotransporters (173). The expected finding that
LPS activated the acute phase response pathway increased our confidence in
the unpredicted and novel findings, such as the overall inactivation of the Nrf2-
mediated oxidative stress response pathway (Fig. 5B).
EtOH-induced downregulation of select proteins in the Nrf2-mediated
oxidative stress response pathway was an unexpected finding, as EtOH is known
to induce Nrf2 through Cyp2E1 in the liver (174). Of the Nrf-2 targets, only Gclc
was down-regulated by NextGen transcriptomic data (mRNA log2FC -1.38, q-
value<0.007). In models of chronic kidney disease, Nrf2 pathway deactivation or
knock-out is known to cause injury from increased oxidative stress and/or death
(174-181). However, the EtOH-downregulation of proteins in the Nrf2 pathway
was not accompanied by significant renal injury as indicated by histology and

156
magnitude of BUN increase. There are several possible explanations for this.
First, EtOH activation of other transcription factors (e.g. Ahr, Sp1, or AP-1)
successfully compensated for the downregulated components of the Nrf2
pathway and protected against injury (182-184). Second, the selective induction
of Nqo1 or Sod2 may be based on the binding to the antioxidant response
element (ARE) by unique Nrf2:cap n collar binding partner (e.g. Maf, MafF, MafB,
MafG, or PMF-1) complexes with targeted transcriptional activity (185-187).
Lastly, it is possible that neither the chronic, moderate EtOH consumption nor the
acute endotoxemia in these mice caused sufficient oxidative stress for the
decrease in select Nrf2 targets to be histologically deleterious.
EtOH-dependent reduction of Nrf2-related proteins may occur through one or
more of several potential mechanisms. Nrf2 is regulated by several mechanisms,
typically divided in to those dependent or independent of Kelch-like ECH-
associated protein 1 (Keap1)(188). One mechanism involves Nrf2 activation
through the Sqstm1/p62-mediated deactivation of Keap1 (189). In the present
study, EtOH decreased Sqstm1/p62 abundance with or without LPS-exposure.
EtOH exposure of neuronal cells in culture has been shown to lead to an
activation of autophagic pathways that includes loss of Sqstm1/p62 (190).
Therefore, EtOH may deactivate the Nrf2 stress response pathway by induction
of autophagy, Sqstm1/p62 loss, and concomitant activation of Keap1. These and
other potential mechanisms of EtOH-induced dysregulation of the Nrf2-mediated
oxidative stress response pathway will be investigated in future studies.

157
Cat (a Nrf2 target) abundance in the Lieber-DeCarli model decreased by 40-
50% while the CAT mRNA was stable (Log2FC -0.08, q<0.999). This suggests a
post-translational mechanism for decreased Cat abundance in the chronic
setting. We hypothesized this decrease would be more pronounced in a more
severe, acute-on-chronic NIAAA model (98) that better mimics human drinking
patterns. This would be an important finding as Cat plays a prominent role in
hydrogen peroxide degradation and of the three known EtOH oxidizing enzymes
(Ald, Cyp2E1, and Cat) is the most abundant in the renal cortex. Our data
demonstrated that in the NIAAA model, the chronic (10-day), acute (9h gavage),
and acute-on chronic EtOH consumption all decreased Cat abundance in the
renal cortex. The direct effects of EtOH on Cat will be investigated in future
studies.

158
CHAPTER VI
DISCUSSION AND CONCLUSIONS
A. Restatement of goals and questions
The overall goal of the work described in this dissertation was to discover new
potential mechanisms of alcohol-induced organ injury. The work summarized in
Chapter III aimed to test a novel method of analyzing the hepatic matrisome and
use that approach to determine the effects of chronic, moderate ethanol
consumption and acute inflammation on the hepatic matrisome in mice. Chapter
IV aimed to characterize the ECM degradome (peptidome) in AH patient plasma
that will allow further investigation into the use of plasma ECM peptides as
surrogate or mechanistic biomarkers. Finally, Chapter V of this dissertation used
a discovery based ‘omics approach to elucidate the effects of ethanol
consumption on the kidneys. Taken together, these studies provide new
understanding of the complex mechanisms of alcohol-induced organ injury.
B. Major findings of this dissertation
1. The hepatic “matrisome” responds dynamically to stress

159
The important role of the hepatic ECM in ALD pathophysiology is well known.
However, research on this topic has been largely ‘collagenocentric’ and
‘fibrosocentric’, that is, primarily focused on the role of the collagen matrix and
the dramatic ECM changes in the fibrosis stage of disease. It is now understood
that the ECM is not simply a collagen scaffold, but a complex microenvironment
that may be comprised of as many as 100 or more proteins at a time (191). The
group of proteins that makes up any specific ECM varies with organ and disease
state, and is a dynamic subset of over 1000 known ECM-related proteins (92). It
is therefore unsurprising that recent studies have shown that multiple ECM
proteins contribute to fibrosis (111). However, it is also now known that the
hepatic ECM is altered prior to fibrogenesis (89, 90). A limitation of previous
studies focused on the role of the ECM in ALD is that they generally studied
changes in one ECM protein at a time and did not consider structural changes
that may accompany altered ECM protein turnover. Therefore the goal of
Chapter III was to adapt a sequential protein extraction method originally
developed for cardiac tissue (99, 114, 121) to allow proteomic analysis of global
changes in the hepatic matrisome caused by chronic, moderate ethanol
consumption and acute inflammation (LPS). Furthermore, the sequential protein
extraction method reveals potential changes in ECM protein crosslinking,
location, and other aspects. Overall, this approach provides new insight into
novel matrisome protein changes caused by inflammatory stress.
This approach divided the hepatic ECM proteome into four distinct extracts:
(1) loosely-associated ECM proteins (NaCl extract), (2) intracellular and

160
membrane-associated proteins (SDS extract), (3) tightly bound ECM proteins
(GnHCl extract), and (4) highly insoluble ECM components (the remaining pellet).
Qualitative analysis of the matrisome demonstrated that both ethanol and LPS
caused dynamic changes, with each exposure producing unique protein
abundance patterns across the four fractions. Indeed, ethanol and LPS each
increased the number of matrisome proteins by ~25% compared to control. The
combination of ethanol and LPS demonstrated patterns similar to each individual
exposure but also exhibited unique patterns. The unique subsets of proteins
qualitatively changed with ethanol and/or LPS may play critical roles in the
hepatic response to stress. Ethanol and/or LPS also quantitatively changed
abundance of many proteins that did not change qualitatively. These proteins
are new potential key players in liver injury, whose roles can be determined in
future studies. Furthermore, analysis of ethanol-specific matrisome changes
may provide new insights into the mechanisms of ethanol-sensitized liver injury,
which could reveal novel therapeutic targets. Most importantly, this work
demonstrates the dynamic, global response of the hepatic matrisome to stress
that opens a new, important area of future research. This work also lays the
foundation for future studies, such as the investigation of the ECM degradome in
the plasma of AH patients described in Chapter IV.
2. The plasma ECM degradome profile of alcoholic hepatitis patients
changes between MELD groups

161
Chapter IV of this dissertation aimed to characterize the plasma peptidome in
AH patients. This builds upon the work described in Chapter III of this
dissertation, which demonstrated that the hepatic ECM undergoes significant
remodeling during inflammatory liver injury in the absence of any apparent
fibrosis (93). This remodeling involves protease cleavage of ECM proteins,
which yields ECM peptide fragments (94). During remodeling, peptide fragments
of the degraded ECM have been shown to increase in biologic fluids (e.g.
plasma) (58, 59). Peptidomic analysis of the degraded ECM (i.e., ‘degradome)
has been identified as a useful diagnostic/prognostic tool in other diseases of
ECM remodeling (such as metastatic cancers)(58, 59). Current methods of
predicting AH outcome (i.e. clinical scores, e.g. MELD) are limited in their abilities
to predict at-risk patients with moderate disease(84). We hypothesized that the
severe inflammatory liver injury caused by AH would yield a unique degradome
profile in patient plasma.
In the pilot study described herein, a workflow was developed for the
peptidomic analysis of plasma from healthy participants or AH patients. AH
severity was stratified by MELD score as mild (<12; n=45), moderate (12-19;
n=23) or severe (>19; n=37). Hierarchical clustering of the peptidomic data
identified three strong groupings of peptide abundance patterns that reflected
combinations of (A) increased peptide levels in healthy controls, (B) increased
peptide levels in Moderate + Severe and (C) increased peptide levels in Mild-A +
Mild-B AH cohorts. Post-hoc filtering of the differentially abundant peptides
identified strong relative abundance changes in ECM peptides with strong

162
differences noted in the collagen and fibrinogen peptides. The unique patterns of
ECM and other plasma peptides ‘features’ across different severity groups of AH
patients can be confirmed using large longitudinal studies and can be
investigated further as potential mechanistic or surrogate biomarkers for patient
outcome. The characterization of the AH plasma degradome also supports
future mechanistic studies on the role of ECM remodeling in AH.
3. Alcohol consumption alters renal cortical oxidant response
pathways
The studies in Chapter III and Chapter IV focus on the toxic effects of ethanol
on its primary target organ, the liver. In contrast to the liver, the effects of ethanol
consumption on the kidneys are poorly understood. Some human studies have
reported benefits of chronic moderate EtOH consumption for preservation of
renal function (85, 95). However, the small number of rodent studies on the
effects of ethanol on the kidneys have reported that chronic ethanol consumption
upregulates CYP2E1 (88), causes neutrophil infiltration (88), and increases
acetylation of mitochondrial proteins (86) in the kidney. However, these previous
studies have been limited by the hypothesis that ethanol affects the kidneys by
mechanisms parallel to those in the liver. To bypass this limitation, the study in
Chapter V used an unbiased proteomic and transcriptomic approach to discover
novel players and pathways affected by ethanol and LPS in the renal cortex.
The proteomic analysis found that EtOH significantly changed 92, 14, and
109 proteins on a control, 4h LPS, and 24h LPS background, respectively.

163
Interestingly, ethanol significantly decreased the abundance of a cluster of
peroxisomal proteins compared to control. Ethanol also increased the
abundance of a cluster of ribosomal proteins on a background of 24-hour LPS.
The effects of ethanol on the transcriptome were more muted than the effects on
the proteome, suggesting that ethanol-induced protein may occur through
degradation or other transcription-independent mechanisms. Pathways analysis
of integrated proteomic and transcriptomic data revealed that ethanol caused
overall inactivation of the Nrf2-mediated oxidative stress response pathway. This
finding, which was confirmed with western blots, was surprising, as ethanol is
known to induce Nrf2 in the liver (174). This demonstrates the benefit of an
unbiased, discovery-based approach. Chronic ethanol consumption decreased
Cat (a Nrf2 target) abundance by 40-50%. The EtOH-associated effects on Cat
were confirmed using a separate chronic-plus-binge (NIAAA) model. This work
uncovers novel potential mechanisms by which ethanol effects the kidneys that
can be studied further in the future. Most importantly, these findings reveal that
chronic, moderate ethanol consumption affects the renal cortex at the protein and
transcript level in the absence of tissue-level changes.
C. Significance of new findings
Chapter III describes a new method of analyzing the hepatic matrisome and
revealed that the hepatic matrisome responds dynamically to stress. The
significance of this new method is that it can be adapted for analysis of the
matrisome in other liver pathologies (e.g., NAFLD) and in other organs (e.g., the

164
lung). The finding that the hepatic matrisome responds dynamically to
inflammatory stress is significant in that it provides a mechanistic link between
steatohepatitis and fibrogenesis. That ‘link’ is transitional ECM remodeling,
which is thought to be a pivotal point between disease restitution and progression
(1), and is therefore a promising target for new therapeutics. The work in
Chapter III identified specific protein players involved in remodeling that can be
investigated as drug targets in future studies. Furthermore, as ECM remodeling
yields degradation products that can be secreted into bodily fluids, knowledge of
remodeling also supports future investigations of the degradome (e.g. Chapter
IV) and the eventual development of novel biomarkers.
Plasma peptidomics is a novel approach for prognosis stratification in AH.
The work in Chapter IV found that peptides in the plasma of AH patients change
across groups separated by MELD score. Interestingly, patients with lower
MELD scores had dramatically higher abundances of plasma peptides than those
with higher MELD scores. This suggests that the degradome may be a positive
predictor of outcome in AH. Patient prognosis is a key factor in clinical risk-
benefit decision making regarding the administration of anti-inflammatory
pharmacotherapeutics. While this work could lead to novel surrogate
biomarkers, understanding the peptidome can also provide insight into AH
mechanisms. For example, the peptidome in Chapter IV can be used to predict
the proteases that generated it. This protease activity can be validated and
targeted in future studies, which could lead to new targeted therapies for AH.
Furthermore, the plasma peptides resulting from the protease activity could serve

165
as mechanistic biomarkers for response to the targeted therapy. Even apart from
these possibilities, the fact that this work demonstrated that acute hepatic
inflammation yields widespread, measurable changes in the plasma peptidome is
significant in itself.
The effects of ethanol consumption on the kidneys are poorly understood.
The work in Chapter V demonstrated that although ethanol consumption does
not cause histologically detectable changes in renal architecture, it does
influence the renal cortex proteome and, to a lesser extent, transcriptome. For
example, ethanol consumption caused overall inactivation of the Nrf2 pathway,
decreased abundance of peroxisomal proteins, and attenuated induction of LPS-
responsive genes. This suggests unique effects of ethanol on the kidney that do
not parallel those in the liver. These data provide new hypotheses for future
investigations on both the direct effects of ethanol on the kidneys and effects of
ethanol on other renal pathologies. More broadly, insight into the effects of
ethanol on the kidneys contributes to understanding of alcohol toxicity, which
could lead to new hypotheses and therapeutic approaches in the study of ALD.
D. Strengths and weaknesses of this dissertation
1. Strengths
There are several strengths of this dissertation. The first study provides
insight into the role of transitional ECM changes in ethanol-sensitized hepatic
inflammation (Chapter III) by characterizing the hepatic matrisome. This work
used a well-established mouse model of chronic, moderate ethanol consumption

166
and subsequent LPS exposure. Ethanol-sensitized hepatic inflammation is a
complex phenomenon that is not confined to a single organ or cell type and
cannot be wholly recapitulated in a simpler model (e.g. cell culture). The use of
an animal model as opposed to a human study allows many variables to be
controlled, such as number of calories consumed, genetic variability, and
environmental factors. This increases confidence that ethanol and/or LPS are
the variables that caused the experiment results. Another strength is that a new
method of protein extraction was validated for use with liver tissue, enabling the
analysis of low-abundance and highly insoluble hepatic ECM proteins. This
allowed for a discovery-based proteomic characterization of the matrisome that
provides a foundation for new hypothesis-driven studies and the identification of
new therapeutic targets. Importantly, this work also demonstrates that the
hepatic matrisome responds dynamically to stress in the absence of fibrosis.
The second study in this dissertation examines the plasma peptidome from
AH patients with disease severity stratified by MELD score. This investigation
uses plasma from human patients, and so it does not rely on assumptions
regarding the relevance of a model. Another strength is that several different
methods for the purification of peptides were tested, and the method which
yielded the most pure peptidome was chosen. Samples were handled randomly
in flights that contained a number of samples from each group that was
proportional to the total. This minimizes any bias caused by sample handling.
Samples were also spiked with a peptide standard prior to LC-MS/MS analysis to
control for time-dependent changes in the instrument. Additionally, the statistical
167
analysis of the peptidomic data accounted for several covariates, including
participant age and sex. The analysis included in this dissertation is preliminary,
and future analyses will ensure that all appropriate covariates are considered.
Another strength of this study is that patient plasma, as opposed to liver tissue,
was analyzed. This supports the future development of a minimally invasive
diagnostic tool.
The third study in this dissertation examines the effects of ethanol
consumption on the renal cortex proteome and transcriptome. This work
employed the same mouse model of chronic, moderate ethanol consumption and
a second ‘hit’ of LPS used in the first study in this dissertation. Therefore, the
same strengths associated with this model apply. This model is well established
and recapitulates the complexity of human alcohol consumption, while still
controlling many variables. Another strength of this work is that the proteomic
workflow included TMT labeling, which allows reliable relative quantification of
proteins between experimental groups. This work also used a discovery-based
‘omics approach, as opposed to a hypothesis driven approach. Hypotheses by
nature rely on previous knowledge, but very little is currently known about the
effects of ethanol on the kidneys. For this reason, a hypothesis-generating
approach was chosen, which provides a foundation for future studies. Indeed,
several effects of ethanol on the kidneys were identified which would not have
previously been expected. It should also be noted that expected LPS-activation
of the acute phase response pathway was observed, which can be viewed as a

168
“positive control” that increases confidence in the less expected results of this
study.
2. Weaknesses
The experiments described in Chapter III identified changes in the hepatic
matrisome after alcohol and LPS exposure. Although there are strengths
associated with the use of a mouse model, there are also limitations that should
be acknowledged. Although in vivo experiments may recapitulate human
disease more completely compared to in vitro experiments, in vivo research
introduces more complexity and less control of variables. Conversely, relevance
to human disease may be questionable when mouse models are compared to
human studies. It is therefore possible that the observed matrisome changes are
mouse-specific and have little direct relevance to humans. While the inverse
relationship between model relevance and ability to control variables can never
be entirely avoided, it can be optimized for the question at hand and thoughtfully
considered when interpreting results. Another limitation of this study is that the
biological replicate samples from the same fraction and same experimental group
were pooled prior to LC-MS/MS analysis due to cost and time constraints. This
means that a sample from a single mouse could have driven the observed
qualitative changes in protein abundance. For this reason, follow-up studies are
needed to confirm specific matrisome protein changes caused by ethanol and/or
LPS. Additionally, this study did not investigate the functional significance of
specific protein changes, and so future studies should address this.

169
The work in Chapter IV identified plasma peptides that change with disease
severity in AH patients. As with all human studies, there are many variables that
cannot be controlled, and should therefore be included as covariates in statistical
analyses. The analyses included herein consider age and sex as covariates, but
do not include other covariates, such as body mass index or race. Plasma from
different study groups was also collected at different sites, and so site-specific
changes need to be statistically accounted for to the extent possible. Therefore,
it is possible that variables other than AH severity may be involved in the
observed changes in peptide abundances. As noted previously, the statistical
analysis in this dissertation is a pilot study, and future analyses will more
thoroughly address potential confounding variables. Another limitation of this
study is that it is cross-sectional, and so large scale longitudinal follow-up studies
are needed to confirm the use of select peptides for outcome prediction.
The work in Chapter V identifies proteins, transcripts and pathways affected
by ethanol and/or LPS in the renal cortex. The same mouse model was used in
Chapter III. Therefore, the same model-related limitations apply that were
previously discussed. As with any animal model, the relevance of the
experimental results to human disease is not guaranteed, and neither is the
assumption that all potential confounding variables have been controlled. It
should also be acknowledged that another study reported that a similar rat model
of chronic ethanol consumption increased recruitment of MPO-positive cells into
the kidney, whereas we did not observe this effect (87). Another limitation is that
TMT labeling, which is used for relative quantification of protein abundance, is
170
known to cause signal suppression. Therefore, the observed protein-level
changes caused by ethanol and/or LPS may actually be greater than what was
observed. Additionally, it is standard practice to confirm phenomena of interest
observed with an ‘omics approach using an additional method (e.g. immunoblot
to confirm proteomics). Some protein-level changes reported here were indeed
confirmed with immunoblot, but other changes need to be confirmed in future
studies.
E. Future Directions
While the experiments described in this dissertation answered specific gaps
in our knowledge of alcohol-induced organ injury, it has also created new
questions that will need to be addressed in future studies. Three of these
questions of these are discussed below.
1. Does targeting the regulated “matrisome” proteins identified in
Chapter III prevent, halt, or reverse alcohol-induced organ injury?
The method described in Chapter III identified dynamic changes in the
hepatic matrisome after ethanol and/or LPS exposure. However, whether any of
these ECM proteins plays a critical role in alcohol-sensitized liver injury has yet to
be determined. To carry out this investigation, a select matrisome protein that
was strongly and uniquely affected by ethanol in Chapter III could be genetically
or pharmacologically targeted in a mouse model. These mice could be
administered the same model of chronic ethanol exposure followed by

171
inflammatory insult used in Chapter III. Hepatic inflammatory injury in these mice
could be examined with histology or other methods. If targeting a protein
mitigates damage, then that protein plays a critical role in damage. For example,
previous studies from our group demonstrated that the integrin inhibitor
CycloRGDfV protects against liver injury and inflammation caused by acute
ethanol exposure and LPS (192). Such findings would support the targeting of
the matrisome protein as a therapeutic strategy.
2. Do the regulated peptides and features identified in Chapter IV
predict alcoholic hepatitis patient outcome and/or response to
treatment in longitudinal studies?
The study in Chapter IV identifies plasma peptides of AH patients that change
in abundance with disease severity. Earlier in the discussion, it was noted that a
limitation of this study is that it is cross-sectional and therefore does not follow
the same patients over time. Since this research asks the question whether
peptide “features” can predict AH outcome, follow-up longitudinal outcome
studies would help answer this question more definitively. Such studies could
also investigate the ability of regulated peptide “features” to predict response to
treatment
3. What are the mechanisms by which alcohol consumption alters the
oxidant response pathways identified in Chapter V in the renal
cortex?

172
The experiments described in Chapter V identified the effects of ethanol
consumption on renal cortex proteins and pathways using a discovery-based
‘omics approach. The mechanisms by which ethanol elicits these effects are
unknown. The transcriptomic analysis in Chapter V revealed that the effects of
ethanol on the transcriptome were more muted than the effects on the proteome,
suggesting that ethanol-induced protein changes may occur through altered
protein degradation or other transcription-independent mechanisms. Targeting
one of these mechanisms in the same model of ethanol consumption used in
Chapter V would help determine the contribution of that mechanism to the
observed ethanol-induced effects. Since the ethanol-induced effects have
already been identified, they can now be detected with a more targeted method
(e.g. immunoblot or PCR) instead of an ‘omics approach. Additionally, molecular
signaling programs (e.g. phosphorylation cascades) likely play a role in
regulating the observed changes in protein abundance, and could be
investigated with a proteomic approach (e.g. phosphoproteomics), or other
methods. It should be noted that others have used acetylomics to determine that
chronic, moderate ethanol consumption causes mitochondrial hyperacetylation in
rodent kidneys (86). Links between this acetylomic data and the results in
Chapter V could be investigated in future studies.
F. Summary and Conclusions
The overall goal of the work described in this dissertation was to elucidate
mechanisms of alcohol-induced organ injury. Chapter III introduced a new

173
proteomic approach for characterizing the hepatic matrisome. That approach
was used to characterize the dynamic response of the matrisome to the stress of
chronic, moderate ethanol consumption and acute inflammation in mice. This
provides a foundation for future experiments to identify new players in transitional
ECM remodeling. Chapter IV demonstrated that AH causes detectable changes
in the plasma ECM degradome/peptidome of patients. These findings will allow
future investigations into the use of plasma peptide ‘features’ as biomarkers for
AH outcome. Finally, Chapter V revealed the effects of chronic ethanol
consumption and acute inflammation on the renal cortex proteome and
transcriptome. This work provides new hypotheses for future studies examining
the effects of ethanol on the kidneys. Taken together, this work reveals new
insight into mechanisms by which ethanol affects the liver and kidneys.

174
REFERENCES
1. Poole LG, Arteel GE. Transitional Remodeling of the Hepatic Extracellular Matrix in Alcohol-Induced Liver Injury. Biomed Res Int. 2016;2016:3162670. Epub 2016/11/16. doi: 10.1155/2016/3162670. PubMed PMID: 27843941; PMCID: PMC5098054. 2. 2015 National Survey on Drug Use and Health: Summary of the Effects of the 2015 NSDUH Questionnaire Redesign: Implications for Data Users. Rockville (MD)2016. 3. Peacock A, Leung J, Larney S, Colledge S, Hickman M, Rehm J, Giovino GA, West R, Hall W, Griffiths P, Ali R, Gowing L, Marsden J, Ferrari AJ, Grebely J, Farrell M, Degenhardt L. Global statistics on alcohol, tobacco and illicit drug use: 2017 status report. Addiction. 2018;113(10):1905-26. Epub 2018/05/12. doi: 10.1111/add.14234. PubMed PMID: 29749059. 4. Crews FT, Nixon K. Mechanisms of neurodegeneration and regeneration in alcoholism. Alcohol Alcohol. 2009;44(2):115-27. Epub 2008/10/23. doi: 10.1093/alcalc/agn079. PubMed PMID: 18940959; PMCID: PMC2948812. 5. Beier JI, Arteel GE, McClain CJ. Advances in alcoholic liver disease. Curr Gastroenterol Rep. 2011;13(1):56-64. Epub 2010/11/23. doi: 10.1007/s11894-010-0157-5. PubMed PMID: 21088999; PMCID: PMC3772541. 6. Guidot DM, Roman J. Chronic ethanol ingestion increases susceptibility to acute lung injury: role of oxidative stress and tissue remodeling. Chest. 2002;122(6 Suppl):309S-14S. Epub 2002/12/12. PubMed PMID: 12475807. 7. Adachi J, Asano M, Ueno Y, Niemela O, Ohlendieck K, Peters TJ, Preedy VR. Alcoholic muscle disease and biomembrane perturbations (review). J Nutr Biochem. 2003;14(11):616-25. Epub 2003/11/25. PubMed PMID: 14629892. 8. Pandol SJ, Raraty M. Pathobiology of alcoholic pancreatitis. Pancreatology. 2007;7(2-3):105-14. Epub 2007/06/27. doi: 10.1159/000104235. PubMed PMID: 17592222. 9. Global status report on alcohol and health 2018. Geneva: World Health Organization, 2018 Contract No.: Licence: CC BY-NC-SA 3.0 IGO. 10. Tuithof M, ten Have M, van den Brink W, Vollebergh W, de Graaf R. Alcohol consumption and symptoms as predictors for relapse of DSM-5 alcohol use disorder. Drug Alcohol Depend. 2014;140:85-91. Epub 2014/05/06. doi: 10.1016/j.drugalcdep.2014.03.035. PubMed PMID: 24793368. 11. Frantz C, Stewart KM, Weaver VM. The extracellular matrix at a glance. J Cell Sci. 2010;123(Pt 24):4195-200. Epub 2010/12/03. doi: 10.1242/jcs.023820. PubMed PMID: 21123617; PMCID: PMC2995612. 12. Sewry CA, Muntoni F. Inherited disorders of the extracellular matrix. Curr Opin Neurol. 1999;12(5):519-26. Epub 1999/12/11. PubMed PMID: 10590888.

175
13. Mao JR, Bristow J. The Ehlers-Danlos syndrome: on beyond collagens. J Clin Invest. 2001;107(9):1063-9. Epub 2001/05/09. doi: 10.1172/JCI12881. PubMed PMID: 11342567; PMCID: PMC209288. 14. Coulombe PA, Kerns ML, Fuchs E. Epidermolysis bullosa simplex: a paradigm for disorders of tissue fragility. J Clin Invest. 2009;119(7):1784-93. Epub 2009/07/10. doi: 10.1172/JCI38177. PubMed PMID: 19587453; PMCID: PMC2701872. 15. Guo XD, Johnson JJ, Kramer JM. Embryonic lethality caused by mutations in basement membrane collagen of C. elegans. Nature. 1991;349(6311):707-9. Epub 1991/02/21. doi: 10.1038/349707a0. PubMed PMID: 1996137. 16. Bonnans C, Chou J, Werb Z. Remodelling the extracellular matrix in development and disease. Nat Rev Mol Cell Biol. 2014;15(12):786-801. Epub 2014/11/22. doi: 10.1038/nrm3904. PubMed PMID: 25415508; PMCID: PMC4316204. 17. Bosman FT, Stamenkovic I. Functional structure and composition of the extracellular matrix. J Pathol. 2003;200(4):423-8. Epub 2003/07/08. doi: 10.1002/path.1437. PubMed PMID: 12845610. 18. Hynes RO. The extracellular matrix: not just pretty fibrils. Science. 2009;326(5957):1216-9. Epub 2009/12/08. doi: 10.1126/science.1176009. PubMed PMID: 19965464; PMCID: PMC3536535. 19. Rozario T, DeSimone DW. The extracellular matrix in development and morphogenesis: a dynamic view. Dev Biol. 2010;341(1):126-40. Epub 2009/10/27. doi: 10.1016/j.ydbio.2009.10.026. PubMed PMID: 19854168; PMCID: PMC2854274. 20. Mott JD, Werb Z. Regulation of matrix biology by matrix metalloproteinases. Curr Opin Cell Biol. 2004;16(5):558-64. Epub 2004/09/15. doi: 10.1016/j.ceb.2004.07.010. PubMed PMID: 15363807; PMCID: PMC2775446. 21. Lu P, Takai K, Weaver VM, Werb Z. Extracellular matrix degradation and remodeling in development and disease. Cold Spring Harb Perspect Biol. 2011;3(12). Epub 2011/09/16. doi: 10.1101/cshperspect.a005058. PubMed PMID: 21917992; PMCID: PMC3225943. 22. Page-McCaw A, Ewald AJ, Werb Z. Matrix metalloproteinases and the regulation of tissue remodelling. Nat Rev Mol Cell Biol. 2007;8(3):221-33. Epub 2007/02/24. doi: 10.1038/nrm2125. PubMed PMID: 17318226; PMCID: PMC2760082. 23. Streuli C. Extracellular matrix remodelling and cellular differentiation. Curr Opin Cell Biol. 1999;11(5):634-40. Epub 1999/10/06. PubMed PMID: 10508658. 24. Cawston TE, Young DA. Proteinases involved in matrix turnover during cartilage and bone breakdown. Cell Tissue Res. 2010;339(1):221-35. Epub 2009/11/17. doi: 10.1007/s00441-009-0887-6. PubMed PMID: 19915869. 25. Gaffney J, Solomonov I, Zehorai E, Sagi I. Multilevel regulation of matrix metalloproteinases in tissue homeostasis indicates their molecular specificity in vivo. Matrix Biol. 2015;44-46:191-9. Epub 2015/01/28. doi: 10.1016/j.matbio.2015.01.012. PubMed PMID: 25622911.

176
26. Gao B, Ahmad MF, Nagy LE, Tsukamoto H. Inflammatory pathways in alcoholic steatohepatitis. J Hepatol. 2019;70(2):249-59. Epub 2019/01/20. doi: 10.1016/j.jhep.2018.10.023. PubMed PMID: 30658726; PMCID: PMC6361545. 27. Poole LG, Dolin CE, Arteel GE. Organ-Organ Crosstalk and Alcoholic Liver Disease. Biomolecules. 2017;7(3). Epub 2017/08/17. doi: 10.3390/biom7030062. PubMed PMID: 28812994; PMCID: PMC5618243. 28. Federman S, Miller LM, Sagi I. Following matrix metalloproteinases activity near the cell boundary by infrared micro-spectroscopy. Matrix Biol. 2002;21(7):567-77. Epub 2002/12/12. PubMed PMID: 12475641. 29. Klaas M, Kangur T, Viil J, Maemets-Allas K, Minajeva A, Vadi K, Antsov M, Lapidus N, Jarvekulg M, Jaks V. The alterations in the extracellular matrix composition guide the repair of damaged liver tissue. Sci Rep. 2016;6:27398. Epub 2016/06/07. doi: 10.1038/srep27398. PubMed PMID: 27264108; PMCID: PMC4893701. 30. Cahalon L, Hershkoviz R, Gilat D, Miller A, Akiyama SK, Yamada KM, Lider O. Functional interactions of fibronectin and TNF alpha: a paradigm of physiological linkage between cytokines and extracellular matrix moieties. Cell Adhes Commun. 1994;2(3):269-73. Epub 1994/07/01. PubMed PMID: 7827964. 31. Gailit J, Clark RA. Wound repair in the context of extracellular matrix. Curr Opin Cell Biol. 1994;6(5):717-25. Epub 1994/10/01. PubMed PMID: 7530463. 32. Gilat D, Hershkoviz R, Mekori YA, Vlodavsky I, Lider O. Regulation of adhesion of CD4+ T lymphocytes to intact or heparinase-treated subendothelial extracellular matrix by diffusible or anchored RANTES and MIP-1 beta. J Immunol. 1994;153(11):4899-906. Epub 1994/12/01. PubMed PMID: 7525718. 33. Ley K, Laudanna C, Cybulsky MI, Nourshargh S. Getting to the site of inflammation: the leukocyte adhesion cascade updated. Nat Rev Immunol. 2007;7(9):678-89. Epub 2007/08/25. doi: 10.1038/nri2156. PubMed PMID: 17717539. 34. Wang S, Voisin MB, Larbi KY, Dangerfield J, Scheiermann C, Tran M, Maxwell PH, Sorokin L, Nourshargh S. Venular basement membranes contain specific matrix protein low expression regions that act as exit points for emigrating neutrophils. J Exp Med. 2006;203(6):1519-32. Epub 2006/06/07. doi: 10.1084/jem.20051210. PubMed PMID: 16754715; PMCID: PMC2118318. 35. Woodfin A, Voisin MB, Nourshargh S. Recent developments and complexities in neutrophil transmigration. Curr Opin Hematol. 2010;17(1):9-17. Epub 2009/10/30. doi: 10.1097/MOH.0b013e3283333930. PubMed PMID: 19864945; PMCID: PMC2882030. 36. Bataller R, Brenner DA. Liver fibrosis. J Clin Invest. 2005;115(2):209-18. Epub 2005/02/04. doi: 10.1172/JCI24282. PubMed PMID: 15690074; PMCID: PMC546435. 37. Schuppan D, Ruehl M, Somasundaram R, Hahn EG. Matrix as a modulator of hepatic fibrogenesis. Semin Liver Dis. 2001;21(3):351-72. Epub 2001/10/05. doi: 10.1055/s-2001-17556. PubMed PMID: 11586465. 38. Ebihara T, Venkatesan N, Tanaka R, Ludwig MS. Changes in extracellular matrix and tissue viscoelasticity in bleomycin-induced lung fibrosis. Temporal

177
aspects. Am J Respir Crit Care Med. 2000;162(4 Pt 1):1569-76. Epub 2000/10/13. doi: 10.1164/ajrccm.162.4.9912011. PubMed PMID: 11029378. 39. Meltzer EB, Noble PW. Idiopathic pulmonary fibrosis. Orphanet J Rare Dis. 2008;3:8. Epub 2008/03/28. doi: 10.1186/1750-1172-3-8. PubMed PMID: 18366757; PMCID: PMC2330030. 40. Rocco PR, Negri EM, Kurtz PM, Vasconcellos FP, Silva GH, Capelozzi VL, Romero PV, Zin WA. Lung tissue mechanics and extracellular matrix remodeling in acute lung injury. Am J Respir Crit Care Med. 2001;164(6):1067-71. Epub 2001/10/06. doi: 10.1164/ajrccm.164.6.2007062. PubMed PMID: 11587998. 41. Henriksen PA, Sallenave JM. Human neutrophil elastase: mediator and therapeutic target in atherosclerosis. Int J Biochem Cell Biol. 2008;40(6-7):1095-100. Epub 2008/02/22. doi: 10.1016/j.biocel.2008.01.004. PubMed PMID: 18289916. 42. Kougias P, Chai H, Lin PH, Yao Q, Lumsden AB, Chen C. Defensins and cathelicidins: neutrophil peptides with roles in inflammation, hyperlipidemia and atherosclerosis. J Cell Mol Med. 2005;9(1):3-10. Epub 2005/03/24. PubMed PMID: 15784160. 43. Levental KR, Yu H, Kass L, Lakins JN, Egeblad M, Erler JT, Fong SF, Csiszar K, Giaccia A, Weninger W, Yamauchi M, Gasser DL, Weaver VM. Matrix crosslinking forces tumor progression by enhancing integrin signaling. Cell. 2009;139(5):891-906. Epub 2009/11/26. doi: 10.1016/j.cell.2009.10.027. PubMed PMID: 19931152; PMCID: PMC2788004. 44. Provenzano PP, Inman DR, Eliceiri KW, Knittel JG, Yan L, Rueden CT, White JG, Keely PJ. Collagen density promotes mammary tumor initiation and progression. BMC Med. 2008;6:11. Epub 2008/04/30. doi: 10.1186/1741-7015-6-11. PubMed PMID: 18442412; PMCID: PMC2386807. 45. Friedman SL, Roll FJ, Boyles J, Bissell DM. Hepatic lipocytes: the principal collagen-producing cells of normal rat liver. Proc Natl Acad Sci U S A. 1985;82(24):8681-5. Epub 1985/12/01. PubMed PMID: 3909149; PMCID: PMC391500. 46. Arthur MJ, Iredale JP, Mann DA. Tissue inhibitors of metalloproteinases: role in liver fibrosis and alcoholic liver disease. Alcohol Clin Exp Res. 1999;23(5):940-3. Epub 1999/06/17. PubMed PMID: 10371419. 47. Berk BC, Fujiwara K, Lehoux S. ECM remodeling in hypertensive heart disease. J Clin Invest. 2007;117(3):568-75. Epub 2007/03/03. doi: 10.1172/JCI31044. PubMed PMID: 17332884; PMCID: PMC1804378. 48. Liu F, Mih JD, Shea BS, Kho AT, Sharif AS, Tager AM, Tschumperlin DJ. Feedback amplification of fibrosis through matrix stiffening and COX-2 suppression. J Cell Biol. 2010;190(4):693-706. Epub 2010/08/25. doi: 10.1083/jcb.201004082. PubMed PMID: 20733059; PMCID: PMC2928007. 49. Egeblad M, Rasch MG, Weaver VM. Dynamic interplay between the collagen scaffold and tumor evolution. Curr Opin Cell Biol. 2010;22(5):697-706. Epub 2010/09/09. doi: 10.1016/j.ceb.2010.08.015. PubMed PMID: 20822891; PMCID: PMC2948601.

178
50. Sorokin L. The impact of the extracellular matrix on inflammation. Nat Rev Immunol. 2010;10(10):712-23. Epub 2010/09/25. doi: 10.1038/nri2852. PubMed PMID: 20865019. 51. Benyon RC, Arthur MJ. Extracellular matrix degradation and the role of hepatic stellate cells. Semin Liver Dis. 2001;21(3):373-84. Epub 2001/10/05. doi: 10.1055/s-2001-17552. PubMed PMID: 11586466. 52. Calabro SR, Maczurek AE, Morgan AJ, Tu T, Wen VW, Yee C, Mridha A, Lee M, d'Avigdor W, Locarnini SA, McCaughan GW, Warner FJ, McLennan SV, Shackel NA. Hepatocyte produced matrix metalloproteinases are regulated by CD147 in liver fibrogenesis. PLoS One. 2014;9(7):e90571. Epub 2014/07/31. doi: 10.1371/journal.pone.0090571. PubMed PMID: 25076423; PMCID: PMC4116334. 53. Zang S, Wang L, Ma X, Zhu G, Zhuang Z, Xun Y, Zhao F, Yang W, Liu J, Luo Y, Liu Y, Ye D, Shi J. Neutrophils Play a Crucial Role in the Early Stage of Nonalcoholic Steatohepatitis via Neutrophil Elastase in Mice. Cell Biochem Biophys. 2015;73(2):479-87. Epub 2016/06/29. doi: 10.1007/s12013-015-0682-9. PubMed PMID: 27352342. 54. Ramachandran P, Pellicoro A, Vernon MA, Boulter L, Aucott RL, Ali A, Hartland SN, Snowdon VK, Cappon A, Gordon-Walker TT, Williams MJ, Dunbar DR, Manning JR, van Rooijen N, Fallowfield JA, Forbes SJ, Iredale JP. Differential Ly-6C expression identifies the recruited macrophage phenotype, which orchestrates the regression of murine liver fibrosis. Proc Natl Acad Sci U S A. 2012;109(46):E3186-95. Epub 2012/10/27. doi: 10.1073/pnas.1119964109. PubMed PMID: 23100531; PMCID: PMC3503234. 55. Duarte S, Baber J, Fujii T, Coito AJ. Matrix metalloproteinases in liver injury, repair and fibrosis. Matrix Biol. 2015;44-46:147-56. Epub 2015/01/21. doi: 10.1016/j.matbio.2015.01.004. PubMed PMID: 25599939; PMCID: PMC4495728. 56. Nargis NN, Aldredge RC, Guy RD. The influence of soluble fragments of extracellular matrix (ECM) on tumor growth and morphology. Math Biosci. 2018;296:1-16. Epub 2017/12/07. doi: 10.1016/j.mbs.2017.11.014. PubMed PMID: 29208360. 57. Randles M, Lennon R. Applying Proteomics to Investigate Extracellular Matrix in Health and Disease. Curr Top Membr. 2015;76:171-96. Epub 2015/11/28. doi: 10.1016/bs.ctm.2015.06.001. PubMed PMID: 26610914. 58. Sand JM, Leeming DJ, Byrjalsen I, Bihlet AR, Lange P, Tal-Singer R, Miller BE, Karsdal MA, Vestbo J. High levels of biomarkers of collagen remodeling are associated with increased mortality in COPD - results from the ECLIPSE study. Respir Res. 2016;17(1):125. Epub 2016/10/08. doi: 10.1186/s12931-016-0440-6. PubMed PMID: 27716343; PMCID: PMC5050854. 59. Lipton A, Leitzel K, Ali SM, Polimera HV, Nagabhairu V, Marks E, Richardson AE, Krecko L, Ali A, Koestler W, Esteva FJ, Leeming DJ, Karsdal MA, Willumsen N. High turnover of extracellular matrix reflected by specific protein fragments measured in serum is associated with poor outcomes in two metastatic breast cancer cohorts. Int J Cancer. 2018;143(11):3027-34. Epub 2018/06/21. doi: 10.1002/ijc.31627. PubMed PMID: 29923614.

179
60. Altamirano J, Bataller R. Alcoholic liver disease: pathogenesis and new targets for therapy. Nat Rev Gastroenterol Hepatol. 2011;8(9):491-501. Epub 2011/08/10. doi: 10.1038/nrgastro.2011.134. PubMed PMID: 21826088. 61. Schwartz JM, Reinus JF. Prevalence and natural history of alcoholic liver disease. Clin Liver Dis. 2012;16(4):659-66. Epub 2012/10/30. doi: 10.1016/j.cld.2012.08.001. PubMed PMID: 23101975. 62. Seth D, Haber PS, Syn WK, Diehl AM, Day CP. Pathogenesis of alcohol-induced liver disease: classical concepts and recent advances. J Gastroenterol Hepatol. 2011;26(7):1089-105. Epub 2011/05/07. doi: 10.1111/j.1440-1746.2011.06756.x. PubMed PMID: 21545524. 63. Levitt MD, Levitt DG, Furne J, DeMaster EG. Can the liver account for first-pass metabolism of ethanol in the rat? Am J Physiol. 1994;267(3 Pt 1):G452-7. Epub 1994/09/01. doi: 10.1152/ajpgi.1994.267.3.G452. PubMed PMID: 7943243. 64. Day CP, James OF. Steatohepatitis: a tale of two "hits"? Gastroenterology. 1998;114(4):842-5. Epub 1998/04/18. PubMed PMID: 9547102. 65. Yang SQ, Lin HZ, Lane MD, Clemens M, Diehl AM. Obesity increases sensitivity to endotoxin liver injury: implications for the pathogenesis of steatohepatitis. Proc Natl Acad Sci U S A. 1997;94(6):2557-62. Epub 1997/03/18. PubMed PMID: 9122234; PMCID: PMC20127. 66. Tilg H, Diehl AM. Cytokines in alcoholic and nonalcoholic steatohepatitis. N Engl J Med. 2000;343(20):1467-76. Epub 2000/11/18. doi: 10.1056/NEJM200011163432007. PubMed PMID: 11078773. 67. Nelson S, Kolls JK. Alcohol, host defence and society. Nat Rev Immunol. 2002;2(3):205-9. Epub 2002/03/27. doi: 10.1038/nri744. PubMed PMID: 11913071. 68. Diehl AM. Liver disease in alcohol abusers: clinical perspective. Alcohol. 2002;27(1):7-11. Epub 2002/06/14. PubMed PMID: 12062630. 69. Powell WJ, Jr., Klatskin G. Duration of survival in patients with Laennec's cirrhosis. Influence of alcohol withdrawal, and possible effects of recent changes in general management of the disease. Am J Med. 1968;44(3):406-20. Epub 1968/03/01. PubMed PMID: 5641303. 70. La Vecchia C, Negri E, D'Avanzo B, Boyle P, Franceschi S. Medical history and primary liver cancer. Cancer Res. 1990;50(19):6274-7. Epub 1990/10/01. PubMed PMID: 2400990. 71. Gogel BM, Goldstein RM, Kuhn JA, McCarty TM, Donahoe A, Glastad K. Diagnostic evaluation of hepatocellular carcinoma in a cirrhotic liver. Oncology (Williston Park). 2000;14(6 Suppl 3):15-20. Epub 2000/07/11. PubMed PMID: 10887647. 72. Lucey MR, Mathurin P, Morgan TR. Alcoholic hepatitis. N Engl J Med. 2009;360(26):2758-69. Epub 2009/06/26. doi: 10.1056/NEJMra0805786. PubMed PMID: 19553649. 73. Torok NJ. Update on Alcoholic Hepatitis. Biomolecules. 2015;5(4):2978-86. Epub 2015/11/06. doi: 10.3390/biom5042978. PubMed PMID: 26540078; PMCID: PMC4693265.

180
74. Moreau R, Jalan R, Gines P, Pavesi M, Angeli P, Cordoba J, Durand F, Gustot T, Saliba F, Domenicali M, Gerbes A, Wendon J, Alessandria C, Laleman W, Zeuzem S, Trebicka J, Bernardi M, Arroyo V, Consortium CSIotE-C. Acute-on-chronic liver failure is a distinct syndrome that develops in patients with acute decompensation of cirrhosis. Gastroenterology. 2013;144(7):1426-37, 37 e1-9. Epub 2013/03/12. doi: 10.1053/j.gastro.2013.02.042. PubMed PMID: 23474284. 75. Michelena J, Altamirano J, Abraldes JG, Affo S, Morales-Ibanez O, Sancho-Bru P, Dominguez M, Garcia-Pagan JC, Fernandez J, Arroyo V, Gines P, Louvet A, Mathurin P, Mehal WZ, Caballeria J, Bataller R. Systemic inflammatory response and serum lipopolysaccharide levels predict multiple organ failure and death in alcoholic hepatitis. Hepatology. 2015;62(3):762-72. Epub 2015/03/13. doi: 10.1002/hep.27779. PubMed PMID: 25761863; PMCID: PMC4549175. 76. Chayanupatkul M, Liangpunsakul S. Alcoholic hepatitis: a comprehensive review of pathogenesis and treatment. World J Gastroenterol. 2014;20(20):6279-86. Epub 2014/05/31. doi: 10.3748/wjg.v20.i20.6279. PubMed PMID: 24876748; PMCID: PMC4033465. 77. Cohen JA, Kaplan MM. The SGOT/SGPT ratio--an indicator of alcoholic liver disease. Dig Dis Sci. 1979;24(11):835-8. Epub 1979/11/01. PubMed PMID: 520102. 78. Yeluru A, Cuthbert JA, Casey L, Mitchell MC. Alcoholic Hepatitis: Risk Factors, Pathogenesis, and Approach to Treatment. Alcohol Clin Exp Res. 2016;40(2):246-55. Epub 2016/02/05. doi: 10.1111/acer.12956. PubMed PMID: 26842243. 79. Maddrey WC, Boitnott JK, Bedine MS, Weber FL, Jr., Mezey E, White RI, Jr. Corticosteroid therapy of alcoholic hepatitis. Gastroenterology. 1978;75(2):193-9. Epub 1978/08/01. PubMed PMID: 352788. 80. Srikureja W, Kyulo NL, Runyon BA, Hu KQ. MELD score is a better prognostic model than Child-Turcotte-Pugh score or Discriminant Function score in patients with alcoholic hepatitis. J Hepatol. 2005;42(5):700-6. Epub 2005/04/14. doi: 10.1016/j.jhep.2004.12.022. PubMed PMID: 15826720. 81. Cuthbert JA, Arslanlar S, Yepuri J, Montrose M, Ahn CW, Shah JP. Predicting short-term mortality and long-term survival for hospitalized US patients with alcoholic hepatitis. Dig Dis Sci. 2014;59(7):1594-602. Epub 2014/01/22. doi: 10.1007/s10620-013-3020-3. PubMed PMID: 24445730; PMCID: PMC4071136. 82. Dominguez M, Rincon D, Abraldes JG, Miquel R, Colmenero J, Bellot P, Garcia-Pagan JC, Fernandez R, Moreno M, Banares R, Arroyo V, Caballeria J, Gines P, Bataller R. A new scoring system for prognostic stratification of patients with alcoholic hepatitis. Am J Gastroenterol. 2008;103(11):2747-56. Epub 2008/08/30. doi: 10.1111/j.1572-0241.2008.02104.x. PubMed PMID: 18721242. 83. Forrest EH, Evans CD, Stewart S, Phillips M, Oo YH, McAvoy NC, Fisher NC, Singhal S, Brind A, Haydon G, O'Grady J, Day CP, Hayes PC, Murray LS, Morris AJ. Analysis of factors predictive of mortality in alcoholic hepatitis and derivation and validation of the Glasgow alcoholic hepatitis score. Gut. 2005;54(8):1174-9. Epub 2005/07/13. doi: 10.1136/gut.2004.050781. PubMed PMID: 16009691; PMCID: PMC1774903.

181
84. Dunn W, Jamil LH, Brown LS, Wiesner RH, Kim WR, Menon KV, Malinchoc M, Kamath PS, Shah V. MELD accurately predicts mortality in patients with alcoholic hepatitis. Hepatology. 2005;41(2):353-8. Epub 2005/01/22. doi: 10.1002/hep.20503. PubMed PMID: 15660383. 85. Koning SH, Gansevoort RT, Mukamal KJ, Rimm EB, Bakker SJ, Joosten MM, Group PS. Alcohol consumption is inversely associated with the risk of developing chronic kidney disease. Kidney Int. 2015;87(5):1009-16. Epub 2015/01/15. doi: 10.1038/ki.2014.414. PubMed PMID: 25587707. 86. Harris PS, Roy SR, Coughlan C, Orlicky DJ, Liang Y, Shearn CT, Roede JR, Fritz KS. Chronic ethanol consumption induces mitochondrial protein acetylation and oxidative stress in the kidney. Redox Biol. 2015;6:33-40. Epub 2015/07/16. doi: 10.1016/j.redox.2015.06.021. PubMed PMID: 26177469; PMCID: PMC4511634. 87. Latchoumycandane C, Nagy LE, McIntyre TM. Chronic ethanol ingestion induces oxidative kidney injury through taurine-inhibitable inflammation. Free Radic Biol Med. 2014;69:403-16. Epub 2014/01/15. doi: 10.1016/j.freeradbiomed.2014.01.001. PubMed PMID: 24412858; PMCID: PMC3960325. 88. Latchoumycandane C, Nagy LE, McIntyre TM. Myeloperoxidase formation of PAF receptor ligands induces PAF receptor-dependent kidney injury during ethanol consumption. Free Radic Biol Med. 2015;86:179-90. Epub 2015/05/25. doi: 10.1016/j.freeradbiomed.2015.05.020. PubMed PMID: 26003521; PMCID: PMC4554800. 89. Beier JI, Luyendyk JP, Guo L, von Montfort C, Staunton DE, Arteel GE. Fibrin accumulation plays a critical role in the sensitization to lipopolysaccharide-induced liver injury caused by ethanol in mice. Hepatology. 2009;49(5):1545-53. Epub 2009/03/18. doi: 10.1002/hep.22847. PubMed PMID: 19291788; PMCID: PMC2852109. 90. Gillis SE, Nagy LE. Deposition of cellular fibronectin increases before stellate cell activation in rat liver during ethanol feeding. Alcohol Clin Exp Res. 1997;21(5):857-61. Epub 1997/08/01. PubMed PMID: 9267535. 91. Thiele GM, Duryee MJ, Freeman TL, Sorrell MF, Willis MS, Tuma DJ, Klassen LW. Rat sinusoidal liver endothelial cells (SECs) produce pro-fibrotic factors in response to adducts formed from the metabolites of ethanol. Biochem Pharmacol. 2005;70(11):1593-600. Epub 2005/10/06. doi: 10.1016/j.bcp.2005.08.014. PubMed PMID: 16202982. 92. Naba A, Clauser KR, Ding H, Whittaker CA, Carr SA, Hynes RO. The extracellular matrix: Tools and insights for the "omics" era. Matrix Biol. 2016;49:10-24. Epub 2015/07/15. doi: 10.1016/j.matbio.2015.06.003. PubMed PMID: 26163349; PMCID: PMC5013529. 93. Massey VL, Dolin CE, Poole LG, Hudson SV, Siow DL, Brock GN, Merchant ML, Wilkey DW, Arteel GE. The hepatic "matrisome" responds dynamically to injury: Characterization of transitional changes to the extracellular matrix in mice. Hepatology. 2017;65(3):969-82. Epub 2016/12/31. doi: 10.1002/hep.28918. PubMed PMID: 28035785; PMCID: PMC5319876.

182
94. Daley WP, Peters SB, Larsen M. Extracellular matrix dynamics in development and regenerative medicine. J Cell Sci. 2008;121(Pt 3):255-64. Epub 2008/01/25. doi: 10.1242/jcs.006064. PubMed PMID: 18216330. 95. White SL, Polkinghorne KR, Cass A, Shaw JE, Atkins RC, Chadban SJ. Alcohol consumption and 5-year onset of chronic kidney disease: the AusDiab study. Nephrol Dial Transplant. 2009;24(8):2464-72. Epub 2009/03/25. doi: 10.1093/ndt/gfp114. PubMed PMID: 19307230. 96. von Montfort C, Beier JI, Kaiser JP, Guo L, Joshi-Barve S, Pritchard MT, States JC, Arteel GE. PAI-1 plays a protective role in CCl4-induced hepatic fibrosis in mice: role of hepatocyte division. Am J Physiol Gastrointest Liver Physiol. 2010;298(5):G657-66. Epub 2010/03/06. doi: 10.1152/ajpgi.00107.2009. PubMed PMID: 20203062; PMCID: PMC2867423. 97. Massey VL, Poole LG, Siow DL, Torres E, Warner NL, Schmidt RH, Ritzenthaler JD, Roman J, Arteel GE. Chronic Alcohol Exposure Enhances Lipopolysaccharide-Induced Lung Injury in Mice: Potential Role of Systemic Tumor Necrosis Factor-Alpha. Alcohol Clin Exp Res. 2015;39(10):1978-88. Epub 2015/09/19. doi: 10.1111/acer.12855. PubMed PMID: 26380957; PMCID: PMC4804458. 98. Bertola A, Mathews S, Ki SH, Wang H, Gao B. Mouse model of chronic and binge ethanol feeding (the NIAAA model). Nat Protoc. 2013;8(3):627-37. Epub 2013/03/02. doi: 10.1038/nprot.2013.032. PubMed PMID: 23449255; PMCID: PMC3788579. 99. de Castro Bras LE, Ramirez TA, DeLeon-Pennell KY, Chiao YA, Ma Y, Dai Q, Halade GV, Hakala K, Weintraub ST, Lindsey ML. Texas 3-step decellularization protocol: looking at the cardiac extracellular matrix. J Proteomics. 2013;86:43-52. Epub 2013/05/18. doi: 10.1016/j.jprot.2013.05.004. PubMed PMID: 23681174; PMCID: PMC3879953. 100. Wisniewski JR, Zougman A, Mann M. Combination of FASP and StageTip-based fractionation allows in-depth analysis of the hippocampal membrane proteome. J Proteome Res. 2009;8(12):5674-8. Epub 2009/10/24. doi: 10.1021/pr900748n. PubMed PMID: 19848406. 101. Rood IM, Merchant ML, Wilkey DW, Zhang T, Zabrouskov V, van der Vlag J, Dijkman HB, Willemsen BK, Wetzels JF, Klein JB, Deegens JK. Increased expression of lysosome membrane protein 2 in glomeruli of patients with idiopathic membranous nephropathy. Proteomics. 2015;15(21):3722-30. Epub 2015/08/26. doi: 10.1002/pmic.201500127. PubMed PMID: 26304790. 102. Keshishian H, Burgess MW, Gillette MA, Mertins P, Clauser KR, Mani DR, Kuhn EW, Farrell LA, Gerszten RE, Carr SA. Multiplexed, Quantitative Workflow for Sensitive Biomarker Discovery in Plasma Yields Novel Candidates for Early Myocardial Injury. Mol Cell Proteomics. 2015;14(9):2375-93. Epub 2015/03/01. doi: 10.1074/mcp.M114.046813. PubMed PMID: 25724909; PMCID: PMC4563722. 103. Barati MT, Powell DW, Kechavarzi BD, Isaacs SM, Zheng S, Epstein PN, Cai L, Coventry S, Rane MJ, Klein JB. Differential expression of endoplasmic reticulum stress-response proteins in different renal tubule subtypes of OVE26 diabetic mice. Cell Stress Chaperones. 2016;21(1):155-66. Epub 2015/10/21.

183
doi: 10.1007/s12192-015-0648-2. PubMed PMID: 26483256; PMCID: PMC4679738. 104. Crabb DW, Bataller R, Chalasani NP, Kamath PS, Lucey M, Mathurin P, McClain C, McCullough A, Mitchell MC, Morgan TR, Nagy L, Radaeva S, Sanyal A, Shah V, Szabo G, Consortia NAH. Standard Definitions and Common Data Elements for Clinical Trials in Patients With Alcoholic Hepatitis: Recommendation From the NIAAA Alcoholic Hepatitis Consortia. Gastroenterology. 2016;150(4):785-90. Epub 2016/02/28. doi: 10.1053/j.gastro.2016.02.042. PubMed PMID: 26921783; PMCID: PMC5287362. 105. Saunders JB, Aasland OG, Babor TF, de la Fuente JR, Grant M. Development of the Alcohol Use Disorders Identification Test (AUDIT): WHO Collaborative Project on Early Detection of Persons with Harmful Alcohol Consumption--II. Addiction. 1993;88(6):791-804. Epub 1993/06/01. PubMed PMID: 8329970. 106. Skinner HA, Sheu WJ. Reliability of alcohol use indices. The Lifetime Drinking History and the MAST. J Stud Alcohol. 1982;43(11):1157-70. Epub 1982/11/01. PubMed PMID: 7182675. 107. Parker BL, Burchfield JG, Clayton D, Geddes TA, Payne RJ, Kiens B, Wojtaszewski JFP, Richter EA, James DE. Multiplexed Temporal Quantification of the Exercise-regulated Plasma Peptidome. Mol Cell Proteomics. 2017;16(12):2055-68. Epub 2017/10/07. doi: 10.1074/mcp.RA117.000020. PubMed PMID: 28982716; PMCID: PMC5724171. 108. Bolstad BM, Irizarry RA, Astrand M, Speed TP. A comparison of normalization methods for high density oligonucleotide array data based on variance and bias. Bioinformatics. 2003;19(2):185-93. Epub 2003/01/23. PubMed PMID: 12538238. 109. Stacklies W, Redestig H, Scholz M, Walther D, Selbig J. pcaMethods--a bioconductor package providing PCA methods for incomplete data. Bioinformatics. 2007;23(9):1164-7. Epub 2007/03/09. doi: 10.1093/bioinformatics/btm069. PubMed PMID: 17344241. 110. Key M. A tutorial in displaying mass spectrometry-based proteomic data using heat maps. BMC Bioinformatics. 2012;13 Suppl 16:S10. Epub 2012/11/28. doi: 10.1186/1471-2105-13-S16-S10. PubMed PMID: 23176119; PMCID: PMC3489527. 111. Gressner OA, Weiskirchen R, Gressner AM. Evolving concepts of liver fibrogenesis provide new diagnostic and therapeutic options. Comp Hepatol. 2007;6:7. Epub 2007/08/01. doi: 10.1186/1476-5926-6-7. PubMed PMID: 17663771; PMCID: PMC1994681. 112. Bergheim I, Guo L, Davis MA, Lambert JC, Beier JI, Duveau I, Luyendyk JP, Roth RA, Arteel GE. Metformin prevents alcohol-induced liver injury in the mouse: Critical role of plasminogen activator inhibitor-1. Gastroenterology. 2006;130(7):2099-112. Epub 2006/06/10. doi: 10.1053/j.gastro.2006.03.020. PubMed PMID: 16762632; PMCID: PMC2648856. 113. Naba A, Clauser KR, Hynes RO. Enrichment of Extracellular Matrix Proteins from Tissues and Digestion into Peptides for Mass Spectrometry

184
Analysis. J Vis Exp. 2015(101):e53057. Epub 2015/08/15. doi: 10.3791/53057. PubMed PMID: 26273955; PMCID: PMC4545199. 114. Didangelos A, Yin X, Mandal K, Baumert M, Jahangiri M, Mayr M. Proteomics characterization of extracellular space components in the human aorta. Mol Cell Proteomics. 2010;9(9):2048-62. Epub 2010/06/17. doi: 10.1074/mcp.M110.001693. PubMed PMID: 20551380; PMCID: PMC2938114. 115. Mason RM, Mayes RW. Extraction of cartilage protein-polysaccharides with inorganic salt solutions. Biochem J. 1973;131(3):535-40. Epub 1973/03/01. PubMed PMID: 4269048; PMCID: PMC1177500. 116. Sajdera SW, Hascall VC. Proteinpolysaccharide complex from bovine nasal cartilage. A comparison of low and high shear extraction procedures. J Biol Chem. 1969;244(1):77-87. Epub 1969/01/10. PubMed PMID: 4237578. 117. Enomoto N, Ikejima K, Bradford B, Rivera C, Kono H, Brenner DA, Thurman RG. Alcohol causes both tolerance and sensitization of rat Kupffer cells via mechanisms dependent on endotoxin. Gastroenterology. 1998;115(2):443-51. Epub 1998/07/25. PubMed PMID: 9679050. 118. Eyre DR, Paz MA, Gallop PM. Cross-linking in collagen and elastin. Annu Rev Biochem. 1984;53:717-48. Epub 1984/01/01. doi: 10.1146/annurev.bi.53.070184.003441. PubMed PMID: 6148038. 119. Kobayashi J, Yamada S, Kawasaki H. Distribution of vitronectin in plasma and liver tissue: relationship to chronic liver disease. Hepatology. 1994;20(6):1412-7. Epub 1994/12/01. PubMed PMID: 7527001. 120. Koukoulis GK, Shen J, Virtanen I, Gould VE. Vitronectin in the cirrhotic liver: an immunomarker of mature fibrosis. Hum Pathol. 2001;32(12):1356-62. Epub 2002/01/05. doi: 10.1053/hupa.2001.29675. PubMed PMID: 11774169. 121. Didangelos A, Yin X, Mandal K, Saje A, Smith A, Xu Q, Jahangiri M, Mayr M. Extracellular matrix composition and remodeling in human abdominal aortic aneurysms: a proteomics approach. Mol Cell Proteomics. 2011;10(8):M111 008128. Epub 2011/05/20. doi: 10.1074/mcp.M111.008128. PubMed PMID: 21593211; PMCID: PMC3149094. 122. Holdsworth SR, Thomson NM, Glasgow EF, Atkins RC. The effect of defibrination on macrophage participation in rabbit nephrotoxic nephritis: studies using glomerular culture and electronmicroscopy. Clin Exp Immunol. 1979;37(1):38-43. Epub 1979/07/01. PubMed PMID: 487657; PMCID: PMC1537661. 123. Loike JD, el Khoury J, Cao L, Richards CP, Rascoff H, Mandeville JT, Maxfield FR, Silverstein SC. Fibrin regulates neutrophil migration in response to interleukin 8, leukotriene B4, tumor necrosis factor, and formyl-methionyl-leucyl-phenylalanine. J Exp Med. 1995;181(5):1763-72. Epub 1995/05/01. PubMed PMID: 7722453; PMCID: PMC2191980. 124. Lonai P. Epithelial mesenchymal interactions, the ECM and limb development. J Anat. 2003;202(1):43-50. Epub 2003/02/18. PubMed PMID: 12587919; PMCID: PMC1571048. 125. Hynes RO. Integrins: versatility, modulation, and signaling in cell adhesion. Cell. 1992;69(1):11-25. Epub 1992/04/03. PubMed PMID: 1555235.

185
126. Nastase MV, Young MF, Schaefer L. Biglycan: a multivalent proteoglycan providing structure and signals. J Histochem Cytochem. 2012;60(12):963-75. Epub 2012/07/24. doi: 10.1369/0022155412456380. PubMed PMID: 22821552; PMCID: PMC3527886. 127. Bode C, Kugler V, Bode JC. Endotoxemia in patients with alcoholic and non-alcoholic cirrhosis and in subjects with no evidence of chronic liver disease following acute alcohol excess. J Hepatol. 1987;4(1):8-14. Epub 1987/02/01. PubMed PMID: 3571935. 128. Mosesson MW. Fibrinogen gamma chain functions. J Thromb Haemost. 2003;1(2):231-8. Epub 2003/07/23. PubMed PMID: 12871494. 129. Migita K, Abiru S, Nakamura M, Komori A, Yoshida Y, Yokoyama T, Daikoku M, Ueki T, Takii Y, Yano K, Yastuhashi H, Eguchi K, Ishibashi H. Lipopolysaccharide signaling induces serum amyloid A (SAA) synthesis in human hepatocytes in vitro. FEBS Lett. 2004;569(1-3):235-9. Epub 2004/07/01. doi: 10.1016/j.febslet.2004.05.072. PubMed PMID: 15225640. 130. Pruett BS, Pruett SB. An explanation for the paradoxical induction and suppression of an acute phase response by ethanol. Alcohol. 2006;39(2):105-10. Epub 2006/12/01. doi: 10.1016/j.alcohol.2006.08.003. PubMed PMID: 17134663; PMCID: PMC1764540. 131. Bopst M, Haas C, Car B, Eugster HP. The combined inactivation of tumor necrosis factor and interleukin-6 prevents induction of the major acute phase proteins by endotoxin. Eur J Immunol. 1998;28(12):4130-7. Epub 1998/12/23. doi: 10.1002/(SICI)1521-4141(199812)28:12<4130::AID-IMMU4130>3.0.CO;2-W. PubMed PMID: 9862349. 132. Haziot A, Lin XY, Zhang F, Goyert SM. The induction of acute phase proteins by lipopolysaccharide uses a novel pathway that is CD14-independent. J Immunol. 1998;160(6):2570-2. Epub 1998/03/24. PubMed PMID: 9510153. 133. Sun S, Guo Y, Zhao G, Zhou X, Li J, Hu J, Yu H, Chen Y, Song H, Qiao F, Xu G, Yang F, Wu Y, Tomlinson S, Duan Z, Zhou Y. Complement and the alternative pathway play an important role in LPS/D-GalN-induced fulminant hepatic failure. PLoS One. 2011;6(11):e26838. Epub 2011/11/10. doi: 10.1371/journal.pone.0026838. PubMed PMID: 22069473; PMCID: PMC3206060. 134. Bacigalupo ML, Manzi M, Rabinovich GA, Troncoso MF. Hierarchical and selective roles of galectins in hepatocarcinogenesis, liver fibrosis and inflammation of hepatocellular carcinoma. World J Gastroenterol. 2013;19(47):8831-49. Epub 2014/01/01. doi: 10.3748/wjg.v19.i47.8831. PubMed PMID: 24379606; PMCID: PMC3870534. 135. Aziz-Seible RS, Lee SM, Kharbanda KK, McVicker BL, Casey CA. Ethanol feeding potentiates the pro-inflammatory response of Kupffer cells to cellular fibronectin. Alcohol Clin Exp Res. 2011;35(4):717-25. Epub 2011/01/13. doi: 10.1111/j.1530-0277.2010.01389.x. PubMed PMID: 21223308. 136. Schonherr E, Witsch-Prehm P, Harrach B, Robenek H, Rauterberg J, Kresse H. Interaction of biglycan with type I collagen. J Biol Chem. 1995;270(6):2776-83. Epub 1995/02/10. PubMed PMID: 7852349.

186
137. Mohan H, Krumbholz M, Sharma R, Eisele S, Junker A, Sixt M, Newcombe J, Wekerle H, Hohlfeld R, Lassmann H, Meinl E. Extracellular matrix in multiple sclerosis lesions: Fibrillar collagens, biglycan and decorin are upregulated and associated with infiltrating immune cells. Brain Pathol. 2010;20(5):966-75. Epub 2010/05/12. doi: 10.1111/j.1750-3639.2010.00399.x. PubMed PMID: 20456365. 138. Tufvesson E, Westergren-Thorsson G. Tumour necrosis factor-alpha interacts with biglycan and decorin. FEBS Lett. 2002;530(1-3):124-8. Epub 2002/10/22. PubMed PMID: 12387878. 139. Hengst U, Albrecht H, Hess D, Monard D. The phosphatidylethanolamine-binding protein is the prototype of a novel family of serine protease inhibitors. J Biol Chem. 2001;276(1):535-40. Epub 2000/10/18. doi: 10.1074/jbc.M002524200. PubMed PMID: 11034991. 140. Xu YF, Yi Y, Qiu SJ, Gao Q, Li YW, Dai CX, Cai MY, Ju MJ, Zhou J, Zhang BH, Fan J. PEBP1 downregulation is associated to poor prognosis in HCC related to hepatitis B infection. J Hepatol. 2010;53(5):872-9. Epub 2010/08/27. doi: 10.1016/j.jhep.2010.05.019. PubMed PMID: 20739083. 141. Keller ET, Fu Z, Brennan M. The biology of a prostate cancer metastasis suppressor protein: Raf kinase inhibitor protein. J Cell Biochem. 2005;94(2):273-8. Epub 2004/11/27. doi: 10.1002/jcb.20169. PubMed PMID: 15565643. 142. Wells RG. The role of matrix stiffness in regulating cell behavior. Hepatology. 2008;47(4):1394-400. Epub 2008/03/01. doi: 10.1002/hep.22193. PubMed PMID: 18307210. 143. Ford AJ, Jain G, Rajagopalan P. Designing a fibrotic microenvironment to investigate changes in human liver sinusoidal endothelial cell function. Acta Biomater. 2015;24:220-7. Epub 2015/06/29. doi: 10.1016/j.actbio.2015.06.028. PubMed PMID: 26117313. 144. Yang C, Zeisberg M, Lively JC, Nyberg P, Afdhal N, Kalluri R. Integrin alpha1beta1 and alpha2beta1 are the key regulators of hepatocarcinoma cell invasion across the fibrotic matrix microenvironment. Cancer Res. 2003;63(23):8312-7. Epub 2003/12/18. PubMed PMID: 14678990. 145. Seitz HK, Bataller R, Cortez-Pinto H, Gao B, Gual A, Lackner C, Mathurin P, Mueller S, Szabo G, Tsukamoto H. Alcoholic liver disease. Nat Rev Dis Primers. 2018;4(1):16. doi: 10.1038/s41572-018-0014-7. PubMed PMID: 30115921. 146. Savolainen VT, Liesto K, Mannikko A, Penttila A, Karhunen PJ. Alcohol consumption and alcoholic liver disease: evidence of a threshold level of effects of ethanol. Alcohol Clin Exp Res. 1993;17(5):1112-7. PubMed PMID: 8279675. 147. Louvet A, Labreuche J, Artru F, Boursier J, Kim DJ, O'Grady J, Trepo E, Nahon P, Ganne-Carrie N, Naveau S, Diaz E, Gustot T, Lassailly G, Cannesson-Leroy A, Canva-Delcambre V, Dharancy S, Park SH, Moreno C, Morgan TR, Duhamel A, Mathurin P. Combining Data From Liver Disease Scoring Systems Better Predicts Outcomes of Patients With Alcoholic Hepatitis. Gastroenterology. 2015;149(2):398-406 e8; quiz e16-7. doi: 10.1053/j.gastro.2015.04.044. PubMed PMID: 25935634.

187
148. Moss M, Burnham EL. Chronic alcohol abuse, acute respiratory distress syndrome, and multiple organ dysfunction. Crit Care Med. 2003;31(4 Suppl):S207-12. Epub 2003/04/12. doi: 10.1097/01.CCM.0000057845.77458.25. PubMed PMID: 12682442. 149. de Jong WJ, Cleveringa AM, Greijdanus B, Meyer P, Heineman E, Hulscher JB. The effect of acute alcohol intoxication on gut wall integrity in healthy male volunteers; a randomized controlled trial. Alcohol. 2015;49(1):65-70. Epub 2015/01/07. doi: 10.1016/j.alcohol.2014.09.033. PubMed PMID: 25559494. 150. Mueller S, Seitz HK, Rausch V. Non-invasive diagnosis of alcoholic liver disease. World J Gastroenterol. 2014;20(40):14626-41. Epub 2014/10/31. doi: 10.3748/wjg.v20.i40.14626. PubMed PMID: 25356026; PMCID: PMC4209529. 151. Lebedev SP. [Morphology and pathogenesis of visceral manifestations of chronic alcoholism]. Arkh Patol. 1982;44(5):80-6. Epub 1982/01/01. PubMed PMID: 7115139. 152. Nguyen TA, DeShazo JP, Thacker LR, Puri P, Sanyal AJ. The Worsening Profile of Alcoholic Hepatitis in the United States. Alcohol Clin Exp Res. 2016;40(6):1295-303. Epub 2016/05/06. doi: 10.1111/acer.13069. PubMed PMID: 27147285; PMCID: PMC4918810. 153. McKim SE, Uesugi T, Raleigh JA, McClain CJ, Arteel GE. Chronic intragastric alcohol exposure causes hypoxia and oxidative stress in the rat pancreas. Arch Biochem Biophys. 2003;417(1):34-43. Epub 2003/08/19. PubMed PMID: 12921777. 154. Kronenberg F. Emerging risk factors and markers of chronic kidney disease progression. Nat Rev Nephrol. 2009;5(12):677-89. Epub 2009/11/26. doi: 10.1038/nrneph.2009.173. PubMed PMID: 19935815. 155. Varga ZV, Matyas C, Paloczi J, Pacher P. Alcohol Misuse and Kidney Injury: Epidemiological Evidence and Potential Mechanisms. Alcohol Res. 2017;38(2):283-8. Epub 2017/10/11. PubMed PMID: 28988579; PMCID: PMC5513691. 156. Menon V, Katz R, Mukamal K, Kestenbaum B, de Boer IH, Siscovick DS, Sarnak MJ, Shlipak MG. Alcohol consumption and kidney function decline in the elderly: alcohol and kidney disease. Nephrol Dial Transplant. 2010;25(10):3301-7. Epub 2010/04/20. doi: 10.1093/ndt/gfq188. PubMed PMID: 20400446; PMCID: PMC2948837. 157. Knight EL, Stampfer MJ, Rimm EB, Hankinson SE, Curhan GC. Moderate alcohol intake and renal function decline in women: a prospective study. Nephrol Dial Transplant. 2003;18(8):1549-54. Epub 2003/08/05. PubMed PMID: 12897093. 158. Bundy JD, Bazzano LA, Xie D, Cohan J, Dolata J, Fink JC, Hsu CY, Jamerson K, Lash J, Makos G, Steigerwalt S, Wang X, Mills KT, Chen J, He J, Investigators CS. Self-Reported Tobacco, Alcohol, and Illicit Drug Use and Progression of Chronic Kidney Disease. Clin J Am Soc Nephrol. 2018;13(7):993-1001. Epub 2018/06/09. doi: 10.2215/CJN.11121017. PubMed PMID: 29880471; PMCID: PMC6032576.

188
159. Zelle DM, Agarwal PK, Ramirez JL, van der Heide JJ, Corpeleijn E, Gans RO, Navis G, Bakker SJ. Alcohol consumption, new onset of diabetes after transplantation, and all-cause mortality in renal transplant recipients. Transplantation. 2011;92(2):203-9. Epub 2011/06/21. doi: 10.1097/TP.0b013e318222ca10. PubMed PMID: 21685828. 160. Villafuerte BC, Barati MT, Rane MJ, Isaacs S, Li M, Wilkey DW, Merchant ML. Over-expression of insulin-response element binding protein-1 (IRE-BP1) in mouse pancreatic islets increases expression of RACK1 and TCTP: Beta cell markers of high glucose sensitivity. Biochim Biophys Acta Proteins Proteom. 2017;1865(2):186-94. Epub 2016/11/07. doi: 10.1016/j.bbapap.2016.10.015. PubMed PMID: 27816562; PMCID: PMC5233416. 161. Barati MT, Gould JC, Salyer SA, Isaacs S, Wilkey DW, Merchant ML. Influence of Acute High Glucose on Protein Abundance Changes in Murine Glomerular Mesangial Cells. J Diabetes Res. 2016;2016:3537863. Epub 2016/02/04. doi: 10.1155/2016/3537863. PubMed PMID: 26839892; PMCID: PMC4709621. 162. Barrett T, Wilhite SE, Ledoux P, Evangelista C, Kim IF, Tomashevsky M, Marshall KA, Phillippy KH, Sherman PM, Holko M, Yefanov A, Lee H, Zhang N, Robertson CL, Serova N, Davis S, Soboleva A. NCBI GEO: archive for functional genomics data sets--update. Nucleic Acids Res. 2013;41(Database issue):D991-5. Epub 2012/11/30. doi: 10.1093/nar/gks1193. PubMed PMID: 23193258; PMCID: PMC3531084. 163. Mundel P, Reiser J. Proteinuria: an enzymatic disease of the podocyte? Kidney Int. 2010;77(7):571-80. Epub 2009/11/20. doi: 10.1038/ki.2009.424. PubMed PMID: 19924101; PMCID: PMC4109304. 164. Reiser J, von Gersdorff G, Loos M, Oh J, Asanuma K, Giardino L, Rastaldi MP, Calvaresi N, Watanabe H, Schwarz K, Faul C, Kretzler M, Davidson A, Sugimoto H, Kalluri R, Sharpe AH, Kreidberg JA, Mundel P. Induction of B7-1 in podocytes is associated with nephrotic syndrome. J Clin Invest. 2004;113(10):1390-7. Epub 2004/05/18. doi: 10.1172/JCI20402. PubMed PMID: 15146236; PMCID: PMC406528. 165. Lu XM, Ma L, Jin YN, Yu YQ. Lumican overexpression exacerbates lipopolysaccharide-induced renal injury in mice. Mol Med Rep. 2015;12(3):4089-94. Epub 2015/06/18. doi: 10.3892/mmr.2015.3940. PubMed PMID: 26081832; PMCID: PMC4526055. 166. Savitski MM, Mathieson T, Zinn N, Sweetman G, Doce C, Becher I, Pachl F, Kuster B, Bantscheff M. Measuring and managing ratio compression for accurate iTRAQ/TMT quantification. J Proteome Res. 2013;12(8):3586-98. Epub 2013/06/19. doi: 10.1021/pr400098r. PubMed PMID: 23768245. 167. Badawy AA, Bano S, Steptoe A. Tryptophan in alcoholism treatment I: kynurenine metabolites inhibit the rat liver mitochondrial low Km aldehyde dehydrogenase activity, elevate blood acetaldehyde concentration and induce aversion to alcohol. Alcohol Alcohol. 2011;46(6):651-60. Epub 2011/09/08. doi: 10.1093/alcalc/agr134. PubMed PMID: 21896552; PMCID: PMC3196366. 168. Rajapakse NW, Konstantinidis G, Evans RG, Nguyen-Huu TP, Kaye DM, Head GA. Endothelial cationic amino acid transporter-1 overexpression blunts

189
the effects of oxidative stress on pressor responses to behavioural stress in mice. Clin Exp Pharmacol Physiol. 2014;41(12):1031-7. Epub 2014/08/15. doi: 10.1111/1440-1681.12279. PubMed PMID: 25115333. 169. Komers R, Xu B, Fu Y, McClelland A, Kantharidis P, Mittal A, Cohen HT, Cohen DM. Transcriptome-based analysis of kidney gene expression changes associated with diabetes in OVE26 mice, in the presence and absence of losartan treatment. PLoS One. 2014;9(5):e96987. Epub 2014/05/16. doi: 10.1371/journal.pone.0096987. PubMed PMID: 24827579; PMCID: PMC4020814. 170. Poole LG, Massey VL, Siow DL, Torres-Gonzales E, Warner NL, Luyendyk JP, Ritzenthaler JD, Roman J, Arteel GE. Plasminogen Activator Inhibitor-1 Is Critical in Alcohol-Enhanced Acute Lung Injury in Mice. Am J Respir Cell Mol Biol. 2017;57(3):315-23. Epub 2017/04/27. doi: 10.1165/rcmb.2016-0184OC. PubMed PMID: 28445073; PMCID: PMC5625219. 171. O'Neill LA, Golenbock D, Bowie AG. The history of Toll-like receptors - redefining innate immunity. Nat Rev Immunol. 2013;13(6):453-60. Epub 2013/05/18. doi: 10.1038/nri3446. PubMed PMID: 23681101. 172. Gobejishvili L, Barve S, Joshi-Barve S, Uriarte S, Song Z, McClain C. Chronic ethanol-mediated decrease in cAMP primes macrophages to enhanced LPS-inducible NF-kappaB activity and TNF expression: relevance to alcoholic liver disease. Am J Physiol Gastrointest Liver Physiol. 2006;291(4):G681-8. Epub 2006/06/06. doi: 10.1152/ajpgi.00098.2006. PubMed PMID: 16751174. 173. Raksaseri P, Chatsudthipong V, Muanprasat C, Soodvilai S. Activation of liver X receptors reduces CFTR-mediated Cl(-) transport in kidney collecting duct cells. Am J Physiol Renal Physiol. 2013;305(4):F583-91. Epub 2013/05/31. doi: 10.1152/ajprenal.00579.2012. PubMed PMID: 23720350. 174. Gong P, Cederbaum AI. Nrf2 is increased by CYP2E1 in rodent liver and HepG2 cells and protects against oxidative stress caused by CYP2E1. Hepatology. 2006;43(1):144-53. Epub 2005/12/24. doi: 10.1002/hep.21004. PubMed PMID: 16374848. 175. Aminzadeh MA, Nicholas SB, Norris KC, Vaziri ND. Role of impaired Nrf2 activation in the pathogenesis of oxidative stress and inflammation in chronic tubulo-interstitial nephropathy. Nephrol Dial Transplant. 2013;28(8):2038-45. Epub 2013/03/21. doi: 10.1093/ndt/gft022. PubMed PMID: 23512109; PMCID: PMC3765021. 176. Jiang T, Tian F, Zheng H, Whitman SA, Lin Y, Zhang Z, Zhang N, Zhang DD. Nrf2 suppresses lupus nephritis through inhibition of oxidative injury and the NF-kappaB-mediated inflammatory response. Kidney Int. 2014;85(2):333-43. Epub 2013/09/13. doi: 10.1038/ki.2013.343. PubMed PMID: 24025640; PMCID: PMC3992978. 177. Liu M, Reddy NM, Higbee EM, Potteti HR, Noel S, Racusen L, Kensler TW, Sporn MB, Reddy SP, Rabb H. The Nrf2 triterpenoid activator, CDDO-imidazolide, protects kidneys from ischemia-reperfusion injury in mice. Kidney Int. 2014;85(1):134-41. Epub 2013/10/04. doi: 10.1038/ki.2013.357. PubMed PMID: 24088953; PMCID: PMC5282962.

190
178. Potteti HR, Tamatam CR, Marreddy R, Reddy NM, Noel S, Rabb H, Reddy SP. Nrf2-AKT interactions regulate heme oxygenase 1 expression in kidney epithelia during hypoxia and hypoxia-reoxygenation. Am J Physiol Renal Physiol. 2016;311(5):F1025-F34. Epub 2016/09/02. doi: 10.1152/ajprenal.00362.2016. PubMed PMID: 27582105; PMCID: PMC5130454. 179. Jimenez-Osorio AS, Garcia-Nino WR, Gonzalez-Reyes S, Alvarez-Mejia AE, Guerra-Leon S, Salazar-Segovia J, Falcon I, Montes de Oca-Solano H, Madero M, Pedraza-Chaverri J. The Effect of Dietary Supplementation With Curcumin on Redox Status and Nrf2 Activation in Patients With Nondiabetic or Diabetic Proteinuric Chronic Kidney Disease: A Pilot Study. J Ren Nutr. 2016;26(4):237-44. Epub 2016/02/27. doi: 10.1053/j.jrn.2016.01.013. PubMed PMID: 26915483. 180. Atilano-Roque A, Wen X, Aleksunes LM, Joy MS. Nrf2 activators as potential modulators of injury in human kidney cells. Toxicol Rep. 2016;3:153-9. Epub 2016/01/12. doi: 10.1016/j.toxrep.2016.01.006. PubMed PMID: 28959534; PMCID: PMC5615789. 181. Hall ET, Bhalla V. Is there a sweet spot for Nrf2 activation in the treatment of diabetic kidney disease? Diabetes. 2014;63(9):2904-5. Epub 2014/08/26. doi: 10.2337/db14-0829. PubMed PMID: 25146471; PMCID: PMC4141365. 182. Jaiswal AK. Regulation of genes encoding NAD(P)H:quinone oxidoreductases. Free Radic Biol Med. 2000;29(3-4):254-62. Epub 2000/10/18. PubMed PMID: 11035254. 183. Ross D, Siegel D. Functions of NQO1 in Cellular Protection and CoQ10 Metabolism and its Potential Role as a Redox Sensitive Molecular Switch. Front Physiol. 2017;8:595. Epub 2017/09/09. doi: 10.3389/fphys.2017.00595. PubMed PMID: 28883796; PMCID: PMC5573868. 184. Shin S, Wakabayashi N, Misra V, Biswal S, Lee GH, Agoston ES, Yamamoto M, Kensler TW. NRF2 modulates aryl hydrocarbon receptor signaling: influence on adipogenesis. Mol Cell Biol. 2007;27(20):7188-97. Epub 2007/08/22. doi: 10.1128/MCB.00915-07. PubMed PMID: 17709388; PMCID: PMC2168916. 185. Kataoka K, Igarashi K, Itoh K, Fujiwara KT, Noda M, Yamamoto M, Nishizawa M. Small Maf proteins heterodimerize with Fos and may act as competitive repressors of the NF-E2 transcription factor. Mol Cell Biol. 1995;15(4):2180-90. Epub 1995/04/01. PubMed PMID: 7891713; PMCID: PMC230446. 186. Kimura M, Yamamoto T, Zhang J, Itoh K, Kyo M, Kamiya T, Aburatani H, Katsuoka F, Kurokawa H, Tanaka T, Motohashi H, Yamamoto M. Molecular basis distinguishing the DNA binding profile of Nrf2-Maf heterodimer from that of Maf homodimer. J Biol Chem. 2007;282(46):33681-90. Epub 2007/09/19. doi: 10.1074/jbc.M706863200. PubMed PMID: 17875642. 187. Yamamoto T, Kyo M, Kamiya T, Tanaka T, Engel JD, Motohashi H, Yamamoto M. Predictive base substitution rules that determine the binding and transcriptional specificity of Maf recognition elements. Genes Cells. 2006;11(6):575-91. Epub 2006/05/24. doi: 10.1111/j.1365-2443.2006.00965.x. PubMed PMID: 16716189.

191
188. Bryan HK, Olayanju A, Goldring CE, Park BK. The Nrf2 cell defence pathway: Keap1-dependent and -independent mechanisms of regulation. Biochem Pharmacol. 2013;85(6):705-17. Epub 2012/12/12. doi: 10.1016/j.bcp.2012.11.016. PubMed PMID: 23219527. 189. Jain A, Lamark T, Sjottem E, Larsen KB, Awuh JA, Overvatn A, McMahon M, Hayes JD, Johansen T. p62/SQSTM1 is a target gene for transcription factor NRF2 and creates a positive feedback loop by inducing antioxidant response element-driven gene transcription. J Biol Chem. 2010;285(29):22576-91. Epub 2010/05/11. doi: 10.1074/jbc.M110.118976. PubMed PMID: 20452972; PMCID: PMC2903417. 190. Luo J. Autophagy and ethanol neurotoxicity. Autophagy. 2014;10(12):2099-108. Epub 2014/12/09. doi: 10.4161/15548627.2014.981916. PubMed PMID: 25484085; PMCID: PMC4502825. 191. Naba A, Clauser KR, Hoersch S, Liu H, Carr SA, Hynes RO. The matrisome: in silico definition and in vivo characterization by proteomics of normal and tumor extracellular matrices. Mol Cell Proteomics. 2012;11(4):M111 014647. Epub 2011/12/14. doi: 10.1074/mcp.M111.014647. PubMed PMID: 22159717; PMCID: PMC3322572. 192. Massey VL, Arteel GE. Acute alcohol-induced liver injury. Front Physiol. 2012;3:193. Epub 2012/06/16. doi: 10.3389/fphys.2012.00193. PubMed PMID: 22701432; PMCID: PMC3372892.

192
ABBREVIATIONS
Adh Alcohol dehydrogenase
AH Alcoholic hepatitis
Ahr Aryl hydrocarbon receptor
ALD Alcoholic liver disease
ANOVA Analysis of variance
Aldh Aldehyde dehydrogenase
ALT Alanine aminotransferase
APP Acute phase protein
ARE Antioxidant response element
ASH Alcoholic steatohepatitis
AST Aspartate aminotransferase
AUC Area under the curve
AUD Alcohol use disorder
AUDIT Alcohol use disorder identification test
BH Benjamini-Hochberg
BSA Bovine serum albumin
BUN Blood urea nitrogen
Cat Catalase
CCL2 C-C Motif Chemokine Ligand 2
CID Collision induced dissociation
COL Collagen
CRELD2 Cysteine-rich with EGF-like domain protein 2
CTP Child-Turcotte-Pugh score
Cyp2e1 Cytochrome P450 2E1
DAMP Damage-associated molecular pattern

193
DSM Diagnostic and Statistical Manual of Mental Disorders
DTT Dithiothreitol
ECM Extracellular matrix
EDTA Ethylenediaminetetraacetic acid
ER Endoplasmic reticulum
ETD Electron transfer dissociation
EtOH Ethanol
FA Formic acid
FASP Filter-aided sample preparation
FC Fold change
FDR False discovery rate
FTMS Fourier-transform mass spectrometry
GAPDH Glyceraldehyde 3-phosphate dehydrogenase
Gclc Glutamate-cysteine ligase catalytic subunit
GnHCl Guanidine hydrochloride
GO Gene ontology
H&E Hematoxylin & eosin
HC Healthy control
HCC Hepatocellular carcinoma
HCD Higher energy collision dissociation
HEPES 4-(2-hydroxyethyl)-1-piperazineethanesulfonic acid
HF Hepatic fibrosis
HLB Hydrophilic-lipophilic balance
HMGB1 High mobility group protein B1
HRS Hepatorenal syndrome
HSCs Hepatic stellate cells
IFN-γ Interferon gamma
IB Immunoblot
i.p. Intraperitoneal

194
IHC Immunohistochemistry
INR International normalized ratio
IPA Ingenuity Pathways Analysis
ITMS Ion trap mobility spectrometry
KCl Potassium chloride
KCs Kupffer cells
Keap1 Kelch-like ECH-associated protein 1
LC-MS/MS Liquid chromatography and tandem mass spectrometry
LPS Lipopolysaccharide
LTDH Lifetime drinking history
LXR Liver X receptor
M/z Mass-to-charge ratio
MD Maltose-dextrin
MDE Matrix-degrading enzymes
MELD Model for end-stage liver disease
MMPs Matrix metalloproteinases
Mpo Myeloperoxidase
mRNA Messenger ribonucleic acid
MS Mass spectrometry
NaCl Sodium chloride
NaF Sodium fluoride
NAFLD Non-alcoholic fatty liver disease
NASH Non-alcoholic steatohepatitis
NaVO3 Sodium metavanadate
NIAAA National Institute on Alcohol Abuse and Alcoholism
NIH National Institutes of Health
NP-40 Nonidet p-40
Nqo1 NAD(P)H quinone dehydrogenase 1
Nrf2 Nuclear factor erythroid 2–related factor 2

195
PAI-1 Plasminogen activator inhibitor
PAMP Pathogen-associated molecular pattern
PAS Periodic acid-Schiff
PBDC Proteomics Biomarkers Discovery Core
PCA Principle component analysis
PEBP1 Phosphatidylethanolamine-binding protein
PMN Polymorphonuclear leukocyte
PRR Pathogen recognition receptor
PT Prothrombin time
RANTES Regulated on activation, normal T cell expressed and secreted
RIN RNA integrity number
RIPA Radioimmunoprecipitation assay
RNA Ribonucleic acid
RXR Retinoid X receptor
SAA1 Serum amyloid A1
SAA2 Serum amyloid A2
SCX Strong cation exchange
SDS Sodium dodecyl sulfate
SGOT Serum glutamic oxaloacetic transaminase
SGPT Serum glutamic-pyruvic transaminase
SIRS Systemic inflammatory response syndrome
Sod1 Superoxide dismutase 1
Sod2 Superoxide dismutase 2
Sqstm Sequestrome-1
Tbili Total bilirubin
TBST Tris-buffered saline and Tween
TCA Trichloroacetic acid
TEABC Triethylammonium bicarbonate
TGFβ Transforming growth factor beta

196
TIC Total ion current
TIMP Tissue inhibitor of matrix metalloproteinases
TLR4 Toll-like receptor 4
TNFα Tumor necrosis factor-alpha
TMT Tandem mass tag
UHPLC Ultra-high-performance liquid chromatography

197
PUBLISHER’S NOTICE OF APPROVAL

198
CURRICULUM VITAE
Christine E. Dolin
University of Louisville School of Medicine
Department of Pharmacology and Toxicology
Louisville, KY 40292
______________________________________________________________________
1. EDUCATION
(2019) Ph.D. in Pharmacology and Toxicology
University of Louisville, Louisville, KY
2017 M.S. in Pharmacology and Toxicology
University of Louisville, Louisville, KY
2015 B.S. in Chemistry, conc. Biochemistry, Minor in Biology
University of Louisville, Louisville, KY
2. PROFESSIONAL EXPERIENCE
08/2015 - present Graduate Research Assistant (Advisor: Michael Merchant, Ph.D., formerly Gavin Arteel, Ph.D., until he moved in June 2018), Department of Pharmacology and Toxicology, University of Louisville
08/2014 - 07/2015 Undergraduate Research Assistant (Advisor: Gavin Arteel, Ph.D.), Department of Pharmacology and Toxicology, University of Louisville
05/2014 - 07/2014 National Cancer Institute R25 Cancer Education Program Trainee (Advisor: Gavin Arteel, Ph.D.), Department of Pharmacology and Toxicology, University of Louisville
01/2013 - 08/2013 Undergraduate Research Assistant (Advisor: Teresa Fan, Ph.D.), Department of Chemistry, University of Louisville
3. PROFESSIONAL MEMBERSHIPS AND ACTIVITIES
2018-present Kentucky Academy of Science (KAS)
2016-2018 Kentucky Biomedical Research Infrastructure and Network (KBRIN) Journal Club
2016-2017 American Society of Nephrology (ASN)

199
2015-present American Association for the Study of Liver Diseases (AASLD)
2014-present University of Louisville Alcohol Research Center (ULARC)
2014-present Society of Toxicology (SOT), Student Member
2014-present Ohio Valley Society of Toxicology (OVSOT)
4. AWARDS AND HONORS
2018 Abstract awarded “Best of the Liver Meeting”, AASLD’s Liver Meeting
2018 Invited to speak at Early Morning Workshop, AASLD’s Liver Meeting
2018 Abstract selected for oral presentation, AASLD’s Liver Meeting
2017 Abstract selected for oral presentation, OVSOT Fall Meeting
2017 Finalist in University of Louisville Three-Minute Thesis Competition
2016 Graduate Student Council Travel Award
2016 Abstract selected for oral presentation, OVSOT Summer Meeting
2015 Poster selected for third and final round of judging, Research!Louisville
2015 Abstract selected for oral presentation, OVSOT Summer Meeting
2015 One of seven University of Louisville undergraduate students selected to present research at the Atlantic Coast Conference Meeting of the Minds
2010 Valedictorian and Summa cum Laude, South Oldham High School
2009 Kentucky Governor’s Scholars Program, focus in Biological and Environmental Issues
5. SERVICE AND LEADERSHIP ACTIVITIES
02/2019 Organized and led presentation and activity for Westport Middle School Girls’ STEM Club, through the Kentucky Academy of Science
08/2018 Served on Q&A panel for new student welcome event, Department of Pharmacology and Toxicology, University of Louisville
07/2018 Collected clinical data for Superfund “Project Greenheart”, University of Louisville
07/2018 Led roundtable discussion for National Cancer Institute R25 Cancer Education Program students, University of Louisville
07/2016 Led roundtable discussion for National Cancer Institute R25 Cancer Education Program students, University of Louisville
08/2012-05/2013 Served on the University of Louisville Housing and Residence Life “Green Committee”, which promotes sustainability in residence halls

200
6. FUNDING
2017-present National Institute of Environmental Health Sciences NRSA Institutional Training Grant (T32) Predoctoral Fellowship, University of Louisville, Department of Pharmacology and Toxicology
2015-2017 Graduate Research Fellowship, Integrated Program in Biomedical Sciences, University of Louisville
7. ABSTRACTS AND PRESENTATIONS
A. Abstracts
Local/Regional
1. Dolin CE, Wilkey DW, Vatsalya V, McClain CJ, Merchant ML, Arteel GE. Poster, (2018) Peptidomic analysis of alcoholic hepatitis: a new prognostic tool? Research!Louisville, Louisville, KY.
2. Dolin CE, Poole LG, Wilkey DW, Arteel GE, Rouchka EC, Barati MT, Merchant ML. (2017) A novel effect of alcohol on the kidney: Chronic and acute alcohol exposure alter peroxisomal protein abundance in the renal cortex. Ohio Valley Society of Toxicology Annual Meeting, West Lafayette, IN.
3. Hudson SV, Dolin CE, Merchant ML, Arteel GE (2017) Arsenic Attenuates LPS-stimulated Polarization in Murine Bone Marrow Derived Macrophages: Potential Role of miR-301b. Research!Louisville, Louisville, KY.
4. Dolin CE, Poole LG, Wilkey DW, Arteel GE, Rouchka EC, Barati MT, Merchant ML. (2017) A novel effect of alcohol on the kidney: Chronic and acute alcohol exposure alter peroxisomal protein abundance in the renal cortex. Research!Louisville, Louisville, KY.
5. Dolin CE, Poole LG, Wilkey DW, Rouchka EC, Arteel GE, Barati MT, Michael L. Merchant. (2017) Effects of ethanol and lipopolysaccharide on the renal cortex proteome and transcriptome. UT-KBRIN Bioinformatics Summit, Burns, TN.
6. Dolin CE, Poole LG, Wilkey DW, Rouchka EC, Arteel GE, Barati MT, Michael L. Merchant. (2017) Effects of ethanol and lipopolysaccharide on the renal cortex proteome and transcriptome. Graduate Student Council Research Symposium, Louisville, KY.
7. Dolin CE, Poole LG, Wilkey DW, Arteel GE, Rouchka EC, Barati MT, Merchant ML. (2016) Effects of Ethanol and Lipopolysaccharide on the Renal Cortex Proteome and Transcriptome. Ohio Valley Society of Toxicology Annual Meeting, Indianapolis, IN.
8. Poole LG, Beier JI, Torres-Gonzalez E, Anwar-Mohamed A, Warner N, Dolin CE, Nguyen-Ho C, Hudson SV, Roman J, Arteel GE. (2016) Acute-on-chronic Alcohol Exposure Concomitantly Damages the Liver and Lung. Research!Louisville, Louisville, KY.
9. Hudson SV, Dolin CE, Poole LP, Massey VL, Wilkey DW, Merchant ML, Frieboes H, Arteel GE. (2016) Modeling Binding Kinetics of Integrin

201
Mediators of EtOH-enhanced LPS Liver Injury. Research!Louisville, Louisville, KY.
10. Dolin CE, Poole LG, Wilkey DW, Arteel GE, Rouchka EC, Barati MT, Merchant ML. (2016) Effects of Ethanol and Lipopolysaccharide on the Renal Cortex Proteome and Transcriptome. Research!Louisville, Louisville, KY.
11. Dolin CE, Poole LG, Wilkey DW, Barati MT, Arteel GE, Merchant ML. (2016) Characterization of the Impact of Ethanol and Lipopolysaccharide on the Renal Cortex Proteome. Ohio Valley Society of Toxicology Summer Meeting, Cincinnati, OH.
12. Dolin CE, Poole LG, Wilkey DW, Barati MT, Arteel GE, Merchant ML. (2016) Characterization of the Impact of Ethanol and Lipopolysaccharide on the Renal Cortex Proteome. University of Kentucky Postdoctoral Symposium, Lexington, KY.
13. Dolin CE, Massey VL, Poole LG, Siow DL, Merchant ML, Wilkey DW, Roman J, Arteel GE. (2016) The Hepatic and Pulmonary “Matrisomes” Respond Dynamically to Inflammatory Injury: Proteomic Characterization of Transitional ECM Changes in the Liver and Lung. Graduate Student Council Research Symposium, Louisville, KY.
14. Poole LG, Massey VL, Torres-Gonzalez E, Warner N, Siow D, Dolin CE, Lang AL, Hudson SV, Roman J, Arteel GE. (2015) Alcohol enhances endotoxemia-induced acute lung injury: role of plasminogen activator inhibitor-1. Research!Louisville, Louisville, KY.
15. Hudson SV, Dolin CE, Poole LP, Massey VL, Wilkey DW, Merchant ML, Frieboes H, Arteel GE. (2015) Modeling the Kinetics of Integrin Receptor Binding to Extracellular Matrix Proteins. Research!Louisville, Louisville, KY.
16. Dolin CE, Massey VL, Poole LG, Siow DL, Merchant ML, Wilkey DW, Roman J, Arteel GE. (2015) The Hepatic and Pulmonary “Matrisome” Responds Dynamically to Inflammatory Injury: Proteomic Characterization of the Transitional ECM Changes. Research!Louisville, Louisville, KY.
17. Dolin CE, Massey VL, Poole LG, Siow DL, Merchant ML, Wilkey DW, Arteel GE. (2015) The Hepatic “Matrisome” Responds Dynamically to Inflammatory Injury: Proteomic Characterization of the Transitional ECM Changes in the Liver. Ohio Valley Society of Toxicology Summer Meeting, Cincinnati, OH.
18. Dolin CE, Massey VL, Poole LG, Siow DL, Merchant ML, Wilkey DW, Arteel GE. (2015) The Hepatic “Matrisome” Responds Dynamically to Stress: Novel Characterization of the ECM Proteome. Atlantic Coast Conference Meeting of the Minds, Raleigh, NC.
19. Dolin CE, Massey VL, Poole LG, Siow DL, Merchant ML, Wilkey DW, Arteel GE. (2015) The Hepatic “Matrisome” Responds Dynamically to Stress: Novel Characterization of the ECM Proteome. Posters at the Capitol, Frankfort, KY.
20. Poole LG, Massey VL, Dolin CE, Siow DL, Merchant ML, Beier JI, Roman J, Arteel GE. (2014) Ethanol-induced changes in the hepatic ECM directly

202
enhance the pro-inflammatory response of macrophages. Ohio Valley Society of Toxicology Annual Meeting, Dayton, OH.
21. Dolin CE, Massey VL, Poole LG, Siow DL, Merchant ML, Wilkey DW, Arteel GE. (2014) The Hepatic “Matrisome” Responds Dynamically to Stress: Novel Characterization of the ECM Proteome. Ohio Valley Society of Toxicology Annual Meeting, Dayton, OH.
22. Massey VL, Poole LG, Torres E, Dolin CE, Merchant ML, Ritzenthaler J, Roman J, Arteel GE. (2014) Characterization of the liver:lung axis in alcohol-induced lung damage. Research!Louisville, Louisville, KY.
23. Poole LG, Massey VL, Dolin CE, Merchant ML, Beier JI, Roman J, Arteel GE. (2014) Ethanol-induced changes in the hepatic ECM directly enhance the pro-inflammatory response of macrophages. Research!Louisville, Louisville, KY.
24. Dolin CE, Massey VL, Poole LG, Siow DL, Merchant ML, Wilkey DW, Arteel GE (2014) The Hepatic “Matrisome” Responds Dynamically to Stress: Novel Characterization of the ECM Proteome. Research!Louisville, Louisville, KY.
25. Dolin CE, Massey VL, Poole LG, Siow DL, Merchant ML, Wilkey DW, Arteel GE (2014) The Hepatic “Matrisome” Responds Dynamically to Stress: Novel Characterization of the ECM Proteome. University of Louisville R25 Cancer Education Program, Louisville, KY.
National
1. Dolin CE, Wilkey DW, Vatsalya V, Srivastava S, McClain CJ, Rai SN, Merchant ML, Arteel GA (2018) Novel Biomarkers in Alcoholic Hepatitis: Analysis of the Plasma Peptidome/Degradome. Hepatology 68(6):1444A.
2. Hudson SV, Anwar-Mohamed A, Dolin CE, Merchant ML, Arteel GE (2017) Arsenic Attenuates Lipopolysaccharide-Stimulated Polarization in Murine Bone Marrow Derived Macrophages: Potential Role of miR-301b. The Toxicologist Supplement 2017:2992.
3. Hudson SV, Dolin CE, Merchant ML, Arteel GE (2017) Role of miR-301b in arsenic-altered macrophage polarization: potential insight into impact of arsenic exposure on innate immune response. Hepatology 66(S1):653.
4. Poole LG, Beier JI, Torres-Gonzalez E, Anwar-Mohamed A, Warner N, Dolin CE, Nguyen-Ho C, Ritzenthaler JD, Roman J, Arteel GE (2016) Acute-on-chronic alcohol exposure using the ‘NIAAA model’ concomitantly damages the liver and lung. Hepatology 64(S1):1221.
5. Hudson SV, Dolin CE, Poole LG, Massey VL, Wilkey DW, Brock GN, Merchant ML, Frieboes HB, Arteel GE (2016) Modeling Concurrent Binding of Mixed Integrin Species to Multiple ECM Ligands. The Toxicologist Supplement 2016:2211.
6. Dolin CE, Poole LG, Wilkey DW, Arteel GE, Rouchka EC, Barati MT, Merchant ML (2016) Omics Characterization of Ethanol and Lipopolysaccharide Impact on the Renal Cortex. JASN Abstract Supplement 2016 27:
203
7. Dolin CE, Massey VL, Poole LG, Siow DL, Merchant ML, Wilkey DW, Arteel GE. (2015) The Hepatic and Pulmonary “Matrisome” Responds Dynamically to Inflammatory Injury: Proteomic Characterization of the Transitional ECM Changes in the Liver. Hepatology 62(S1):587.
8. Dolin CE, Massey VL, Poole LG, Siow DL, Merchant ML, Wilkey DW, Arteel GE. (2015) The Hepatic “Matrisome” Responds Dynamically to Stress: Novel Characterization of the ECM Proteome. The Toxicologist Supplement 2015:693.
B. Oral Presentations
Local/Regional
1. 12/2018. Research Seminar. Using proteomics to discover new mechanisms and biomarkers in alcohol-induced organ injury. Department of Pathology and Laboratory Medicine, University of Kentucky, Lexington, KY.
2. 3/2018. Journal Club Presentation. Time and compartment resolved proteome profiling of the extracellular niche in lung injury and repair- Schiller et al. Kentucky Biomedical Research Infrastructure Network (KBRIN) Journal Club, Louisville, KY.
3. 12/2017. Platform Presentation, 12/2017, A novel effect of alcohol on the kidney: Chronic and acute alcohol exposure alter peroxisomal protein abundance in the renal cortex. Ohio Valley Society of Toxicology Annual Meeting, West Lafayette, IN.
4. 4/2017. Research Seminar. A systems-based approach to discover alcohol-induced mechanisms in the liver, lung, and kidney. Department of Pharmacology and Toxicology, University of Louisville, Louisville, KY.
5. 3/2017. Platform Presentation. Effects of ethanol and lipopolysaccharide on the renal cortex proteome and transcriptome. Graduate Student Council Research Symposium, Louisville, KY.
6. 3/2017. Research Seminar. A systems-based approach to discover alcohol-induced mechanisms in the liver, lung, and kidney. KBRIN Bioinformatics Group, University of Louisville, Louisville, KY.
7. 6/2016. Platform Presentation. Characterization of the Impact of Ethanol and Lipopolysaccharide on the Renal Cortex Proteome. Ohio Valley Society of Toxicology Summer Meeting, Cincinnati, OH.
8. 6/2016. Research Seminar. Proteomic Characterization of the Impact of Alcohol-Enhanced Inflammatory Injury on the Liver, Lung, and Kidney. Department of Pharmacology and Toxicology, University of Louisville, Louisville, KY.
9. 6/2015. Platform Presentation. The Hepatic “Matrisome” Responds Dynamically to Inflammatory Injury: Proteomic Characterization of the Transitional ECM Changes in the Liver. Ohio Valley Society of Toxicology Summer Meeting, Cincinnati, OH.
National

204
1. 11/2018. Platform Presentation. Novel biomarkers in alcoholic hepatitis: analysis of the plasma peptidome/degradome. American Association for the Study of Liver Diseases’ The Liver Meeting, San Francisco, CA.
2. 11/2018. Early Morning Workshop Presentation. The hepatic “matrisome” responds dynamically to injury: characterization of transitional changes to the extracellular matrix in mice. American Association for the Study of Liver Diseases’ The Liver Meeting, San Francisco, CA.
C. Posters
Local/Regional
1. 10/2018. Peptidomic analysis of alcoholic hepatitis: a new prognostic tool? Research!Louisville, Louisville, KY.
2. 9/2017. A novel effect of alcohol on the kidney: Chronic and acute alcohol exposure alter peroxisomal protein abundance in the renal cortex, Research!Louisville, Louisville, KY.
3. 4/2017. Effects of ethanol and lipopolysaccharide on the renal cortex proteome and transcriptome, UT-KBRIN Bioinformatics Summit, Burns, TN.
4. 10/2016. Effects of Ethanol and Lipopolysaccharide on the Renal Cortex Proteome and Transcriptome. Ohio Valley Society of Toxicology Annual Meeting, Indianapolis, IN.
5. 10/2016. Effects of Ethanol and Lipopolysaccharide on the Renal Cortex Proteome and Transcriptome. Research!Louisville, Louisville, KY.
6. 6/2016. Characterization of the Impact of Ethanol and Lipopolysaccharide on the Renal Cortex Proteome. University of Kentucky Postdoctoral Symposium, Lexington, KY.
7. 4/2016. The Hepatic and Pulmonary “Matrisomes” Respond Dynamically to Inflammatory Injury: Proteomic Characterization of Transitional ECM Changes in the Liver and Lung. Graduate Student Council Research Symposium, Louisville, KY.
8. 10/2015. The Hepatic and Pulmonary “Matrisome” Responds Dynamically to Inflammatory Injury: Proteomic Characterization of the Transitional ECM Changes. Research!Louisville, Louisville, KY.
9. 2015. The Hepatic “Matrisome” Responds Dynamically to Stress: Novel Characterization of the ECM Proteome. Atlantic Coast Conference Meeting of the Minds, Raleigh, NC.
10. 2014. The Hepatic “Matrisome” Responds Dynamically to Stress: Novel Characterization of the ECM Proteome. Ohio Valley Society of Toxicology Annual Meeting, Dayton, OH.
11. 9/2014. The Hepatic “Matrisome” Responds Dynamically to Stress: Novel Characterization of the ECM Proteome. Research!Louisville, Louisville, KY.
12. 2014. The Hepatic “Matrisome” Responds Dynamically to Stress: Novel Characterization of the ECM Proteome. University of Louisville National Cancer Institute R25 Cancer Education Program, Louisville, KY.

205
National
1. 11/2016. Omics Characterization of Ethanol and Lipopolysaccharide Impact on the Renal Cortex. American Society of Nephrology Kidney Week, Chicago, IL.
2. 11/2015. The Hepatic and Pulmonary “Matrisome” Responds Dynamically to Inflammatory Injury: Proteomic Characterization of the Transitional ECM Changes in the Liver. American Association for the Study of Liver Diseases’ The Liver Meeting, San Francisco, CA.
3. 3/2015. The Hepatic “Matrisome” Responds Dynamically to Stress: Novel Characterization of the ECM Proteome. Society of Toxicology Annual Meeting, San Diego, CA.
8. PUBLICATIONS
A. Papers
As coauthor
1. Hudson SV, Dolin CE, Merchant ML, and Arteel GE. Arsenic attenuates lipopolysaccharide-stimulated polarization in murine bone marrow derived macrophages. (Toxicol. Appl. Pharmacol. 2018, submitted)
2. Poole LG, Beier JI, Torres-Gonzales E, Schlueter CF, Hudson SV, Artis A, Warner NL, Nguyen-Ho CT, Dolin CE, Ritzenthaler JD, Hoyle GW, Roman J, Arteel GE. Chronic + binge alcohol exposure promotes inflammation and alters airway mechanics in the lung. (Alcohol. 2018, in press)
3. Hudson SV, Dolin CE, Poole LG, Massey VL, Wilkey DW, Beier JI, Merchant ML, Frieboes HB, and Arteel GE. Modeling the Kinetics of Integrin Receptor Binding to Hepatic Extracellular Matrix Proteins. Sci Rep. 2017; 7(1): 12444. PMID: 28963535. PMCID: PMC5622105
4. Poole LG, Dolin CE, Arteel GE. Organ-Organ Crosstalk and Alcoholic Liver Disease. Biomolecules. 2017; 7(3): 62. PMID: 28812994. PMCID: PMC5618243
As primary author
5. Dolin CE, Poole LG, Wilkey DW, Isaacs SM, Arteel GE, Rouchka EC, Barati MT, Merchant ML. Proteotranscriptomics demonstrates chronic moderate alcohol consumption influences renal cortical oxidant response pathways. (2019, in preparation)
6. Massey VL*, Dolin CE*, Poole LG, Hudson SV, Siow DL, Brock GN, Merchant ML, Wilkey DW, and Arteel GE. The hepatic “matrisome” responds dynamically to injury: characterization of transitional changes to the extracellular matrix in mice. Hepatology. 2017; 65(3): 969-982. PMID: 28035785. PMCID: PMC5319876. [*co-first authors listed by seniority]


![Review Article An Update on Sepsis Biomarkers...sequential organ failure assessment (SOFA) score [4], recommended for assessing organ dysfunction in sepsis criteria-3 [1], runs the](https://static.fdocuments.net/doc/165x107/5f32800362b92645966bf002/review-article-an-update-on-sepsis-biomarkers-sequential-organ-failure-assessment.jpg)