Novel diagnostic microarray assay formats towards ...
102
Novel diagnostic microarray assay formats towards comprehensive on-site analysis JESPER GANTELIUS Royal Institute of Technology School of Biotechnology Stockholm 2009
Transcript of Novel diagnostic microarray assay formats towards ...

Novel diagnostic microarray assay formats
towards comprehensive on-site analysis
JESPER GANTELIUS
Royal Institute of Technology
School of Biotechnology
Stockholm 2009

ii
© Jesper Gantelius 2009
ISBN 978-91-7415-416-0
TRITA BIO-Report 2009:18
ISSN 1654-2312
Royal Institute of Technology
School of Biotechnology
AlbaNova University Center
SE - 106 91 Stockholm
Sweden
Printed at Universitetsservice US-AB
Drottning Kristinas väg 53B
SE - 100 44 Stockholm
Cover: Computer-rendered visualization of antibody-coated magnetic microbeads binding to captured autoantigens on a microarray spot
Cover image creation: Jeroen Huijben (Nymus3D, [email protected])

iii
Jesper Gantelius (2009), Novel diagnostic microarray assay formats - towards
comprehensive on-site analysis. School of Biotechnology, Royal Institute of Technology
(KTH), Albanova University Center, Stockholm, Sweden. ISBN 978-91-7415-416-0
ABSTRACT
Advances in molecular methods for analyzing DNA, RNA and proteins in humans as well as in other animals, plants, fungi, bacteria or viruses have greatly increased the resolution with which we can study life’s complexity and dynamics on earth. While genomic, transcriptomic and proteomic laboratory tools for molecular diagnosis of disease are rapidly becoming more comprehensive, the access to such advanced yet often expensive and centralized procedures is limited. There is a great need for rapid and comprehensive diagnostic methods in low-resource settings or contexts where a person can not or will not go to a hospital or medical laboratory, yet where a clinical analysis is urgent.
In this thesis, results from development and characterization of novel technologies for DNA and protein microarray analysis are presented. Emphasis is on methods that could provide rapid, cost-effective and portable analysis with convenient readout and retained diagnostic accuracy. The first study presents a magnetic bead-based approach for DNA microarray analysis for a rapid visual detection of single nucleotide polymorphisms. In the second work, magnetic beads were used as detection reagents for rapid differential detection of presence of pestiviral family members using a DNA oligonucleotide microarray with read-out by means of a tabletop scanner or a digital camera. In paper three, autoimmune responses from human sera were detected on a protein autoantigen microarray, again by means of magnetic bead analysis. Here, special emphasis was made in comprehensively comparing the performance of the magnetic bead detection to common fluorescence-based detection. In the fourth study, an immunochromatographic lateral flow protein microarray assay is presented for application in the classification of contagious pleuropneumonia from bovine serum samples. The analysis could be performed within 10 minutes using a table top scanner, and the performance of the assay was shown to be comparable to that of a cocktail ELISA. In the fifth paper, the lateral flow microarray framework is investigated in further detail by means of experiments and numerical simulation. It was found that downstream effects play an important role, and the results further suggest that the downstream binding profiles may find use in simple affinity evaluation.
Keywords: magnetic microbeads, gold nanobeads, microarrays, lateral flow, on-site diagnosis, SNPs, pestivirus, autoimmunity, contagious bovine pleuropneumonia, comsol multiphysics, finite element method
© Jesper Gantelius 2009

iv

v
"If we shadows have offended,
Think but this, and all is mended,
That you have but slumber'd here
While these visions did appear.
And this weak and idle theme,
No more yielding but a dream,
Gentles, do not reprehend:
if you pardon, we will mend.
And, as I am an honest Puck,
If we have unearned luck
Now to 'scape the serpent's tongue,
We will make amends ere long;
Else the Puck a liar call;
So, good night unto you all.
Give me your hands, if we be friends,
And Robin shall restore amends."
The Puck’s closing speech at the end of
“A Midsummer Night’s Dream”

vi

vii
List of publications
This thesis is based upon the following publications, which are referred to in the text by
their Roman numerals (I-V). The five papers are found in the appendix.
I. Ståhl PL, Gantelius J, Natanaelsson C, Ahmadian A, Andersson-Svahn H,
Lundeberg J. Visual DNA - identification of DNA sequence variations by bead
trapping. Genomics. 2007 Dec;90(6):741-5.
II. Leblanc N*, Gantelius J*, Schwenk JM, Ståhl K, Blomberg J, Andersson-Svahn H,
Belák S. Development of a magnetic bead microarray for simultaneous and simple
detection of four pestiviruses. J Virol Methods. 2009 Jan;155(1):1-9.
III. Gantelius J*, Hartmann M*, Schwenk JM, Roeraade J, Andersson-Svahn H, Joos
TO. Magnetic bead-based detection of autoimmune responses using protein
microarrays. N Biotechnol. 2009 Aug 4.
IV. Gantelius J, Hamsten C, Neiman M, Schwenk JM, Persson A, Andersson-Svahn
H. A lateral flow protein microarray for rapid determination of contagious bovine
pleuropneumonia in bovine serum. Submitted
V. Gantelius J, Nystrand M, Härlin A, Elfverson G, Schwenk JM, Uhlen M,
Eriksson-Karlström A, Andersson-Svahn H. Evaluation of a lateral flow microarray
assay system. Manuscript
*These authors contributed equally
All papers are reproduced with permission from the copyright holders

viii
Table of Contents
Introduction..............................................................................................................................................1
1 Rapid testing as part of global public health strategies..........................................................2
1.1 Mapping the global burden of disease .......................................................................... 2
1.2 Future projections of global burden of disease ........................................................... 9
1.3 Efforts towards global public health ............................................................................ 10
1.4 Medical tests, and challenges in reaching difficult target groups .......................... 12
1.5 Advantages and challenges with rapid tests ............................................................... 13
2 Biomarker analysis for molecular diagnosis of disease.......................................................14
2.1 Biomarkers as indicators of health and disease ......................................................... 14
2.2 Mapping and investigation of biomarker patterns .................................................. 16
2.3 Performance of biomarker sampling and analysis .................................................... 18
2.4 Technology platforms .................................................................................................... 22
2.4.1 Non-affinity based methods for biomarker analysis........................................... 23
2.4.2 Immunoassays for affinity-based biomarker analysis ......................................... 24
2.4.3 Lateral flow immunochromatography .................................................................. 26
2.4.4 DNA and RNA analysis ............................................................................................ 27
2.4.5 Microarray assays for multi-parameter analysis .................................................. 28
2.4.6 Signal amplification and detection strategies ...................................................... 31
2.4.7 Label free detection methods .................................................................................. 32
2.5 Affinity ligands ................................................................................................................. 32

ix
3 Theory for present investigation.............................................................................................36
3.1 Dynamics of affinity interactions ................................................................................. 36
3.2 Diffusion, convection and active transport ................................................................ 37
3.3 Capture surface considerations for immunoassays .................................................. 38
3.4 Microbeads as mobile affinity reagents for microarray analysis ............................ 41
3.4.1 Microparticles in biochemical and microfluidic assays ..................................... 41
3.4.2 Mobility of superparamagnetic microparticles ................................................... 42
3.4.3 Magnetic bead decoration and force-probing of microspots ........................... 46
4 Present investigation..................................................................................................................53
4.1 Visualization of DNA hybridization on microarrays for facilitated SNP analysis using magnetic microbeads (I) .................................................................................................... 54
4.2 Rapid and simplified differential microarray analysis of four pestiviruses using magnetic microbeads (II) .............................................................................................................. 57
4.3 Protein autoantigen microarray analysis of human autoimmunity using magnetic microbeads (III) ............................................................................................................ 60
4.4 A lateral flow protein microarray for rapid determination of contagious bovine pleuropneumonia status in bovine serum (IV) ........................................................................ 63
4.5 Characterization of a protein lateral flow microarray through mathematical modelling and experimental assays (V) ..................................................................................... 67
Concluding remarks.............................................................................................................................72
Acknowledgements..............................................................................................................................74
References .............................................................................................................................................. 76

x

xi
Abbreviations AIDS acquired immunodeficiency syndrome
AUC area under curve
CBPP contagious bovine pleuropneumonia
DALY disability adjusted life years
DNA deoxyribonucleic acid
ELISA enzyme-linked immunosorbent assay
FEM finite element method
FN false negative
FP false positive
GDP gross domestic product
HIV human immunodeficiency virus
Ig immunoglobuline
PCR polymerase chain reaction
RIA radioimmunoassay
RNA ribonucleic acid
ROC receiver-operating characteristics
SEP socio-economic position
TN true negative
TNF-α tumor necrosis factor alpha
TP true positive
WHO world health organization
YLL years of life lost

xii

1
Jesper Gantelius
Introduction
Today, diagnostic assays performed in research institutes and medical laboratories can be
employed to investigate presence or levels of thousands of molecular biomarkers from
patient samples with the aim of identifying the cause of ailments, assess what is the best
choice of medication and dose for an individual, discover early signs of disease or reveal
elevated disposition for adverse conditions. Further, the number of discovered diagnostic
biomarkers will likely continue to grow together with the improved performance of
biochemical assays and sophistication of bioinformatic methods [1, 2].
However, while for instance genetic sequencing technologies and proteomic analyses are
tools that can aid medical professionals provide patients with adequate diagnosis and care,
such techniques generally rely upon expensive, bulky equipment suitable for centralized
laboratories and regions where adequate financing of public health and primary care is
available. Consequently, there is a great need for novel technologies that can remodel
laboratory-based tools into such formats that can be applied in low-resource, mobile
environments.
In this thesis, the development, application and characterization of modified planar
microarray assays is presented. Paper I-III demonstrate the application of magnetic
microbeads as agents of accelerated multi-parameter analysis on DNA and protein
microarrays, with facilitated read-out by means of tabletop scanning and digital
photography. In paper IV and V, the presented work is directed towards characterization of
a lateral flow microarray assay system, with the aim of evaluating to what extent microarrays
could be incorporated successfully in a format common to rapid tests. The performance,
advantages, disadvantages and applicability of the two modified microarray assay
technologies is discussed.

2
Novel diagnostic microarray assay formats – towards comprehensive on-site analysis
1 Rapid testing as part of global public health strategies
1.1 Mapping the global burden of disease
In 2008, globally almost 57 million people lost their lives, amounting to almost 1% of the
World’s total population [3]. The World Health Organization (WHO) in the Global
Burden of Disease report [4] succinctly summarizes, “In Africa, death takes the young; in
high-income countries, death takes the old”, and illustrates the statement by noting that in
the African region as a whole, 46% of all deaths recorded were among children aged under
15 years. In high-income countries, the fraction of deaths by children under 15 years is less
than one percent (figure 1.1a).
Figure 1.1a Per cent distribution of the age when death takes place in different regions [4]

3
Jesper Gantelius
While the causes of death and poor health are stratified by such factors as gender, age, socio-
economic background, risk-behavior and quality of prevention work [5, 6], the gross
domestic product (GDP) per capita measure can be used to group countries into broad
categories with different challenges. According to WHO definition, low-income countries
are those with GDP per capita of less than $825, while high-income countries have a GDP
per capita in excess of $10.066. When such a grouping is made, substantial differences in the
patterns of the leading causes of deaths can be observed (table 1.1a).
Table 1.1a Leading causes of death in four income regions of the world in 2004 [4]
4
Novel diagnostic microarray assay formats – towards comprehensive on-site analysis
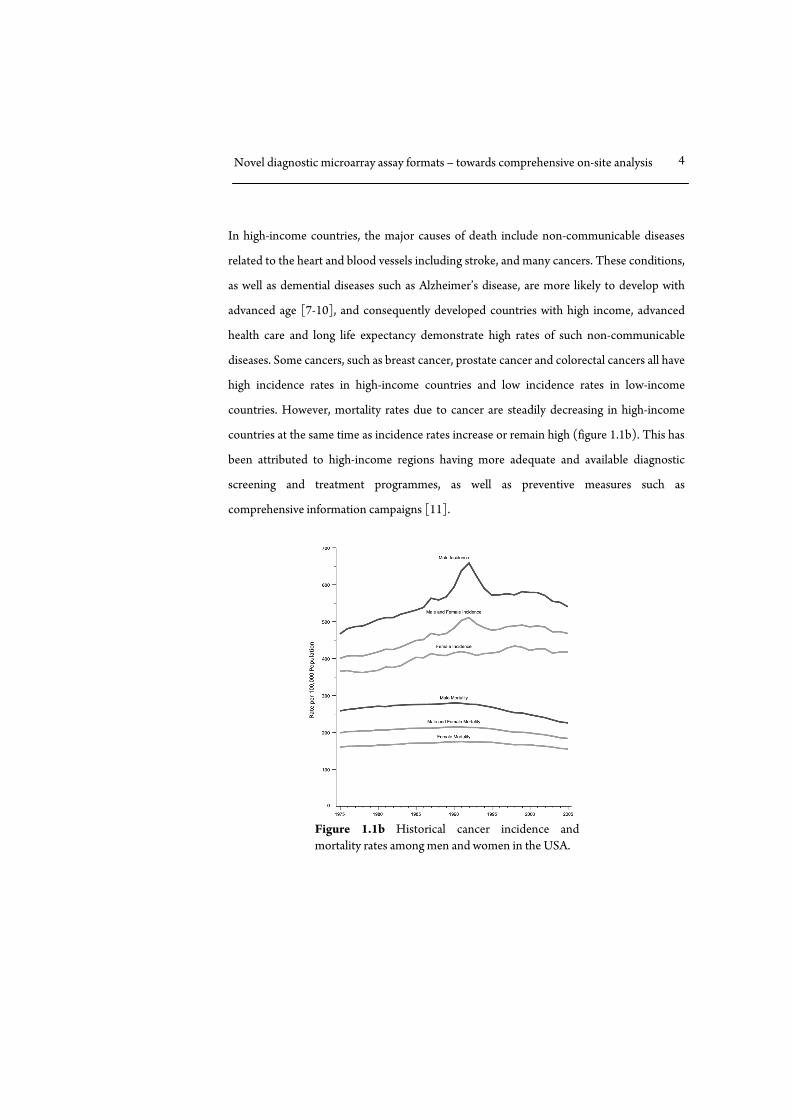
In high-income countries, the major causes of death include non-communicable diseases
related to the heart and blood vessels including stroke, and many cancers. These conditions,
as well as demential diseases such as Alzheimer’s disease, are more likely to develop with
advanced age [7-10], and consequently developed countries with high income, advanced
health care and long life expectancy demonstrate high rates of such non-communicable
diseases. Some cancers, such as breast cancer, prostate cancer and colorectal cancers all have
high incidence rates in high-income countries and low incidence rates in low-income
countries. However, mortality rates due to cancer are steadily decreasing in high-income
countries at the same time as incidence rates increase or remain high (figure 1.1b). This has
been attributed to high-income regions having more adequate and available diagnostic
screening and treatment programmes, as well as preventive measures such as
comprehensive information campaigns [11].
Figure 1.1b Historical cancer incidence andmortality rates among men and women in the USA.

5
Jesper Gantelius
While most cancers and diseases related to advanced age are common primarily in high-
income regions, two conditions that have become prevalent in low- middle and high income
regions alike (with the important exception of sub-saharan africa) are overweight/obesity
and lung cancer. Both conditions result in substantial health deterioration, and the common
denominator of the two is the strong connection to socioeconomic position (SEP) and
social origin [12]. Overweight/obesity has been shown to coincide with increased risk of
developing cardiovascular disorders [13] and various cancers [14], and displays a high and
rising prevalence among vulnerable socioeconomic groups globally [15]. Further, WHO
has predicted obesity to soon replace the presently dominating health concerns, such as
malnutrition and infectious diseases as the most significant cause of poor health [16], with
an expected global prevalence rate of more than two billion overweight, and among them
more than one billion obese persons in 2030 [17].

6
Novel diagnostic microarray assay formats – towards comprehensive on-site analysis
Globally, lung cancer is the most common cancer. While it is very difficult to treat
successfully [18], improved diagnostic methods may provide accurate early identification of
disease as well as improve clinical decisions regarding therapeutic strategy [19]. Smoking is
the strongest general determinant of lung cancer, causing more than 80% of all new cases,
and the habit significantly increases the risk of developing also other conditions such as
strokes and heart attacks [20, 21]. Further, smoking has a very high global prevalence with
1.45 billion predicted smokers by 2010 and more than 5 million estimated yearly deaths
[22]. Tobacco use is growing fastest in low-income countries, and it is estimated that in
2030, 80% of tobacco-related deaths will occur in low- and middle income countries. While
comprehensive anti-smoking strategies may be successful in curbing tobacco use [23],
accurate diagnosis of disease will likely become an increasingly important complementary
approach together with adequate treatment in reducing the harmful effects to the world’s
smoking population [19].
Mortality rate and life expectancy in different populations can be strong indicators of poor
conditions for health. However, they are limited in the extent to which information about
the severity of a condition in other respects, such as degree of incapacitation , pain or
stigmatization. In an attempt to provide a quantitative indicator of the amount of harm a
disease or condition is causing a population, the “disability adjusted life years” (DALY)
proxy was constructed by the WHO. This DALY amalgamates two other proxies, the years
of life lost (YLL) due to a particular condition, and the years lost due to disability (YLD)
that takes into account how debilitating a condition is on average.

7
Jesper Gantelius
In table 1.1b (next page), the burden of disease, in terms of DALYs is shown in different
regions of the world, with sub-grouping of the type of disease that contribute to the DALYs.
Africa as a region has by far the highest proportion of DALYs and many of the biggest
contributors to the high DALY number in the low-income group are practically non-
existent in high-income regions, including for instance diarrheal diseases, HIV/AIDS,
tuberculosis, neonatal infections and malaria [4]. When country income groups are
compared, it can be seen that the population in high income countries in contrast lose
healthy life years mostly due to unipolar depressive disorders, cardiovascular diseases,
dementias and disorders related to alcohol use, while population in low income countries
loose healthy life years due to lower respiratory infections, diarrheal diseases, HIV/AIDS
and Malaria. The disparity in the causes of disease burden in different regions suggests that
case managing resources and efforts to the local needs is essential.

8
Novel diagnostic microarray assay formats – towards comprehensive on-site analysis
Table 1.1b The burden of disease in four income regions of the world [4].

9
Jesper Gantelius
1.2 Future projections of global burden of disease
WHO predicts that in the future, leading up to 2030, cancers as a cause of death will globally
increase in number and in the relative proportion of the total annual deaths, as will
cardiovascular diseases, with a projected decline in conditions related to communicable
diseases, poor nutrition and lack of sanitation (figure 1.2). These estimations are founded
upon trends indicating improved income, living conditions, education and health care
resources in several regions [4]. While the suffering from conditions resulting from poverty,
sanitation issues, malnutrition and lack of basic health care resources is thus predicted to
decline, the trend of an increasing global burden of disease counted in millions of DALYs
suggest that comprehensive and dynamic distribution of health care resources will be even
more important in the years to come.
Figure 1.2 Projected number of deaths globally for selected causes [4].

10
Novel diagnostic microarray assay formats – towards comprehensive on-site analysis
1.3 Efforts towards global public health
In the January issue of Science, 1921, Charles-Edward Amory Winslow suggested that
public health could be defined as “the science and art of preventing disease, prolonging life
and promoting health through the organized efforts and informed choices of society,
organizations, public and private, communities and individuals” [24]. Later, in the preamble
to the constitution of the World Health Organization in 1946, health was defined as “a state
of complete physical, mental and social well-being and not merely the absence of disease or
infirmity” [25]. In an effort directed towards developing a global strategy for improved
global public health, the United Nations in 2001 issued the so called Millenium
Development Goals, which are a list of eight international development goals that 192
United Nation members have agreed to achieve by the year of 2015, with the aim to a)
Eradicate extreme poverty and hunger b) Achieve universal primary education c) Promote
gender equality and empower women d) Reduce child mortality e) Improve maternal
health f) Combat HIV/AIDS, malaria and other diseases g) Ensure environmental
sustainability and h) Develop a global partnership for development.
While results so far have been uneven, certain important progress has been made. For
instance, the fraction of the developing world’s population living in extreme poverty was
reduced from half to around a quarter during the period 1990-2005 and child mortality
rates decreased from 12.6 million in 1990 to 9 million per year in 2007. Further, the
enrollment of primary school students increased by 15% in sub-Saharan Africa during the
years 2000 to 20007, despite the HIV/AIDS epidemics [26]. In line with such efforts as the
Millenium Development Goals, the WHO has summarized a set of suggested areas of health
care reform that are argued to be applicable for health care systems regardless of the income
region and that “reflect a convergence between the values of primary health care, the
expectations of citizens and the common health performance challenges that cut across all
contexts” [4].

11
Jesper Gantelius
The four areas include: a) Universal coverage reforms, aiming to reduce health inequity and
improve social justice, b) Service delivery reforms, to favor a more patient-centric strategy
that can better meet the individual need, better adapt to the health challenges of a changing
world, as well as stimulate participation and knowledge in patients, c) Public policy reforms,
that strive to integrate public health actions and primary care with the purpose of securing
healthier communities, and d) Leadership reforms, suggesting less static hierarchy in the
control and structure of health care organizations and moving towards “participatory,
negotiations-based leadership indicated by the complexity of health systems”.
Low-income countries account for an estimated 56 % of the global burden of disease but
only 2 % of the total health spending. The resulting suffering and death in such areas is
largely due to highly preventable diseases and conditions such as diarrhea, malaria,
tuberculosis and HIV/AIDS. Further, due to lack of sanitation, the primary cause of death
for women in developing countries is childbirth and pregnancy [27]. While the amount of
money directed towards addressing poor countries health has in fact doubled during the
past fifteen years, several challenges remain. According to WHO recommendations, a
minimum basic health benefit package necessary to provide adequate health care to each
person requires approximately US$34 per year. In high-income countries, the average per
capita health spending per year is US$3810, compared to a figure of US$24 in low-income
countries [28]. As US$34 is a minimum suggested figure, and the spending of US$24 is the
average spending per capita, it is clear that only a limited proportion of citizens in low-
income countries have access to even the most fundamental health care services Further,
reports have concluded that national health care spending as well as external resources are
often not spent fairly among development country populations [27]. As a consequence,
efforts are suggested to be directed towards a) Improving the coordination of global efforts
in health reforms b) Establishing sufficient and adequate financing and infrastructures for
delivery of primary health care, and c) Strengthen mechanisms that assist equal and efficient
distribution of health care resources [29].

12
Novel diagnostic microarray assay formats – towards comprehensive on-site analysis
1.4 Medical tests, and challenges in reaching difficult target groups
Medical tests are an important part of the process of providing adequate treatment or
support in case of disease. The procedure surrounding the examination or testing can
however also have several other benefits to individual and public health, as it may play an
important role on primary, secondary as well as tertiary prevention levels. On primary level,
health checkups and testing can contribute to elevated knowledge about health and risk
behavior, particularly among target groups with high risk of contracting disease. In
secondary prevention, continuous and convenient medical tests can help identify disease at
an early stage, which is often beneficial both in terms of initiating adequate treatment, and
in minimizing risk of contagion in the case of communicable diseases. Finally, in tertiary
prevention (harm reduction), medical tests may assess the ongoing status and needs of a
person suffering from disease, as well as to provide a context in which the affected person
has near access to consultation, advice and medication from health professionals or
community health workers, as well as other means of improving his or her health situation.
[30, 31].
Hospitals and medical laboratories will conceivably continue to provide the most
comprehensive diagnostic facilities and related medical resources. However, an
overwhelming majority of the world’s population has currently no possibility to find or
enter a hospital for preventive screening, and may not even go, even if symptoms of disease
are obvious [32]. Patients may not afford or take time from their work to see a doctor for
health checkups or to investigate symptoms of disease [33], or he/she may have inadequate
knowledge about what benefits such a meeting with the health care could bring [34]. In
some regions, girls and women experience substantial restrains by their society, which can
limit their access to health care resources and basic medical information [35]. Further,
stigmatization and self-stigma of some socioeconomic groups, drug abuse, criminal record
and indignation or disillusion towards state and health care bodies may also lead to a social
inequality of people getting access to accurate medical checkups and information [36].

13
Jesper Gantelius
1.5 Advantages and challenges with rapid tests
Cost-effective rapid tests are useful components in providing basic healthcare to the general
public as well as to marginalized groups although such devices can find use also in advanced
medical establishments [37]. Further, rapid tests may lower the threshold for
implementation by organizations and governmental bodies with a wish to conduct
comprehensive cohort screening, but having only limited resources to do so [38]. When
testing can be performed on-site during for instance outreach work, the test in itself can
provide one incentive for participation in a connected activities, such as counseling,
adequate trainings or education that are well known to substantially reduce risk behavior
but may otherwise be difficult to provide to some target groups [39]. Thus, employing
rapid, portable and easy to use tests, medical staff or community health workers are more
likely to reach individuals and groups that may have no possibility or wish to enter a clinic or
a doctor’s office [40]. In the case of veterinary diseases, rapid tests may also facilitate non-
governmental or state organization in quickly identifying and blocking the spread of
potential epidemics, as well as reducing the economic loss for the state and individual
farmers [41]. Cost-effective and easy to use tests may also lower the threshold for adoption
by small-scale farmers.
In order for rapid tests to be useful, they need to exhibit sufficiently high diagnostic
accuracy, and the tests need to be trusted to give reliable results in environments much
more diverse than clean, climate-controlled medical laboratories. It is also necessary for the
person that performs the testing procedure to do so in a correct way. If a community health
worker with limited training or the patient him/herself carries out the test, there may be a
risk of unreliable test results due to improper handling, although trainings on the procedure
can drastically improve the success rate [42].

14
Novel diagnostic microarray assay formats – towards comprehensive on-site analysis
Further, while rapid tests have proved valuable in extending medical diagnosis into difficult
environments and target groups, fundamental services of medical centers such as provision
of information material and counseling often need to be implemented in the field work,
suggesting rapid tests as an essential component in a comprehensive mobile health service
package.
2 Biomarker analysis for molecular diagnosis of disease
Diagnosis can be performed to investigate some aspect of the physiological state of a patient
or client. The purpose can be to determine the cause of ailment, but can also be made in a
pre-emptive effort to screen for disease even before the patient experiences symptoms.
Further, medical diagnosis can be performed with the aim of evaluating for instance a
person’s predisposition for developing certain conditions. In higher organisms,
physiological function, health, disease and predisposition result from the interplay of
organs, tissues, cells, biomolecules and accessory chemical species. In molecular diagnosis,
biomolecular markers are probed and investigated in biological systems with the aim of
identifying reliable signatures that can guide health care systems in providing rapid
adequate treatment.
2.1 Biomarkers as indicators of health and disease
The biomolecules that make up cells and tissues present a wide variety of substances, from
small molecules such as lipids, vitamines and hormones, through amino acids and
nucleotides, to large or very large biomacromolecule polymers such as polysacharides,
nucleic acids, peptides and proteins. Some biomolecules take part in structural frameworks
with a fixed position in a tissue while others are highly mobile in the biofluids such as blood,
urine, saliva, sweat, semen and cerebrospinal fluid.

15
Jesper Gantelius
Most cells in the body carry the total genetic information about the person - his or her
genome - that consists of chromosomes of double helical DNA. Genes distributed over the
chromosomes contain the basic instructions needed to build a new being, and bacteria and
viruses that may use the human body as a host have genomes of their own, made up either
from DNA or RNA.
A biomarker may be described as a biomolecule, i.e. an organic molecule produced by a
living organism, that somehow by its abundance or physicochemical property provide
information about some relevant aspect of the physiological or pathological state of the
organism. Stretches or even single positions in DNA strands can act as biomarkers, and so
can mRNA and proteins, and likely most other biomolecules.
Sawyer [43] classified cancer biomarkers as prognostic, predictive or pharmacodynamic.
The prognostic markers may provide information about the prognosis of a patient if
treatment is not provided, while predictive markers can help indicate what treatment would
be the most efficient for a patient, and pharmacodynamic biomarkers can aid in estimating
the correct pharmaceutical dose. Thus, biomarkers can be employed in identification of
disease, or risk of developing disease, and may also contribute to the design of an adequate
treatment.
For biomarkers in the form of mRNA and proteins not only presence - but levels - can be
important. For mRNA transcripts, the copy number, that is the number of identical mRNA
transcripts in a single cell at a specific point in time, have been found to vary from one to
several thousands copies per cell [44]. Proteins are even more variable, with single cells
carrying single up to to millions of copies of a particular protein, and biofluids such as blood
having protein levels spanning over at least ten levels of magnitude – from high abundant
proteins such as serum albumin or IgG to ultra-low abundant cytokines [45].

16
Novel diagnostic microarray assay formats – towards comprehensive on-site analysis
2.2 Mapping and investigation of biomarker patterns
While some individual biomarkers have been shown to be reliable determinants of disease,
for instance presence of antibodies that bind to proteins displayed on the surface of the
HIV-virus [46], it has been argued that individual differences in protein expression make it
difficult to identify single biomarkers that can be reliably used to determine disease [47].
This is the case for instance with the diagnostic marker used to screen for prostate cancer,
the prostate specific antigen (PSA). Here, while there is strong evidence that there is an
overall correlation between elevated levels of PSA and prostate cancer, the correlation is not
perfect and the low diagnostic accuracy results in a substantial fraction of mis-classifications
[48]. Recent efforts have shown that a concurrent measurement of panels of biomarkers
may reveal signature patterns specific for cancer. These findings suggest that even if
individual biomarkers can not provide a definite classification, the collective pattern might
[49-51]. Further, multiplexed analysis of biomarkers can be valuable also in differential
diagnosis. When several infections could be the cause of symptoms, methods that can detect
presence of a large set of biomarkers from putative pathogens may be helpful for quickly
determining what kind of action is appropriate. In veterinary medicine, reliable and rapid
differentiation between for instance members in the family of pestiviruses may be crucial as
virulence and pathogenicity vary substantially [52].
An impressive technology development has occurred in the field of molecular biology
together with a surge in interest for discovery-driven rather than hypothesis-driven research.
The result has been the advent of a number of “Omics”, such as Genomics, Proteomics,
Transcriptomics, Metabolomics, and many other [53]. A common denominator is the
approach of attempting to include in the analysis a very large proportion, if not all, of known
parameters from a particular set. While genetics could be said to aim at analyzing and
interpreting aspects of single or small sets of genes, genomics endeavors to take on whole
genomes, i.e. all genetic material a cell or individual carries. A landmark in the field of
genomics was the successful sequencing of the full human genome [54-55], and novel

17
Jesper Gantelius
sequencing technologies now provide powerful tools for researchers to investigate such
topics as gene expression profiles related to disease [56], promotor function [57], genetic
association [58], chromatin dynamics [59, 60], heterosis [61] and epigenetics [62].
While genomics explores the diversity, evolution and phenotypic link of genomes,
transcriptomics seeks to assess the distribution of mRNA in cells and tissues. mRNA is
produced from genomic DNA by means of the protein complex RNA polymerase, which
reads the template DNA sequence and synthesizes a corresponding RNA molecule. Further,
RNA splicing is employed by cells to further process the mRNA into its final form. A central
function of mRNAs is to provide accessible templates for protein translation in the cell
cytoplasm. Due to various regulatory mechanisms, however, there appears not to exist a
simple relation between the amount of mRNA and protein, and several studies have
demonstrated these discordances [63, 64]. Further, new roles of transcribed RNAs in
regulation of cellular processes [65], enzymatic reactions [66] and other cellular functions
[67] are constantly being identified.

18
Novel diagnostic microarray assay formats – towards comprehensive on-site analysis
Ribosomes translate mRNA into peptides and proteins. After translation, proteins may be
further decorated by for instance glycosylation and phosphorylations through what is called
post-translational modifications [68]. Due to differential transcription and expression of
genomic DNA by means of for instance transcription factors and DNA methylation,
alternative mRNA splicing, regulated mRNA degradation and posttranslational
modification of proteins, the proteome, that is the total distribution of proteins in a certain
domain, is highly variable [69].
The number of unique non-redundant human proteins is currently estimated to be around
23 000 [70], with proteins exhibiting an amazing diversity of dynamical structures and
biological functions. Proteomics concerns the study of the proteome and its implications on
for instance physiological function and disease. While genetic sequencing technologies and
high density DNA microarrays have enabled researchers to study entire genomes and
transcriptomes [71], analyzing a multitude of proteins simultaneously have been far more
challenging primarily due to proteins being much more heterogeneous in composition,
structure and abundance than nucleic acids. However, various efforts towards
comprehensive proteomic analyses have been made or initiated, employing for instance 2-
dimensional gel electrophoresis, mass spectrometry, or affinity-based methods such as
immunohistochemistry or protein microarrays [72-75].
2.3 Performance of biomarker sampling and analysis
While important progress is being made in the comprehensiveness of single analyses in
terms of the number and detectable levels of biomarkers, the biomarker pattern in a sample
(except for genetic patterns) naturally varies depending on when, how, and from what
source the sampling was made. It is therefore of essence that extraction and processing of
the sample is made consistently, as different sampling sites may exhibit different expression
profiles [76].

19
Jesper Gantelius
Samples for bioanalysis can be extracted from biopsies, blood, saliva, cerebrospinal fluid,
sweat, urine, semen, stool, skin flakes etc [77], although sampling close to a clinically
interesting anatomical site may be necessary if biomarker levels resulting from for instance
tissue leakage are too low for reliable measurement from for instance blood or urine [78].
However, performing punctuations or biopsies can require advanced skills and equipment
as well as more extensive subsequent processing than for instance sampling blood or saliva.
Further, while it has little impact on the sample analysis in itself, from a patient’s point of
view important aspects of the procedure can be the extent of invasiveness, discomfort, as
well as the time until the results from the analysis are available [79]. These aspects need
then be balanced with the performance of the assay in order to find the most useful
procedure for a specific purpose and context.
At the heart of molecular diagnosis lies the assay performance, which can be summarized by
four parameters: sensitivity, specificity, dynamic range and variability [80]. A useful method
must have a sufficient level of all four parameters. There is some disambiguation regarding
sensitivity and specificity, as they are sometimes defined in circumstances relating to
diagnostic accuracy, and sometimes to analytical accuracy. In the former case, sensitivity
and specificity relates to how well a test succeeds in prediction of a condition or state,
whereas in the latter case, the terms are used to illustrate for instance how few molecules can
be recognized in a sample volume, or how much background signal is generated. In
molecular diagnostic assays, high analytical accuracy may result in high diagnostic accuracy,
as a very sensitive assay may discover presence or levels of low abundant biomarkers, and
may thus be used to determine disease status. However, recognizing the presence of a
biomarker provides little information if it is not certain if it was the sought biomarker or
non-specific interactions that elicited the response. Thus, specificity can be used a measure
of the extent to which the response results from only the correct source.

20
Novel diagnostic microarray assay formats – towards comprehensive on-site analysis
A binary presence/no presence of a biomarker given a certain threshold is sometimes
enough information for classification of a disease state. In other cases, different levels or
concentrations of a certain biomarker can correspond to different states, and the analysis
method then needs to be capable of surveying a sufficient range. The interval within which a
given method can reliably estimate the biomarker concentration is called the dynamic
range.
With regards to diagnostic assays, sensitivity and specificity are commonly described in
terms of the number of true positives (TP), false positives (FP), true negatives (TN) and
false negatives (FN). These numbers arise in comparison with a reference method, and the
wording of “true” and “false” can therefore be misleading in cases where the reference
method is not completely accurate. The sensitivity is defined as TP / (TP+FN), and the
specificity as TN / (TN+FP). Thus, the sensitivity is the fraction of tests defined positive
by the reference method that are also estimated to be positive by the method under
investigation. Similarly, the specificity is the fraction of tests defined as negative by the
reference method that are also estimated to be negative by the investigated method.

21
Jesper Gantelius
Receiver-operating-characteristics (ROC) is employed to analyze the performance of a
method relative to the reference when the threshold that is used to separate positive from
negative results is varied. A ROC-curve can show the trajectory of a method comparison in
terms of sensitivity and specificity when the threshold level is changed (figure 2.3, adapted
from paper III).
The ROC-curve is useful, as it displays simultaneously how well a method would perform
given the preference of high sensitivity (few false positives), high specificity (few false
negatives), or a combination of those. For instance, when estimating a result that is in reality
negative to be positive would result in serious consequences such as unnecessarily putting
down a farm animal or initiating risk-associated treatment, it may be wise to aim for
improved specificity, and consequently lower sensitivity, particularly if the rate of false
positives is currently high. On the other hand, if the consequence of overlooking a positive
sample (a false negative) can result in risk of a widespread epidemic, or if the risks of
Figure 2.3 ROC-curve, where each circle represents one choice of threshold valueacting on a decision score. The three filled circles suggest thresholds that providethe best choice for sensitivity, specificity or least incorrectly classified cases,respectively [81].

22
Novel diagnostic microarray assay formats – towards comprehensive on-site analysis
treatment are insignificant, a high specificity may not be the best choice, and the threshold
should be set to reach a high sensitivity rate.
The area under the curve (AUC) is a combined measure of the sensitivity and the specificity
for all threshold values in ROC-analysis. AUC is as the name implies calculated by
integrating the total area under the ROC-curve, and ranges from 0 to 1, where a method
that does not perform better than chance scores 0.5 and a method that is perfectly
concordant with the reference method scores 1.0. Typically, AUC values above 0.8-0.9 are
considered to represent good concordance [80].
While sensitivity, specificity and dynamic range can suggest what biomarkers may be
successfully analyzed, an indicator of variability is important as it projects the potential
usefulness into a more realistic estimation of what information can actually be acquired
from the resulting data. The percentage coefficient of variation (%CV) can be employed to
represent the variability of an assay. The number results from the ratio between the
standard deviation or standard error and the average signal intensity. To illustrate, if it is
known that a difference in concentration of a biomarker of 10 % can differentiate the
severity of a disease state, and the estimated variability in terms of %CV of the assay in this
range is 20 %, the assay may not reliably be employed to yield the sought information, even
if the sensitivity, specificity and dynamic range are sufficient for the purpose.
2.4 Technology platforms for biomarker analysis
Detection methods for biomarker analysis can be categorized as being dependent upon
molecular recognition, or not. The former category employs affinity reagents that may
recognize the biomarker for the analysis, whereas the latter category identifies and analyzes
biomarkers through physico-chemical properties, such as charge, size, hydrophobicity or
molecular composition.

23
Jesper Gantelius
2.4.1 Non-affinity based methods for biomarker analysis
Common techniques used to determine presence and levels of protein biomarkers are for
instance mass-spectrometry methods, particularly in the form of Matrix-assisted
desorption/ionization time-of-flight mass spectrometry (MALDI-TOF) [82],
chromatography [83, 84] and gel electrophoresis [85]. In MALDI-TOF, a sample is mixed
with an organic substance that protect biomolecules from unwanted fragmentation when
fired upon by a focused laser beam. Ions produced by the laser pulse are accelerated by an
electric field, and receive a terminal velocity proportional to the mass and the charge of the
fragment. After a distance, the molecules reach a sensor that records each impact, and the
time of flight can thus be determined. A spectrum of the estimated mass/charge ratios is
generated, and by comparing the spectrum with databases of known substances,
identification of sample constituents can be made.
In chromatography, separation and isolation of a substance relies on its partition between at
least two phases. For instance in the case of size-exclusion chromatography, sample is
passed over a packed column of porous microbeads. Small molecules can enter the porous
beads, and will be retained longer in the column, whereas large molecules do not enter the
porous beads and exit the column more quickly. Ion-exchange chromatography is used to
separate analytes upon electrostatic charge. Here, column beads exhibit a certain surface
charge, and consequently attract oppositely charged molecule and repulse like-charged
molecules. By changing the pH of the sample solution or the salt content, the process can be
controlled. In hydrophobic interaction chromatography, the microparticles have a
hydrophobic surface, thus attracting uncharged molecules.

24
Novel diagnostic microarray assay formats – towards comprehensive on-site analysis
Gel-electrophoresis is a common laboratory technique for analysis of complex samples and
is used for instance to determine if polymerase chain reaction (PCR) products are of the
expected size and purity, or to estimate size and purity of purified recombinantly expressed
proteins. In the case of protein analysis, typically the sample is mixed with a detergent
substance that veils the sample molecules in an even electric charge. Subsequently, the
sample is placed at one end of a solid yet flexible porous cross-linked polymer gel and an
electric field is applied by means of electrochemical reactions on the ends of the gel. The
electric field induces a force on the charged molecules, allowing them to migrate through
the gel. As the gel acts as a sieve with the property of retaining larger molecules longer, a
separation depending on size occurs. The separated species can be visualized by means of a
variety of different chemical agents, such as colored or fluorescent dyes.
2.4.2 Immunoassays for affinity-based biomarker analysis
In 1960, Yalow and Berson employed polyclonal antibodies in the detection of
concentrations of human insulin by means of a competitive assay between human insulin
and radioisotope-labeled insulin purified from beef [86]. Thus, the radioimmunoassay
(RIA) was invented, which later won Rosalyn Yalow the Nobel Prize in Physiology or
Medicine in 1977.
Further progress was made by Wide and coworkers in developing the first noncompetitive
immunoassay, in the form of the radioallergo sorbent test (RAST, [87]). The technology
was later adopted and commercialized in 1974 by Pharmacia Diagnostics (now Phadia AB),
and was further developed into the present form (ImmunoCAP), which is widely used in
commercial allergy tests.
In 1971, molecular amplification was added to the immunoassay framework when Engvall
and Perlmann [88] presented the enzyme-linked immunosorbent assay (ELISA). Here,
human IgG coupled to the enzyme alkaline phosphatase was allowed to compete with
native IgG for anti-IgG binding sites on a cellulose surface. The enzyme has the ability to

25
Jesper Gantelius
catalyze the hydrolysis of the substrate nitrophenylphosphate (NPP) into p-nitrophenol,
which displays a yellow color and a measurable shift in absorbance in the 400 nm
wavelength. Other enzymes have also been found to be useful in ELISA assays, among
which the most common is horseradish peroxidase that can catalyze the conversion of
chromogenic substrates into colored products, or chemoluminescent substrates into
product and emitted light. Due to the issue of radioactivity exposure in the case of the
radioisotope-based based immunoassays, ELISA assays have gaining relative popularity and
advantage. Further, the performance of ELISAs improved during the 1980s, coming to
match the sensitivity of RIAs.
Finally, in the Western blot procedure [89], gel electrophoresis is employed in a first step to
separate biomacromolecules upon size, after which a perpendicular electric field transfers
the sample constituents from the gel onto a flat substrate, often nitrocellulose. When
collected onto the new substrate, proteins can be detected by means of labeled affinity
reagents, such as fluorescent detection antibodies.

26
Novel diagnostic microarray assay formats – towards comprehensive on-site analysis
2.4.3 Lateral flow immunochromatography
Lateral flow assays are currently the most widely applied assay systems for on-site diagnosis
of disease and have been employed at least since the 1960s [37]. Here, a line of affinity
reagent is typically deposited on a paper-based substrate, and sample is passed through the
device by means of capillary flow. Biomarkers from the sample attach to the line of affinity
reagents, and can be visualized for instance by applying visualization reagents in a
subsequent step (figure 2.4a).
Lateral flow assays are generally relatively easy to perform which makes them accessible
with little or no prior training or additional equipment. The assay time can often be
performed in less than half an hour, or quicker depending on the substrate. Lateral flow
assays can typically be produced from inexpensive components, without moving parts or
external actuation. When combined with visible dyes such as gold or colored polystyrene,
the assay can be highly portable and easy to interpret. While performance of lateral flow
assays in terms of sensitivity, dynamic range and variability may be lower than that found in
laboratory assays, the requirements need to be determined in each individual case [32].
Figure 2.4a A typical lateral flow device, with the differentconstituent parts indicated [37].

27
Jesper Gantelius
2.4.4 DNA and RNA analysis
The ability of nucleic acids to hybridize single strands of DNA or RNA into double-
stranded structures, enabled by the formation of hydrogen bonds between compatible
nucleotides in the nucleic acid back-bone, have also been extensively employed in analyzing
genetic features in cells and tissues. Hybridization is commonly used for instance in
fluorescence in-situ hybridization (FISH) and related techniques where a stretch of single-
stranded DNA or RNA attached to a fluorescent label is used to specifically probe
chromosomes. When the target DNA stretch on the chromosome is known, the
corresponding probe can be designed using the target probe as an inverted template.
In the field of DNA-analysis, PCR discovered by Kari Mullis in 1984 [90] has become a very
well established and useful technology that allows the amplification of a certain stretch of
DNA from a sample by means of the enzyme DNA polymerase and a complementary strand
that hybridizes through perfect base pair matching. Although PCR is a very specific and
sensitive technique, it has been shown to be hard to multiplex [91, 92], and usually requires
advanced thermocyclers to be run.

28
Novel diagnostic microarray assay formats – towards comprehensive on-site analysis
2.4.5 Microarray assays for multi-parameter analysis
Microarrays have become powerful tools for biochemical analysis, primarily for their
inherent ability for highly multiplexed analysis (figure 2.4b), but also because the small
capture surfaces of the microspots can yield more sensitive and reliable data since they do
not disturb the ambient analyte levels (see section 3.3). Another feature that distinguishes
microarrays from running several single-analyte assays is the advantage of eliminating the
increased variability resulting from preparation and handling of a large number of aliquots
of a sample.
Assays involving microarrays are typically run in “forward” (sandwich) or “reverse” (direct)
mode. In forward mode, capture agents are immobilized on the array spots, and sample is
loaded on the array for analyte capture. Subsequently, a secondary affinity reagent is added
to visualize caught analytes. In reverse mode, the microarray spots themselves contain the
sample to be analyzed, and thus it can be enough to add one round of labeled affinity
Figure 2.4b Example of an approximately 37500 probe spotted oligo microarray with enlarged inset to show detail. Here, competition between amplified patient cDNA (green) and reference DNA (red) results in quantifiable relative expression patterns.

29
Jesper Gantelius
reagents for visualization. While reverse assays have the potential to analyze a very large
number of samples at once, typically presence of only one analyte can be analyzed on one
array, and sensitivity is very limited in comparison to forward assays [93].
The first successful microarray assays were constructed for DNA analysis, and originated
from the so-called southern blotting technique where DNA molecules are deposited on a
surface and used for specific capture of complementary strands. DNA microarrays are in
principle a multitide of concurrent miniaturized southern blot assays. For more than a
decade DNA microarrays have been extensively employed mostly for large scale gene
expression analysis, but many other applications such as SNP genotyping or mutation
analysis have been demonstrated [94].
Microarrays can be separated into planar arrays and suspension bead arrays. In the case of
planar microarrays, affinity reagents are deposited on a glass surface in a grid pattern. A
liquid dispensing robot deposits a certain volume, often less than 1 nL, at a certain position
on the glass substrate, which produces a “spot” on the surface. The procedure is repeated to
make a larger pattern of a number of affinity binders, with a sufficient number of replicate
spots. During analysis, the array is often enclosed by a masking grid, so that in effect a well is
formed with the array at the bottom. The sample is applied, and the following steps are very
similar to those of ELISA. Advantages of planar microarrays are that only small volumes of
sample and affinity reagents are needed, and that levels of many biomarkers can be
investigated in one experiment. Unfortunately, microarray substrates are often expensive,
printers are bulky and expensive, printing may be time consuming, and skilled staff needs to
perform the experiments.
In suspension bead array assays, microbeads are given unique identities by color-coding, in
contrast to planar arrays where identity is inferred from position. The microbeads are
labeled with affinity reagents, and a small volume containing a large number of uniquely
coded beads can then be added to a sample volume. A second antibody labeled with a

30
Novel diagnostic microarray assay formats – towards comprehensive on-site analysis
fluorescent beacon and with affinity towards the first can be used to reveal biomarker
binding to the beads, and fluorescence is detected by funneling the beads through a thin
capillary in which they can be analyzed with a laser detector [95, 96].
A substantial advantage with suspension bead arrays is the convenience of assembling
arbitrary array compositions from pre-coupled bead populations simply by pooling aliquots
from those populations. Further, it is often possible to include many more replicate beads
than is feasible with replicate spots on planar arrays, resulting in more reliable data
processing [97]. However, the need for a laser scanning, flow-sorting device introduces
limitations concerning portability and applicability in contexts with limited resources.
Protein microarrays have in general not experienced the same success as DNA microarrays,
for several reasons. In DNA microarray assays, hybridization depends on such factors as
buffer condition, temperature, the length of the hybridizing strands and the
match/mismatch percentage. This generality has allowed researchers to develop
bioinformatic tools that guide the design of high-quality capture probes, and makes the
process of constructing functional DNA microarrays rather straight forward. In the
construction and optimization of protein microarrays, additional parameters needs to be
taken into account.
First, unless the different proteins to be patterned on the substrate are structurally very
similar (for example antibodies, or antibody fragments), the unique physicochemical
property of each protein will make the optimization process of patterning much more
challenging than with DNA arrays, where it is commonplace to use DNA strands with a
derivatized end suitable for microarray patterning. Second, while a rather specific buffer
condition and a certain temperature can be suitable for a wide range of DNA-DNA
hybridizations, the interaction characteristics of protein-protein interactions may vary
greatly. Third, the generation of sensitive and specific affinity reagents for protein
biomarker analysis is challenging. Different approaches are routinely used, such as

31
Jesper Gantelius
polyclonal antibody generation through immunization and bleeding of animals [98] or
selection from combinatorial libraries [99]. In the case of autoimmunity and allergy
analysis, antigens/allergens need first to be identified and purification from natural sources
or revealed through bioinformatic discovery followed by cloning and recombinant
expression [2, 100].
2.4.6 Signal amplification and detection strategies
A widely employed molecular label for immunoassays today is any of a multitude of
commercially available fluorophores [101]. While the use of fluorescent labels for
immunoassays has been demonstrated to enable highly sensitive detection of protein
biomarkers in a wide variety of applications, such as cell confocal microscopy [102],
Western blot [103], microarray analysis [104], fluorescence activated cell sorting (FACS)
[105], and immunohistochemistry [106] advanced laser illumination and imaging
equipment is often needed for excitation and detection.
As the signal to noise ratios resulting even from labeled approaches can be low in affinity
based assays, many strategies for signal amplification have been proposed. Such efforts
include for instance incorporation of gold and silver nanoparticles [107-108] or
microparticles [109, 110, 52, 81] that can enhance the signal through visible color,
incorporated fluorophores, mass, charge or magnetization.
Among other innovative label-based techniques directed at providing an amplified signal
are for instance immuno-PCR [111], rolling circle amplification [112-113], proximity
ligation [114] and the bio-barcode assay [115], all of which employ generation of an
increased number of DNA molecules in the case of a formed affinity interaction between
the affinity ligand and the analyte.

32
Novel diagnostic microarray assay formats – towards comprehensive on-site analysis
2.4.7 Label free detection methods
In label-free detection methods, a physico-chemical property of the bound analyte, such as
mass or charge, is the basis for signal generation. Biosensors based on for instance surface
plasmon resonance, quartz microbalance, ellipsometry or nanowire-detection can recognize
the presence of bound material on a surface and modulate it into an electronical or optical
signal that can be detected [116-118]. While such methods are valuable particularly for
studying dynamic events where label-based methods often are limited to end-point analysis,
the sensitivity and convenience of label-based approaches currently makes them the most
common method of choice for biomarker analysis.
2.5 Affinity ligands
In order to identify presence or levels of biomarkers with the help of affinity ligands, the
ligands employed need to be able to recognize the target biomarker with sufficient
sensitivity (they need to be able to bind the target), specificity (the ligand should bind to as
little else except the target as possible), and reliability (the binding properties should be
stable to the environment where the binding is to take place, and should be robust to
normal variations in the environment).
Several routes to identifying useful affinity ligands have been explored. For DNA and RNA
targets, knowledge about the base-pairing process that produces the helical double strands
can be used to construct complementary single strands. While sensitivity is often not an
issue, comprehensive bioinformatic tools may be needed in order to make the recognition
also specific [119].
Known interactions in play in biological processes can be exploited as in the case with
antibodies. Antibodies, or immunoglobulines, are produced by plasma B cells, after a
process of generation of population diversity by means of genetic recombination and
elevated rate of point mutations. Plasma B cells can live several weeks and produce as many
33
Jesper Gantelius
as hundreds to thousands of antibodies per second [120]. Circulating antibodies may help
protect from pathogens by stimulating the complement system, by crosslinking and thus
blocking the movement of bacteria, or through attracting effector cells that subsequently
recognize and destroy the invader.
The immune responses in higher organisms that generate populations of highly specific
antibody proteins towards foreign material can be used to generate affinity ligands. Such
specific polyclonal antibodies are often produced by injecting a mixture of the biomarker
into host mammals such as rabbits, goats, or even camels, sometimes including
immunological adjuvants that can elevate the production. When the host animal has raised a
sufficient amount of antibodies in response to the immunogen, the animal is tapped for
blood, followed by isolation of the antibodies from the blood by means of some purification
strategy [121, 98].
Sensitivity and specific binding can be limited in the case of polyclonal antibody generation,
since the pool of antibodies raised towards an antigen consist of a wide variety of individual
proteins, where variability exist in the recognized epitope and the structural solution for
recognizing a particular epitope [122]. Affinity purification efforts can however
substantially decrease the variability in a polyclonal antibody pool [70].
Another alternative in achieving mono-specific affinity reagents is the generation of
monoclonal antibodies. Briefly, a cancer cell line is fused to a population of antibody-
producing plasma B cells that had previously been raised in response to a particular antigen.
The resulting cell line is called hybridoma, and has indefinite life span. From the mixture of
hybridoma cells, a subsequent selection step takes place, where only cells found to produce
antibodies with the desired properties are allowed to remain in culture. From these clones,
larger cultures can be established that continue to yield large quantities of the unique
antibody molecule.

34
Novel diagnostic microarray assay formats – towards comprehensive on-site analysis
Antibodies are often used in biomarker analysis, but when the antibodies themselves are the
biomarkers of disease, the antigens that generate them may act as affinity ligands. In the case
of diagnosis of infectious diseases, antigens stemming from purification from a native source
[123], or recombinant sources [124] may be employed.
A further example of an existing biological mechanism that can be employed for acquisition
of affinity ligands is the interaction between Staphylococcus aureus Protein A and
immunoglobulins [125], or between variants of the avidin protein that is normally
deposited in the egg-whites of birds, reptiles and amphibians and that associates very
strongly to biotin, a small molecule that is also known as vitamin B7 [126]. The interaction
between avidin and biotin is the strongest known non-covalent interaction and has become
a standard tool in molecular biology and biochemistry, where the biotin molecule can for
instance be chemically attached to all proteins in a sample, and when a sought target protein
has been captured by an affinity ligand, the biotin tag can attract avidin/streptavidin linked
to a fluorescent or enzyme label that allow visualization of the binding event.
Combinatorial approaches can be employed in construction of so-called libraries containing
variations of affinity ligands. Here, the structure and function of a ligand molecule can be
evolved by varying all or a selected number of its constituent building blocks with little or no
premeditated choice from the point of view of the researcher, who may then perform
selection procedures for singling out those variants that had developed the desired
characteristics [127]. The original molecule may be chosen due to some intrinsic properties
that would be advantageous to retain also in the evolved molecule, such as size, charge,
stability when exposed to fluctuating or extreme chemical environments, or original affinity
to some other binding partner.

35
Jesper Gantelius
A multitude of molecules have been chosen for directed evolution, resulting in libraries of
for instance antibody fragments [128], affibody molecules [129], ankyrin repeats [130],
anticalins [131], and aptamers [132]. Larger libraries in general present a higher likelihood
of generating the desired properties in the distribution of evolved molecular variants,
although the affinity distribution of a population varies according to the choice of library
[133]. Further, selection strategies are presently time and labor consuming. Thus,
substantial efforts goes into research of selection strategies and different expression systems,
such as staphylococcal display [122], phage display [134], and ribosome display [135], only
to name a few.

36
Novel diagnostic microarray assay formats – towards comprehensive on-site analysis
3 Theory for present investigation
3.1 Dynamics of affinity interactions
When an affinity ligand [A] and its target molecule [B] are presented to each other, the law
of mass action can be employed to estimate the rate of formation of complex [AB]. Two
processes take place simultaneously, association (Ra) and dissociation (Rd). The rate of
change of complex formation is the sum of the two processes, as can be seen in equation 3.1.
ABkBAkRRtAB
dada Eq. 3.1
ka [M-2m6s-1] and kd [s-1] are the kinetic on/off, or association/dissociation- parameters. At a
given concentration of affinity ligand and target molecule, a higher kinetic on-rate will
induce a more rapid formation of complex, and a higher kinetic off-rate will more rapidly
break up the complex into its constituent parts.
Sensitivity and specificity between interaction partners in a physiological setting are evolved
in relation to the function and fitness of the organism. Therefore, higher affinity, rapid
binding kinetics, and high specificity, while often beneficial in affinity ligand assays are only
found in a subset of naturally occurring interactions [74].
The dissociation constant Kd [M], is equal to the quotient kd / ka as well as to [A][B]/[AB]
when the system has reached equilibrium. The magnitude of the kinetic on-rate, which
typically ranges from 102 to 105 [M-2m6s-1] for antibodies [136] may be hard to intuitively
grasp, while the kinetic off-rate on contrast is a rather straightforward measure of a complex’
stability. If the kinetic off-rate is 10-2 [s-1], one in a hundred complexes would spontaneously
dissociate in one second.

37
Jesper Gantelius
To illustrate, avidin and streptavidin exhibit equilibrium constants of around 6*10-16 M for
avidin and 4*10-14 M for streptavidin in the reversible binding of biotin [137]. For the
streptavidin-biotin interaction, the kinetic on-rate has been estimated to be approximately
5*106 [M-1s-1], and the kinetic off-rate 2.8*10-6 [s-1]. The fast on-rate in combination with
the extremely slow off-rate results in an interaction that forms quickly and that is very stable
over time. This fits the function of streptavidin as employed by the bacterium Streptomyces
avidinii in binding and thus inactivating biotinylated enzymes needed by other bacteria.
Here, the bound state is clearly the most advantageous for the bacterium that is supplying
the protein, suggesting that fitness and function has driven the development of the
described set of affinity rate constants. In contrast, proteins that are involved in transport
and release of molecular cargo, such as calmodulin and other calcium binding proteins
typically exhibit simultaneously high on-rate and high off-rate [138]. Further, low-affinity
interactions may provide cohesion and stability to molecular networks, analogous to a semi-
specific glue [139].
3.2 Diffusion, convection and active transport
While the kinetic on- and off-rates provide insight into how binding partners interact at a
particular coordinate, the mass transport to and from sites of interaction is governed by
diffusion, convection and active transport of the species.
When considering the transport of analyte in an arbitrary geometry, equation 3.2 can be
employed.
TwAuADtA
AA )( Eq. 3.2
Here, DA is the diffusion coefficient of the analyte, u is the ambient convective flow vector,
T is a general force field, such as an electric field, gravitational field, magnetic field etc, and
wA is the analyte’s intrinsic susceptibility to the force field.

38
Novel diagnostic microarray assay formats – towards comprehensive on-site analysis
Thus, the change of concentration of analyte in space and in time (assuming no reactions
happen in the bulk) depends on a) diffusion b) convective transport c) forces arising on the
molecule due to external fields that the analyte or particle is susceptible to.
In static environments, the diffusion of analytes to capture surfaces can be a limiting factor,
which implies an advantage for microcompartment or microchannel assays with small
geometries and short diffusion times. In for instance mixed systems and lateral flow assays,
the convective flow controls the transport of analytes to the capture surface and diffusion
plays a limited role. In electrophoresis, an electric field induces a force upon charged
molecules and particles that results in a movement. Further, it has been demonstrated that
electrophoresis can be employed in for instance transporting proteins to microarray
surfaces for accelerated binding [140].
3.3 Capture surface considerations for immunoassays
In well-based immunoassays employing such techniques as ELISAs or planar microarrays,
the capture surface is typically immersed in a comparatively large sample volume, and target
molecules present in the sample need to be transported to the capture surface by means of
mixing, diffusion or force-field induced transport. While mixing may substantially decrease
the time it takes for analytes to reach a capture surface, the time for sample incubation
typically still needs to last for hours to reach equilibrium, particularly if kinetic off-rates are
small in relation to on-rates.
Unless the assay of choice presents time-resolved information about the formation of
complex, considerations need to be made regarding whether or not the affinity interaction
can be predicted to reach equilibrium within a given time frame. In case equilibrium is not
reached, the assay time has to be well controlled to avoid introducing variability when
repeating the assay. The alternative of waiting for equilibrium may be very time-consuming
when analyte concentrations are low and may not be a realistic option for field tests.

39
Jesper Gantelius
The relation between the number of analytes present in the sample and the number of
affinity ligands on the capture surface is important, an idea that has been promoted by Ekins
[141] and others. While a large capture surface with a high density of affinity ligands will
decrease the average residence time of an analyte molecule in the sample and thus increase
the complex formation rate, the results from such as system may be difficult to interpret for
several reasons. First, if the capture surface can harbor all analyte molecules in the sample
volume, with sufficiently strong and rapid affinity interactions the surface will appear like a
perfect sink. Second, the capture surface will deplete a volume of the sample closest to the
surface and for completely unmixed systems, the depletion zone increases outwards linearly
with time, with diffusion being the only determinant of the rate of complex formation.
Before reaching equilibrium, such a system may be sensitive to agitation and convection due
to for instance external heat sources. While controlled mixing can create a thin and stable
depletion zone [142], thus making the complex formation rate more deterministic, a large
and high-density capture surface means that the number of formed complexes are created
over a large area, resulting in a low signal intensity per unit area.

40
Novel diagnostic microarray assay formats – towards comprehensive on-site analysis
Ekins argued that capture surfaces should be so small that their capacity to extract analyte
would be insignificant in relation to to the composition of the total sample volume (figure
3.3). Small capture surfaces as suggested by Ekins more rapidly enters an equilibrium with
the surrounding environment, which facilitates the assay procedure substantially since the
exact time span of the assay is then less important.
Figure 3.3 Ambient analyte theory. While the total amount of boundmaterial at equilibrium may increase with a larger capture surface, the signaldensity which often is what is measured, decreases. Therefore, small capturesurfaces are generally favorable for immunoassays [72].

41
Jesper Gantelius
In lateral flow assays, capillary force drives the sample volume from one end to the other of a
porous substrate matrix, followed by the application of a visualization agent in the form of
gold or polystyrene micro or nanoparticles. While the sample volume is typically fixed in
well-based assays, in the case of lateral flow the bulk sample is being replenished constantly
while there is a sample flow. Since binding of sample analytes do not influence the ambient
analyte concentration in lateral flow assays, the rate of complex formation will be steady as
long as sample is flowing and before the capture surface begins to saturate or the
equilibrium state is appraching.
3.4 Microbeads as mobile affinity reagents for microarray analysis
3.4.1 Microparticles in biochemical and microfluidic assays
Polymer microparticles are commonly used as solid support in biochemical assays. Many
benefits exist such as increased surface to volume ratio when compared for instance to
cylindrical channels, monodispersity, flexibility in incorporating microparticles in various
geometries, possibility to couple biomolecules to the surface using liquid phase chemistry
and convenient incorporation of fluorophores, just to name a few. Polymer microbeads that
are neutrally charged and exhibit no magnetic susceptibility can still be transported in
different ways. For instance, the no-slip condition acting on any immersed surface will result
in a viscous friction that carries the particle along with the convective field [143]. Further,
any microbead may also be moved by means of for instance optical tweezers [144], whereby
application of focused laser beams may result in precise force actuation and movement.
Another technique that can be used to induce a force on any dielectric particle is
dielectrophoresis. In dielectrophoresis, a non-uniform electric field produces a net
separation of charges in the particle, which then makes it susceptible to an electric field
[145]. Particles that have or acquire a net surface charge may then be moved through a
medium by means of a constant or alternating electric field. However, electrophoretic
modes of actuation usually produce electrochemical reactions and ionic flow in the

42
Novel diagnostic microarray assay formats – towards comprehensive on-site analysis
medium, and the fields and forces may be sensitive to the composition of the medium
[146].
3.4.2 Mobility of superparamagnetic microparticles
Superparamagnetic microparticles have been employed in biochemical assays at least since
the beginning of the 1980s [147]. The most common application has been in protein
purification, due to the ease with which affinity-labeled beads can be suspended in and
incubated with a sample, and subsequently collected magnetically on the bottom of for
instance a test tube when exchanging the supernatant for fresh buffer during wasing steps. In
magnetic-activated cell sorting (MACS), superparamagnetic beads have also been
demonstrated to bu useful as solid support for the specific enrichment of cell populations
[148].
Commercially available superparamagnetic particles typically consist of small ferro- or
ferrimagnetic nanocrystals embedded in a polymer material. In the nanocrystals, the
intrinsic magnetization moment changes direction very rapidly when no external magnetic
field is present, making the crystals appear unmagnetized. However, when an external
magnetic field is applied, the magnetic moments of the nanocrystals tend to align to the
magnetic field lines. Depending on what is the superparamagnetic material, how large and
how many nanocrystals are embedded in the polymer frame, the microbead will acquire
certain magnetic susceptibility and magnetization MB in response to external magnetic
fields. For sufficiently strong magnetic fields (H>70 kA/m), the magnetization of a
superparamagnetic microparticle can reach saturation. For MyOne magnetic microbeads,
the saturation magnetization under the influence of strong magnetic fields becomes
approximately 43 kA/m, as noted by the supplyer (Invitrogen).

43
Jesper Gantelius
The magnetic field used to induce a net force on magnetic microbeads can be generated
from either permanent magnets or electromagnets. The field from electromagnets occurs
due to the movement of electrical charges in a wired coil, and usually a core of
ferromagnetic material is placed in the center of the coil to enhance the magnetic field
strength. While the field from electromagnets disappears when the current is removed,
permanent magnets made from stably magnetized materials can typically not be “switched
off”. Solid permanent magnets are often made from ferro- or ferrimagnetic materials, with
rare-earth materials such as Neodymium or Samarium being common.
The force that results on superparamagnetic microparticle under the influence of an
external field depends on the volume of the particle, the magnetization, and the gradient of
the magnetic induction, as shown in Eq 3.4a [140]
BVMF BBmag
In the case of application of a flat or disc-shaped permanent neodymium magnet of
sufficient size, it can be assumed that the magnetic field will at distances <10 mm from the
magnetic bead be large enough for saturation of the bead magnetization. Further, with an
average value of the gradient of the magnetic induction of 50 Tesla (T)/m, the magnetic
force can be calculated on individual beads. For MyOne beads, the force would amount to
approximately 1 piconewton (pN), using these input parameters.
Eq. 3.4a

44
Novel diagnostic microarray assay formats – towards comprehensive on-site analysis
When a particle that is immersed in a liquid medium is subjected to a net force, given
sufficiently high viscous relative to inertial conditions, the Stokes relation can be employed
to calculate the terminal velocity from the frictional drag force according to eq. 3.4b.
vDFdrag 3 Eq. 3.4b
In this relation, η is the dynamic viscosity, D is the diameter of the bead, and Δv is the
velocity of the bead relative to the ambient medium. When equating the magnetic force
with the frictional drag force, the terminal velocity of the particle can be found. In table 3.4,
the predicted force and the terminal velocities of a range of superparamagnetic particle sizes
commercially available for biochemical analysis are shown.
The saturation magnetization is assumed to be the same for all beads, 43 kA/m. In the case
of a 1 μm MyOne bead being actuated by a magnetic force of 1 pN to move through a water-
like substance, the terminal velocity is estimated to approximately 60 μm/s. However, as
was shown by Sinha and cowerkers [150], sufficiently high suspended concentrations of
MyOne particles will form agglomerates when exposed to a strong magnetic field.
Table 3.4 A range of magnetic microbeads are shown, with predicted magnetic forcesfrom a typical experimental setup and terminal velocity in water.

45
Jesper Gantelius
An agglomerate of magnetized particles that do not experience an external magnetic field
gradient will develop towards a spherical shape. However, if such an agglomerate is moved
due to a magnetic field gradient through a viscous stationary medium, friction forces tend to
remodel the agglomerate towards a more streamlined shape, resulting in a collective
movement of beads that is substantially more mobile than individual beads. Thus, unless
the magnetic microbeads are suspended sufficiently sparse, bead-bead interactions will
change the migration properties, and the collective movement is likely complicated to
describe reliably [151].

46
Novel diagnostic microarray assay formats – towards comprehensive on-site analysis
3.4.3 Magnetic bead decoration and force-probing of microspots
Application of affinity-labelled microbeads for microarray analysis has been presented as an
alternative to fluorescence-based detection [140, 110, 52, 81]. The magnetic force serves as
an actuator for bead migration to the array microspots, as well as for removal of unbound or
weakly bound beads. An example of a magnetic-bead developed array is shown in figure
3.4a, and a computer-generated rendering of magnetic microbeads binding to a microspot
in figure 3.4b (next page).
Figure 3.4a A magnetic bead-developed microarray (top left), with zoom in of the array pattern (top right). In the bottom left sub-plot, a microscope image of a bead-developed microspot is presented. Here, a mixture of 1 μm and 3 μm sized beads have been bound to the array to visualize the difference in bead size.

47
Jesper Gantelius
Figure 3.4b Computer rendering of affinity-labeled microbeads decorating a microspot. Beads outside the spot are removed by means of an applied magnetic field from above.

48
Novel diagnostic microarray assay formats – towards comprehensive on-site analysis
MyOne (Invitrogen) superparamagnetic microbeads of 1 μm in diameter, coated with
streptavidin can bind approximately 150 pmol biotin/mg beads according to the supplyer.
With a density of almost 2000 kg / m3, and a volume of ca 0.5*10-18 m3, the mass of one bead
amounts to around 1 pg, and 1 mg then corresponds to 109 beads. 150 pmol approximately
translates to 1014 molecules, which means that one bead can bind on average around
100.000 biotin molecules. As the surface area per bead is around 3*10-12 m2, the average area
per bound biotin would then be 3*10-17 m2 = 30 nm2, equivalent to a circular surface with a
diameter of around 6 nm. This area is conceivably larger than most globular proteins,
indicating that 100.000 bound biotinylated proteins per bead may be a reasonable
maximum number.
When a microbead is in contact with a surface coated with biomacromolecules such as a
microspot, only a limited fraction of the spot will be touched by the bead at one time. As
suggested by Morozov and Morozova [140, 151], the contact area can be estimated from
the radius of the bead, the size of the surface molecules on the bead and the microspot,
respectively, as well as the coated protein surface densities. This is illustrated in figure 3.4b.
Figure 3.4b A magnetic microbead in contact with a flat surface and interacting with a biomolecule on the surface by means of an affinity binder on the bead.

49
Jesper Gantelius
If the total length of the interacting molecules on the bead and the microspot surface is L,
the radius of the interacting surface can be calculated by means of Eq. 3.4c.
For a bead of R=1 μm and a combined interaction length of 10 nm for the partners of the
biospecific interaction between the bead and the microspot, the radius of interaction would
be around 140 nm, about 1/7 of the bead’s diameter. The interaction area is then 6*10-14 m2
= 6*104 nm2. This area is only ca 2% of the total area that the bead covers (illustrated in
figure 3.4c). The maximum number of simultaneous affinity interactions taking place would
then be around 6*104 nm2 / 30 nm2 = 2000, although it appears likely that only a small
fraction of this number is possible in reality.
Figure 3.4c One micron-sized antibody-coated magnetic beads attaching to an antigen microspot with bound serum antibodies.
LRLRc 22 Eq. 3.4c

50
Novel diagnostic microarray assay formats – towards comprehensive on-site analysis
Dilution experiments performed by Morozov and Morozova [140] suggest that very low
analyte concentrations can elicit bead binding. In one experiment the authors successfully
bound microbeads to a spot where the average binding surface density on the microspot
was estimated to be around 1 analyte molecule per 2 μm2,an area much larger than the
contact area between the bead and the surface. From these results, it was concluded that it is
likely that microbeads can be tethered to the surface by very few or even a single affinity
bond. The interaction between microspot and spot surface is visualized schematically in
figure 3.4d.
Figure 3.4d Computer-rendered schematic illustration of the interactionplane between the antibody-coated magnetic bead and the antigenmicrospot, via antibodies captured by the antigens on the surface.

51
Jesper Gantelius
It has been argued that forces needed to break individual affinity bonds have to be in the
order of 50-200 pN when applied over a time frame of several seconds [152-158], and that
5-20 pN may typically be needed to dislodge nonspecific interactions. Even smaller forces
have, however, been shown to be effective in reducing background binding when applied
over time periods of several minutes [159]. While these ranges are only indicative, and such
aspects as time of force application, the ramping up-procedure of the applied force and how
consistent the force application is may likely also influence the breaking of affinity bonds.
However, such estimates can be useful for making approximate design considerations for
affinity based assays.
Application of a magnetic lift force can be used to remove unbound or weakly bound beads
from the microspot surface [140, 81, 110, 52]. However, beads may also be affected by
manual rinsing of the surface prior to drying, unless the binding of beads is imaged while
still in a liquid environment. The drag force from the beads due to a flow over the substrate
can be estimated by employing eq 3.4b. In the a case where microarrays with attached
magnetic microbeads are rinsed by means of pouring wash buffer over the slide, and the
velocity of the free top boundary surface of the liquid that flows on the substrate is
approximately 5 cm/s, with the depth of the liquid being 5 mm, the velocity gradient close
to the surface can be calculated by means of fluid mechanics simulations.

52
Novel diagnostic microarray assay formats – towards comprehensive on-site analysis
The velocity at the slide surface is zero due to the no-slip boundary condition resulting from
water adhesion to the solid surface. At small distances from the surface, the velocity
increases linearly outwards. From simulations, it was estimated that the velocity at 1 μm
distance from the surface would be approximately 15 μm/s. While the average ambient flow
velocity with regards to the bead would then be less than 15 μm/s, this number can be used
to give a high estimate of the drag force. Employing eq. 3.4b, the drag force for a bead of 1
μm in diameter, with ambient velocity of 15 μm/s and ambient water like medium, the force
would amount to ca 0.3 pN. This force is hardly enough to break even weak non-specific
interactions, and would decrease even further in the case of tight packing of beads on the
substrate.

53
Jesper Gantelius
4 Present investigation
The presented doctoral work has been focused on developing and characterizing novel
strategies for affinity-based multiplexed assays, with a special emphasis on such aspects as
speed, simplicity, cost-efficiency and convenience of read-out options.
In paper I-III, affinity-labeled magnetic microbeads were used as detection reagents for
microarray analysis, as an alternative to more commonly employed affinity reagents with
attached fluorescent beacons or enzymes. While fluorescent antibodies or oligonucleotides
are commonly used for highly sensitive analysis, assay times are generally long due to
inherently slow diffusion processes, and expensive and bulky readers are needed to visualize
binding patterns. Here, it was found that affinity labeled microbeads could be transported
and bind within seconds to the microspot, and bound microbeads gave rise to a shift in
opacity on microspots that could be observed with the naked eye, a microscope, tabletop
scanners, or consumer-grade digital cameras. The employment of magnetic beads as
detection reagents in microarray analysis was demonstrated and evaluated in the setting of
SNP-genotyping (paper I), differential analysis of pestiviral infection (paper II) and
characterization of autoimmune responses (paper III).
In paper IV and V, a lateral flow assay format commonly applied in field diagnostic tests was
modified in an attempt to incorporate multiplexing ability similar to that of conventional
microarrays. The lateral flow microarray concept is a hybrid technique between a lateral
flow “dip-stick” rapid test and a planar microarray assay. In paper IV, the lateral flow
microarray was employed in classification of contagious bovine pleuropneumonia from
bovine serum analysis, and the assay was characterized by means of numerical simulations
and experiments in paper V.

54
Novel diagnostic microarray assay formats – towards comprehensive on-site analysis
4.1 Visualization of DNA hybridization on microarrays for
facilitated SNP analysis using magnetic microbeads (I)
Single nucleotide polymorphisms in genes and non-coding DNA have been used as
biomarkers of disease and phenotypical variation [1]. While some SNPs exhibit no
observable phenotypic variation, some may, as for instance polymorphisms in the tumor
suppressor gene p53 affect the susceptibility of developing some cancers [160].
Microarrays are powerful analytical tools that allow a multitude of miniature capture
surfaces to interrogate a complex sample at the same time. In the case of SNP analysis, it is
possible to employ microarray technology for the analysis of PCR product as a way to allow
for simultanesously sensitive and multiplexed analysis. In this study, two approaches were
investigated. In the first, PCR with a biotinylated forward strand primer and a non-
biotinylated reverse primer was employed to amplify the target DNA. Subsequently, the
biotinylated strand was separated from the non-biotinylated one by means of binding the
complex to streptavidin beads and melting in an alkaline environment. The biotinylated
strands were then released from the beads by applying deionized water at 80 ºC [161].

55
Jesper Gantelius
The sample containing biotinylated single strands was then allowed to incubate on the
microarray, which consisted of a number of oligonucleotide spots with specific sequence
complementarity to different PCR-product variants. Subsequently to the hybridization step,
streptavidin coated magnetic microbeads were attracted to the surface via the magnetic field
that resulted from placing a solid planar magnet below the slide. Within seconds, all beads
had travelled to the slide floor where they could attach to caught biotinylated PCR product
(figure 4.1a). The solid magnet was then moved above the slide, resulting in unbound or
weakly bound beads being released for simple removal. The binding pattern could be
recorded by means of ocular inspection, microscope or imaged with a cell-phone digital
camera.
Figure 4.1a Schematic drawing of a streptavidin-coated magnetic bead binding to the biotin-decorated PCR-product that has hybridized to a microarray spot [110].

56
Novel diagnostic microarray assay formats – towards comprehensive on-site analysis
In the second approach, it was the reverse primer that was biotinylated in the PCR reaction.
Subsequent to amplification and removal of the biotinylated strand, the sample containing
the unbiotinylated strand was hybridized to the oligonucleotide spot of the microarray that
corresponded to it’s specific SNP genotype. A protease-mediated allele-specific extension
(PrASE, [162]) procedure was then employed to extend only those bound strands that
exhibited a perfect 3’ end match with biotinylated nucleotides. Also in this second approach,
the streptavidin-coated microbeads could be employed successfully to visualize the binding
pattern (figure 4.1b).
The presented findings suggest that magnetic bead-based detection in combination with
PCR may be a viable alternative for determination of SNP genotypes relevant for instance in
HIV evolution and drug resistance.
Figure 4.1b Magnetic microbead-decorated array spots, revealing the SNP genotype pattern.

57
Jesper Gantelius
4.2 Rapid and simplified differential microarray analysis of four
pestiviruses using magnetic microbeads (II)
Outbreaks of infectious diseases among cattle and other farm animals are recurring aspects
of agriculture and society, but can have devastating effects in terms of suffering, economic
loss and risks for pan-species adaptation of the pathogen [41]. While the pathogen in
bacterial, viral or fungal form can often nowadays be cultured, sequenced, and then
identified from biological samples by means of PCR analysis, PCR alone is not always a
realistic alternative for differential screening of large cohorts of animals, especially if the
analysis needs to be performed on-site [37]. In paper II, we describe how microarray
analysis with magnetic bead-based detection could be used in conjunction with PCR and
generic primers for differential diagnosis of eight family members of the pestivirus family.
First, reverse transcription PCR (RT-PCR) was used to amplify pestiviral RNA using
biotinylated reverse primers and phosphorylated forward primers. Subsequently, Lambda
exonuclease was added to the PCR product with the effect of phosphorylated strands being
digested, which allowed for the resulting single strands to hybridize more efficiently to the
DNA microarray. After hybridization, slides were rinsed followed by application of
streptavidin-labeled magnetic microbeads (C1, MyOne, Invitrogen) suspended in
deionized water.

58
Novel diagnostic microarray assay formats – towards comprehensive on-site analysis
Beads were attracted to the array surface by means of a planar solid magnet, and allowed to
bind for ca 30 seconds. Subsequently, the magnetic plate was placed above the slide, which
resulted in the release and removal of unbound and loosely attached beads. After drying the
slide, the binding pattern could be observed by means of ocular inspection, microscopy,
table top scanning or a digital photography (figure 4.2a).
Figure 4.2a Magnetic bead-developed microarray slide, where 16 samples were analyzed in parallel (left). On the right, a zoomed-in developed array is shown.

59
Jesper Gantelius
Spots were characterized as being very strong ++, strong +, weak (+) or negative - (figure
4.2b). Sensitivity and specificity was found to be comparable to that of gel electrophoresis
and suspension bead array (Luminex). Thus, we suggest that employing the described
procedure of generic PCR, Lambda digestion, microarray hybridization and magnetic bead
detection could be worthwhile when large cohorts of animals need to be tested, but rapid
access to a high-resource laboratory is unavailable. In this study, the total assay time was 4.5
hours and 16 samples could be analyzed in parallel on the array slide. In principle it would
be possible to print and harbor 384 arrays or more on one slide without major modifications
to the presented procedure.
Figure 4.2b Four levels of magnetic bead coverage on microspots and the resulting classification scheme.

60
Novel diagnostic microarray assay formats – towards comprehensive on-site analysis
4.3 Protein autoantigen microarray analysis of human autoimmunity
using magnetic microbeads (III)
Autoimmunity is a set of diseases where a host’s immune system reacts towards one of its
own tissue or cell types. High level of autoimmune response can lead to dangerous or even
fatal consequences if not treated, such as in the case of rheumatoid arthritis and diabetes
mellitus type 1 [163]. The biomolecule that illicit the response is called the autoantigen,
and while the immune response differ substantially between different autoimmune diseases
[164], a common feature is the generation of autoantibodies that exhibit high affinity
towards the autoantigen. When identified from a patient sample, the autoantibodies can be
used as diagnostic markers of disease.
In this study, a protein microarray consisting of 12 autoantigens was used to analyze
presence of autoantibodies in samples from 21 patients that were previously diagnosed with
autoimmunity, as well as in samples from three healthy control subjects. The purpose was to
determine with what relative performance in terms of sensitivity, specificity and variability
magnetic beads could be employed to detect the autoimmune responses when compared to
the more well established fluorescence detection.

61
Jesper Gantelius
After sample incubation and washing steps, magnetic force was induced to transport the
magnetic beads to the array surface by means of a solid plate magnet that was placed below
the array slide. In a few seconds, all beads had reached the array surface, and after
approximately one minute, the magnetic plate was moved above the slide in order to reverse
the magnetic field and remove unbound or loosely attached beads (figure 4.3a). After
gentle washing, the slides were immersed for 5 minutes in 5% glutaraldehyde solution to fix
the beads in place.
Figure 4.3a Schematic representation of the microarray assay with fluorescense-based (top) and magnetic bead-based (bottom) detection.

62
Novel diagnostic microarray assay formats – towards comprehensive on-site analysis
When dry, the slides could be scanned using a table top scanner, or imaged using a
binocular microscope. All experiments were also carried out using fluorescently labeled goat
anti-human IgG to detect bound autoantibodies. The duration of the fluorescence-based
procedure was approximately twice as long as the magnetic bead assay due to longer
incubation of the fluorescent secondary antibody, and here a biochip reader was used to
visualize the fluorescence pattern.
ROC-analysis was employed to investigate the sensitivity and specificity of the magnetic
bead based detection relative to the fluorescence based detection. It was found that the area
under the curve in the ROC analysis (figure 4.3b) was 98%, indicating a high level of
concordance. It was thus concluded that magnetic beads as detection reagents could
provide an interesting alternative to fluorescence-based detection, when sensitivity is not
crucual and assay speed and convenient read-out is of essence
Figure 4.3b ROC-analysis depicting the performance of the magnetic bead assay in comparison to the fluorescense-based assay.

63
Jesper Gantelius
4.4 A lateral flow protein microarray for rapid determination of
contagious bovine pleuropneumonia status in bovine serum (IV)
In paper IV, a lateral flow microarray assay was constructed with the purpose of developing
a rapid, portable and cost-effective multiplexed test for contagious bovine pleuropneumonia
(CBPP). CBPP is a severe respiratory disease that affects cattle, buffalo, zebu and yaks that
were infected by the pathogen Mycoplasma mycoides subspecies mycoides small colony type
(M. mycoides SC). In Western Europe, CBPP was successfully eradicated in the 20th century,
except for few, but recurrent outbreaks [165]. The disease has also been eradicated in the
US and in Australia. In Sub-Saharan Africa however, the disease is widespread and results in
large socio-economical damage [166]. Access to cost-effective rapid tests with sufficient
sensitivity and specificity is much needed in order to prevent future outbreaks and to
eradicate the disease from the Sub-Saharan region.

64
Novel diagnostic microarray assay formats – towards comprehensive on-site analysis
In the present study, eight recombinant proteins were selected that were previously cloned
from M. mycoides SC and evaluated in terms of their capability to specifically bind IgG
molecules when incubated with serum from cows with a known CBPP infection [100].
These proteins were deposited in an array pattern in a nitrocellulose matrix that was fixed to
a glass slide. A hydrophobic patch was created by means of attaching a line of industrial
grease close to one end of the strip (figure 4.4a), which forced the sample to traverse the
strip through it’s cross section.
Hydrophobicpatch
Sample appli-cation window
Figure 4.4a Photograph of a slide with three developed lateral flow microarrays.The position of the hydrophobic patch area and the sample application window areshown.

65
Jesper Gantelius
The total assay time, from applying the sample to the strip being ready to be imaged was
less than ten minutes, and a typical developed array can be seen in (figure 4.4b). 22 sera
characterized as CBPP+ as well as 21 sera characterized as CBPP- were analyzed by the
presented assay. The contribution from all antigens were summed up into a “decision score”
which was used for predicting disease status.
R-1
046
R-1
36R
-653
R-4
31R
-813
R-8
16R
-240
R-3
97
050
0010
000
1500
0
Figure 4.4b Close up of a developed array (left) and the resulting intensity pattern as shown in a boxplot (right).

66
Novel diagnostic microarray assay formats – towards comprehensive on-site analysis
It was found that the overall sensitivity and specificity in terms of AUC estimate could be
estimated to 97% (figure 4.4c). While a comparison cocktail ELISA assay was found to
exhibit better performance in general, the diagnostic accuracy achieved with the lateral flow
microarray may still be adequate for rapid on-site screening purposes. Thus, the presented
assay holds potential as an emergent technology framework for rapid, cost-effective and
accurate CBPP diagnosis.
Figure 4.4c ROC-curve showing the performance of the lateral flow microarray assay.

67
Jesper Gantelius
4.5 Characterization of a protein lateral flow microarray through
mathematical modelling and experimental assays (V)
Lateral flow assays are ubiquitous and valuable diagnostic tools, due to exhibiting such
advantages as rapid assay procedures, easy handling, portability and being relatively
inexpensive. Lateral flow microarrays may provide additional features of multi-parameter
analysis and conceivably improved sensitivity and lower variability [141]. However, due to
analytes being transported by convection through the strip, spots that lie downstream may
experience different conditions than upstream ones, which suggest that it may not be
adequate to regard downstream spots as equivalent, even if they contain the same capture
probe. To our knowledge there are no published reports that investigate downstream effects
in serial lateral flow microspot assays.
In paper V, an attempt was made by means of lateral flow microarray experiments and
computer simulations to investigate how such parameters as kinetic on- and off-rate and the
analyte concentration influence the intensity distribution in spots that are positioned
serially, “downstream”, on the lateral flow assay strip.

68
Novel diagnostic microarray assay formats – towards comprehensive on-site analysis
For the lateral flow microarray assays, a panel of four affinity binders selected from a library
of affibody molecules [128], directed towards the tumor necrosis factor alpha (TNF-α),
were immobilized in an array pattern of 40 spots per affibody in rows with only minimal
spacing between downstream microspots (figure 4.5a).
Figure 4.5a Slide with three developed lateral flow affibody microarrays (left). On the right a zoom in of the middle array is shown. The flow direction was from left to right.

69
Jesper Gantelius
For numerical simulations a commercial finite element method (FEM) environment,
Comsol Multiphysics 3.5a (Comsol AB), was employed. Here, a 2D-geometry depicting
five microspots of 150 μm in diameter was constructed, and the spots were defined as
containing a concentration of 1 μM of affinity binder. The spot ligands were set to be
immobile and non-diffusive (figure 4.5b).
.
Figure 4.5b A finite element mesh employed for the numerical simulation of
five lateral flow microarray spots is shown (top), with the middle sub-plot
depicting the depletion of analyte from the sample and the bottom plot
showing how analyte is leaking from spots during washing. The flow direction
is from left to right.

70
Novel diagnostic microarray assay formats – towards comprehensive on-site analysis
The influence of a wide range of analyte concentrations and values of the kinetic on and off-
rates were investigated using the computer model. It was found that the amount of formed
complex on the first spot was predicted by the simulations to be linearly dependent on the
analyte concentrations for binders with sufficiently high affinity to the analyte. Further, it
was found that a high kinetic on-rate introduced a strong depletion effect from the first spot,
which made the formed complex in the second spot substantially less than the first one. A
low kinetic on-rate introduced less depletion, and spots were more similar to each other. A
low kinetic off-rate enabled formed complex to remain longer during washes, while a high
kinetic off-rate resulted in a rapid decay of the amount of formed complex in the spots
(figure 4.5c).
Figure 4.5c The fractional downstream decrease in downstream spots is
plotted for a range of kinetic on- and off-rates. It can be observed that higher
kinetic on-rates and lower kinetic off-rates result in a steeper downhill slope.

71
Jesper Gantelius
Reliable estimates of kinetic rate constants of the employed affibody molecules towards
TNF-α are currently not available, and consequently, the proposed effects from on and off-
rate constants on the downstream and wash-effects could not be validated experimentally.
However, substantial downstream and wash-sequence dependent effects were observed,
suggesting that further investigation is needed (figure 4.5d).
While still speculative due to lack of sufficient experimental evidence to validate the results
from numerical simulations, the presented lateral flow microarray experimental framework
may in addition to multiplexed analyte concentration determination prove useful for rough
rankings of kinetic constants towards a sought analyte in an assay environment highly
similar to that of the majority of rapid tests in use today.
Figure 4.5d In the left figure, the intensity decrease of lateral flow array spots as a
function of number of washes is shown. It is proposed that steeper slopes indicate
higher kinetic off-rate. In the figure to the right, the downstream profile is plotted for
the four affibody binders. Here, a steeper slope is proposed to indicate a higher kinetic
on-rate.

72
Novel diagnostic microarray assay formats – towards comprehensive on-site analysis
Concluding remarks
In this thesis, the development, application and characterization of two novel microarray
assay formats is presented. DNA microarrays have for many years been useful tools for
comprehensive investigations of gene expression, transcriptome profiling and differential
diagnosis, but their application has typically been limited to laboratory environments. It has
been demonstrated recently that DNA microarrays can be transferred into the lateral flow
assay domain [167] and the studies presented in this thesis suggest that magnetic
microparticle-based detection may also be an interesting analysis for improved portability
and facilitated read-out from DNA microarray assays (paper I & II). In recent years, protein
microarrays have begun coming of age, with antibody and antigen microarrays particularly
interesting for molecular diagnosis [72, 75, 96, 168]. In paper III-V, planar protein
microarray assays with magnetic bead-based detection, and lateral flow protein microarrays
were employed as tools for facilitated analysis.
Technology advances in life science are presenting new and improved tools for genomic,
transcriptomic and proteomic biomarker analysis and discovery, and it appears likely that
the US$1000 genome challenge will soon be met, with commercialization of personal
medicine likely to contribute to the growing demand for personal health information [170].
There is a strong trend towards integration, minaturization and improved portability of
diagnostic assays [171] with for instance nearly pain-free blood sampling [172], devices for
separation of blood plasma from cells [173] and on-chip dilution of biofluids [174], as well
as promising progress in single cell and microdroplet technologies that may prove amenable
for on-site analysis [175, 176]. Further, the quality of imaging hardware is improving
rapidly, and CCD sensors are rapidly becoming smaller and less expensive, allowing for
improved on-site data acquisition of results from portable diagnostic devices [177]. The
improved global coverage of wireless internet access, together with decreasing costs further
suggests that it will be feasible for individuals by themselves or with the assistance of health

73
Jesper Gantelius
workers to perform on-site diagnostic assays, while advanced image analysis, pattern
recognition and data processing could be performed in data-centers and interpreted or
annotated by medical professionals at a distance [178-181]. Finally, there is a considerable
ongoing effort directed towards the generation and characterization of sensitive and specific
affinity-reagents for biomarker analysis [70, 169].
These observations suggest that in the years to come, personalized medicine and
convergence of low-cost, high-throughput analysis and interpretation of an ever-growing
number of biomarkers may contribute substantially to reducing the major burden of disease
and death from for instance cardiovascular disease and cancer. In high-income countries,
such achievements will likely result in improved average life expectancy and more adequate
individual treatment for those affected by disease, although such efforts also need to be
brought to low-income regions and contexts as a part of health care systems providing basic
health care. In regions displaying high disparity in health between socio-economic groups,
there is a need for the global community to assist in basic health and equality reform work,
and in many cases clean water, adequate nutrition, primary education, basic training in risk-
prevention, vaccination and free or affordable treatment needs to be provided in addition to
rapid testing by collaboration efforts between local governments, authorities, non-
governmental organizations and foreign aid bodies.
In conclusion, microarrays can greatly contribute to early identification of disease, correct
differential diagnosis and stratification of disease conditions for improved health care.
Extending their useability and applicability into a wider range of settings and environments
has the potential to strengthen democratization reforms of global public healthcare. Further
improvement and development of the work presented in this thesis may contribute towards
this goal.

74
Novel diagnostic microarray assay formats – towards comprehensive on-site analysis
Acknowledgements
You know, writing down a comprehensive list of everyone who supported me, worked with
me, helped me, cared for me and loved me during these years.. It feels great, I should do this
everyday :-)
I believe firmly (I think) that a strong base and secure (yet challenging) environment helps
people, minds and ideas to grow. And I feel that these years of PhD studies have been
overwhelming, inspiring and constructive for me on many levels. So recognizing that any
knownledge, experience or contribution on my part that may have resulted from this
adventure could not have come about without the network of all you good people, I would
like to take the opportunity to say thank you to all of you. Thank you!
Helene, for taking me on, securing the financing for my PhD, caring for me and my
development, and for teaching me many important things about Science. Amelie and Per-
Åke for allowing myself and others to drink from your deep wells of knowledge. Mathias, for
being a great example of that it is possible to combine scientific excellence, creativity, and
conviction in realizing your visions. Jochen, for being a real mentor for me during my time
here. I hope that I too will be as dedicated, conscientous and patient when guiding new
scientists on their path. Mårten&Ronald for all the help with printing during the years, PIs
for being so accessible and welcoming to us students, all the extended nano-faces (Sara,
Håkan, Björn, Johanna, Julia, Patrik, Emma, Anna S). Convictus friends: Claes, Neven, Pär,
Jurek, Rolf, Jan, Khalid, Veronica, Nina, Annette, Dima, Galya, Genya, Tanya, Anja, Jaan,
Piotr, Kristina, Krista, Trollet, Conny and all guests & clients I have had the previlege to
work with over the years. You are all very dear to me. The ladies at KRT. Lims-crew (Per,
Janne, Erik, Mathias), I still can’t decide if the time with you on floor one was the most or
least productive I’ve experienced. Albanovakören, thanks all the wonderful music and for
having patience and faith in me directing you pretending to know what I’m doing.
AlumniX-board members over the years, I love unpaid enthusiasm.

75
Jesper Gantelius
Mamma & Pappa for being so kind to provide me with genes and love and for believing in
me. Petter, Anna & Erik – so now you are teaching your big brother things, eh? Feels
fantastic! Svante, my new-born nephew, I wonder if you will ever read this :) Karin & Bertil,
for constant kindness, wisdom and crazy stories. Anna, for always being so great with
M&M. Charlotte & Per, my bonus parents. I’m glad you’ve been around, since mom and
dad sure could use some help with this one. Gustav and Helena you are always so inspiring
and giving me perspective, thank you! Johan mon frère. VGMK-singers, Laurent, Toshiro,
Håkan & Patrik for great scientific discussions. BioTAS gang, it’s nice to feel like I actually
know stuff about ”Bio”. And thanks to organizers of Albanova seminars in theoretical
physics etc, it is also good to realize that knowledge is a relative thing. Aman & Jacob, finally
some guys that are (almost) as addicted to Comsol as I am. Phadia-gänget (Mats, Annika,
Göran, Per) for support, letting me learn from your great experience and the Nanoplotter of
course ;) Neil & SVA-crew, Michael & Thomas @ NMI. All my aunts, uncles and cousins.
CBPP-gang, I’ve really enjoyed working with you! 18dk, Maja & Kulturama for songs in
abundance. Alex, Cajsa & Franz. Johan N & Per-Åke L for being so amazingly helpful. My
BMFS & Biomechanics students in Uppsala. Ida & Sara for memories of old Lund-times.
Anton L, Astrid, Annicka, Jonas, I miss spending time with you. Ammar, Per S, Tarek, Pelle
& Marcus for letting me supervise you in your diploma works. Huset (Anna, Maria,
Magnus, Björn, Malin, Linda) – best regards from Johnny D (?). Uppsala X-men & women
(Erik, Magnus, Minna, Peter, Karin, Ida, Ulrika, Anders M, Fredrik L, Xia Han). HS-board.
Inger, Mona, Kristina, Albanova reception, sköna vaktisar & Entré for highly necessary
ground control, Carl & Kristoffer for magnificently hyperbolic discussions. Shout-out also
to all great people in the HPR and at KTH/Biotechnology. I’ve been really happy here, and
I’m glad to have met and come to know you all! Finally, Malin, you are such an amazing
person and just being in your presence gives me warmth, energy and inspiration. Your
commitment to people and the world we live in makes me proud to know you and gives me
hope about the future. Thanks you for welcoming me as I am into your life. I love you.

76
Novel diagnostic microarray assay formats – towards comprehensive on-site analysis
References
1 Loscalzo J. Association studies in an era of too much information: clinical analysis of new biomarker and genetic data. Circulation. 2007 Oct 23;116(17):1866-70.
2 Bjorling E, Lindskog C, Oksvold P, Linne J, Kampf C, Hober S, et al. A web-based tool for in silico biomarker discovery based on tissue-specific protein profiles in normal and cancer tissues. Mol Cell Proteomics. 2008 May;7(5):825-44.
3 UNdata. data.un.org (accessed 2009-08-20)
4 WHO. Global Burden of Disease; 2007, http://www.who.int/healthinfo/global_burden_disease/2004_report_update/en/index.html (accessed 2009-0917)
5 Monteiro CA, Moura EC, Conde WL, Popkin BM. Socioeconomic status and obesity in adult populations of developing countries: a review. Bull World Health Organ. 2004 Dec;82(12):940-6.
6 Wilkinson R, Marmot M. The solid facts. Copenhagen: World Health Organization. 2003.
7 Gaziano TA. Reducing the growing burden of cardiovascular disease in the developing world. Health Aff (Millwood). 2007 Jan-Feb;26(1):13-24.
8 Ferlay J, Autier P, Boniol M, Heanue M, Colombet M, Boyle P. Estimates of the cancer incidence and mortality in Europe in 2006. Ann Oncol. 2007 Mar;18(3):581-92.
9 Seshadri S, Wolf PA. Lifetime risk of stroke and dementia: current concepts, and estimates from the Framingham Study. Lancet Neurol. 2007 Dec;6(12):1106-14.
10 Profenno LA, Porsteinsson AP, Faraone SV. Meta-Analysis of Alzheimer's Disease Risk with Obesity, Diabetes, and Related Disorders. Biol Psychiatry. 2009 Apr 7.
11 Olopade OI, Schwartsmann G, Saijo N, Thomas CR, Jr. Disparities in cancer care: a worldwide perspective and roadmap for change. J Clin Oncol. 2006 May 10;24(14):2135-6.
12 Power C, Graham H, Due P, Hallqvist J, Joung I, Kuh D, et al. The contribution of childhood and adult socioeconomic position to adult obesity and smoking behaviour: an international comparison. Int J Epidemiol. 2005 Apr;34(2):335-44.

77
Jesper Gantelius
13 Poirier P, Giles TD, Bray GA, Hong Y, Stern JS, Pi-Sunyer FX, et al. Obesity and cardiovascular disease: pathophysiology, evaluation, and effect of weight loss. Arterioscler Thromb Vasc Biol. 2006 May;26(5):968-76.
14 Vainio H, Kaaks R, Bianchini F. Weight control and physical activity in cancer prevention: international evaluation of the evidence. Eur J Cancer Prev. 2002 Aug;11 Suppl 2:S94-100.
15 Haslam DW, James WP. Obesity. Lancet. 2005 Oct 1;366(9492):1197-209.
16 Obesity: preventing and managing the global epidemic. Report of a WHO consultation. World Health Organ Tech Rep Ser. 2000;894:i-xii, 1-253.
17 Kelly T, Yang W, Chen CS, Reynolds K, He J. Global burden of obesity in 2005 and projections to 2030. Int J Obes (Lond). 2008 Sep;32(9):1431-7.
18 Bach PB. Is our natural-history model of lung cancer wrong? Lancet Oncol. 2008 Jul;9(7):693-7.
19 Al-Haddad M, Wallace MB. Molecular diagnostics of non-small cell lung cancer using mediastinal lymph nodes sampled by endoscopic ultrasound-guided needle aspiration. Cytopathology. 2006;17(1):3.
20 Wynder EL, Graham EA. Tobacco smoking as a possible etiologic factor in bronchiogenic carcinoma; a study of 684 proved cases. J Am Med Assoc. 1950 May 27;143(4):329-36.
21 Alberg AJ, Nonemaker J. Who is at high risk for lung cancer? Population-level and individual-level perspectives. Semin Respir Crit Care Med. 2008 Jun;29(3):223-32.
22 Guindon GE, Boisclair D. Past, current and future trends in tobacco use. World Health. 2003.
23 Frieden TR, Bloomberg MR. How to prevent 100 million deaths from tobacco. Lancet. 2007 May 19;369(9574):1758-61.
24 Winslow CE. The Untilled Fields of Public Health. Science. 1920 Jan 9;51(1306):23-33.
25 WHO. Preamble to the constitution of th World Health Organization as adopted by the International Health Conference. New York. 1946:19-22.

78
Novel diagnostic microarray assay formats – towards comprehensive on-site analysis
26 UN. The Millenium Development Goals report 2009. wwwunorg/millenniumgoals//MDG%20Report%202009%20ENGpdf.
27 Schieber GJ, Gottret P, Fleisher LK, Leive AA. Financing global health: mission unaccomplished. Health Aff (Millwood). 2007 Jul-Aug;26(4):921-34.
28 Gwatkin DR, Rutstein S, Johnson K, Suliman E, Wagstaff A, Amouzou A. Socio-economic differences in health, nutrition, and population within developing countries: an overview. Niger J Clin Pract. 2007 Dec;10(4):272-82.
29 Schieber G, Fleisher L, Gottret P. Getting real on health financing. Finance & Development. 2006;43(4).
30 Denison JA, O'Reilly KR, Schmid GP, Kennedy CE, Sweat MD. HIV voluntary counseling and testing and behavioral risk reduction in developing countries: a meta-analysis, 1990--2005. AIDS Behav. 2008 May;12(3):363-73.
31 Wodak A, Cooney A. Do needle syringe programs reduce HIV infection among injecting drug users: a comprehensive review of the international evidence. Subst Use Misuse. 2006;41(6-7):777-813.
32 von Lode P. Point-of-care immunotesting: approaching the analytical performance of central laboratory methods. Clinical biochemistry. 2005;38(7):591-606.
33 Yarnall KS, Pollak KI, Ostbye T, Krause KM, Michener JL. Primary care: is there enough time for prevention? Am J Public Health. 2003 Apr;93(4):635-41.
34 Meissner HI, Breen N, Taubman ML, Vernon SW, Graubard BI. Which women aren't getting mammograms and why? (United States). Cancer Causes Control. 2007 Feb;18(1):61-70.
35 Grown C, Gupta GR, Pande R. Taking action to improve women's health through gender equality and women's empowerment. Lancet. 2005 Feb 5-11;365(9458):541-3.
36 Burrows D. Strategies for dealing with HIV / AIDS in the former Soviet Union. Dev Bull. 2000 Jun(52):49-51.
37 Yager P, Edwards T, Fu E, Helton K, Nelson K, Tam MR, et al. Microfluidic diagnostic technologies for global public health. Nature. 2006 Jul 27;442(7101):412-8.
38 Murray CK, Gasser RA, Jr., Magill AJ, Miller RS. Update on rapid diagnostic testing for malaria. Clin Microbiol Rev. 2008 Jan;21(1):97-110.

79
Jesper Gantelius
39 Needle RH, Burrows D, Friedman SR, Dorabjee J, Touze G, Badrieva L, et al. Effectiveness of community-based outreach in preventing HIV/AIDS among injecting drug users. International Journal of Drug Policy. 2005;16:S45-S57.
40 Bowles KE, Clark HA, Tai E, Sullivan PS, Song B, Tsang J, et al. Implementing rapid HIV testing in outreach and community settings: results from an advancing HIV prevention demonstration project conducted in seven U.S. cities. Public Health Rep. 2008 Nov-Dec;123 Suppl 3:78-85.
41 Belak S. Molecular diagnosis of viral diseases, present trends and future aspects A view from the OIE Collaborating Centre for the Application of Polymerase Chain Reaction Methods for Diagnosis of Viral Diseases in Veterinary Medicine. Vaccine. 2007 Jul 26;25(30):5444-52.
42 Wilkinson D, Wilkinson N, Lombard C, Martin D, Smith A, Floyd K, et al. On-site HIV testing in resource-poor settings: is one rapid test enough? Aids. 1997;11(3):377.
43 Sawyers CL. The cancer biomarker problem. Nature. 2008 Apr 3;452(7187):548-52.
44 Subkhankulova T, Gilchrist MJ, Livesey FJ. Modelling and measuring single cell RNA expression levels find considerable transcriptional differences among phenotypically identical cells. BMC Genomics. 2008;9:268.
45 Anderson NL, Anderson NG. The human plasma proteome: history, character, and diagnostic prospects. Mol Cell Proteomics. 2002 Nov;1(11):845-67.
46 Karon JM, Song R, Brookmeyer R, Kaplan EH, Hall HI. Estimating HIV incidence in the United States from HIV/AIDS surveillance data and biomarker HIV test results. Stat Med. 2008 Oct 15;27(23):4617-33.
47 Haab BB. Antibody arrays in cancer research. Mol Cell Proteomics. 2005 Apr;4(4):377-83.
48 Thompson IM, Tangen CM, Kristal AR. Prostate-specific antigen: a misused and maligned prostate cancer biomarker. JNCI Journal of the National Cancer Institute. 2008;100(21):1487.
49 Bloom GC, Eschrich S, Zhou JX, Coppola D, Yeatman TJ. Elucidation of a protein signature discriminating six common types of adenocarcinoma. Int J Cancer. 2007 Feb 15;120(4):769-75.

80
Novel diagnostic microarray assay formats – towards comprehensive on-site analysis
50 Carlsson A, Wingren C, Ingvarsson J, Ellmark P, Baldertorp B, Ferno M, et al. Serum proteome profiling of metastatic breast cancer using recombinant antibody microarrays. Eur J Cancer. 2008 Feb;44(3):472-80.
51 Wingren C, Borrebaeck CA. Antibody-based microarrays. Methods Mol Biol. 2009;509:57-84.
52 Leblanc N, Gantelius J, Schwenk JM, Stahl K, Blomberg J, Andersson-Svahn H, et al. Development of a magnetic bead microarray for simultaneous and simple detection of four pestiviruses. J Virol Methods. 2009 Jan;155(1):1-9.
53 Kandpal R, Saviola B, Felton J. The era of 'omics unlimited. Biotechniques. 2009 Apr;46(5):351-2, 4-5.
54 Lander ES, Linton LM, Birren B, Nusbaum C, Zody MC, Baldwin J, et al. Initial sequencing and analysis of the human genome. Nature. 2001 Feb 15;409(6822):860-921.
55 Venter JC, Adams MD, Myers EW, Li PW, Mural RJ, Sutton GG, et al. The sequence of the human genome. Science. 2001 Feb 16;291(5507):1304-51.
56 Torres TT, Metta M, Ottenwalder B, Schlotterer C. Gene expression profiling by massively parallel sequencing. Genome Res. 2008 Jan;18(1):172-7.
57 McGrath PT, Lee H, Zhang L, Iniesta AA, Hottes AK, Tan MH, et al. High-throughput identification of transcription start sites, conserved promoter motifs and predicted regulons. Nat Biotechnol. 2007 May;25(5):584-92.
58 Cargill M, Schrodi SJ, Chang M, Garcia VE, Brandon R, Callis KP, et al. A large-scale genetic association study confirms IL12B and leads to the identification of IL23R as psoriasis-risk genes. Am J Hum Genet. 2007 Feb;80(2):273-90.
59 Schones DE, Cui K, Cuddapah S, Roh TY, Barski A, Wang Z, et al. Dynamic regulation of nucleosome positioning in the human genome. Cell. 2008 Mar 7;132(5):887-98.
60 Schones DE, Zhao K. Genome-wide approaches to studying chromatin modifications. Nat Rev Genet. 2008 Mar;9(3):179-91.
61 Hochholdinger F, Hoecker N. Towards the molecular basis of heterosis. Trends Plant Sci. 2007 Sep;12(9):427-32.
62 Jones PA. Moving AHEAD with an international human epigenome project. Nature. 2008 Aug 7;454(7205):711-5.

81
Jesper Gantelius
63 Gygi SP, Rochon Y, Franza BR, Aebersold R. Correlation between protein and mRNA abundance in yeast. Mol Cell Biol. 1999 Mar;19(3):1720-30.
64 Lu P, Vogel C, Wang R, Yao X, Marcotte EM. Absolute protein expression profiling estimates the relative contributions of transcriptional and translational regulation. Nat Biotechnol. 2007 Jan;25(1):117-24.
65 Mattick JS. The functional genomics of noncoding RNA. Science. 2005 Sep 2;309(5740):1527-8.
66 Konig H, Matter N, Bader R, Thiele W, Muller F. Splicing segregation: the minor spliceosome acts outside the nucleus and controls cell proliferation. Cell. 2007 Nov 16;131(4):718-29.
67 Sharp PA. The centrality of RNA. Cell. 2009 Feb 20;136(4):577-80.
68 Gupta N, Tanner S, Jaitly N, Adkins JN, Lipton M, Edwards R, et al. Whole proteome analysis of post-translational modifications: applications of mass-spectrometry for proteogenomic annotation. Genome Res. 2007 Sep;17(9):1362-77.
69 Berger SL. The complex language of chromatin regulation during transcription. Nature. 2007 May 24;447(7143):407-12.
70 Uhlen M, Hober S. Generation and validation of affinity reagents on a proteome-wide level. J Mol Recognit. 2009 Mar-Apr;22(2):57-64.
71 Gresham D, Dunham MJ, Botstein D. Comparing whole genomes using DNA microarrays. Nature Reviews Genetics. 2008;9(4):291-302.
72 Hartmann M, Roeraade J, Stoll D, Templin MF, Joos TO. Protein microarrays for diagnostic assays. Anal Bioanal Chem. 2009 Mar;393(5):1407-16.
73 Hanash SM, Pitteri SJ, Faca VM. Mining the plasma proteome for cancer biomarkers. Nature. 2008 Apr 3;452(7187):571-9.
74 Uhlen M. Affinity as a tool in life science. Biotechniques. 2008 Apr;44(5):649-54.
75 Borrebaeck CA, Wingren C. Design of high-density antibody microarrays for disease proteomics: key technological issues. J Proteomics. 2009 Aug 20;72(6):928-35.
76 Srinivas PR, Verma M, Zhao Y, Srivastava S. Proteomics for cancer biomarker discovery. Clin Chem. 2002 Aug;48(8):1160-9.

82
Novel diagnostic microarray assay formats – towards comprehensive on-site analysis
77 Pant Pai N. Oral fluid-based rapid HIV testing: issues, challenges and research directions. Expert Rev Mol Diagn. 2007 Jul;7(4):325-8.
78 Drake RR, Cazare LH, Semmes OJ, Wadsworth JT. Serum, salivary and tissue proteomics for discovery of biomarkers for head and neck cancers. Expert Rev Mol Diagn. 2005 Jan;5(1):93-100.
79 Knottnerus JA, van Weel C, Muris JW. Evaluation of diagnostic procedures. Bmj. 2002 Feb 23;324(7335):477-80.
80 Zweig MH, Campbell G. Receiver-operating characteristic (ROC) plots: a fundamental evaluation tool in clinical medicine. Clin Chem. 1993 Apr;39(4):561-77.
81 Gantelius J, Hartmann M, Schwenk JM, Roeraade J, Andersson-Svahn H, Joos TO. Magnetic bead-based detection of autoimmune responses using protein microarrays. N Biotechnol. 2009 Aug 5.
82 Aebersold R, Mann M. Mass spectrometry-based proteomics. Nature. 2003 Mar 13;422(6928):198-207.
83 Govorukhina NI, Reijmers TH, Nyangoma SO, van der Zee AG, Jansen RC, Bischoff R. Analysis of human serum by liquid chromatography-mass spectrometry: improved sample preparation and data analysis. J Chromatogr A. 2006 Jul 7;1120(1-2):142-50.
84 Govorukhina N, Horvatovich P, Bischoff R. Label-free proteomics of serum. Methods Mol Biol. 2008;484:67-77.
85 Issaq HJ, Veenstra TD. The role of electrophoresis in disease biomarker discovery. Electrophoresis. 2007 Jun;28(12):1980-8.
86 Yalow RS, Berson SA. Immunoassay of endogenous plasma insulin in man. J Clin Invest. 1960 Jul;39:1157-75.
87 Wide L, Bennich H, Johansson SG. Diagnosis of allergy by an in-vitro test for allergen antibodies. Lancet. 1967 Nov 25;2(7526):1105-7.
88 Engvall E, Perlmann P. Enzyme-linked immunosorbent assay (ELISA). Quantitative assay of immunoglobulin G. Immunochemistry. 1971 Sep;8(9):871-4.
89 Towbin H, Staehelin T, Gordon J. Electrophoretic transfer of proteins from polyacrylamide gels to nitrocellulose sheets: procedure and some applications. Proc Natl Acad Sci U S A. 1979 Sep;76(9):4350-4.

83
Jesper Gantelius
90 Mullis K, Faloona F, Scharf S, Saiki R, Horn G, Erlich H. Specific enzymatic amplification of DNA in vitro: the polymerase chain reaction. Cold Spring Harb Symp Quant Biol. 1986;51 Pt 1:263-73.
91 Vet JA, Majithia AR, Marras SA, Tyagi S, Dube S, Poiesz BJ, et al. Multiplex detection of four pathogenic retroviruses using molecular beacons. Proc Natl Acad Sci U S A. 1999 May 25;96(11):6394-9.
92 Molenkamp R, van der Ham A, Schinkel J, Beld M. Simultaneous detection of five different DNA targets by real-time Taqman PCR using the Roche LightCycler480: Application in viral molecular diagnostics. J Virol Methods. 2007 May;141(2):205-11.
93 Janzi M, Sjöberg R, Wan J, Fischler B, von Döbeln U, Isaac L, et al. Screening for C3 Deficiency in Newborns Using Microarrays. PLoS ONE. 2009;4(4).
94 Hoheisel JD. Microarray technology: beyond transcript profiling and genotype analysis. Nat Rev Genet. 2006 Mar;7(3):200-10.
95 Melton L. Protein arrays: proteomics in multiplex. Nature. 2004 May 6;429(6987):101-7.
96 Schwenk JM, Gry M, Rimini R, Uhlen M, Nilsson P. Antibody suspension bead arrays within serum proteomics. J Proteome Res. 2008 Aug;7(8):3168-79.
97 Dunbar SA. Applications of Luminex xMAP technology for rapid, high-throughput multiplexed nucleic acid detection. Clin Chim Acta. 2006 Jan;363(1-2):71-82.
98 Larsson K, Wester K, Nilsson P, Uhlen M, Hober S, Wernerus H. Multiplexed PrEST immunization for high-throughput affinity proteomics. J Immunol Methods. 2006 Aug 31;315(1-2):110-20.
99 Wrenn SJ, Harbury PB. Chemical evolution as a tool for molecular discovery. 2007.
100 Hamsten C, Westberg J, Bolske G, Ayling R, Uhlen M, Persson A. Expression and immunogenicity of six putative variable surface proteins in Mycoplasma mycoides subsp. mycoides SC. Microbiology. 2008 Feb;154(Pt 2):539-49.
101 Resch-Genger U, Grabolle M, Cavaliere-Jaricot S, Nitschke R, Nann T. Quantum dots versus organic dyes as fluorescent labels. Nature Methods. 2008 Sep;5(9):763-75.

84
Novel diagnostic microarray assay formats – towards comprehensive on-site analysis
102 Barbe L, Lundberg E, Oksvold P, Stenius A, Lewin E, Bjorling E, et al. Toward a confocal subcellular atlas of the human proteome. Mol Cell Proteomics. 2008 Mar;7(3):499-508.
103 Zellner M, Babeluk R, Diestinger M, Pirchegger P, Skeledzic S, Oehler R. Fluorescence-based Western blotting for quantitation of protein biomarkers in clinical samples. Electrophoresis. 2008 Sep;29(17):3621-7.
104 Seidel M, Niessner R. Automated analytical microarrays: a critical review. Anal Bioanal Chem. 2008 Jul;391(5):1521-44.
105 Fukuda H, Takahashi J, Watanabe K, Hayashi H, Morizane A, Koyanagi M, et al. Fluorescence-activated cell sorting-based purification of embryonic stem cell-derived neural precursors averts tumor formation after transplantation. Stem Cells. 2006 Mar;24(3):763-71.
106 Moeder CB, Giltnane JM, Moulis SP, Rimm DL. Quantitative, fluorescence-based in-situ assessment of protein expression. Methods Mol Biol. 2009;520:163-75.
107 Levit-Binnun N, Lindner AB, Zik O, Eshhar Z, Moses E. Quantitative detection of protein arrays. Anal Chem. 2003;75(6):1436-41.
108 Oldenburg SJ, Genick CC, Clark KA, Schultz DA. Base pair mismatch recognition using plasmon resonant particle labels. Analytical biochemistry. 2002;309(1):109-16.
109 Zhang Y, Eniola AO, Graves DJ, Hammer DA. Specific adhesion of micron-sized colloids to surfaces mediated by hybridizing DNA chains. Langmuir. 2003;19(17):6905-11.
110 Stahl PL, Gantelius J, Natanaelsson C, Ahmadian A, Andersson-Svahn H, Lundeberg J. Visual DNA -- identification of DNA sequence variations by bead trapping. Genomics. 2007 Dec;90(6):741-5.
111 Sano T, Smith CL, Cantor CR. Immuno-PCR: very sensitive antigen detection by means of specific antibody-DNA conjugates. Science. 1992;258(5079):120-2.
112 Zhou H, Bouwman K, Schotanus M, Verweij C, Marrero JA, Dillon D, et al. Two-color, rolling-circle amplification on antibody microarrays for sensitive, multiplexed serum-protein measurements. Genome Biol. 2004;5(4):R28.
113 Mahmoudian L, Kaji N, Tokeshi M, Nilsson M, Baba Y. Rolling circle amplification and circle-to-circle amplification of a specific gene integrated with electrophoretic analysis on a single chip. Anal Chem. 2008 Apr 1;80(7):2483-90.

85
Jesper Gantelius
114 Fredriksson S, Gullberg M, Jarvius J, Olsson C, Pietras K, Gústafsdóttir SM, et al. Protein detection using proximity-dependent DNA ligation assays. Nature biotechnology. 2002;20(5):473-7.
115 Brooks BD, Albertson AE, Jones JA, Speare JO, Lewis RV. Efficient screening of high-signal and low-background antibody pairs in the bio-bar code assay using prion protein as the target. Anal Biochem. 2008 Nov 1;382(1):60-2.
116 Yu J, Xiao J, Ren X, Lao K, Xie XS. Probing gene expression in live cells, one protein molecule at a time. Science. 2006 Mar 17;311(5767):1600-3.
117 Elfstrom N, Karlstrom AE, Linnros J. Silicon nanoribbons for electrical detection of biomolecules. Nano Lett. 2008 Mar;8(3):945-9.
118 Patolsky F, Zheng G, Lieber CM. Nanowire sensors for medicine and the life sciences. Nanomed. 2006 Jun;1(1):51-65.
119 Loy A, Arnold R, Tischler P, Rattei T, Wagner M, Horn M. probeCheck--a central resource for evaluating oligonucleotide probe coverage and specificity. Environ Microbiol. 2008 Oct;10(10):2894-8.
120 Kindt TJ, Osborne BA, Goldsby RA. Kuby Immunology, 2007 6th ed. pp 13 (book)
121 Steen J, Ramstrom M, Uhlen M, Hober S, Ottosson J. Automated sample preparation method for mass spectrometry analysis on recombinant proteins. J Chromatogr A. 2009 May 15;1216(20):4457-64.
122 Rockberg J, Lofblom J, Hjelm B, Uhlen M, Stahl S. Epitope mapping of antibodies using bacterial surface display. Nat Methods. 2008 Dec;5(12):1039-45.
123 Leal YA, Flores LL, Garcia-Cortes LB, Cedillo-Rivera R, Torres J. Antibody-based detection tests for the diagnosis of Helicobacter pylori infection in children: a meta-analysis. PLoS One. 2008;3(11):e3751.
124 Hamsten C, Neiman M, Schwenk JM, Hamsten M, March JB, Persson A. Recombinant surface proteomics as a tool to analyze humoral immune responses in bovines infected by Mycoplasma mycoides subsp. mycoides SC. Mol Cell Proteomics. 2009 Aug 20.
125 Akerstrom B, Nielsen E, Bjorck L. Definition of IgG- and albumin-binding regions of streptococcal protein G. J Biol Chem. 1987 Oct 5;262(28):13388-91.

86
Novel diagnostic microarray assay formats – towards comprehensive on-site analysis
126 Guesdon JL, Ternynck T, Avrameas S. The use of avidin-biotin interaction in immunoenzymatic techniques. J Histochem Cytochem. 1979 Aug;27(8):1131-9.
127 Matsuura T, Yomo T. In vitro evolution of proteins. J Biosci Bioeng. 2006 Jun;101(6):449-56.
128 Holliger P, Hudson PJ. Engineered antibody fragments and the rise of single domains. Nat Biotechnol. 2005 Sep;23(9):1126-36.
129 Nilsson B, Moks T, Jansson B, Abrahmsen L, Elmblad A, Holmgren E, et al. A synthetic IgG-binding domain based on staphylococcal protein A. Protein Eng. 1987 Feb-Mar;1(2):107-13.
130 Kohl A, Binz HK, Forrer P, Stumpp MT, Pluckthun A, Grutter MG. Designed to be stable: crystal structure of a consensus ankyrin repeat protein. Proc Natl Acad Sci U S A. 2003 Feb 18;100(4):1700-5.
131 Beste G, Schmidt FS, Stibora T, Skerra A. Small antibody-like proteins with prescribed ligand specificities derived from the lipocalin fold. Proc Natl Acad Sci U S A. 1999 Mar 2;96(5):1898-903.
132 Proske D, Blank M, Buhmann R, Resch A. Aptamers--basic research, drug development, and clinical applications. Appl Microbiol Biotechnol. 2005 Dec;69(4):367-74.
133 Rosenwald S, Kafri R, Lancet D. Test of a statistical model for molecular recognition in biological repertoires. J Theor Biol. 2002 Jun 7;216(3):327-36.
134 Smith GP. Filamentous fusion phage: novel expression vectors that display cloned antigens on the virion surface. Science. 1985 Jun 14;228(4705):1315-7.
135 He M, Taussig MJ. Eukaryotic ribosome display with in situ DNA recovery. Nat Methods. 2007 Mar;4(3):281-8.
136 Wassaf D, Kuang G, Kopacz K, Wu QL, Nguyen Q, Toews M, et al. High-throughput affinity ranking of antibodies using surface plasmon resonance microarrays. Analytical biochemistry. 2006;351(2):241-53.
137 Green NM. Avidin and streptavidin. Methods Enzymol. 1990;184:51-67.
138 Aifa S, Johansen K, Nilsson UK, Liedberg B, Lundstrom I, Svensson SP. Interactions between the juxtamembrane domain of the EGFR and calmodulin measured by surface plasmon resonance. Cell Signal. 2002 Dec;14(12):1005-13.

87
Jesper Gantelius
139 Collins BE, Paulson JC. Cell surface biology mediated by low affinity multivalent protein-glycan interactions. Curr Opin Chem Biol. 2004 Dec;8(6):617-25.
140 Morozov VN, Morozova TY. Active bead-linked immunoassay on protein microarrays. Anal Chim Acta. 2006 Mar 30;564(1):40-52.
141 Ekins RP. Multi-analyte immunoassay. J Pharm Biomed Anal. 1989;7(2):155-68.
142 Squires TM, Messinger RJ, Manalis SR. Making it stick: convection, reaction and diffusion in surface-based biosensors. Nat Biotechnol. 2008 Apr;26(4):417-26.
143 Lehmann U, Sergio M, Pietrocola S, Dupont E, Niclass C, Gijs MAM, et al. Microparticle photometry in a CMOS microsystem combining magnetic actuation and in situ optical detection. Sensors & Actuators: B Chemical. 2008;132(2):411-7.
144 Chiou PY, Ohta AT, Wu MC. Massively parallel manipulation of single cells and microparticles using optical images. Nature. 2005 Jul 21;436(7049):370-2.
145 Li Y, Dalton C, Crabtree HJ, Nilsson G, Kaler KV. Continuous dielectrophoretic cell separation microfluidic device. Lab Chip. 2007 Feb;7(2):239-48.
146 Voldman J. Electrical forces for microscale cell manipulation. 2006.
147 Griffin T, Mosbach K, Mosbach R. Magnetic biospecific affinity adsorbents for immunoglobulin and enzyme isolation. Applied Biochemistry and Biotechnology. 1981;6(4):283-92.
148 Miltenyi S, Muller W, Weichel W, Radbruch A. High gradient magnetic cell separation with MACS. Cytometry. 1990;11(2):231-8.
149 Hong R, Cima MJ, Weissleder R, Josephson L. Magnetic microparticle aggregation for viscosity determination by MR. Magn Reson Med. 2008 Mar;59(3):515-20.
150 Sinha A, Ganguly R, Puri IK. Magnetic separation from superparamagnetic particle suspensions. Journal of Magnetism and Magnetic Materials. 2009;321(14):2251-6.
151 Morozova TY, Morozov VN. Force differentiation in recognition of cross-reactive antigens by magnetic beads. Anal Biochem. 2008 Mar 15;374(2):263-71.
152 Hinterdorfer P, Baumgartner W, Gruber HJ, Schilcher K, Schindler H. Detection and localization of individual antibody-antigen recognition events by atomic force microscopy. Proc Natl Acad Sci U S A. 1996 Apr 16;93(8):3477-81.

88
Novel diagnostic microarray assay formats – towards comprehensive on-site analysis
153 Baumgartner W, Hinterdorfer P, Ness W, Raab A, Vestweber D, Schindler H, et al. Cadherin interaction probed by atomic force microscopy. Proc Natl Acad Sci U S A. 2000 Apr 11;97(8):4005-10.
154 Baumgartner W, Hinterdorfer P, Schindler H. Data analysis of interaction forces measured with the atomic force microscope. Ultramicroscopy. 2000 Feb;82(1-4):85-95.
155 Albrecht C, Blank K, Lalic-Multhaler M, Hirler S, Mai T, Gilbert I, et al. DNA: a programmable force sensor. Science. 2003 Jul 18;301(5631):367-70.
156 Blank K, Lankenau A, Mai T, Schiffmann S, Gilbert I, Hirler S, et al. Double-chip protein arrays: force-based multiplex sandwich immunoassays with increased specificity. Anal Bioanal Chem. 2004 Aug;379(7-8):974-81.
157 Blank K, Mai T, Gilbert I, Schiffmann S, Rankl J, Zivin R, et al. A force-based protein biochip. Proc Natl Acad Sci U S A. 2003 Sep 30;100(20):11356-60.
158 Gilbert I, Schiffmann S, Rubenwolf S, Jensen K, Mai T, Albrecht C, et al. Double chip protein arrays using recombinant single-chain Fv antibody fragments. Proteomics. 2004 May;4(5):1417-20.
159 Lee GU, Metzger S, Natesan M, Yanavich C, Dufrene YF. Implementation of force differentiation in the immunoassay. Anal Biochem. 2000 Dec 15;287(2):261-71.
160 Galli P, Cadoni G, Volante M, De Feo E, Amore R, Giorgio A, et al. A case-control study on the combined effects of p53 and p73 polymorphisms on head and neck cancer risk in an Italian population. BMC cancer. 2009;9(1):137.
161 Holmberg A, Blomstergren A, Nord O, Lukacs M, Lundeberg J, Uhlen M. The biotin-streptavidin interaction can be reversibly broken using water at elevated temperatures. Electrophoresis. 2005 Feb;26(3):501-10.
162 Kaller M, Hultin E, Holmberg K, Persson ML, Odeberg J, Lundeberg J, et al. Comparison of PrASE and Pyrosequencing for SNP Genotyping. BMC Genomics. 2006;7:291.
163 Meffre E, Wardemann H. B-cell tolerance checkpoints in health and autoimmunity. Curr Opin Immunol. 2008 Dec;20(6):632-8.
164 Goodnow CC. Multistep pathogenesis of autoimmune disease. Cell. 2007 Jul 13;130(1):25-35.

89
Jesper Gantelius
165 Nicholas R, Bashiruddin J, Ayling R, Miles R. Contagious bovine pleuropneumonia: a review of recent developments. Vet Bull. 2000;70:827-38.
166 Kusiluka LJM, Sudi FF. Review of successes and failures of contagious bovine pleuropneumonia control strategies in Tanzania. Preventive veterinary medicine. 2003;59(3):113-23.
167 Carter DJ, Cary RB. Lateral flow microarrays: a novel platform for rapid nucleic acid detection based on miniaturized lateral flow chromatography. Nucleic Acids Res. 2007;35(10):e74.
168 Nystrand M. A multiplexed immunoassay for the rapid detection of specific IgE in allergy diagnosis. IVD Technology. 2006;61.
169 Taussig MJ, Stoevesandt O, Borrebaeck CA, Bradbury AR, Cahill D, Cambillau C, et al. ProteomeBinders: planning a European resource of affinity reagents for analysis of the human proteome. Nat Methods. 2007 Jan;4(1):13-7.
170 Henn W. Whole-Genome Sequencing in Diagnostic Medicine: Too Much Information for Doctors and Patients? Transfus Med Hemother. 2009;36(4):280-1.
171 Perozziello G, Bundgaard F, Geschke O. Fluidic interconnections for microfluidic systems: A new integrated fluidic interconnection allowing plug ‘n’play functionality. Sensors & Actuators: B Chemical. 2008;130(2):947-53.
172 Zhang P, Dalton C, Jullien GA. Design and fabrication of MEMS-based microneedle arrays for medical applications. Microsystem Technologies. 2009;15(7):1073-82.
173 Sollier E, Rostaing H, Pouteau P, Fouillet Y, Achard JL. Passive microfluidic devices for plasma extraction from whole human blood. Sensors & Actuators: B Chemical. 2009.
174 Kim C, Lee K, Kim JH, Shin KS, Lee KJ, Kim TS, et al. A serial dilution microfluidic device using a ladder network generating logarithmic or linear concentrations. Lab on a Chip. 2008;8(3):473-9.
175 Beer NR, Wheeler EK, Lee-Houghton L, Watkins N, Nasarabadi S, Hebert N, et al. On-chip single-copy real-time reverse-transcription PCR in isolated picoliter droplets. Anal Chem. 2008 Mar 15;80(6):1854-8.

90
Novel diagnostic microarray assay formats – towards comprehensive on-site analysis
176 Joensson HN, Samuels ML, Brouzes ER, Medkova M, Uhlen M, Link DR, et al. Detection and analysis of low-abundance cell-surface biomarkers using enzymatic amplification in microfluidic droplets. Angew Chem Int Ed Engl. 2009;48(14):2518-21.
177 Myers FB, Lee LP. Innovations in optical microfluidic technologies for point-of-care diagnostics. Lab Chip. 2008 Dec;8(12):2015-31.
178 Uhlen M, Bjorling E, Agaton C, Szigyarto CA, Amini B, Andersen E, et al. A human protein atlas for normal and cancer tissues based on antibody proteomics. Mol Cell Proteomics. 2005 Dec;4(12):1920-32.
179 Ponten F, Jirstrom K, Uhlen M. The Human Protein Atlas--a tool for pathology. J Pathol. 2008 Dec;216(4):387-93.
180 Warsinke A. Point-of-care testing of proteins. Anal Bioanal Chem. 2009 Mar;393(5):1393-405.
181 Lu Y, Shi W, Qin J, Lin B. Low cost, portable detection of gold nanoparticle-labeled microfluidic immunoassay with camera cell phone. Electrophoresis. 2009 Feb;30(4):579-82.