Why do many retail investors buy SRI funds and why do others stay away from SRI?

1Roadshow back up_Mar 2013 1Presentation to investors_Nov 17
ATRESMEDIA
Presentation to investors
Nov 2017
www.atresmediacorporacion.com

2Roadshow back up_Mar 2013 2Presentation to investors_Nov 17
Advertising market in Spain
Gross Ad market Yoy growth
+0.6%
-2.2% -7.1%
Total Ad market+2.9%
9M17 in line yoy for the Total Ad market
+5.3%
+14.0%
Source: I2p (Arcemedia)
+0.4%+2.7%
+8.9%
-0.7%
-8.5%
-0.04%
2016 9M17
2016 9M17 2016 9M17 2016 9M17 2016 9M17 2016 9M17

3Roadshow back up_Mar 2013 3Presentation to investors_Nov 17
TV: Clear leadership
Spanish Ad spending by medium Share
Advertising market in Spain
Source: Infoadex
+0.4pp
+25.6pp
-23.9pp
-0.3pp
-1.8pp

4Roadshow back up_Mar 2013 4Presentation to investors_Nov 17
Source: Infoadex and Bank of Spain
Total & TV market vs GDP is bouncing back
Total & TV ad intensity (vs GDP)
Advertising market in Spain
0.72% 0.74%
0.54%
0.41%0.46%
0.29%0.32%
0.23%
0.16% 0.19%
2002 2003 2004 2005 2006 2007 2008 2009 2010 2011 2012 2013 2014 2015 2016
Total Ad market
TV Ad market
2002-15 avg=0.58%
(All-time average= 0.73%)
2003-15 avg= 0.24%
(All-time average= 0.29%)

5Roadshow back up_Mar 2013 5Presentation to investors_Nov 17
72%
27%
60%
88%
Source: Internal estimates & EGM. 2016 data
9.3
6.2
1.32.5
Spanish TV: Best cost-coverage mix
Cost-coverage by mediumIn €/1,000 impacts & % penetration
CPT
Coverage
Advertising market in Spain

6Roadshow back up_Mar 2013 6Presentation to investors_Nov 17
Positive outlook for household consumption & GDP
Spanish TV industry: Main drivers
-0.5%
-2.1%
1.4% 2.6% 3.0%
4.4%
3.7%
-1.9%
-1.1%
1.0%
3.7% 3.5%
4.3%3.9%
2012 2013 2014 2015 2016 2017e 2018e
Consumption
GDP
Forecast
Source: Funcas (Sep17). In current prices
Household Consumption & GDP Yoy growth

7Roadshow back up_Mar 2013 7Presentation to investors_Nov 17
Sustainable recovery from very low historical levels
Gross TV Ad market In € mill
Source: Infoadex
Spanish TV industry: Ad market
16%10% 8% 9%
-11%
-23%
4%
-10%
-19%
-6%
11%6% 6%
2,317
3,469
2,378 2,472
1,703 1,890
2,011 2,122
2003 2004 2005 2006 2007 2008 2009 2010 2011 2012 2013 2014 2015 2016
% yoy Gross TV Ad market
Average: 2,450
-13%
-39%
8Roadshow back up_Mar 2013 8Presentation to investors_Nov 17
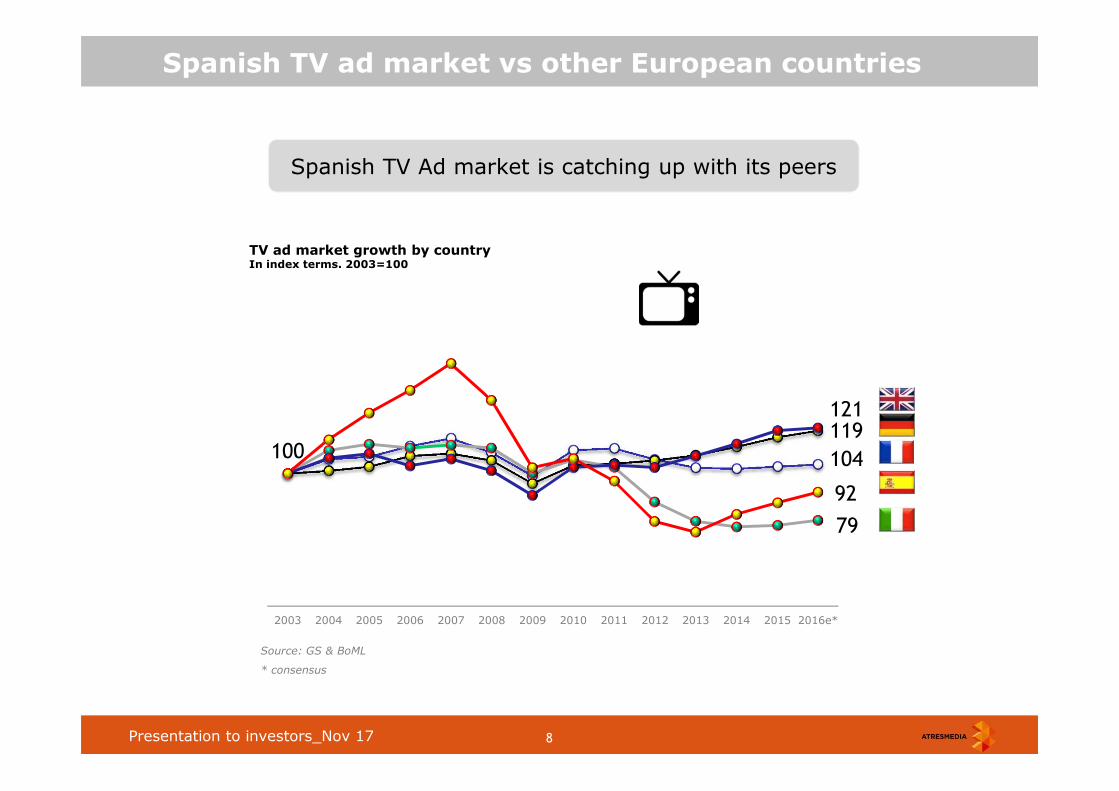
Spanish TV ad market vs other European countries
Source: GS & BoML
* consensus
104
119
79
121
100
92
2003 2004 2005 2006 2007 2008 2009 2010 2011 2012 2013 2014 2015 2016e*
Spanish TV Ad market is catching up with its peers
TV ad market growth by countryIn index terms. 2003=100

9Roadshow back up_Mar 2013 9Presentation to investors_Nov 17
Spanish TV industry: Ad market
Spanish TV Ad market: ≈Flat market in 2017
Gross TV Ad market Yoy growth
1%
-14%
-8%
-15%-18%
-15%
-24%-21%
-16%
-10%
-3%
6%
3%
8%
22%
13%12%
8%
3% 3%
6%
11%
1%3% 4%
-4%
3%
Q1 Q2 Q3 Q4 Q1 Q2 Q3 Q4 Q1 Q2 Q3 Q4 Q1 Q2 Q3 Q4 Q1 Q2 Q3 Q4 Q1 Q2 Q3 Q4 Q1 Q2 Q3
FY11=-10%
FY12=-19%
FY13=-6%
FY14=+11%
Source: Infoadex.
FY15=+6% FY16=+6%
9M17=+0.8%

10Roadshow back up_Mar 2013 10Presentation to investors_Nov 17
Source: Internal Estimates
9M17: High dispersion among sectors
Ad spending by sectors% 9M17 yoy
Beauty &Hygiene
Food Autos Telcos Retail Finance Health Others
-7%-4%
8%
4%
-9% -7%
12%
5%
11% 12% 14% 10% 9% 9% 6% Weight30%
9M17=+0.4%
Spanish TV industry: Ad market
(Energy, Beverages, Cleaning, Home,Sports & leisure…)
11Roadshow back up_Mar 2013 11Presentation to investors_Nov 17
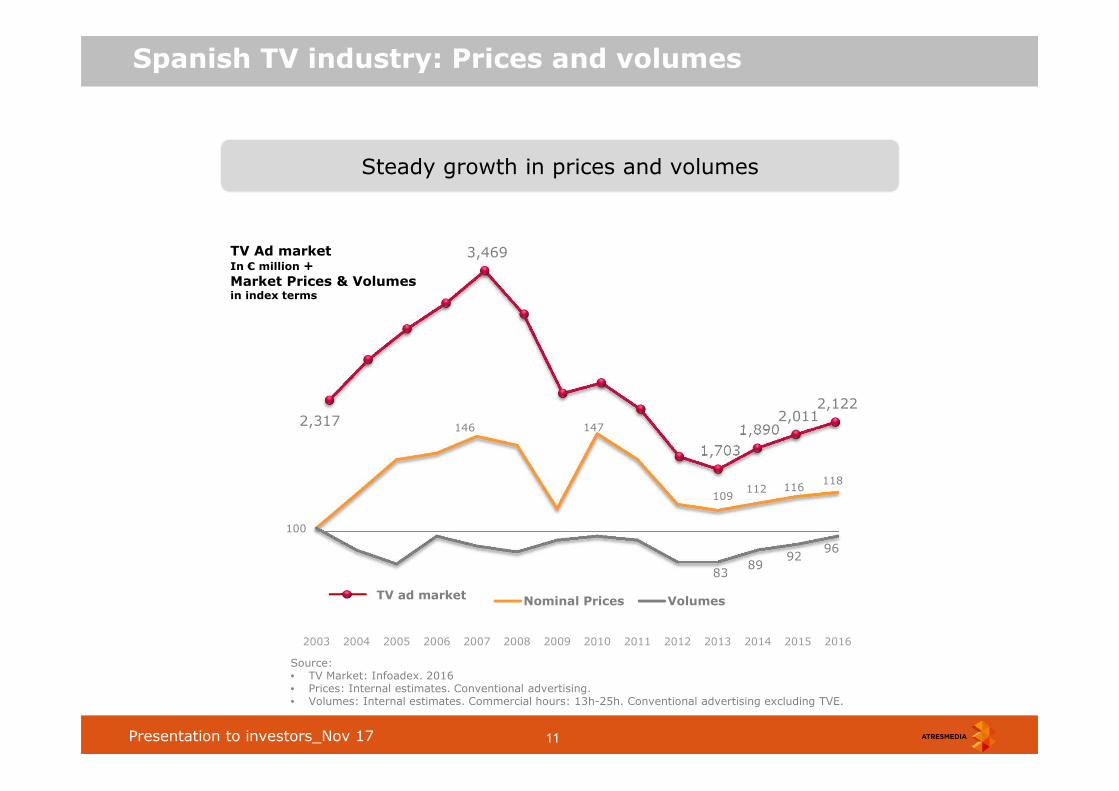
Source: • TV Market: Infoadex. 2016• Prices: Internal estimates. Conventional advertising. • Volumes: Internal estimates. Commercial hours: 13h-25h. Conventional advertising excluding TVE.
Steady growth in prices and volumes
2,317
3,469
1,703
1,890 2,011
2,122
100
146 147
109112 116
118
8389
9296
2003 2004 2005 2006 2007 2008 2009 2010 2011 2012 2013 2014 2015 2016
Nominal Prices Volumes
TV Ad marketIn € million +
Market Prices & Volumesin index terms
TV ad market
Spanish TV industry: Prices and volumes

12Roadshow back up_Mar 2013 12Presentation to investors_Nov 17
Source: Infoadex
Stable market shares by player
Market share evolution by playerAd Share
43.3%43.3%43.4%44.2%43.7%
41.9%42.1%42.1%41.5%42.6%
5.3%6.0%6.6%6.8%7.1%5.2%4.8%4.3%4.3%4.0%4.3%3.8%3.6%3.2%2.6%
9M172016201520142013
Advertising market in Spain
Forta
Other FTAs
Pay TVs

13Roadshow back up_Mar 2013 13Presentation to investors_Nov 17
Spanish TV industry: Commercial FTA landscape
Net TV
Commercial FTA TV landscape (9M17)
Veo TV
Atresmedia has a key position in a wide commercial FTA TV offer
Channels
13TV
Secuoya
Real
Madrid TV
Kiss TV
AudienceMkt share Power ratio
26.4%41.9% 1.6x
29.1%43.3% 1.5x
3.1%
2.8%
2.0%
5.2% 0.5x
Source: Kantar Media, Infoadex
0.4%
0.4%
0.9%

14Roadshow back up_Mar 2013 14Presentation to investors_Nov 17
Spanish TV industry : Pay TV
Pay TV position in Spain
Pay TV sector in Spain
Source: Kantar Media, Infoadex & CNMC
* 2016 data corresponds to 4Q16’s number of subscribers
Pay TV sector in Spain
Pay TV penetration (by CNMC)
Audience% Total Individuals 4+
Ad market share% Total TV ad market
7.0% 6.8% 6.2% 5.6% 6.2% 6.8% 7.0% 7.8%
27% 27%25%
23%
30%31%
33%
2.6% 2.7% 2.4% 2.6% 3.1% 3.6% 3.8% 4.3%
2010 2011 2012 2013 2014 2015 2016 9M17
*
15Roadshow back up_Mar 2013 15Presentation to investors_Nov 17
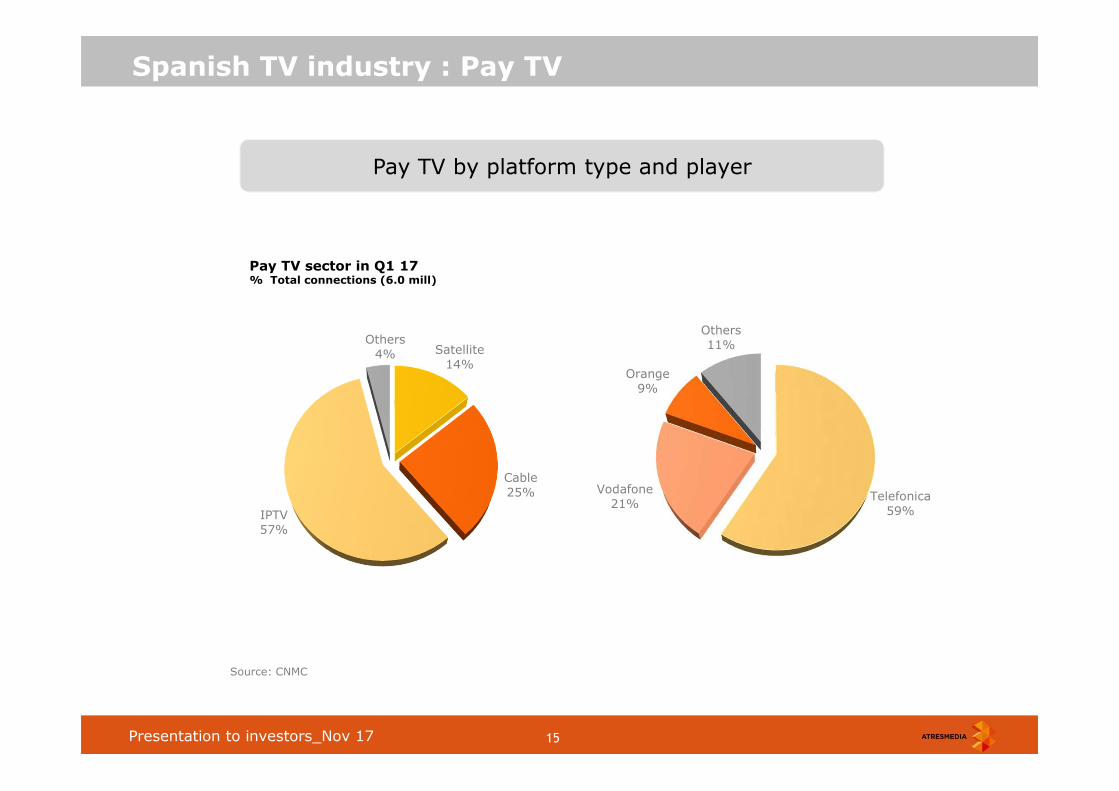
Spanish TV industry : Pay TV
Pay TV by platform type and player
Source: CNMC
Pay TV sector in Q1 17% Total connections (6.0 mill)
Satellite14%
Cable25%
IPTV57%
Others4%
Telefonica 59%
Vodafone 21%
Orange 9%
Others 11%

16Roadshow back up_Mar 2013 16Presentation to investors_Nov 17
Spanish TV industry : OTT TV
Source: Household panels. CNMC 2Q 17
OTT consumption is marginal
TV on demandQ2 17
18.4 mill households
15.9 millhouseholds
internet connected
4 millhouseholds
consume OTT
of which:
of which:
2.01 mill 0.41 mill1.16 mill
OTT
0.17 mill 0.13 mill0.19 mill
≈

17Roadshow back up_Mar 2013 17Presentation to investors_Nov 17
TV viewing
Source: Kantar Media. Non linear TV viewing includes +7 days viewing through TV set (TV viewing on desktops, tablet or mobile devices not included)
* Data from Feb 15
Average daily TV viewing In min
Linear TV viewing remains very strong
226 234 239 246 244 239 234 230
2009 2010 2011 2012 2013 2014 2015* 2016
Linear + Non linear
Linear237 233
87%
11%
1% 2%Online video
Linear TV
264 min2016
Average daily viewing In %
VoDTime shift
Source: Kantar Media & Comscore

18Roadshow back up_Mar 2013 18Presentation to investors_Nov 17
Average daily viewing In min
213233
Ind 4+
13 to 24
4 to 12
25 to 44
45 to 64
>65
TV viewing remains at very high levels
Source: Kantar Media
Age groups
Spanish TV industry: Audiences
230
Ind 4+ (+7 days)
351
302280
253
182191
126146
120143

19Roadshow back up_Mar 2013 19Presentation to investors_Nov 17
TV is by far the best media to reach brand awareness
Source: Kantar Media & Comscore Jan 17
Spanish TV vs Online Video Audiences
33.8
30.2
TV Top 5 onlinevideo platforms
In 1 day
In 1 month
Avg coverage in mill viewers
7.6
0.8
TV Video online
In 1 minute
Avg coverage in mill viewers

20Roadshow back up_Mar 2013 20Presentation to investors_Nov 17
Atresmedia: A leading communication group
Solid and clear group structure
OTHERS
ADVERTISING
Marketshare42%
Marketshare18%
Total Ad market
share19%

21Roadshow back up_Mar 2013 21Presentation to investors_Nov 17
TV & Radio as main source of revenues
Source: Infoadex & internal estimates
Atresmedia: Market positioning
ANTENA 3
NEOX
NOVA
Onda CeroEuropa FMOnda Melodía
Atresmedia CineAtresmedia Digital
Atresmedia Diversification
Radio
Others
TV
Planeta-De Agostini:RTL:Imagina:Treasury stock:Free-float:
41.7%18.7%4.1%0.4%
35.2%
89%
8%
3%
LA SEXTA
MEGAATRESERIES
2016 Net
Revenues
€ 1,021m92%
8%
Revenues by division Revenues by origin
Non ad revenues
Ad revenues2016 Net
Revenues
€ 1,021m

22Roadshow back up_Mar 2013 22Presentation to investors_Nov 17
In 2016, Total revenues and TV revenues higher than ever
Atresmedia’s Total Net Revenues & TV Net RevenuesIn € mill
Source: Atresmedia’s financial statements
Spanish TV industry: Ad market
668
1,016
704 741
1,021
539
879
604 639
909
2003 2004 2005 2006 2007 2008 2009 2010 2011 2012 2013 2014 2015 2016
23Roadshow back up_Mar 2013 23Presentation to investors_Nov 17
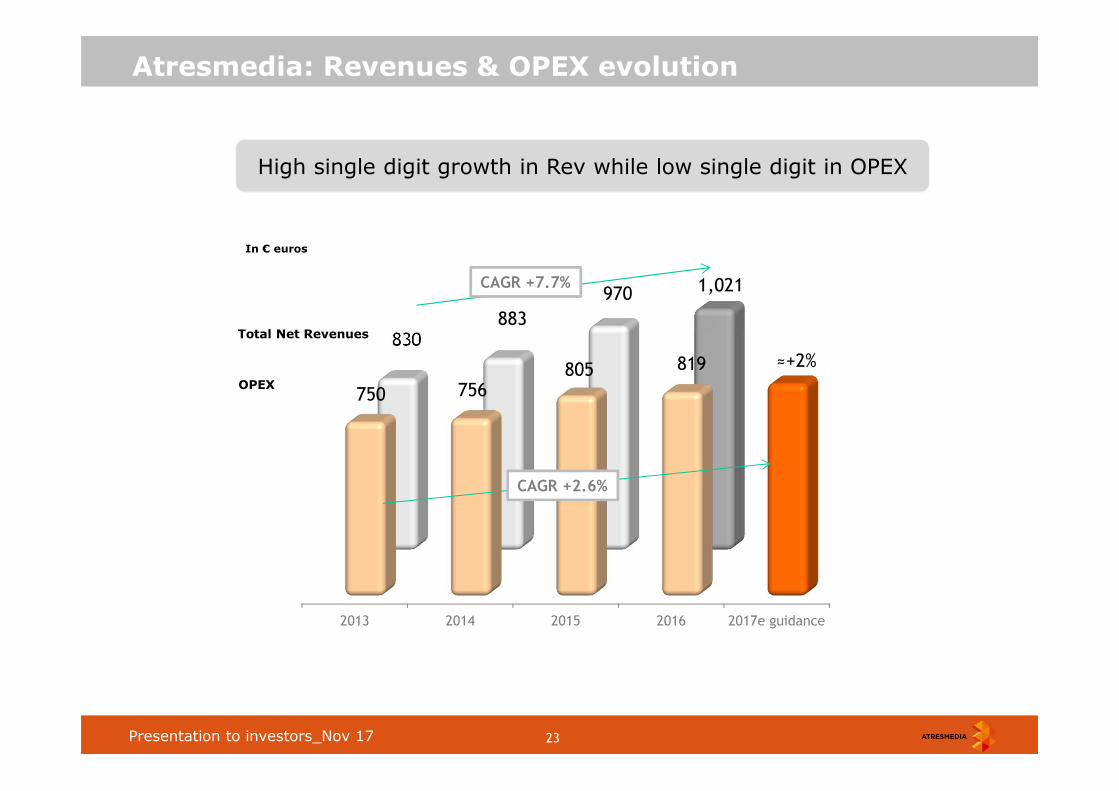
830883
970 1,021
High single digit growth in Rev while low single digit in OPEX
2013 2014 2015 2016 2017e guidance
750 756805 819 ≈+2%
Atresmedia: Revenues & OPEX evolution
CAGR +2.6%
Total Net Revenues
CAGR +7.7%
OPEX
In € euros

24Roadshow back up_Mar 2013 24Presentation to investors_Nov 17
65% of ∆ rev drops at the EBITDA
Atresmedia’s operating leverageIn € mill
2013 Revenue 2013 EBITDA 2016 EBITDA 2016 Revenue
830
80
≈65%operating leverage
202
1,021
Atresmedia: Operating leverage
+191 mill rev
+122 mill EBITDA

25Roadshow back up_Mar 2013 25Presentation to investors_Nov 17
Balanced and varied TV offer
Atresmedia Television: Positioning
Male Female
55-64
4-12
Age
9M17
2.1%
1.8%
1.1%
26.4%
2.4%
6.4%
12.4%
26Roadshow back up_Mar 2013 26Presentation to investors_Nov 17
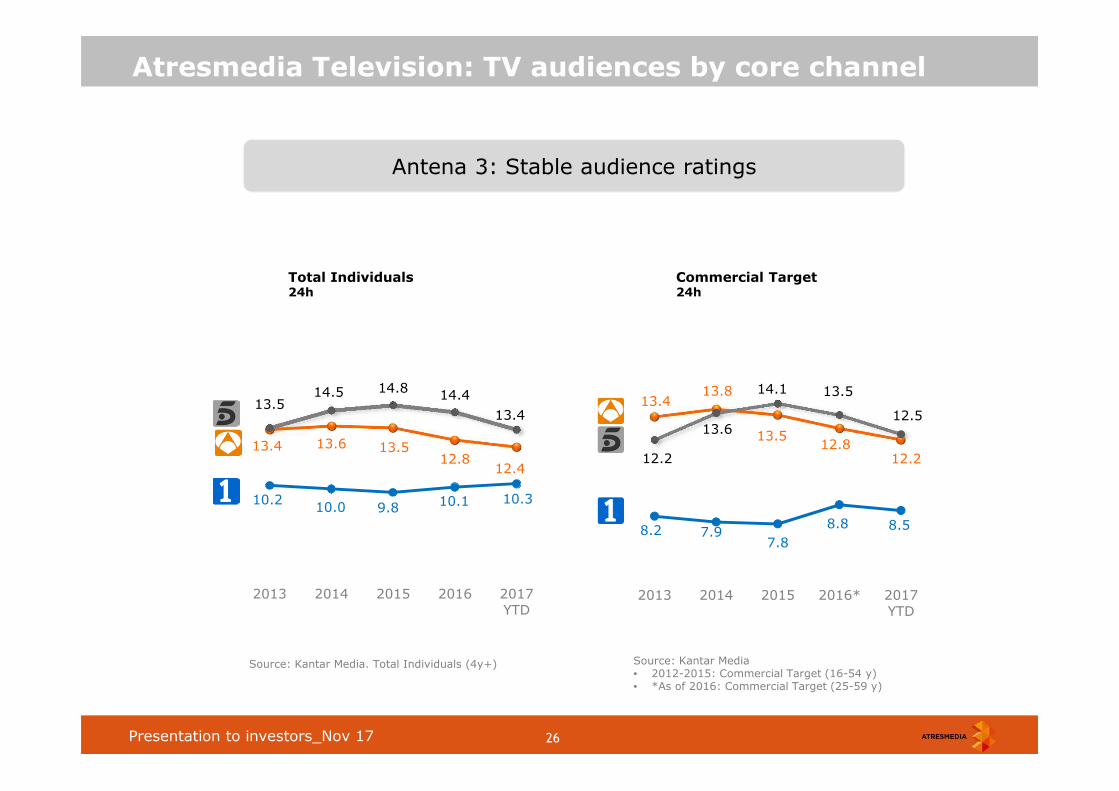
13.4 13.6 13.512.8
12.4
13.514.5 14.8
14.4
13.4
10.210.0 9.8 10.1 10.3
2013 2014 2015 2016 2017YTD
13.413.8
13.512.8
12.212.2
13.6
14.1 13.5
12.5
8.2 7.97.8
8.8 8.5
2013 2014 2015 2016* 2017YTD
Antena 3: Stable audience ratings
Total Individuals24h
Commercial Target24h
Source: Kantar Media. Total Individuals (4y+)
Atresmedia Television: TV audiences by core channel
Source: Kantar Media• 2012-2015: Commercial Target (16-54 y)• *As of 2016: Commercial Target (25-59 y)

27Roadshow back up_Mar 2013 27Presentation to investors_Nov 17
6.0
7.2 7.47.1 6.6
6.0
6.7
7.2
6.56.2
8.5
7.87.3 7.2 7.2
2013 2014 2015 2016 2017YTD
6.6
7.9 8.1
8.1
7.37.4
8.2 8.4
7.6 7.2
5.8
5.2
4.8
5.35.6
2013 2014 2015 2016* 2017YTD
La Sexta: Leading Commercial Target
Total Individuals24h
Commercial Target24h
Source: Kantar Media. Total Individuals (4y+)
Atresmedia Television: TV audiences by second channel
Source: Kantar Media• 2012-2015: Commercial Target (16-54 y)• *As of 2016: Commercial Target (25-59 y)

28Roadshow back up_Mar 2013 28Presentation to investors_Nov 17
16.7 16.7 16.7 16.8 16.6
29.030.7 31.0
30.228.9
28.8 27.7 26.8 27.1 26.5
2013 2014 2015 2016 2017YTD
13.8 13.6 13.4 14.4 13.6
31.433.3 33.6
31.030.1
31.030.0 29.2 29.7
28.6
2013 2014 2015 2016* 2017YTD
Atresmedia TV: Solid ratings despite competing withless channels since 2014
Total Individuals24h
Commercial Target24h
Source: Kantar Media. Total Individuals (4y+)
Atresmedia Television: TV group audiences
Source: Kantar Media• 2012-2015: Commercial Target (16-54 y)• * As of 2016: Commercial Target (25-59 y)

29Roadshow back up_Mar 2013 29Presentation to investors_Nov 17
Audience: In-house vs external production
90% of most viewed contents are in-house, excl. sports
In-house 56%
3rd parties
44%
In-house vs externalTop 50 programmes (2016)
In-house 90%
3rd parties
10%
Including sports Excluding sports

30Roadshow back up_Mar 2013 30Presentation to investors_Nov 17
Programming costs: In-house vs external production
In-house 25%
3rd parties
75%
2/3 of the programming costs are internally produced
In-house 75%
3rd parties
25%
In-house vs external programming costsIn broadcasting hours
In-
house
64%
3rd parties
36%
Weighted average(based on audience per channel)

31Roadshow back up_Mar 2013 31Presentation to investors_Nov 17
Programming costs: In-house production
Direct sales to Broadcasters
In-house production: Velvet, a case study
FTA TV
Online
>100 countries
Atresmedia’s seriesReleased in 20144 seasons to date54 episodes
Production company:Bambú Producciones
Plot summary: Lovestories around GaleríasVelvet, one of the mostprestigious fashionstores in the Spain ofthe late 1950s.
Atresmedia’sPay TV channels
>24mill potential
households
3.8 mill viewers avg20.9% audience (+4 yrs)
>20 mill videos downloaded

32Roadshow back up_Mar 2013 32Presentation to investors_Nov 17
Atresmedia Radio: 18% market share
Atresmedia Radio: Positioning & Strategy
# 3 talk radio1.9 mill listeners
# 3 music radio1.9 mill listeners
#3 radio player in Spain
4.1 million listeners
18% market share
Source: EGM Q2 17 yearly averageMarket Share: Infoadex & internal estimates
New music radio
298k listeners

33Roadshow back up_Mar 2013 33Presentation to investors_Nov 17
Sound recovery from 2013 levels but still far behind fromaverage and peak levels
Gross Radio Ad market In € mill
Source: Infoadex
Spanish Radio industry: Ad market
6%13%
4% 7%
-5%
-16%
2%
-4%
-14% -11%
4%8%
1%
508
678
537 549
404 420
454 458
2003 2004 2005 2006 2007 2008 2009 2010 2011 2012 2013 2014 2015 2016
% yoy Gross Radio Ad market
Average: 530
-14%
-32%

34Roadshow back up_Mar 2013 34Presentation to investors_Nov 17
Atresmedia Radio: 4.1 million listeners
Atresmedia Radio: Audiences
Source: EGM Surveys Monday to Friday (.000) ( Moving average).
Thousand of listeners
4,954 4,8374,552
4,3194,119 4,153 4,106 4,091
2,662 2,6032,368
2,136
1,902 1,920 1,910
1,922
2,024 1,981 1,954 1,943
1,943 1,947 1,912
1,871
268 253 230 240 274 286 284 298
1st 15 2nd 15 3rd 15 1st 16 2nd 16 3rd 16 1st 17 2nd 17
35Roadshow back up_Mar 2013 35Presentation to investors_Nov 17
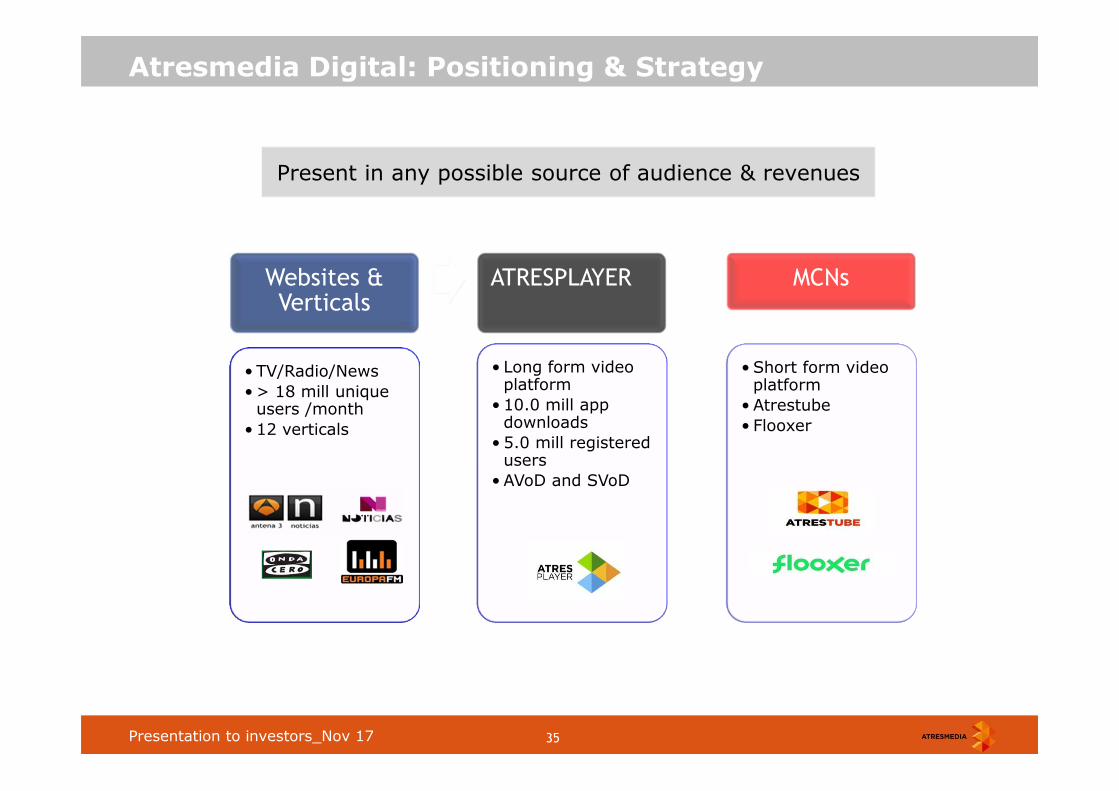
Atresmedia Digital: Positioning & Strategy
Websites & Verticals
• TV/Radio/News• > 18 mill unique
users /month• 12 verticals
ATRESPLAYER
• Long form video platform
• 10.0 mill app downloads
• 5.0 mill registeredusers
• AVoD and SVoD
MCNs
• Short form video platform
• Atrestube• Flooxer
Present in any possible source of audience & revenues

36Roadshow back up_Mar 2013 36Presentation to investors_Nov 17
Atresmedia Digital
Source: ComScore
7.9
9.6
12.2
2015
2014
+54%
Top 100 Spain Ranking(Monthly avg)
Source: ComScore 100 top properties MPMMX
#29th
#17th#11th
#11th
2013 2014 2015
4.3 mill uu
7.7 mill uu
9.6 mill uu
Unique users(Monthly avg)
Sound growth in unique users yoy
12.2 mill uu
2016
2016

37Roadshow back up_Mar 2013 37Presentation to investors_Nov 17
Atresmedia Digital: Atresplayer
Atresplayer: Atresmedia’s OTT offer

38Roadshow back up_Mar 2013 38Presentation to investors_Nov 17
Developing new non ad-based media initiatives
Atresmedia Diversification: Positioning & Strategy

39Roadshow back up_Mar 2013 39Presentation to investors_Nov 17
Atresmedia Diversification: International
≈19
x2.7
≈51
1422
5
20
9
9M 14 9M17
In mill suscribers
International division increased penetration by x2.7 in 3 years
40Roadshow back up_Mar 2013 40Presentation to investors_Nov 17
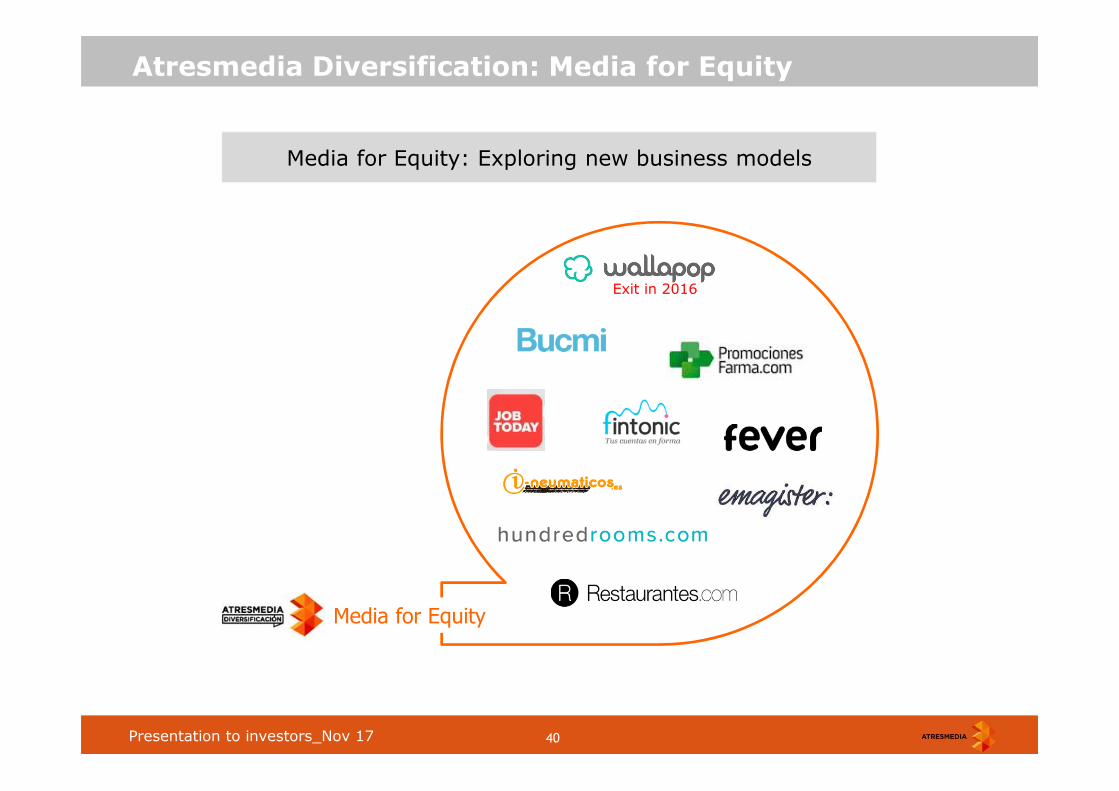
Atresmedia Diversification: Media for Equity
Media for Equity: Exploring new business models
Media for Equity
Exit in 2016

41Roadshow back up_Mar 2013 41Presentation to investors_Nov 17
Medium term goals: TV & Radio
Television and Radio’s EBITDA margin on track
EBITDA Margin EBITDA Margin
2013
404
Market Gross Ad revenues (€ mill) & EBITDA Margin
2013
1,703
2014
1,890
7%15%
17%19%
25%
2014
420
21%22%
24% 24%27%
Source: Infoadex & Atresmedia’s financial results
2015
2,0112015
454
≈2,400
/2,500 ≈500/
5252016
2,122 2016
458

42Roadshow back up_Mar 2013 42Presentation to investors_Nov 17
Other non-ad based revenues to double
≈10%
2017
≈5%
2014
x2
Medium term goals: Other revenues
≈7%
2015
Non-Ad revenuesas % of Total Revenues
≈8%
2016

43Roadshow back up_Mar 2013 43Presentation to investors_Nov 17
Debt at target level and dividend policy according to plan
Dividend policyTotal Net Debt Target (€ mill)
€ 150 mill
Payout ratio ≥80%185
134
158
179
148
2014 dividend: 0.20 €/sh96% payout ratio
2015 dividend: 0.36 €/sh82% payout ratio
2016 dividend: 0.92 €/sh100% payout ratio
• Ordinary: 0.47 €/sh- 0.22 €/sh (dec-16)- 0.25 €/sh (jun-17)
• Special: 0.45 €/sh- 0.45 €/sh (dec-17)
Long termtarget
Medium term goals: Financials
44Roadshow back up_Mar 2013 44Presentation to investors_Nov 17
Back up: 2016 & 9M17 Financial Results
Back up

45Roadshow back up_Mar 2013 45Presentation to investors_Nov 17
Net Revenues 1,021.1 970,2
EBITDA 202.0 165.7
Net profit 129.1 99.2
FY16 FY15
+5.2%
+21.9%
YoY
+30.1%
OPEX 819.1 804.5 +1.8%
Atresmedia
2016 Results in € mill: P&L
EBITDA Margin 19.8% 17.1%
Net profit Margin 12.6% 10.2%
Source: Atresmedia’s financial statements
EBIT 184.4 144.6 +27.6%
EBIT Margin 18.1% 14.9%

46Roadshow back up_Mar 2013 46Presentation to investors_Nov 17
Total Net Rev. 909.5 857.4
EBITDA 169.4 133.5
EBIT 154.1 118.7
FY 16 FY 15
+6.1%
+26.9%
YoY
+29.7%
OPEX 740.2 723.9 +2.2%
Atresmedia Television
FY16 Results in € mill: P&L
EBITDA Margin 18.6% 15.6%
EBIT Margin 16.9% 13.8%
Source: Atresmedia`s financial statements

47Roadshow back up_Mar 2013 47Presentation to investors_Nov 17
Net Revenues 82.2 89.9
EBITDA 19.7 21.8
EBIT 17.7 20.0
FY 16 FY 15
-8.6%
-9.8%
YoY
-11.1%
OPEX 62.5 68.0 -8.2%
Atresmedia Radio
FY 16 Results in € mill: P&L
EBITDA Margin 24.0% 24.3%
EBIT Margin 21.6% 22.2%
Source: Atresmedia’s financial statements

48Roadshow back up_Mar 2013 48Presentation to investors_Nov 17
Financials
Contribution to consolidated group
Atresmedia: “Others” Division
Net Revenues 29.4
EBITDA 12.9
FY 16 FY 15€ mill
22.9
10.4
Net revenues split
Source: Atresmedia’s financial statements
Others* 56%Films
23%
Events 21%
*Others (Internet, Editorial, new initiatives…)
OPEX 16.5 12.6

49Roadshow back up_Mar 2013 49Presentation to investors_Nov 17
Net Revenues 755.1 740.2
EBITDA 148.6 151.5
Net profit 103.5 101.5
9M 17 9M 16
+2.0%
-1.9%
YoY
+1.9%
OPEX 606.5 588.7 +3.0%
Atresmedia
9M 17 Results in € mill: P&L
EBITDA Margin 19.7% 20.5%
Net profit Margin 13.7% 13.7%
Source: Atresmedia’s financial statements
EBIT 135.6 138.1 -1.8%
EBIT Margin 18.0% 18.7%

50Roadshow back up_Mar 2013 50Presentation to investors_Nov 17
Total Net Rev. 664.9 661.0
EBITDA 127.0 128.9
EBIT 116.0 117.3
9M 17 9M 16
+0.6%
-1.4%
YoY
-1.2%
OPEX 537.8 532.1 +1.1%
Atresmedia Television
9M 17 Results in € mill: P&L
EBITDA Margin 19.1% 19.5%
EBIT Margin 17.4% 17.8%
Source: Atresmedia`s financial statements

51Roadshow back up_Mar 2013 51Presentation to investors_Nov 17
Net Revenues 60.0 58.8
EBITDA 12.1 14.6
EBIT 10.5 13.1
9M 17 9M 16
+2.2%
-17.2%
YoY
-19.6%
OPEX 48.0 44.2 +8.6%
Atresmedia Radio
9M 17 Results in € mill: P&L
EBITDA Margin 20.1% 24.8%
EBIT Margin 17.5% 22.3%
Source: Atresmedia’s financial statements
52Roadshow back up_Mar 2013 52Presentation to investors_Nov 17
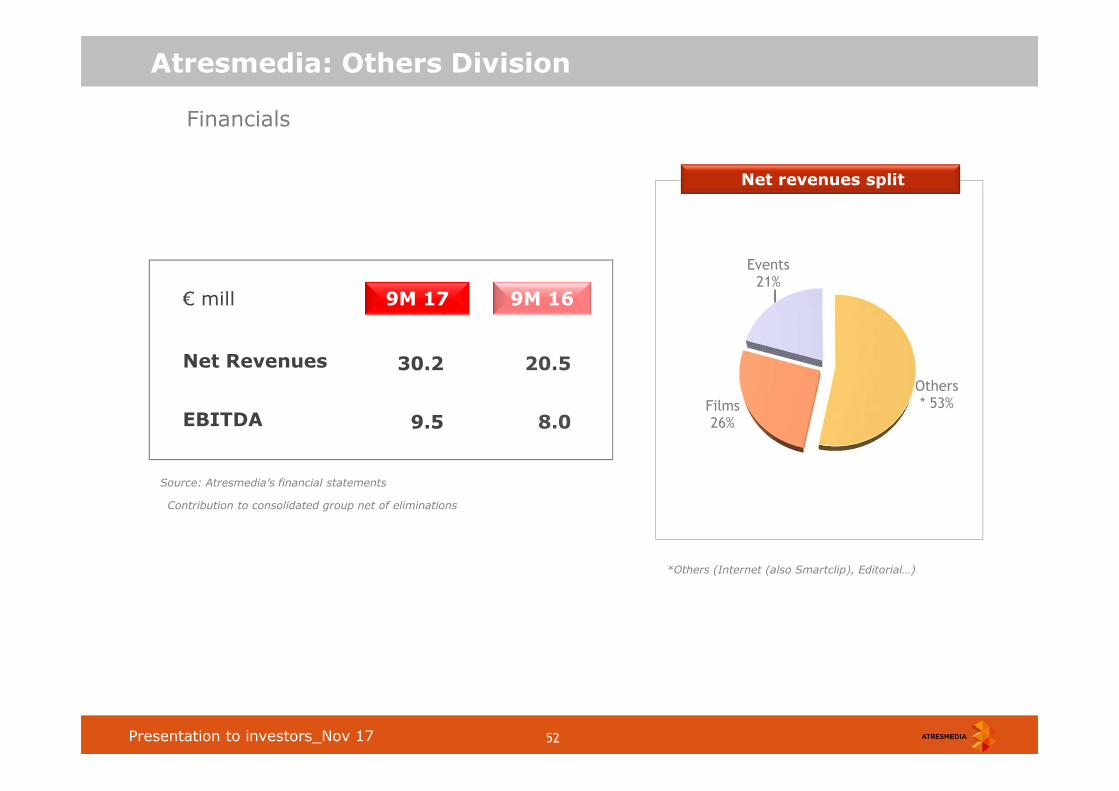
Financials
Contribution to consolidated group net of eliminations
Atresmedia: Others Division
Net Revenues 30.2
EBITDA 9.5
9M 17 9M 16€ mill
20.5
8.0
Net revenues split
Source: Atresmedia’s financial statements
Others* 53%Films
26%
Events 21%
*Others (Internet (also Smartclip), Editorial…)

53Roadshow back up_Mar 2013 53Presentation to investors_Nov 17
Legal Notice
The information contained in this presentation has not been independently verified and is, in any case, subject to
negotiation, changes and modifications.
None of the Company, its shareholders or any of their respective affiliates shall be liable for the accuracy or completeness
of the information or statements included in this presentation, and in no event may its content be construed as any type of
explicit or implicit representation or warranty made by the Company, its shareholders or any other such person. Likewise,
none of the Company, its shareholders or any of their respective affiliates shall be liable in any respect whatsoever
(whether in negligence or otherwise) for any loss or damage that may arise from the use of this presentation or of any
content therein or otherwise arising in connection with the information contained in this presentation. You may not copy or
distribute this presentation to any person.
The Company does not undertake to publish any possible modifications or revisions of the information, data or statements
contained herein should there be any change in the strategy or intentions of the Company, or occurrence of unforeseeable
facts or events that affect the Company’s strategy or intentions.
This presentation may contain forward-looking statements with respect to the business, investments, financial condition,
results of operations, dividends, strategy, plans and objectives of the Company. By their nature, forward-looking
statements involve risk and uncertainty because they reflect the Company’s current expectations and assumptions as to
future events and circumstances that may not prove accurate. A number of factors, including political, economic and
regulatory developments in Spain and the European Union, could cause actual results and developments to differ materially
from those expressed or implied in any forward-looking statements contained herein.
The information contained in this presentation does not constitute an offer or invitation to purchase or subscribe for any
ordinary shares, and neither it nor any part of it shall form the basis of or be relied upon in connection with any contract or
commitment whatsoever.
Investor Relations Department
Additional information
Phone: +34 91 623 46 14
E-mail: [email protected]
Web: www.atresmediacorporacion.com