Notes Saim
57
Unit-1 Introduction Indian Stock Markets ar e one of the oldest in Asia. Its history dates back to nearly 200 years ago. The earliest r ecords o f security dea lings in Ind ia are meag er and obscure. The East India Company as the dominant institution in those days and business in its loan securities used to be transacted toards the close of the eighteenth century. !y "#$0%s business on corporate stocks and shares in !ank and Cotton presses took place in !ombay. Though the trading list as broader in "#$&' there ere only half a do(en brokers recogni(ed by banks and merchants during "#)0 and "#*0. The "#*0%s itnessed a ra pid de+elopment o f commerc ial enterprise a nd bro kerage bu siness attracted many men into the ,eld and by "#-0 the number of brokers increased into -0. In "#-0-" the American Ci+il /ar broke out and cotton supply from nited States of Europe as stopped1 thus' the %Share Mania% in India begun. The number of brokers increased to about 200 to 2*0. oe+er' at the end of the American Ci+il /ar' in "#-*' a disastrous slump began 3for e4ample' !ank of !ombay Share hich had touched 5s 2#*0 could only be sold at 5s. #67. At the end of the American Ci+il /ar' the brokers ho thri+ed out of Ci+il /ar in "#6)' found a place in a street 3no appropriately called as 8alal Street7 here they ould con+eniently assemble and transact business. In "##6' they formally established in !ombay' the 9:ati+e Share and Stock !rokers% Association9 3hich is alternati+ely knon as 9 The Stock E4change 97. In "#&*' the Stock E4change ac;uired a premise in the same street and it as inaugurated in "#&&. Thus' the St ock E4chan ge at !ombay as consolidated. Structure of Capital Market in India Securities market / Stock Market
-
Upload
nishant-sharma -
Category
Documents
-
view
233 -
download
1
Transcript of Notes Saim
8/17/2019 Notes Saim
http://slidepdf.com/reader/full/notes-saim 1/57
Unit-1
Introduction
Indian Stock Markets are one of the oldest in Asia. Its history dates back to nearly 200 years ago.
The earliest records of security dealings in India are meager and obscure. The East India
Company as the dominant institution in those days and business in its loan securities used to
be transacted toards the close of the eighteenth century.
!y "#$0%s business on corporate stocks and shares in !ank and Cotton presses took place in
!ombay. Though the trading list as broader in "#$&' there ere only half a do(en brokers
recogni(ed by banks and merchants during "#)0 and "#*0.
The "#*0%s itnessed a rapid de+elopment of commercial enterprise and brokerage business
attracted many men into the ,eld and by "#-0 the number of brokers increased into -0.
In "#-0-" the American Ci+il /ar broke out and cotton supply from nited States of Europe as
stopped1 thus' the %Share Mania% in India begun. The number of brokers increased to about 200 to
2*0. oe+er' at the end of the American Ci+il /ar' in "#-*' a disastrous slump began 3for
e4ample' !ank of !ombay Share hich had touched 5s 2#*0 could only be sold at 5s. #67.
At the end of the American Ci+il /ar' the brokers ho thri+ed out of Ci+il /ar in "#6)' found a
place in a street 3no appropriately called as 8alal Street7 here they ould con+eniently
assemble and transact business. In "##6' they formally established in !ombay' the 9:ati+e Share
and Stock !rokers% Association9 3hich is alternati+ely knon as 9 The Stock E4change 97. In
"#&*' the Stock E4change ac;uired a premise in the same street and it as inaugurated in "#&&.
Thus' the Stock E4change at !ombay as consolidated.
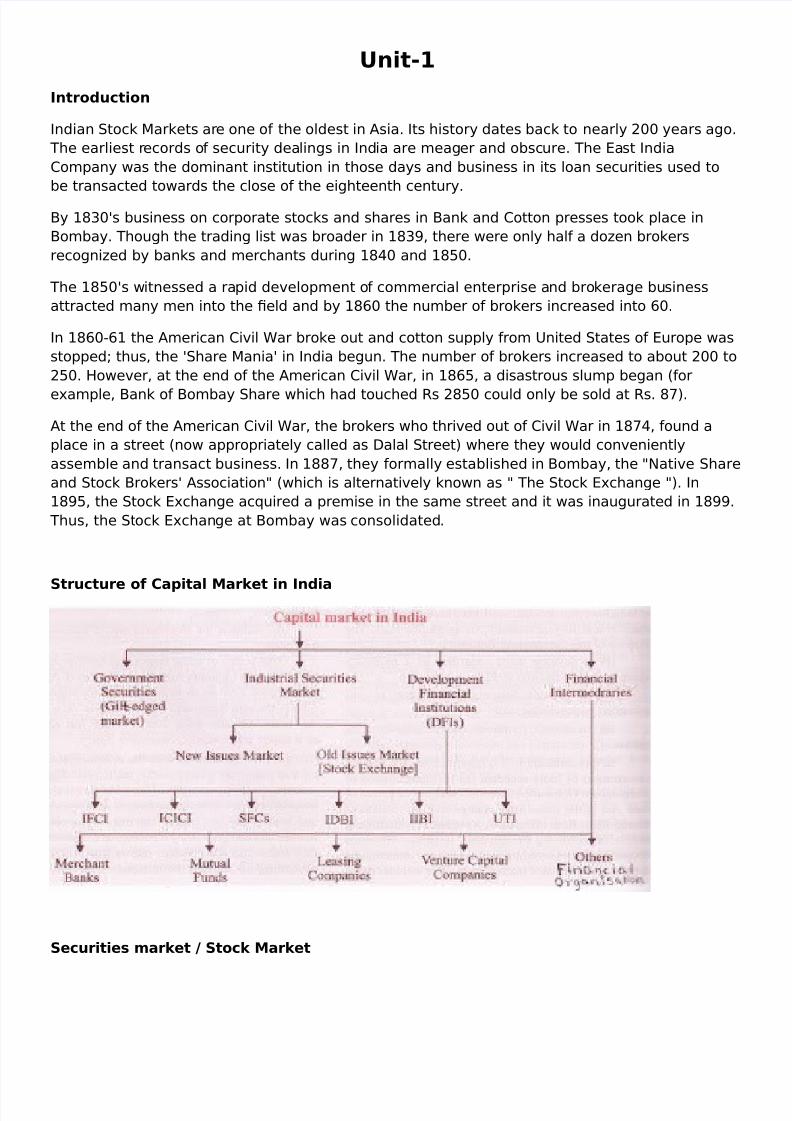
Structure of Capital Market in India
Securities market / Stock Market
8/17/2019 Notes Saim
http://slidepdf.com/reader/full/notes-saim 2/57
8/17/2019 Notes Saim
http://slidepdf.com/reader/full/notes-saim 3/57
Profit sharing
Both casual and professional stock investors, as large as institutional investors or as small as an ordinarymiddle(class family, through dividends and stock price increases that may result in capital gains, share in thewealth of profitable businesses. nprofitable and troubled businesses may result in capital losses forshareholders.Corporate governance
By having a wide and varied scope of owners, companies generally tend to improve management standards andefficiency to satisfy the demands of these shareholders, and the more stringent rules for public corporationsimposed by public stock exchanges and the government. )onse*uently, it is alleged that public companies!companies that are owned by shareholders who are members of the general public and trade shares on publicexchanges% tend to have better management records than privately held companies !those companies whereshares are not publicly traded, often owned by the company founders and-or their families and heirs, orotherwise by a small group of investors%.Creating investment opportunities for small investors
+s opposed to other businesses that re*uire huge capital outlay, investing in shares is open to both the large andsmall stock investors because a person buys the number of shares they can afford. Therefore the Stock
Exchange provides the opportunity for small investors to own shares of the same companies as large investors.
Levels of securities market
Primary market
The primary market s that part of the capital markets that deals with the issue of new securities. )ompanies,governments or public sector institutions can obtain funding through the sale of a new stock or bond issue. Thisis typically done through a syndicate of securities dealers. The process of selling new issues to investors is
called underwriting. "n the case of a new stock issue, this sale is a public offering. ealers earn a commissionthat is built into the price of the security offering, though it can be found in the prospectus. #rimary marketscreates long term instruments through which corporate entities borrow from capital market.
Features of primary markets are:
• This is the market for new long term e*uity capital. The primary market is the market where the
securities are sold for the first time. Therefore it is also called the new issue market !/"M%.• "n a primary issue, the securities are issued by the company directly to investors.
• The company receives the money and issues new security certificates to the investors.
• #rimary issues are used by companies for the purpose of setting up new business or for expanding or
moderni&ing the existing business.
• The primary market performs the crucial function of facilitating capital formation in the economy.• The new issue market does not include certain other sources of new long term external finance, such as
loans from financial institutions. Borrowers in the new issue market may be raising capital forconverting private capital into public capital0 this is known as 1going public.1
Primary market Primary Functions
1 !ri"ination- #eals $it% !ri"in of ne$ Issue &%e proposal is analy'ed in terms of
t%e nature of t%e security( t%e si'e of t%e issue( time of t%e issue and )oatation
met%od of t%e issue
8/17/2019 Notes Saim
http://slidepdf.com/reader/full/notes-saim 4/57
* Under$ritin"- Contract +et$een Issuin" Company and Under$riter Under$riter
"ives assurance t%at( in case investor $ill not su,scri,e minimum num,er of s%are
t%en t%ey $ill su,scri,e &%ey also increases Investor condence
. #istri,ution-
• ?ublic ?lacement• ?ri+ate ?lacement•
5ight Issue• @=er of Sale
Primary market Secondary Functions1 &o promote a ne$ company* &o %elp to epand a ne$ company. &o %elp in diversication of t%e product0 &o c%anneli'e t%e savin"s of t%e investors &o %elp t%e companies to raise capital2 &o %elp t%e secondary market in %elpin" in tradin" of t%e securities
Participant in Primary Market
1 Mana"er to t%e issue-• Construction of the prospectus.• Appointment of the registrar• Appointment of the banker• Appointment of the underriter.• !udget for the Issue* Re"istrar to t%e issue-• 5ecei+e the share application from +arious collection centers.• 5ecommend the basis of allotment• 8ispatching the share certi,cates•
Share allocation• Appro+al of the prospectus.. Under$riter0 +anker to t%e issue• Collection of the application form and application money• Takes commission beside brokerage.• May be a ,nancial institution or a bank or a :!C. 3dvertisin" 3"encies-Prepare 3dvertisement and promote t%e companies Issue in various media2 &%e nancial Institution4enerally under$rite t%e issues of t%e companies
Primary market Secondary market Relationthe new issue Market and stock exchanges are inseparably connected2
3. The securities issued in the /ew "ssue Market are invariably listed on a recognised stock exchange,subse*uent to their issue. This is of immense utility to potential investors who feel assured that should theyreceive an allotment of new issues, they will subse*uently be able to dispose them of at any time. The facilities provided by the secondary markets, thus, widen the initial market for them.
4. Secondly, the stock exchanges exercise considerable control over the organisation of new issues. "n terms ofthe regulatory framework relating to dealings in securities, new issues, which seek stock exchange *uotation
8/17/2019 Notes Saim
http://slidepdf.com/reader/full/notes-saim 5/57
have to comply with statutory rules as well as regulations framed by the stock exchanges with the ob5ect ofensuring fair dealings in them.
6. 7undamentally, the markets for new and old securities are, economically, an integral part of a single marketthe industrial securities market. Thus they are susceptible to common influence and act and react upon eachother. Broadly, new issues increase when stock values are rising and vice versa.
+lso, the *uantitative predominance of old securities in the market usually ensures that it is these which set the
tone of the market as a whole and govern the prices and acceptability of new issues.
Thus, we see that the capital market, with particular reference to company scraps, performs two distinctfunctions providing funds for trading in existing securities and funds for fresh issues of capital by thecompanies either through public issue or right issue or by private placement.
hile in many respects, the market mechanism for capital markets is the same as for commodities, there is afundamental difference that renders the former more complex, i.e. in the case of an ordinary commodity, it may be bought or sold several times, but it is used up in consumption after some time. "n the case of the capitalmarket nothing is consumed away.Every year there is new supply and so the cumulative total of funds dealt with goes on rising and the /ew "ssue
Market provides a common ground for facilitating this transfer process of funds from the suppliers !comprisinginvestors, individual, corporate and institutional% to the companies attempting to raise fresh capital.The exact amount available for investment in a particular company, however, depends on macro factors like rateof growth of the economy, total money supply, savings potential and the marginal propensity to save0 and microfactors like performance of a particular class of companies, facilities available for li*uidation of investment andthe individual preference of an investor, etc.
Primary market Secondary market #i5erences". In the ,rst place' :e Issue Market deals ith Bne securities' i.e. securities hich ere
not pre+iously a+ailable and are o=ered to the in+esting public for the ,rst time. Themarket' therefore' deri+es its name from the fact that it makes a+ailable a ne block ofsecurities for public subscription.
2. The stock market on the other hand' is a market for Bold securities i.e. those hich ha+ealready been issued and ha+e been granted stock e4change listing. These are purchasedand sold continuously among in+estors ithout in+ol+ement of the companies hosesecurities constitute the stockintrade e4cept in the strictly limited sense of ha+ing toregister the transfer of onership of the securities.
$. A related aspect of these to parts is the nature of their contribution to industrial,nancing. The :e Issue Market pro+ides the issuing company ith additional funds forstarting a ne enterprise or for either e4pansion or di+ersi,cation of an e4isting one' andthus its contribution to company ,nancing is direct. The role of the stock e4change +isa+is supply of capital is indirect.
). Apart from this' the to parts of the market di=er organisationally' e.g. the stocke4changes ha+e physical e4istence and are located in particular geographical areas. The:e Issue Market en<oys neither any tangible form nor any administrati+e organisationalsetup' and nor is sub<ect to any centralised control and administration for the e4ecution ofits business it is recognised by the ser+ices that it renders to the lenders and borroers ofcapital funds at the time of any particular operation.
Investor Protection in Primary market1 Provision of all t%e relevant Information* Provision of 3ccurate information$. &ransparent allotment procedure $it%out any ,ias
In order to o,serve a,ove t%e follo$in" are done
8/17/2019 Notes Saim
http://slidepdf.com/reader/full/notes-saim 6/57
". ?ro<ect Appraisal2. nderriting$. 8isclosure of the ?rospectus). Clearance by the stock E4change*. Signing by the board of directors-. 5edressal of the In+estors grie+ances6. SE!Is 5ole
Secondary MarketA stock ec%an"e is a form of e4change hich pro+ides ser+ices for stock brokers and tradersto trade stocks' bonds' and other securities. Stock e4changes also pro+ide facilities for issue andredemption of securities and other ,nancial instruments' and capital e+ents including thepayment of income and di+idends. Securities traded on a stock e4change include shares issuedby companies' unit trusts' deri+ati+es' pooled in+estment products and bonds.
To be able to trade a security on a certain stock e4change' it must be listed there. sually' thereis a central location at least for record keeping' but trade is increasingly less linked to such aphysical place' as modern markets are electronic netorks' hich gi+es them ad+antages ofincreased speed and reduced cost of transactions. Trade on an e4change is by members only.
The initial o=ering of stocks and bonds to in+estors is by de,nition done in the primary marketand subse;uent trading is done in the secondary market. A stock e4change is often the mostimportant component of a stock market. Supply and demand in stock markets are dri+en by+arious factors that' as in all free markets' a=ect the price of stocks 3see stock +aluation.
There is usually no compulsion to issue stock +ia the stock e4change itself' nor must stock besubse;uently traded on the e4change. Such trading is said to be of exchange or o+erthecounter. This is the usual ay that deri+ati+es and bonds are traded. Increasingly' stocke4changes are part of a global market for securities.
Role and Functions of Secondary MarketRole
• Creatin" investment opportunities for small investors• Prot s%arin"• Facilitatin" company "ro$t%• Mo,ili'in" savin"s for investment• Common forms of capital raising• Raisin" capital for ,usinesses
Functions• Maintain 3ctive &radin"• Fiation of Price• 6nsure safe and Fair trade Practices• 3ids in Financin" t%e Industry• #issemination of t%e information•
Performance Inducer
Re"ulatory Mec%anism in Secondary Market&%ree tier structure
". Ministry of ,nance2. SE!I$. Do+erning !oard
Ministry of ,nance". Super+isory function o+er SE!I2. Appellate function against SE!I$. icensing of dealers
8/17/2019 Notes Saim
http://slidepdf.com/reader/full/notes-saim 7/57
). 5ecognition to stock e4change*. Appointment of the board of go+ernors
SE!I". 5egulation of !usiness2. In+estor ?rotection$. ?re+ent raudulent trade practices). Takeo+er and Amalgamation*. @ther poers
Do+erning !oard". Consist of "$ members.2. - members from ithin$. $ public representati+es nominated by the board of go+ernors). :ot more than$ members appointed by the central go+ernment*. :ot more than three by SE!I.-. E4ecuti+e directors by the stock e4change.6. @ne third of the elected members are retires at ADM. They can be re elected.#. There are also ?residents and Fice president elected by the go+erning board.
Functionin" of Stock Market Trading in Indian stock e4changes are limited to listed securities of public limited companies. They are broadly di+ided into to categories' namely' speci,ed securities 3forard list7 and nonspeci,ed securities 3cash list7. E;uity shares of di+idend paying' grothoriented companies itha paidup capital of at least 5s.*0 million and a market capitali(ation of at least 5s."00 millionand ha+ing more than 20'000 shareholders are' normally' put in the speci,ed group and thebalance in nonspeci,ed group.
To types of transactions can be carried out on the Indian stock e4changes> 3a7 spot deli+erytransactions 9for deli+ery and payment ithin the time or on the date stipulated hen enteringinto the contract hich shall not be more than ") days folloing the date of the contract9 > and3b7 forard transactions 9deli+ery and payment can be e4tended by further period of ") dayseach so that the o+erall period does not e4ceed &0 days from the date of the contract9. Thelatter is permitted only in the case of speci,ed shares. The brokers ho carry o+er the outstandings pay carry o+er charges hich are usually determined by the rates of interestpre+ailing. A member broker in an Indian stock e4change can act as an agent' buy and sell securities for hisclients on a commission basis and also can act as a trader or dealer as a principal' buy and sellsecurities on his on account and risk' in contrast ith the practice pre+ailing on :e Gork andondon Stock E4changes' here a member can act as a <obber or a broker only.
The nature of trading on Indian Stock E4changes are that of age old con+entional style of facetoface trading ith bids and o=ers being made by open outcry. oe+er' there is a great amount ofe=ort to moderni(e the Indian stock e4changes in the +ery recent times.
!ver &%e Counter 6c%an"e of India 7!&C6I8 The traditional trading mechanism pre+ailed in the Indian stock markets ga+e ay to manyfunctional ineHciencies' such as' absence of li;uidity' lack of transparency' unduly longsettlement periods' hich a=ected the small in+estors to a great e4tent. To pro+ide impro+edser+ices to in+estors' the country%s ,rst electronic stock e4change @TCEI as created in "&&2by country%s premier ,nancial institutions nit Trust of India' Industrial Credit and In+estmentCorporation of India' Industrial 8e+elopment !ank of India' S!I Capital Markets' Industrial inanceCorporation of India' Deneral Insurance Corporation and its subsidiaries and Canara !ankinancial Ser+ices.
@TC has a uni;ue feature of trading compared to other traditional e4changes. That is' certi,catesof listed securities and initiated debentures are not traded at @TC. The original certi,cate ill be
8/17/2019 Notes Saim
http://slidepdf.com/reader/full/notes-saim 8/57
safely ith the custodian. !ut' a counter receipt is generated out at the counter hichsubstitutes the share certi,cate and is used for all transactions.In the case of permitted securities' the system is similar to a traditional stock e4change. Thedi=erence is that the deli+ery and payment procedure ill be completed ithin ") days.Compared to the traditional E4changes' @TC E4change netork has the folloing ad+antages>
• @TCEI has idely dispersed trading mechanism across the country hich pro+ides greaterli;uidity and lesser risk of intermediary charges.
• Dreater transparency and accuracy of prices is obtained due to the screenbased scriplesstrading.
• Since the e4act price of the transaction is shon on the computer screen' the in+estorgets to kno the e4act price at hich she is trading.
• aster settlement and transfer process compared to other e4changes.• In the case of an @TC issue 3ne issue7' the allotment procedure is completed in a month
and trading commences after a month of the issue closure' hereas it takes a longerperiod for the same ith respect to other e4changes.
+enets and limitations of Stock Market+enets
". Creating a market for the company%s shares2. Enhancing the status and ,nancial standing of the company$. Increasing public aareness and public interest in the company and its products). ?ro+iding the company ith an opportunity to implement share option schemes for their
employees*. Accessing to additional fund raising in the future by means of ne issues of shares or
other securities-. acilitating ac;uisition opportunities by use of the company%s shares6. @=ering e4isting shareholders a ready means of reali(ing their in+estments
Limitations• Increasing accountability to public shareholders• :eed to maintain di+idend and pro,t groth trends• Chances of possible takeo+er and merger.•
:eed to obser+e and adhere strictly to the rules and regulations by go+erning bodies• Increasing costs in complying ith higher le+el of reporting re;uirements• Su=ering a loss of pri+acy as a result of media interest
&%e Security and 6c%an"e +oard of India• It as oHcially act by The Do+ernment of India in the year "&## and gi+en statutory
poers in "&&2 ith SE!I Act "&&2 being passed by the Indian ?arliament. SE!I has it%sead;uarter at the business district of !andra Jurla Comple4 in Mumbai' and has:orthern' Eastern' Southern and /estern 5egional @Hces in :e 8elhi' Jolkata' Chennaiand Ahmedabad respecti+ely.
• Controller of Capital Issues as the regulatory authority before SE!I came into e4istence1it deri+ed authority from the Capital Issues 3Control7 Act' "&)6.
• Initially SE!I as a non statutory body ithout any statutory poer. oe+er in the year of
"&&*' the SE!I as gi+en additional statutory poer by the Do+ernment of India throughan amendment to the Securities and E4change !oard of India Act "&&2. In April' "&&# theSE!I as constituted as the regulator of capital markets in India under a resolution of theDo+ernment of India.
• The SE!I is managed by its members' hich consists of folloing> a7 The chairman ho is
nominated by nion Do+ernment of India. b7 To members' i.e. @Hcers from nioninance Ministry. c7 @ne member from The 5eser+e !ank of India. d7 The remaining *members are nominated by nion Do+ernment of India' out of them at least $ shall beholetime members.
8/17/2019 Notes Saim
http://slidepdf.com/reader/full/notes-saim 9/57
!,9ectives of Security and 6c%an"e +oard of India• To promote and de+elop stock market• To protect the interest of the in+estors in stock market.• To regulate the stock market
Functions of Security and 6c%an"e +oard of IndiaIn order to pursue the ob<ecti+es SE!I has the folloing functions>
". 5egulate the orking of the stock market.2. 5egistration and licensing of the participants.$. 5egistration and regulation of the collecti+e in+estment schemes.). ?romotion of self regulatory organi(ation*. ?re+enting unfair trade practices.-. ?romoting in+estor education.6. Training of the intermediaries.#. ?re+enting Insider trading' circular trading.&. 5egulating Mergers' takeo+ers' Amalgamations etc."0.ndertaking Inspections' Calling for the information' audits of the stocks' sei(ure of the
accounts.&%e Security and 6c%an"e +oard of India !r"ani'ation
• ?rimary 8epartment or ?rimary market 5egulation• Issue Management and Intermediary 8epartment or Intermediaries regulation• Secondary Market 8epartment or secondary market regulation• Institutional 8epartment or the regulation of Merger' takeo+ers' Amalgamations ets.• In+estigation 8epartment or In+estigation purpose.• Ad+isory Committee or ad+ice regarding regulation of primary and secondary market.
S6+I:s Role in Primary Market". Entry :orms• $ year of 8i+idend ?ayment• or e4isting company should full,l norms if the issue is ,+e time s the pre issue.• If a company does not ha+e a track record' it could go of public issue but its pro<ect must
be appraised by a public ,nancial institution.• or a public issue a company must ha+e * promotes of 5s " lac of the net capital o=er
made to public.2. ?romoter Contribution
• :ot less than 20K of the issued capital.• Entire promoter contribution should be recei+ed before the issue.• The promoter issue should not be more than 20K and it ill be locked for * years.
$. 8isclosure). Allocation of shares*. Market intermediaries
S6+I:s Role in Secondary Market1 4overnin" +oard* Infrastructure
. Settlement and clearin"0 Price sta,ili'ation #elistin"
Unit-*Concept of Risk 5isk is the potential of loss 3an undesirable outcome' hoe+er not necessarily so7resulting from a gi+en action' acti+ity andor inaction. The notion implies that achoice ha+ing an inLuence on the outcome sometimes e4ists 3or e4isted7.
8/17/2019 Notes Saim
http://slidepdf.com/reader/full/notes-saim 10/57
?otential losses themsel+es may also be called 9risks9. Any human endea+orcarries some risk' but some are much riskier than others. 5isk can be de,ned in di=erent ays". A probability or threat of damage' in<ury' liability' loss' or any other negati+eoccurrence that is caused by e4ternal or internal +ulnerabilities' and that may bea+oided through preempti+e action.
2. inance> The probability that an actual return on an in+estment ill be loerthan the e4pected return. inancial risk can be di+ided into the folloingcategories> !asic risk' Capital risk' Country risk' 8efault risk' 8eli+ery risk'Economic risk' E4change rate risk' Interest rate risk' i;uidity risk' @perations risk'?ayment system risk' ?olitical risk' 5e,nancing risk' 5ein+estment risk' Settlementrisk' So+ereign risk' and nderriting risk.$. ood industry> The possibility that due to a certain ha(ard in food there ill bean negati+e e=ect to a certain magnitude.
Measures of risk and return and Calculation
ariance and !tandard "eviation8isk reflects the chance that the actual return on an investment may be very different than the expected return$ne way to measure risk is to calculate the variance and standard deviation of the distribution of returns.)onsider the probability distribution for the returns on stocks # and $ provided below.
!tate Probability
Return on
!tock #
Return on
!tock $
3 49: ;: ;9:
4 69: 39: 69:
6 69: 3;: 39:
6 49: 49: (39:The expected returns on stocks # and $ were calculated on the Expected 8eturn page. The expected return onStock + was found to be 34.;: and the expected return on Stock B was found to be 49:.<iven an asset's expected return, its variance can be calculated using the following e*uation2
where• / = the number of states,
• pi = the probability of state i,
• 8 i = the return on the stock in state i, and• E>8? = the expected return on the stock.
The standard deviation is calculated as the positive s*uare root of the variance.
ariance and !tandard "eviation on !tocks # and $
%ote: &'R #( ) *+,-. and &'R $( ) +/. !tock #
8/17/2019 Notes Saim
http://slidepdf.com/reader/full/notes-saim 11/57
!tock $
+lthough !tock $ offers a higher expected return than !tock #, it also is riskier since its variance and standarddeviation are greater than !tock #'s. This, however, is only part of the picture because most investors choose tohold securities as part of a diversified portfolio.
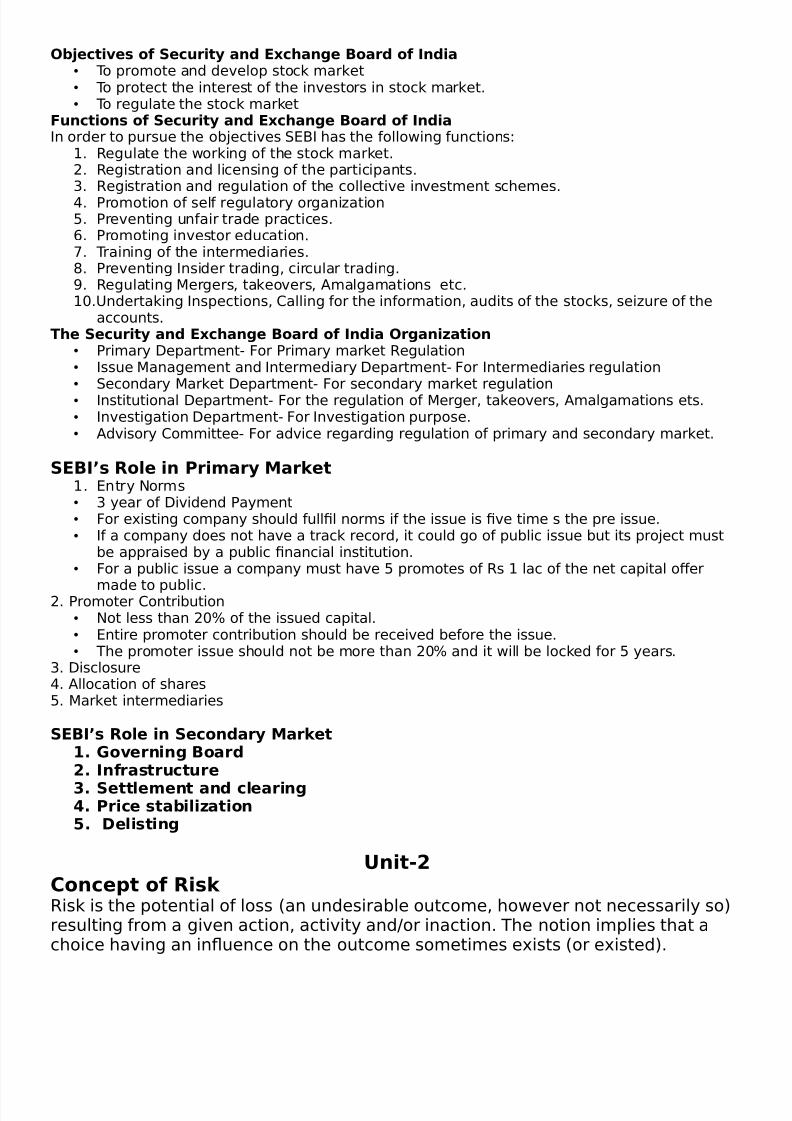
Risk and Return Trade off + fundamental investment concept is the tradeoff between risk and return. The concept is based on two realitiesof investments and investment performance.7irst, all investments carry some degree of risk @ the reality that you could lose some or all of your money whenyou buy stocks, bonds, mutual funds or other investments. Second, not only do different types of investmentscarry different levels of risk, but the more risk you assume, the greater the investment return you are likely toachieve.8isk comes in many forms, but when talking about the risk(return tradeoff, the primary measure of risk isvolatility, or the degree to which an investment fluctuates in price. ifferent asset categories are sub5ect todifferent levels of price fluctuation. 7or instance, stocks can fluctuate widely from one year to the next !or even
from one day to the next%, whereas the swing in bond prices tends to be less dramatic, and price fluctuations formoney market or so(called capital preservation investments are even lower.
0hat1s 2our Time 3orizon4
Since the investments with the highest potential for return also tend to fluctuate most widely, your investmenttime hori&on @ when you will need your money @ is an important consideration and is tied closely to the risk(return tradeoff.7or example, while it is true that stocks have returned more than 39 percent on average per year during thecourse of the eight decades in which "bbotson +ssociates has tracked performance, it is also true that stockshave experienced sharp ups and downs, and the ma5or stock indices have actually lost money during many periods of one year or longer.
7or this reason, stocks tend to be prudent investments for those with a long(term investment time hori&on. TheSecurities and Exchange )ommission notes in its brochure, Beginners' Guide to Asset Allocation,
Diversification and Rebalancing 2 A+s an asset category, stocks are a portfolio's heavy hitter,C offering thegreatest potential for growth. Stocks hit home runs, but also strike out. The volatility of stocks makes them avery risky investment in the short term.D+s your time hori&on shortens, you generally need more stable investments. +s you age, ad5usting your portfolio to include a greater percentage of bonds is usually recommended @ not only because bond pricesfluctuate less than stock prices, but because bonds and stocks tend to move in different directions. "n otherwords, when stock prices rise, bond interest rates often fall, and vice versa.
&valuate 2our Tolerance For Risk
our risk tolerance will depend in part on how much money you can afford to lose @ which, for most investors,is not a large percentage of oneCs total investment amount. But risk tolerance also involves how well youemotionally handle the ups and downs of the market. "f the marketCs short(term peaks and valleys donCt botheryou, you have a higher tolerance for risk and probably are more likely to risk losing money to achieve betterresults. $n the other hand, if youCre prone to worrying about fluctuations in the value of your investments, youhave a lower tolerance for risk and may feel better about allocating your investments to assets that do notfluctuate as much, such as bonds, even when you have a relatively long investment time hori&on.Even if you shrink from market risk, remember that there is also the risk that low(return investments wonCt provide the long(term growth you need to build investment value over time, especially during periods of highinflation where your rate of return may be less than the rate of inflation.
8/17/2019 Notes Saim
http://slidepdf.com/reader/full/notes-saim 12/57
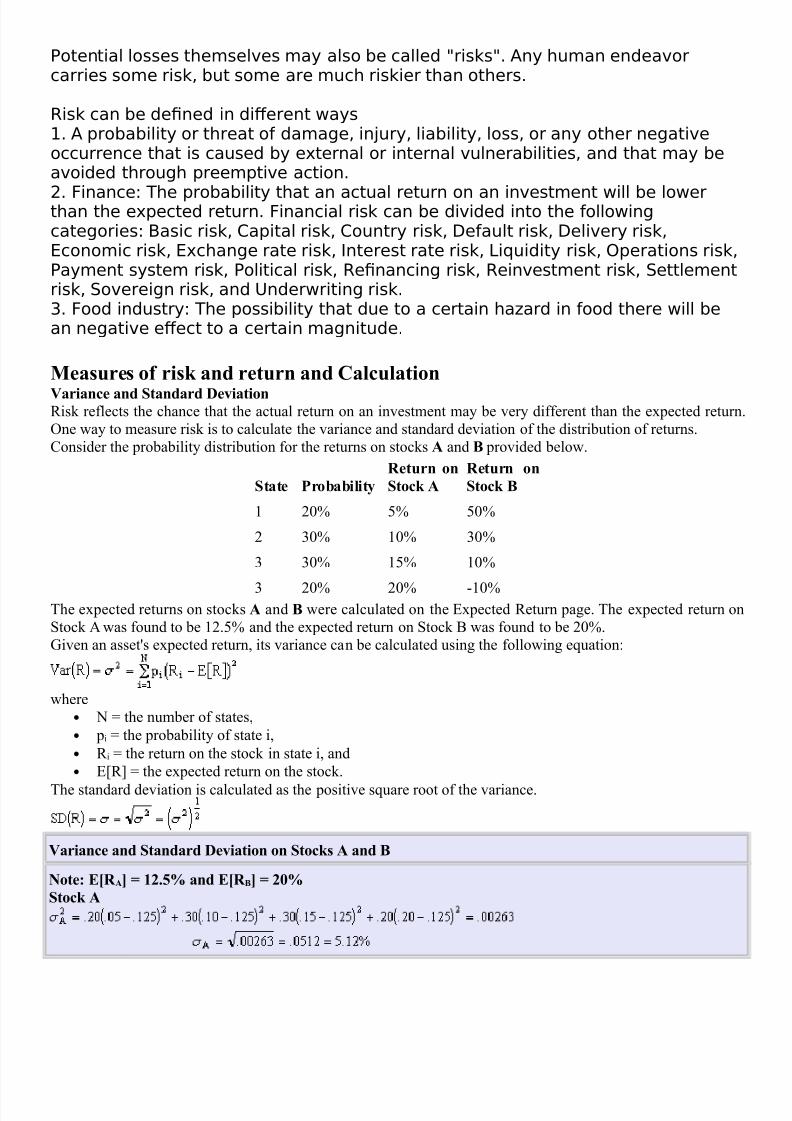
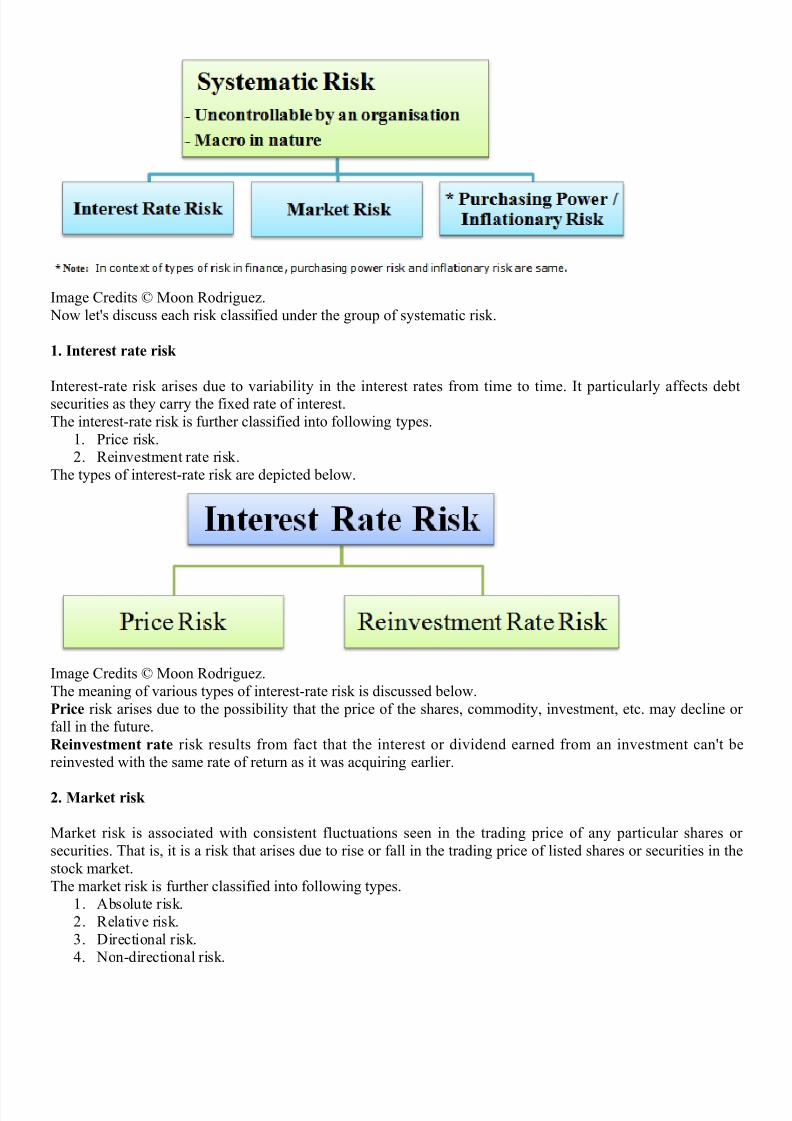
!ystematic and unsystematic risk components"n finance, different types of risk can be classified under two main groups, vi&.,
3. Systematic risk.4. nsystematic risk.
Two main groups under which types of risk are classified is depicted below.
"mage )redits F Moon 8odrigue&. /ow let's discuss the simple meaning of systematic and unsystematic risk.!ystematic risk is uncontrollable by an organi&ation and macro in nature.5nsystematic risk is controllable by an organi&ation and micro in nature.
!ystematic Risk
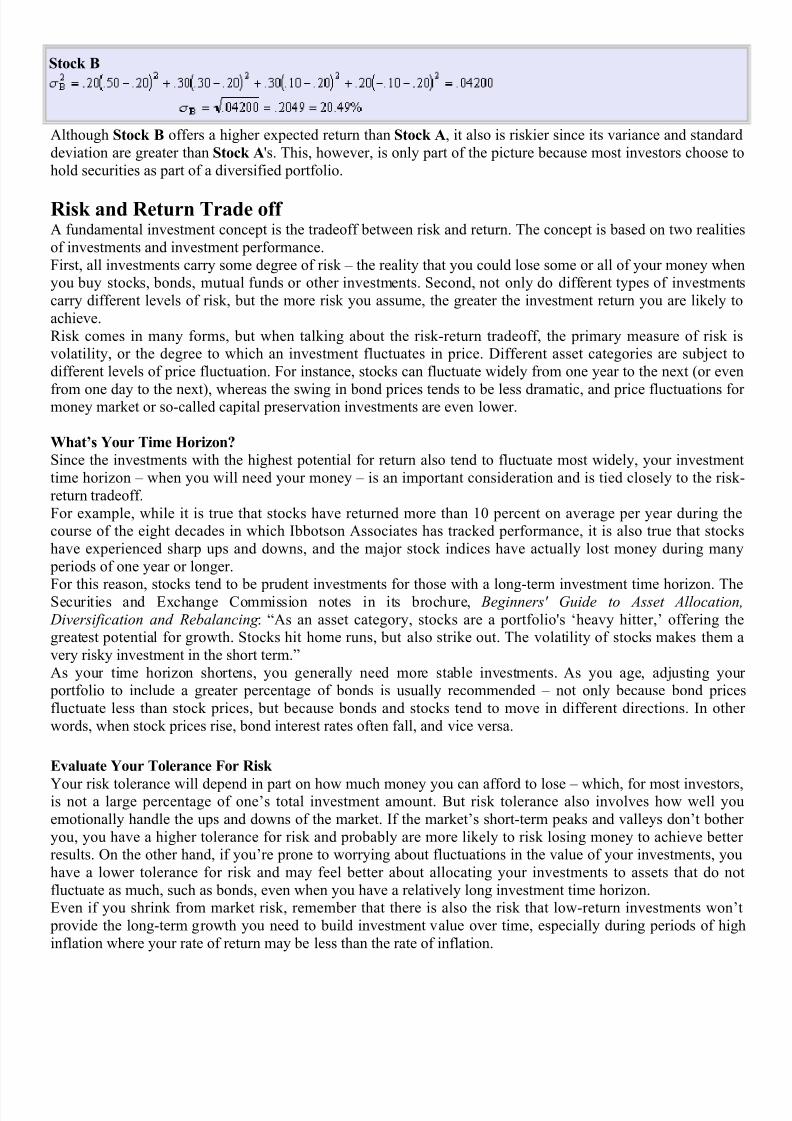
Systematic risk is due to the influence of external factors on an organi&ation. Such factors are normallyuncontrollable from an organi&ation's point of view.Systematic risk is a macro in nature as it affects a large number of organi&ations operating under a similarstream or same domain. "t cannot be planned by the organi&ation.Types of risk under the group of systematic risk are listed as follows2
3. "nterest rate risk.4. Market risk.6. #urchasing power or "nflationary risk.
The types of risk grouped under systematic risk are depicted below.
8/17/2019 Notes Saim
http://slidepdf.com/reader/full/notes-saim 13/57
"mage )redits F Moon 8odrigue&. /ow let's discuss each risk classified under the group of systematic risk.
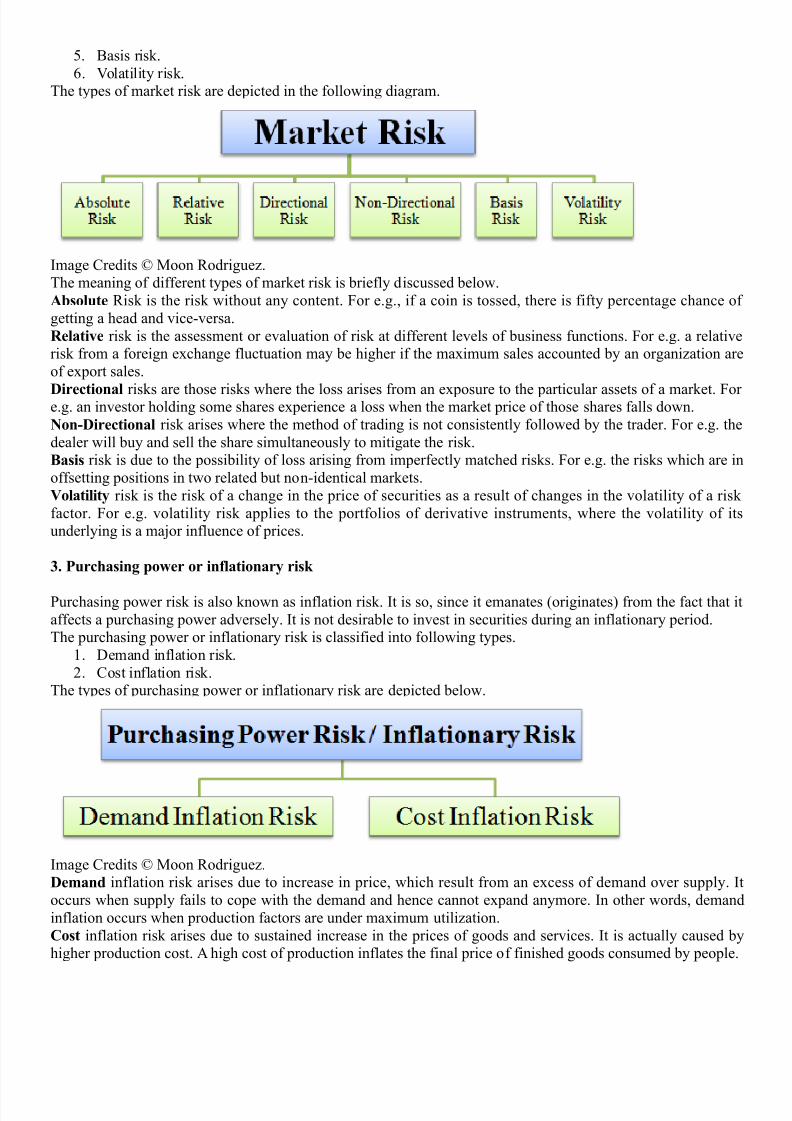
*, 6nterest rate risk
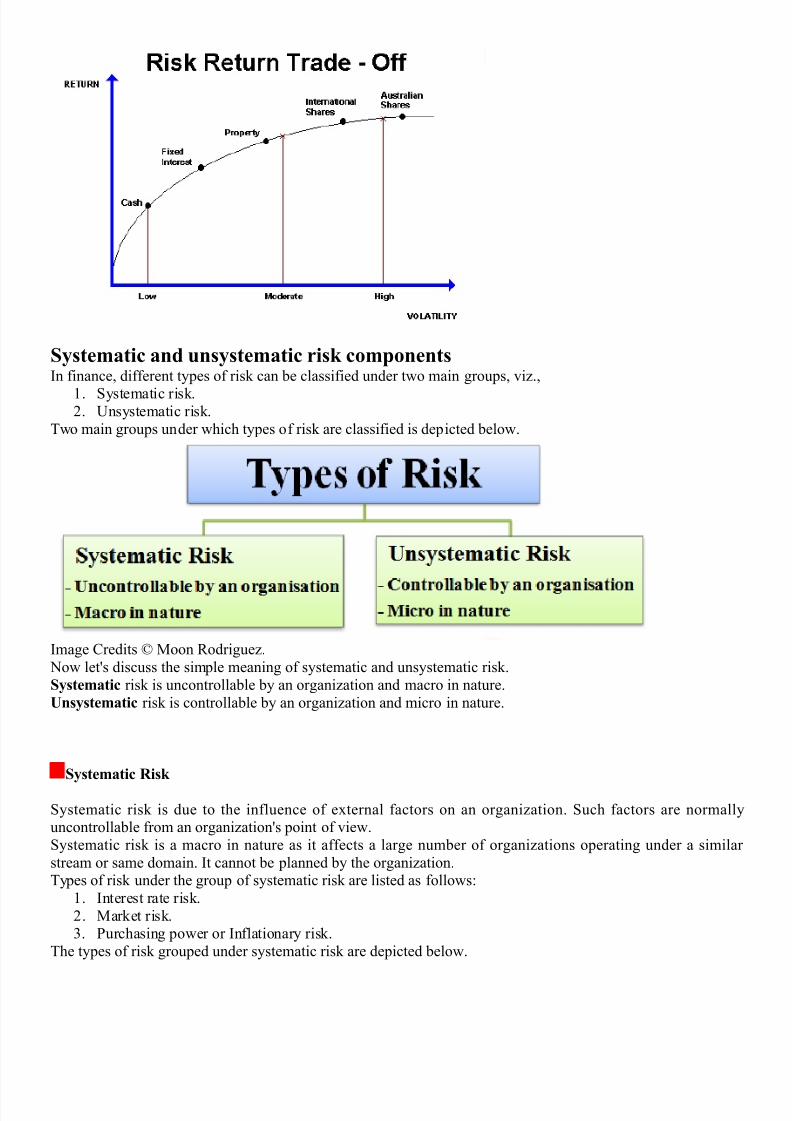
"nterest(rate risk arises due to variability in the interest rates from time to time. "t particularly affects debtsecurities as they carry the fixed rate of interest.The interest(rate risk is further classified into following types.
3. #rice risk.4. 8einvestment rate risk.
The types of interest(rate risk are depicted below.
"mage )redits F Moon 8odrigue&.The meaning of various types of interest(rate risk is discussed below.Price risk arises due to the possibility that the price of the shares, commodity, investment, etc. may decline orfall in the future.Reinvestment rate risk results from fact that the interest or dividend earned from an investment can't bereinvested with the same rate of return as it was ac*uiring earlier.
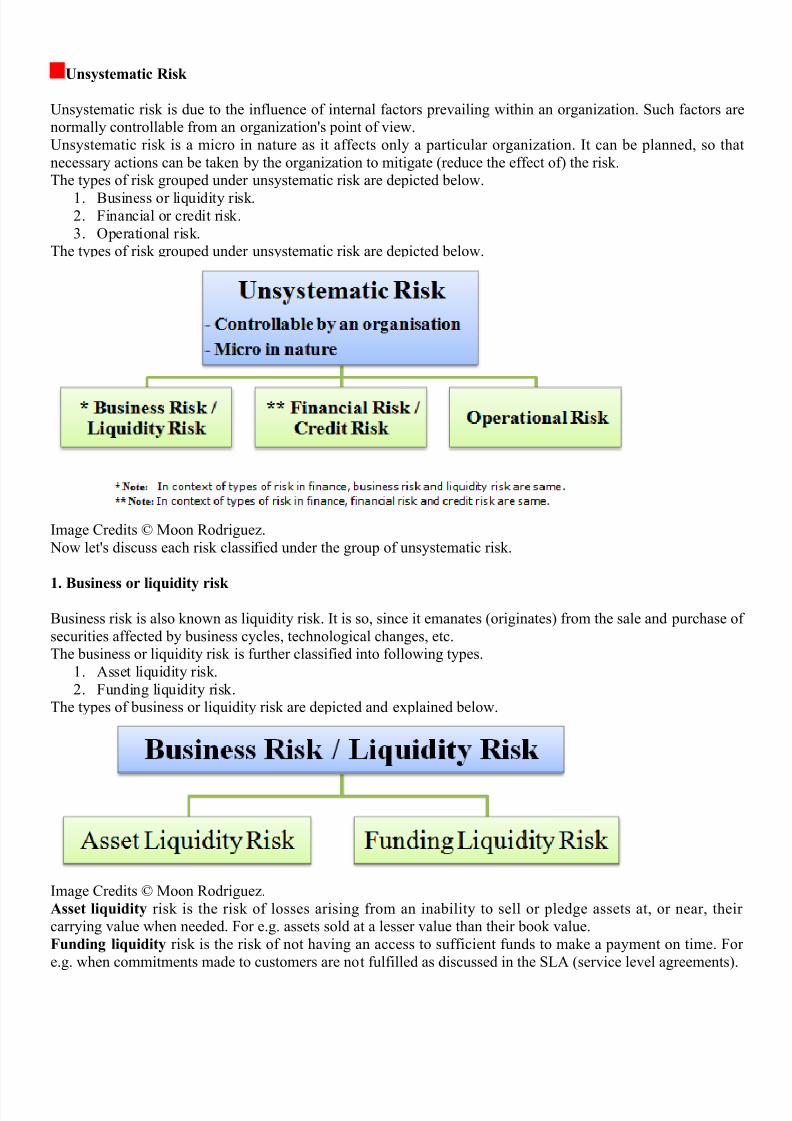
+, Market risk
Market risk is associated with consistent fluctuations seen in the trading price of any particular shares orsecurities. That is, it is a risk that arises due to rise or fall in the trading price of listed shares or securities in thestock market.The market risk is further classified into following types.
3. +bsolute risk.4. 8elative risk.6. irectional risk.G. /on(directional risk.
8/17/2019 Notes Saim
http://slidepdf.com/reader/full/notes-saim 14/57
;. Basis risk.H. Iolatility risk.
The types of market risk are depicted in the following diagram.
"mage )redits F Moon 8odrigue&.The meaning of different types of market risk is briefly discussed below.#bsolute 8isk is the risk without any content. 7or e.g., if a coin is tossed, there is fifty percentage chance ofgetting a head and vice(versa.Relative risk is the assessment or evaluation of risk at different levels of business functions. 7or e.g. a relativerisk from a foreign exchange fluctuation may be higher if the maximum sales accounted by an organi&ation areof export sales.
"irectional risks are those risks where the loss arises from an exposure to the particular assets of a market. 7ore.g. an investor holding some shares experience a loss when the market price of those shares falls down.%on7"irectional risk arises where the method of trading is not consistently followed by the trader. 7or e.g. thedealer will buy and sell the share simultaneously to mitigate the risk.$asis risk is due to the possibility of loss arising from imperfectly matched risks. 7or e.g. the risks which are inoffsetting positions in two related but non(identical markets.olatility risk is the risk of a change in the price of securities as a result of changes in the volatility of a riskfactor. 7or e.g. volatility risk applies to the portfolios of derivative instruments, where the volatility of itsunderlying is a ma5or influence of prices.
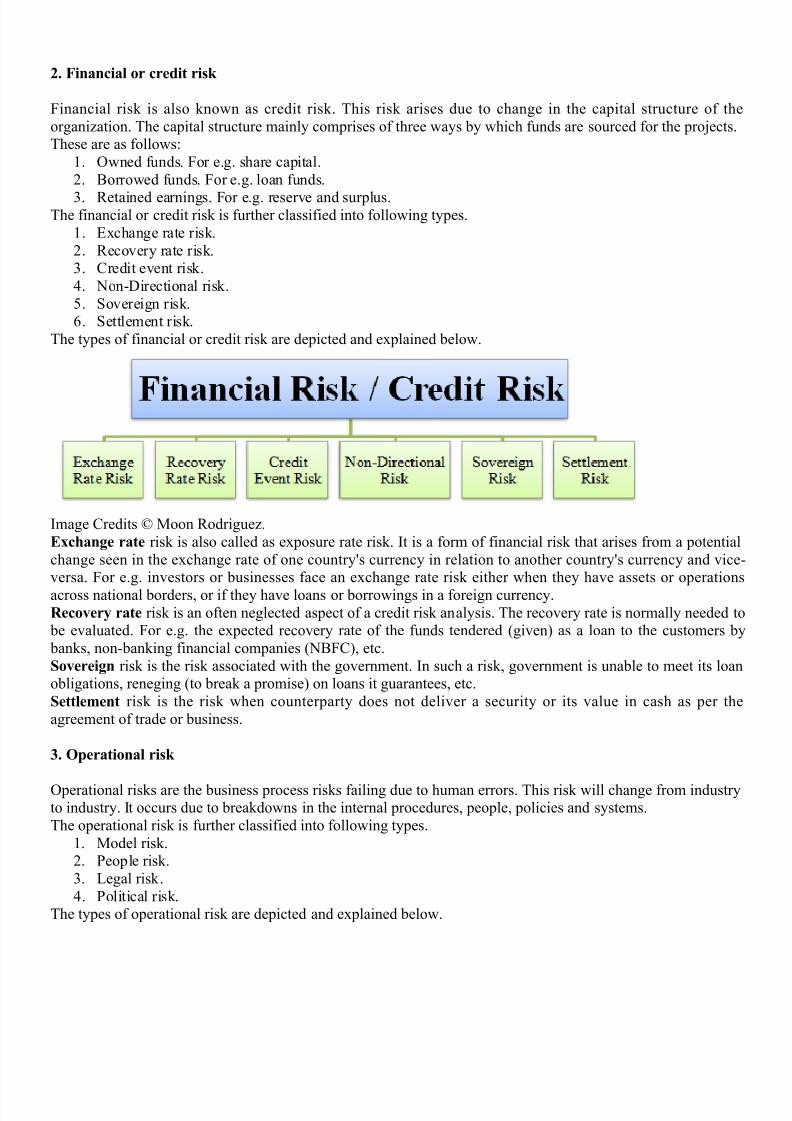
8, Purchasing power or inflationary risk
#urchasing power risk is also known as inflation risk. "t is so, since it emanates !originates% from the fact that itaffects a purchasing power adversely. "t is not desirable to invest in securities during an inflationary period.The purchasing power or inflationary risk is classified into following types.
3. emand inflation risk.4. )ost inflation risk.
The types of purchasing power or inflationary risk are depicted below.
"mage )redits F Moon 8odrigue&."emand inflation risk arises due to increase in price, which result from an excess of demand over supply. "toccurs when supply fails to cope with the demand and hence cannot expand anymore. "n other words, demandinflation occurs when production factors are under maximum utili&ation.Cost inflation risk arises due to sustained increase in the prices of goods and services. "t is actually caused byhigher production cost. + high cost of production inflates the final price of finished goods consumed by people.
8/17/2019 Notes Saim
http://slidepdf.com/reader/full/notes-saim 15/57
5nsystematic Risk
nsystematic risk is due to the influence of internal factors prevailing within an organi&ation. Such factors arenormally controllable from an organi&ation's point of view.nsystematic risk is a micro in nature as it affects only a particular organi&ation. "t can be planned, so thatnecessary actions can be taken by the organi&ation to mitigate !reduce the effect of% the risk.The types of risk grouped under unsystematic risk are depicted below.
3. Business or li*uidity risk.4. 7inancial or credit risk.6. $perational risk.
The types of risk grouped under unsystematic risk are depicted below.
"mage )redits F Moon 8odrigue&. /ow let's discuss each risk classified under the group of unsystematic risk.
*, $usiness or li9uidity risk
Business risk is also known as li*uidity risk. "t is so, since it emanates !originates% from the sale and purchase ofsecurities affected by business cycles, technological changes, etc.The business or li*uidity risk is further classified into following types.
3. +sset li*uidity risk.4. 7unding li*uidity risk.
The types of business or li*uidity risk are depicted and explained below.
"mage )redits F Moon 8odrigue&.#sset li9uidity risk is the risk of losses arising from an inability to sell or pledge assets at, or near, theircarrying value when needed. 7or e.g. assets sold at a lesser value than their book value.Funding li9uidity risk is the risk of not having an access to sufficient funds to make a payment on time. 7ore.g. when commitments made to customers are not fulfilled as discussed in the SJ+ !service level agreements%.
8/17/2019 Notes Saim
http://slidepdf.com/reader/full/notes-saim 16/57
+, Financial or credit risk
7inancial risk is also known as credit risk. This risk arises due to change in the capital structure of theorgani&ation. The capital structure mainly comprises of three ways by which funds are sourced for the pro5ects.These are as follows2
3. $wned funds. 7or e.g. share capital.4. Borrowed funds. 7or e.g. loan funds.
6. 8etained earnings. 7or e.g. reserve and surplus.The financial or credit risk is further classified into following types.
3. Exchange rate risk.4. 8ecovery rate risk.6. )redit event risk.G. /on(irectional risk.;. Sovereign risk.H. Settlement risk.
The types of financial or credit risk are depicted and explained below.
"mage )redits F Moon 8odrigue&.&change rate risk is also called as exposure rate risk. "t is a form of financial risk that arises from a potentialchange seen in the exchange rate of one country's currency in relation to another country's currency and vice(versa. 7or e.g. investors or businesses face an exchange rate risk either when they have assets or operationsacross national borders, or if they have loans or borrowings in a foreign currency.Recovery rate risk is an often neglected aspect of a credit risk analysis. The recovery rate is normally needed to be evaluated. 7or e.g. the expected recovery rate of the funds tendered !given% as a loan to the customers by banks, non(banking financial companies !/B7)%, etc.!overeign risk is the risk associated with the government. "n such a risk, government is unable to meet its loanobligations, reneging !to break a promise% on loans it guarantees, etc.!ettlement risk is the risk when counterparty does not deliver a security or its value in cash as per theagreement of trade or business.
8, ;perational risk
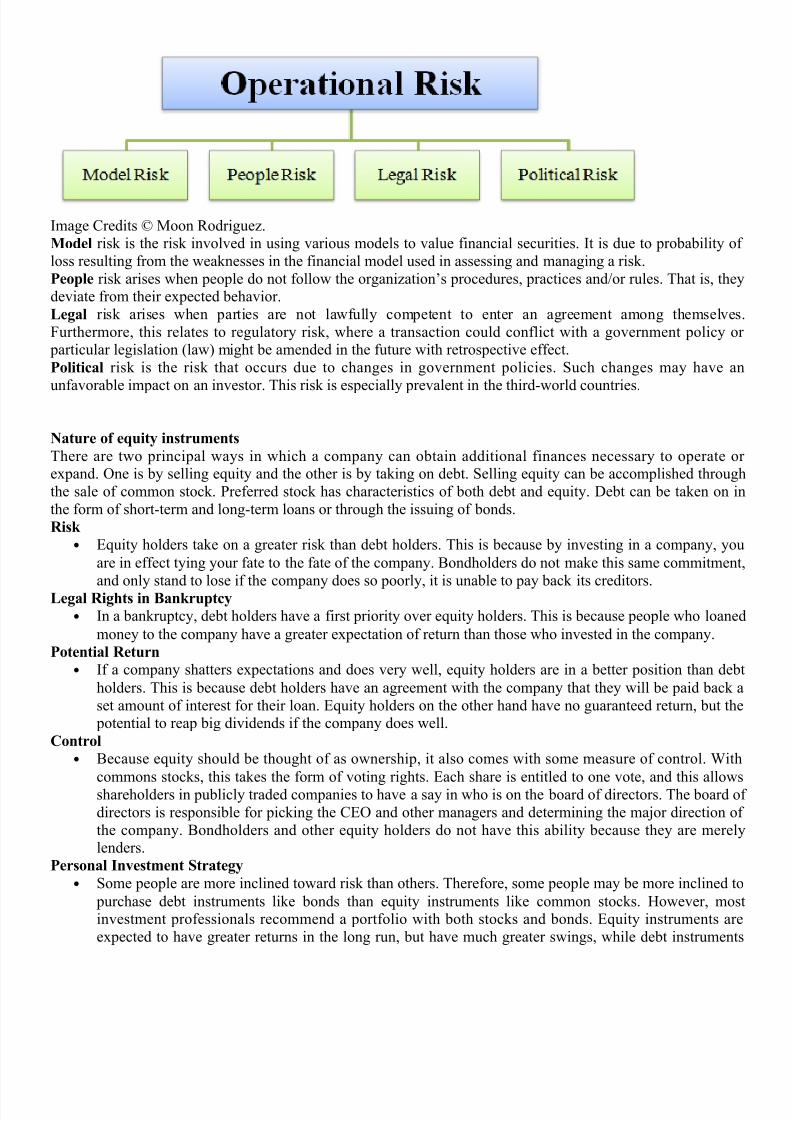
$perational risks are the business process risks failing due to human errors. This risk will change from industryto industry. "t occurs due to breakdowns in the internal procedures, people, policies and systems.The operational risk is further classified into following types.
3. Model risk.4. #eople risk.6. Jegal risk.G. #olitical risk.
The types of operational risk are depicted and explained below.
8/17/2019 Notes Saim
http://slidepdf.com/reader/full/notes-saim 17/57
"mage )redits F Moon 8odrigue&.Model risk is the risk involved in using various models to value financial securities. "t is due to probability ofloss resulting from the weaknesses in the financial model used in assessing and managing a risk.People risk arises when people do not follow the organi&ationCs procedures, practices and-or rules. That is, theydeviate from their expected behavior.<egal risk arises when parties are not lawfully competent to enter an agreement among themselves7urthermore, this relates to regulatory risk, where a transaction could conflict with a government policy or particular legislation !law% might be amended in the future with retrospective effect.Political risk is the risk that occurs due to changes in government policies. Such changes may have an
unfavorable impact on an investor. This risk is especially prevalent in the third(world countries.
%ature of e9uity instruments
There are two principal ways in which a company can obtain additional finances necessary to operate orexpand. $ne is by selling e*uity and the other is by taking on debt. Selling e*uity can be accomplished throughthe sale of common stock. #referred stock has characteristics of both debt and e*uity. ebt can be taken on inthe form of short(term and long(term loans or through the issuing of bonds.Risk
• E*uity holders take on a greater risk than debt holders. This is because by investing in a company, you
are in effect tying your fate to the fate of the company. Bondholders do not make this same commitment
and only stand to lose if the company does so poorly, it is unable to pay back its creditors.<egal Rights in $ankruptcy
• "n a bankruptcy, debt holders have a first priority over e*uity holders. This is because people who loaned
money to the company have a greater expectation of return than those who invested in the company.Potential Return
• "f a company shatters expectations and does very well, e*uity holders are in a better position than debt
holders. This is because debt holders have an agreement with the company that they will be paid back aset amount of interest for their loan. E*uity holders on the other hand have no guaranteed return, but the potential to reap big dividends if the company does well.
Control
• Because e*uity should be thought of as ownership, it also comes with some measure of control. ith
commons stocks, this takes the form of voting rights. Each share is entitled to one vote, and this allowsshareholders in publicly traded companies to have a say in who is on the board of directors. The board ofdirectors is responsible for picking the )E$ and other managers and determining the ma5or direction ofthe company. Bondholders and other e*uity holders do not have this ability because they are merelylenders.
Personal 6nvestment !trategy
• Some people are more inclined toward risk than others. Therefore, some people may be more inclined to
purchase debt instruments like bonds than e*uity instruments like common stocks. Kowever, mostinvestment professionals recommend a portfolio with both stocks and bonds. E*uity instruments areexpected to have greater returns in the long run, but have much greater swings, while debt instruments
8/17/2019 Notes Saim
http://slidepdf.com/reader/full/notes-saim 18/57
produce lower returns with fewer swings. "t is recommended that as you get older, you put more of yourinvestments into debt and less into e*uity.
&9uity aluation Models!tock aluation MethodsStocks have two types of valuations. $ne is a value created using some type of cash flow, sales orfundamental earnings analysis. The other value is dictated by how much an investor is willing to pay for
a particular share of stock and by how much other investors are willing to sell a stock for !in otherwords, by supply and demand%. Both of these values change over time as investors change the way theyanaly&e stocks and as they become more or less confident in the future of stocks.
The fundamental valuation is the valuation that people use to 5ustify stock prices. The most commonexample of this type of valuation methodology is #-E ratio, which stands for #rice to Earnings 8atio.This form of valuation is based on historic ratios and statistics and aims to assign value to a stock basedon measurable attributes. This form of valuation is typically what drives long(term stock prices.The other way stocks are valued is based on supply and demand. The more people that want to buy thestock, the higher its price will be. +nd conversely, the more people that want to sell the stock, the lowerthe price will be. This form of valuation is very hard to understand or predict, and it often drives the
short(term stock market trends.
There are many different ways to value stocks. The key is to take each approach into account whileformulating an overall opinion of the stock. "f the valuation of a company is lower or higher than othersimilar stocks, then the next step would be to determine the reasons.
&arnings Per !hare =&P!>. E#S is the net income available to common shareholders of the company divided by the number ofshares outstanding. They usually have a <++# E#S number !which means that it is computed using allof mutually agreed upon accounting rules% and a #ro 7orma E#S figure !which means that they havead5usted the income to exclude any one time items as well as some non(cash items like amorti&ation of
goodwill or stock option expenses%. The most important thing to look for in the E#S figure is the overall*uality of earnings. Make sure the company is not trying to manipulate their E#S numbers to make itlook like they are more profitable. +lso, look at the growth in E#S over the past several *uarters - yearsto understand how volatile their E#S is, and to see if they are an underachiever or an overachiever. "nother words, have they consistently beaten expectations or are they constantly restating and loweringtheir forecastsL
The E#S number that most analysts use is the pro forma E#S. To compute this number, use the netincome that excludes any one(time gains or losses and excludes any non(cash expenses like stockoptions or amorti&ation of goodwill. Then divide this number by the number of fully diluted sharesoutstanding. Kistorical E#S figures and forecasts for the next 3@4 years can be found by visiting free
financial sites such as ahoo 7inance !enter the ticker and then click on 1estimates1%.Through fundamental investment research, one can determine their own E#S forecasts and apply othervaluation techni*ues below.
Price to &arnings =P?&>. /ow that you have several E#S figures !historical and forecasts%, you'll be able to look at the mostcommon valuation techni*ue used by analysts, the price to earnings ratio, or #-E. To compute this figuretake the stock price and divide it by the annual E#S figure. 7or example, if the stock is trading at 39and the E#S is 9.;9, the #-E is 49 times. To get a good feeling of what #-E multiple a stock trades at, besure to look at the historical and forward ratios.
8/17/2019 Notes Saim
http://slidepdf.com/reader/full/notes-saim 19/57
Kistorical #-Es are computed by taking the current price divided by the sum of the E#S for the last four*uarters, or for the previous year. ou should also look at the historical trends of the #-E by viewing achart of its historical #-E over the last several years !you can find on most finance sites like ahoo7inance%. Specifically you want to find out what range the #-E has traded in so that you can determine if the current #-E is high or low versus its historical average.
7orward #-Es reflect the future growth of the company into the figure. 7orward #-Es are computed bytaking the current stock price divided by the sum of the E#S estimates for the next four *uarters, or for
the E#S estimate for next calendar or fiscal year or two.#-Es change constantly. "f there is a large price change in a stock you are watching, or if the earnings!E#S% estimates change, the ratio is recomputed.
The p-E has the following advantages2
3. #-E ratio indicates price per rupee of the share earning. This would help to compare the prices of stocks,which have different E#S.
4. #-E ratio are helpful in analysing the stocks of the companies that do not pay dividend but haveearnings. "t should be noted that when there is loss, #-E ratio analyses is difficult to use.
6. The variables used in #-E ratio model are easier to estimate than the variables in the discounting models.
ith this ratio model the investor can only find the relative position of the different stocks. "t does notindicate what price is appropriate for a particular stock.
The anticipated return model
The expected return can be determined with the help of the following formula2
E!r%= Summation #i N 8i
here #i is the associated probability8i are the returns in different years.
3olding period return model
8eturn can be calculated with the help of the following formula28= !#rice changeO )ash dividend%- #urchase price8= ! O #tO3 @ #t%- #there,8 is the returns is the dividends#tO3 is the #rice at the end of the period
#t is the initial price
Present alue of the Return Model
#rice of the share,#o= 3-3Or O #3-3Or here,#o is the price of the share3 is the next year dividend8 is Expected rate of return#3 is Selling price at the end of one year periodith this model price of the share and also selling price of the share can be determined.
8/17/2019 Notes Saim
http://slidepdf.com/reader/full/notes-saim 20/57
Constant @rowth rate model
#rice of the share is given by the formula2#o= 3-r(ghere#o is the price of the share3 is the dividend of the next year 8 is the expected rate of return< is the constant growth
+ssumption( Stable dividend policy and constant stable rate of returnN /ote= if theoretical value P +ctual #rice then Buy
"f theoretical value Q +ctual #rice then sell"f #resent rate of return P re*uired rate of return then Buy"f #resent rate of return Q re*uired rate of return then Sell
+onds( ;ature and 6valuation of +ondsA bonds price and yield determine its +alue in the secondary market. @b+iously' a bondmust ha+e a price at hich it can be bought and sold 3see nderstanding !ond Market?ricesN belo for more7' and a bonds yield is the actual annual return an in+estor cane4pect if the bond is held to maturity. Gield is therefore based on the purchase price of
the bond as ell as the coupon.
A bonds price alays mo+es in the opposite direction of its yield' as illustrated abo+e. The key to understanding this critical feature of the bond market is to recogni(e that abonds price reLects the +alue of the income that it pro+ides through its regular couponinterest payments. /hen pre+ailing interest rates fall O notably rates on go+ernmentbonds O older bonds of all types become more +aluable because they ere sold in ahigher interestrate en+ironment and therefore ha+e higher coupons. In+estors holdingolder bonds can charge a premiumN to sell them in the secondary market. @n the otherhand' if interest rates rise' older bonds may become less +aluable because their couponsare relati+ely lo' and older bonds therefore trade at a discount.N
Since go+ernments began to issue bonds more fre;uently in the early tentieth centuryand ga+e rise to the modern bond market' in+estors ha+e purchased bonds for se+eralreasons> capital preser+ation' income' di+ersi,cation and as a potential hedge againsteconomic eakness or deLation. /hen the bond market became larger and more di+ersein the "&60s and "�s' bonds began to undergo greater and more fre;uent pricechanges and many in+estors began to trade bonds' taking ad+antage of anotherpotential bene,t> price' or capital' appreciation.
Capital preservation< nlike e;uities' bonds should repay principal at a speci,ed date'or maturity. This makes bonds appealing to in+estors ho do not ant to risk losingcapital and to those ho must meet a liability at a particular time in the future. !ondsha+e the added bene,t of o=ering interest at a set rate that is often higher than shortterm sa+ings rates. Income< Most bonds pro+ide the in+estor ith ,4edN income. @n a set schedule'hether ;uarterly' tice a year or annually' the bond issuer sends the bondholder aninterest payment' hich can be spent or rein+ested in other bonds. Stocks can alsopro+ide income through di+idend payments' but di+idends tend to be smaller than bondcoupon payments' and companies make di+idend payments at their discretion' hilebond issuers are obligated to make coupon payments.
8/17/2019 Notes Saim
http://slidepdf.com/reader/full/notes-saim 21/57
Capital appreciation< !ond prices can rise for se+eral reasons' including a drop ininterest rates and an impro+ement in the credit standing of the issuer. If a bond is held tomaturity' any price gains o+er the life of the bond are not reali(ed1 instead' the bondsprice typically re+erts to par 3"007 as it nears maturity and repayment of the principal.oe+er' by selling bonds after they ha+e risen in price O and before maturity O in+estorscan reali(e price appreciation' also knon as capital appreciation' on bonds. Capturingthe capital appreciation on bonds increases their total return' hich is the combination of
income and capital appreciation. In+esting for total return has become one of the mostidely used bond strategies o+er the past )0 years. 3or more' see !ond In+estmentStrategiesN.7
#iversication< Including bonds in an in+estment portfolio can help di+ersify theportfolio. Many in+estors di+ersify among a ide +ariety of assets' from e;uities andbonds to commodities and alternati+e in+estments' in an e=ort to reduce the risk of lo'or e+en negati+e' returns on their portfolios.
+ond Risk Interest Rate Risk
Fariability in return from the debt to in+estors is caused by the changes is in the marketinterest rate. #efault Risk The failure to pay the agreed amount of the debt instrument by the issuer in full' ontime or both are default risk.Marketa,ility Risk Fariability in return caused by the diHculty in selling the bonds ;uickly ithout ha+ing tomake a substantial concession is knon as marketability risk.Calla,ility Risk The uncertainty created in the in+estors return by the issuer ability to call the bonds atany time.+ond Return<olding ?eriod 5eturnP 3?rice gain or oss during the holding period Q Coupon interestrate7 ?rice at the beginning of the holding period
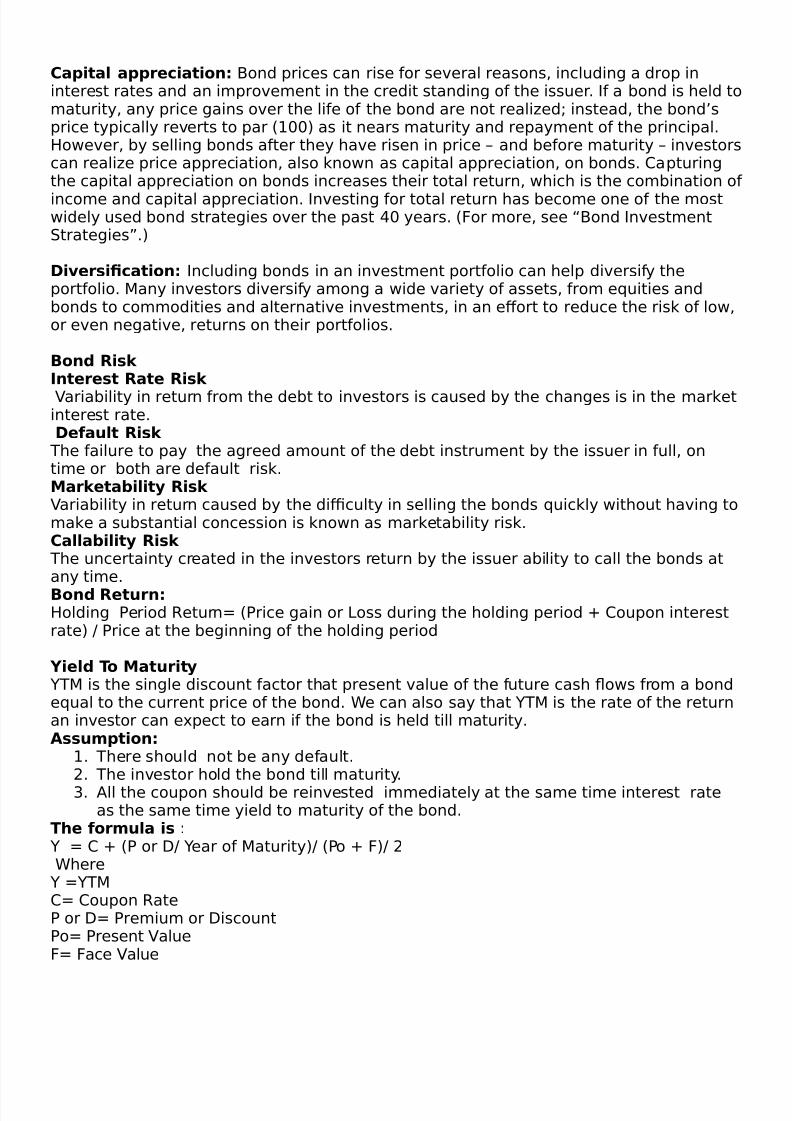
=ield &o Maturity GTM is the single discount factor that present +alue of the future cash Los from a bonde;ual to the current price of the bond. /e can also say that GTM is the rate of the returnan in+estor can e4pect to earn if the bond is held till maturity.3ssumption<
". There should not be any default.2. The in+estor hold the bond till maturity.$. All the coupon should be rein+ested immediately at the same time interest rate
as the same time yield to maturity of the bond.&%e formula is > G P C Q 3? or 8 Gear of Maturity7 3?o Q 7 2 /here G PGTMCP Coupon 5ate? or 8P ?remium or 8iscount?oP ?resent FalueP ace Falue
8/17/2019 Notes Saim
http://slidepdf.com/reader/full/notes-saim 22/57
?resent FalueP C"3"Qy7" Q C23"Qy72 QRRRRRRR..Q 3Couponn Q face +alue73"Qy7n
+ond >alue t%eoremTheorem7* : Price and interest rates move inversely
Jets assume 6 year 39: coupon paying bond for illustration
hen TM = 39: #rice = 399
hen TM = 33: #rice = R.;;
hen TM = R: #rice = 394.;6
Kence it can be concluded that as yield increase price of the bond decline and vice(versa.
Theorem7+ : # decrease in interest rates raises bond prices by more than a corresponding increase in
rates lowers price
Jets assume 6 year 39: coupon paying bond for illustration
hen TM = 39: #rice = 399
hen TM = 33: #rice = R.;; )hange in price = (4.G;:
hen TM = R: #rice = 394.;6 )hange in price = O4.;6:
This the most important theorem of bond which says that price movement of bond with change is interest rateeither side is not e*ual. #rice of the bond increases more than it declines when e*ual change in interest rate isgiven. "n above illustration you can clearly see that when yield declines by 3: price increases by 4.;6: whilein case of increase in yield by 3:, price decline is 4.G;:. +s price curve of the bond is convex, you gain morethan you lose.
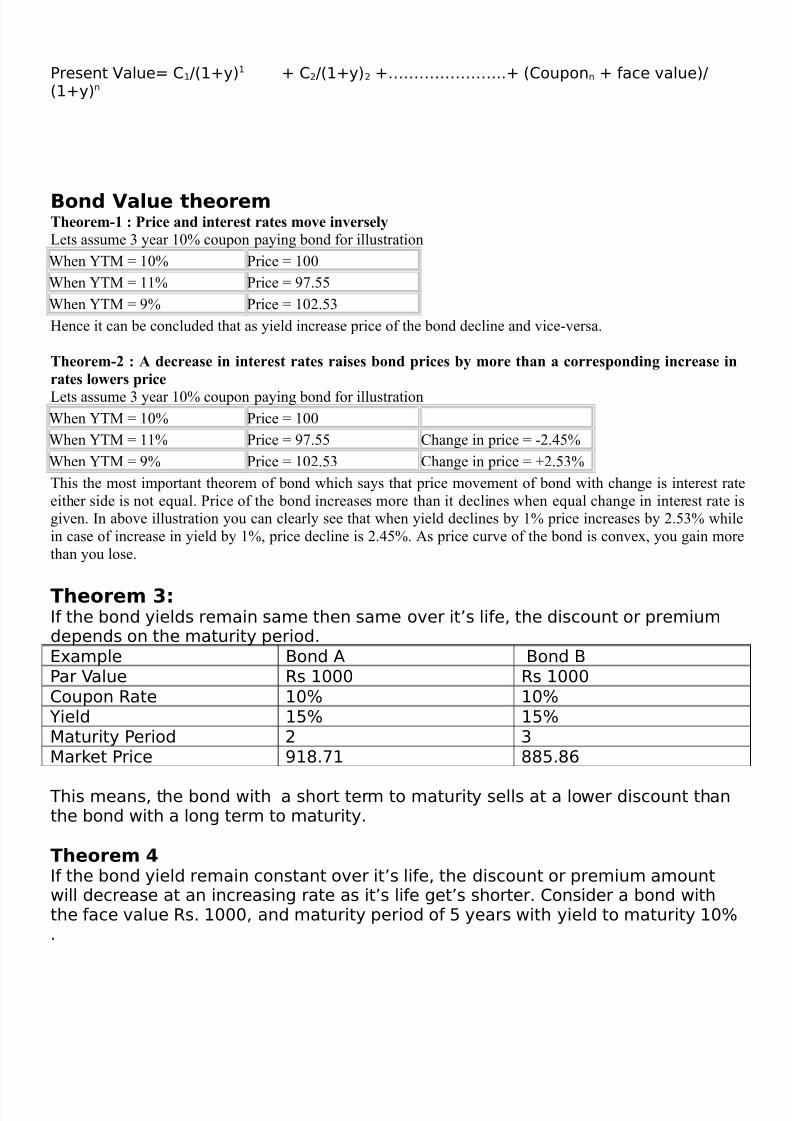
&%eorem .<If the bond yields remain same then same o+er its life' the discount or premiumdepends on the maturity period.E4ample !ond A !ond !?ar Falue 5s "000 5s "000Coupon 5ate "0K "0K
Gield "*K "*KMaturity ?eriod 2 $Market ?rice &"#.6" ##*.#-
This means' the bond ith a short term to maturity sells at a loer discount thanthe bond ith a long term to maturity.
&%eorem 0If the bond yield remain constant o+er its life' the discount or premium amountill decrease at an increasing rate as its life gets shorter. Consider a bond iththe face +alue 5s. "000' and maturity period of * years ith yield to maturity "0K.
8/17/2019 Notes Saim
http://slidepdf.com/reader/full/notes-saim 23/57
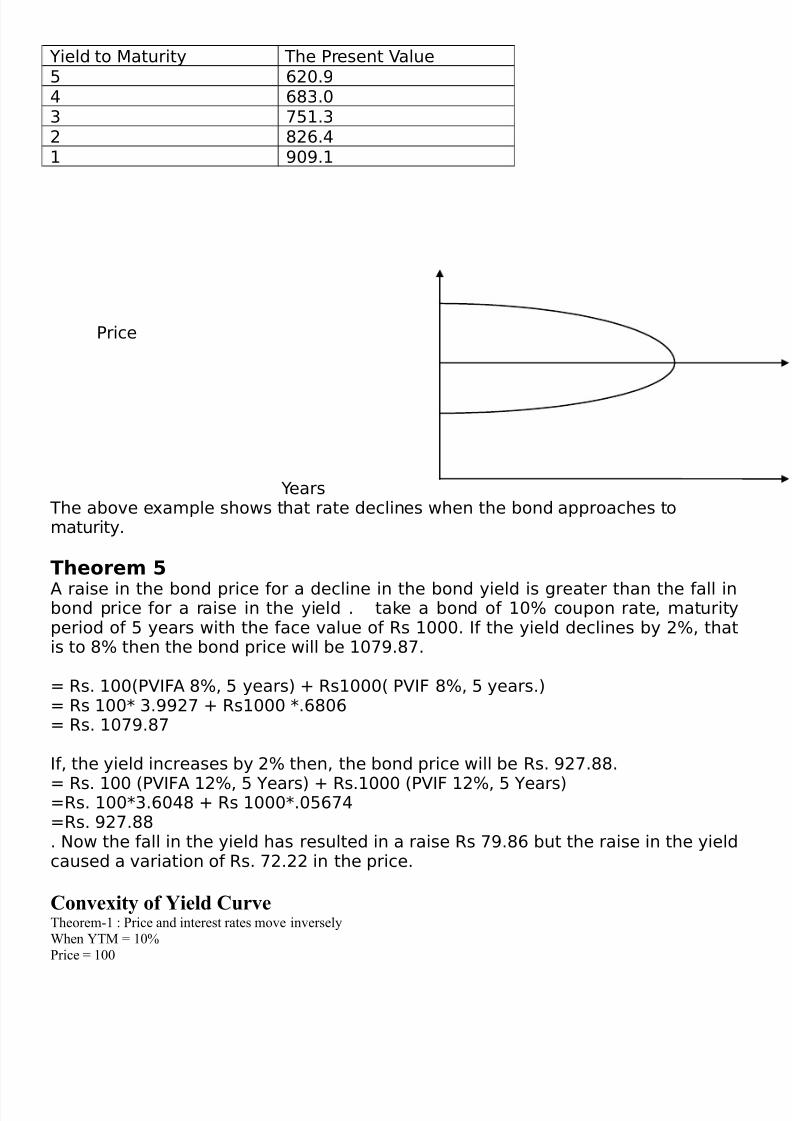
Gield to Maturity The ?resent Falue* -20.&) -#$.0$ 6*".$2 #2-.)" &0&."
?rice
Gears The abo+e e4ample shos that rate declines hen the bond approaches tomaturity.
&%eorem
A raise in the bond price for a decline in the bond yield is greater than the fall inbond price for a raise in the yield . take a bond of "0K coupon rate' maturityperiod of * years ith the face +alue of 5s "000. If the yield declines by 2K' thatis to #K then the bond price ill be "06&.#6.
P 5s. "003?FIA #K' * years7 Q 5s"0003 ?FI #K' * years.7P 5s "00 $.&&26 Q 5s"000 .-#0-P 5s. "06&.#6
If' the yield increases by 2K then' the bond price ill be 5s. &26.##.
P 5s. "00 3?FIA "2K' * Gears7 Q 5s."000 3?FI "2K' * Gears7P5s. "00$.-0)# Q 5s "000.0*-6)P5s. &26.##. :o the fall in the yield has resulted in a raise 5s 6&.#- but the raise in the yieldcaused a +ariation of 5s. 62.22 in the price.
Conveity of 2ield CurveTheorem(3 2 #rice and interest rates move inverselyhen TM = 39:#rice = 399
8/17/2019 Notes Saim
http://slidepdf.com/reader/full/notes-saim 24/57
hen TM = 33:#rice = R.;;hen TM = R:#rice = 394.;6Theorem(4 2 + decrease in interest rates raises bond prices by more than a corresponding increase in rates lowers pricehen TM = 39:#rice = 399
hen TM = 33:
#rice = R.;;)hange in price = (4.G;:hen TM = R:#rice = 394.;6)hange in price = O4.;6:This the most important theorem of bond which says that price movement of bond with change is interest rate eitherside is not e*ual. #rice of the bond increases more than it declines when e*ual change in interest rate is given. "n aboveillustration you can clearly see that when yield declines by 3: price increases by 4.;6: while in case of increase in yield by 3:, price decline is 4.G;:. +s price curve of the bond is convex, you gain more than you lose.
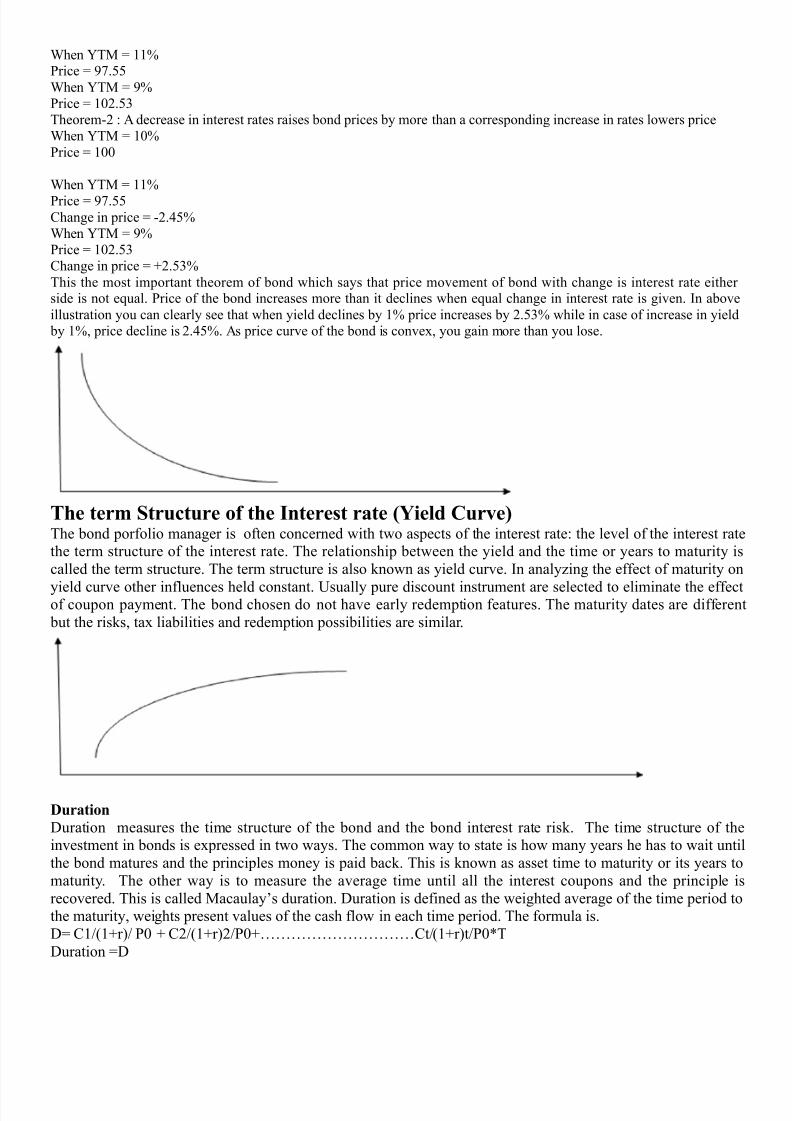
The term !tructure of the 6nterest rate =2ield Curve>The bond porfolio manager is often concerned with two aspects of the interest rate2 the level of the interest ratethe term structure of the interest rate. The relationship between the yield and the time or years to maturity iscalled the term structure. The term structure is also known as yield curve. "n analy&ing the effect of maturity on
yield curve other influences held constant. sually pure discount instrument are selected to eliminate the effectof coupon payment. The bond chosen do not have early redemption features. The maturity dates are different but the risks, tax liabilities and redemption possibilities are similar.
"uration
uration measures the time structure of the bond and the bond interest rate risk. The time structure of theinvestment in bonds is expressed in two ways. The common way to state is how many years he has to wait untilthe bond matures and the principles money is paid back. This is known as asset time to maturity or its years tomaturity. The other way is to measure the average time until all the interest coupons and the principle isrecovered. This is called MacaulayCs duration. uration is defined as the weighted average of the time period tothe maturity, weights present values of the cash flow in each time period. The formula is.= )3-!3Or%- #9 O )4-!3Or%4-#9O)t-!3Or%t-#9NTuration =
8/17/2019 Notes Saim
http://slidepdf.com/reader/full/notes-saim 25/57
)= )ash flows8 = )urrent TMT= number of years#I !)%= #resent value of the cash flow#9= Sum of the present value of the cash flows.<eneral 8ules2
• Jarger the coupon rate, lower the duration and less volatile the bond price.• Jonger the term to maturity, longer the duration and more the volatile bond.
• Kigher the TM, lower the bond duration and bond volatility, and vice versa.• "n a &ero coupon bond, the bonds term to maturity and uration are the same.
"mportance of the duration2The concept of the duration is important because it provide the length of a bond, helpful in evolvingimmuni&ation! the techni*ue that make the bond portfolio holder to be relatively certain about the promisedstream of the cash flows.% strategies for the portfolio management and measures the sensitivity of the bond price to changes in the interest rate.
Fundamental analysis
3. Economic +nalysis4. "ndustry analysis
6. )ompany +nalysis3. Economic +nalysisEconomic "ndicators
• <#• /ational "ncome• Employment• "nflation
8egression Model4. "ndustry +nalysis
• <rowth• )ost Structure and #rofitability
• /ature of the "ndustry• /ature of the )ompetition• <overnment policy• Jabor market condition
8esearch and development
Fundamental analysis ? Technical #nalysis
. )ompany analysis• )apital structure• <rowth of the company and sales• Stability of the sales•
Earning of the company• 7inancial statement
Technical #nalysis
"t is the process of identifying the time reversal at an earlier stage to formulate buying and selling strategies.ith the help of many indicators we can prdict the price volume and demand supply of the stocks.+ssumptions2
3. The market discount everything.4. The market value is determined by the demand and supply.6. The market always moves in trend
Technical #nalysis
8/17/2019 Notes Saim
http://slidepdf.com/reader/full/notes-saim 26/57
Technical tools:
3. ow theory4. Iolume Trade6. Moving +verageG. $dd Jot Trading
"ow theory
Based on Kypothesis
• /o individual buyer or seller influence the ma5or trend in market.• Market discounts everything.• "t is not a tool to beat the market. "t provide a way to understand it better.
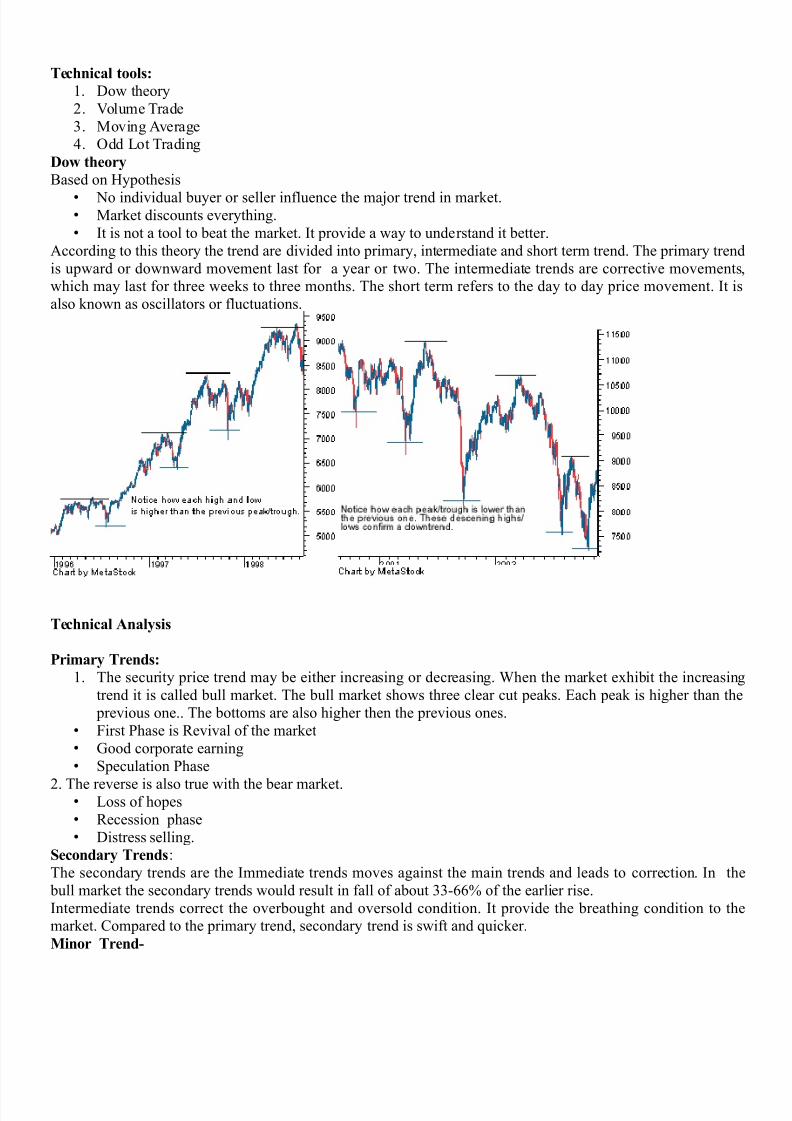
+ccording to this theory the trend are divided into primary, intermediate and short term trend. The primary trendis upward or downward movement last for a year or two. The intermediate trends are corrective movements,which may last for three weeks to three months. The short term refers to the day to day price movement. "t isalso known as oscillators or fluctuations.
Technical #nalysis
Primary Trends:
3. The security price trend may be either increasing or decreasing. hen the market exhibit the increasingtrend it is called bull market. The bull market shows three clear cut peaks. Each peak is higher than the previous one.. The bottoms are also higher then the previous ones.
• 7irst #hase is 8evival of the market• <ood corporate earning• Speculation #hase
4. The reverse is also true with the bear market.• Joss of hopes• 8ecession phase• istress selling.
!econdary Trends2The secondary trends are the "mmediate trends moves against the main trends and leads to correction. "n the bull market the secondary trends would result in fall of about 66(HH: of the earlier rise."ntermediate trends correct the overbought and oversold condition. "t provide the breathing condition to themarket. )ompared to the primary trend, secondary trend is swift and *uicker.Minor Trend7
8/17/2019 Notes Saim
http://slidepdf.com/reader/full/notes-saim 27/57
Minor trend or tertiary moves are called as random wriggles. They are simply the daily price fluctuationsMinor trends tries to correct the secondary trend movement. "t is better for the investors to concentrate on the primary and secondary trends.
Technical #nalysis
olume of trade A
ow gave special emphasis on volume. Iolume expands along with the bull and bear market and narrows down
in the bear market. "f the volume falls with the rise or vice versa, it is the matter of concern for the investors andthe trend may not persist for the longer time. Technical analyst used volume as an excellent method ofconfirming the trend. The market is said to be bullish when small volume of trade and large volume trade followfall in price and the rise in price.Jarge rise in price or large fall in price leads to large increase in volume . Jarge volume with rise in priceindicates that bull market and the large volume with fall in price indicates bear market."f the volume declines for consecutive five days, then it will be continue for another four days and the same istrue in increasing volume.;dd lot trading7
Shares are generally sold in lot of hundreds. Share which are sold in smaller lot fewer than 399 are called oddlot. Such buyers and sellers are also called odd lotters. $dd lot purchase to odd lot sale !#urchase : sales% is
called as lot index. The increase in odd lot purchase results in an increase in the index. 8elatively more sellingleads to fall in the index. "t is generally considered that the professional investors is more informed and strongerthan odd lotters. hen the professional investors dominate the market, the market is considered weak. Thenotion behind is that odd lot purchase is concentrated at the top of the market cycle and selling at the bottom.Kigh odd lot purchase forecast fall in the market price and low purchaseUsales ratio are presumed to occurtowards the end of bear market.Moving average7
The market indices do not rise or fall in straight line. The upward and downward movements are interrupted bythe counter moves. The underlying trend can be studied by smoothing of the data. To smooth the data movingaverage techni*ue is used.The word moving means that the body of the data moves ahead to include the recent observations. "f it is five
day moving average, on the sixth day the body of the data moves to include the sixth day observationeliminating the first dayCs observation. Jikewise it continues. "n this method, closing price of the stock is used.The moving average are used to study the movement of the market as well as the individual scrip prices. Themoving average indicates that the underlying trend in the scrip. The period of average determines the period ofthe trend that is being identified. 7ro underlying short term trend, a39 day or 69 day moving average are used"n the case of medium term trend ;9 day to 34; day are adopt. 499 day moving average is used to identify thelong term trend.
"ifference between Fundamental and Technical #nalysis
$asis Fundamental #nalysis Technical #nalysis
efinition2 )alculates stock value using economicfactors, known as fundamentals. ses price movement of security to predict future price movements
ata gathered from2 7inancial statements )harts
Stock bought2 hen price falls below intrinsic valuehen trader believes they can sell iton for a higher price
Time hori&on2 Jong(term approach Short(term approach
7unction2 "nvesting Trade
)oncepts used28eturn on E*uity !8$E% and 8eturn on+ssets !8$+%
ow Theory, #rice ata

8/17/2019 Notes Saim
http://slidepdf.com/reader/full/notes-saim 28/57
Iision2 looks backward as well as forward looks backward
8/17/2019 Notes Saim
http://slidepdf.com/reader/full/notes-saim 29/57
8/17/2019 Notes Saim
http://slidepdf.com/reader/full/notes-saim 30/57
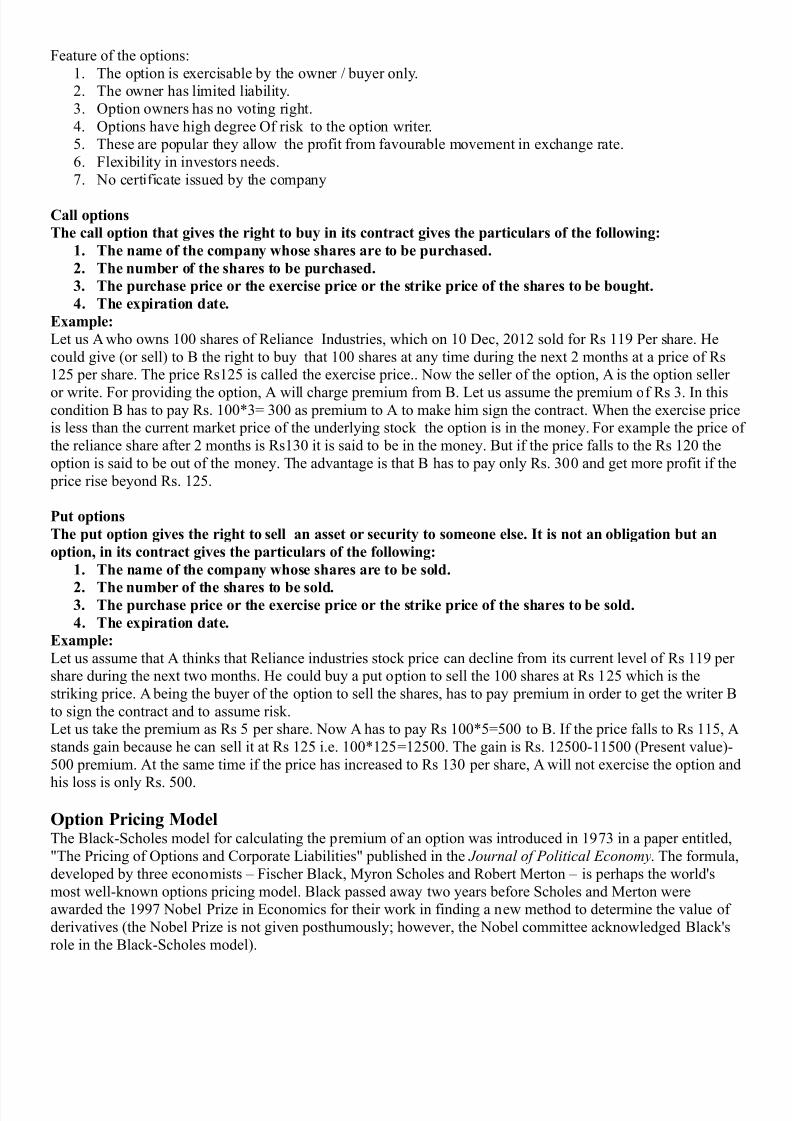
7eature of the options23. The option is exercisable by the owner - buyer only.4. The owner has limited liability.6. $ption owners has no voting right.G. $ptions have high degree $f risk to the option writer.;. These are popular they allow the profit from favourable movement in exchange rate.H. 7lexibility in investors needs.. /o certificate issued by the company
Call options
The call option that gives the right to buy in its contract gives the particulars of the following:
*, The name of the company whose shares are to be purchased,
+, The number of the shares to be purchased,
8, The purchase price or the eercise price or the strike price of the shares to be bought,
B, The epiration date,
&le:
Jet us + who owns 399 shares of 8eliance "ndustries, which on 39 ec, 4934 sold for 8s 33R #er share. Kecould give !or sell% to B the right to buy that 399 shares at any time during the next 4 months at a price of 8s34; per share. The price 8s34; is called the exercise price.. /ow the seller of the option, + is the option seller
or write. 7or providing the option, + will charge premium from B. Jet us assume the premium of 8s 6. "n thiscondition B has to pay 8s. 399N6= 699 as premium to + to make him sign the contract. hen the exercise priceis less than the current market price of the underlying stock the option is in the money. 7or example the price ofthe reliance share after 4 months is 8s369 it is said to be in the money. But if the price falls to the 8s 349 theoption is said to be out of the money. The advantage is that B has to pay only 8s. 699 and get more profit if the price rise beyond 8s. 34;.
Put options
The put option gives the right to sell an asset or security to someone else, 6t is not an obligation but an
option in its contract gives the particulars of the following:
*, The name of the company whose shares are to be sold,
+, The number of the shares to be sold,8, The purchase price or the eercise price or the strike price of the shares to be sold,
B, The epiration date,
&le:
Jet us assume that + thinks that 8eliance industries stock price can decline from its current level of 8s 33R pershare during the next two months. Ke could buy a put option to sell the 399 shares at 8s 34; which is thestriking price. + being the buyer of the option to sell the shares, has to pay premium in order to get the writer Bto sign the contract and to assume risk.Jet us take the premium as 8s ; per share. /ow + has to pay 8s 399N;=;99 to B. "f the price falls to 8s 33;, +stands gain because he can sell it at 8s 34; i.e. 399N34;=34;99. The gain is 8s. 34;99(33;99 !#resent value%(;99 premium. +t the same time if the price has increased to 8s 369 per share, + will not exercise the option and
his loss is only 8s. ;99.
;ption Pricing ModelThe Black(Scholes model for calculating the premium of an option was introduced in 3R6 in a paper entitled,1The #ricing of $ptions and )orporate Jiabilities1 published in the Journal of Political Economy. The formula,developed by three economists @ 7ischer Black, Myron Scholes and 8obert Merton @ is perhaps the world'smost well(known options pricing model. Black passed away two years before Scholes and Merton wereawarded the 3RR /obel #ri&e in Economics for their work in finding a new method to determine the value ofderivatives !the /obel #ri&e is not given posthumously0 however, the /obel committee acknowledged Black'srole in the Black(Scholes model%.
8/17/2019 Notes Saim
http://slidepdf.com/reader/full/notes-saim 31/57
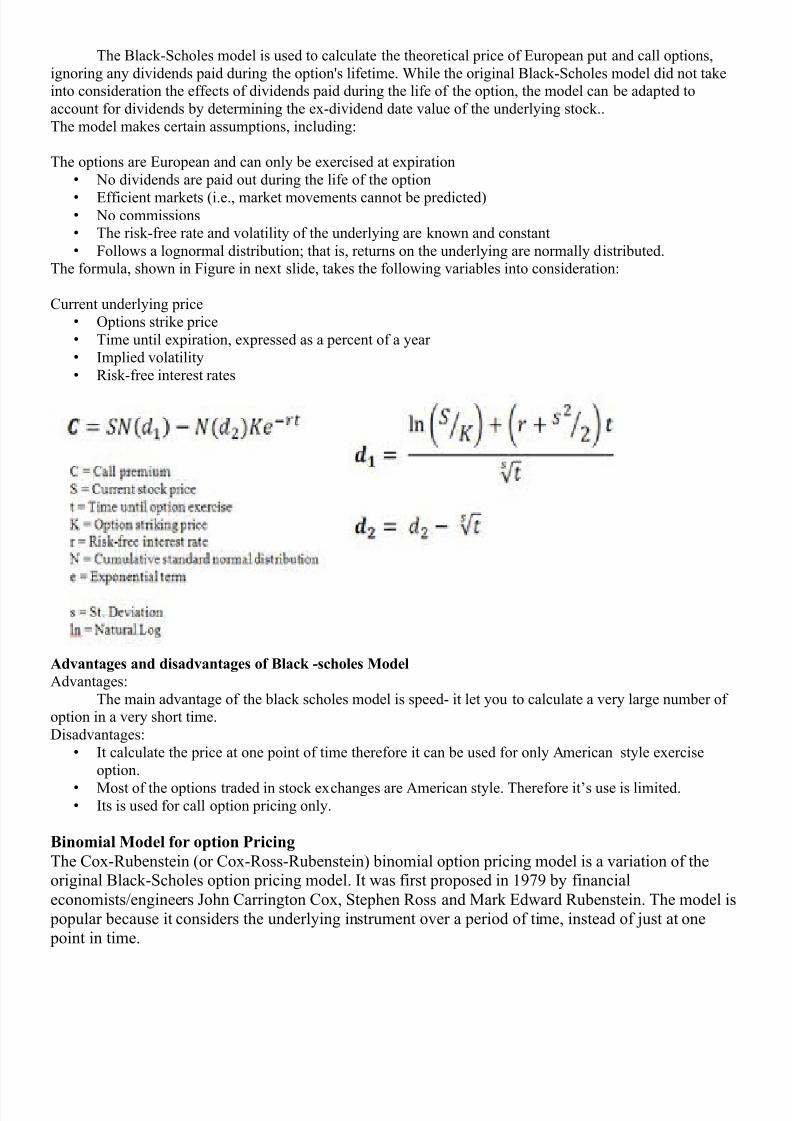
The Black(Scholes model is used to calculate the theoretical price of European put and call options,ignoring any dividends paid during the option's lifetime. hile the original Black(Scholes model did not takeinto consideration the effects of dividends paid during the life of the option, the model can be adapted toaccount for dividends by determining the ex(dividend date value of the underlying stock..The model makes certain assumptions, including2
The options are European and can only be exercised at expiration• /o dividends are paid out during the life of the option
• Efficient markets !i.e., market movements cannot be predicted%• /o commissions• The risk(free rate and volatility of the underlying are known and constant• 7ollows a lognormal distribution0 that is, returns on the underlying are normally distributed.
The formula, shown in 7igure in next slide, takes the following variables into consideration2
)urrent underlying price• $ptions strike price• Time until expiration, expressed as a percent of a year• "mplied volatility• 8isk(free interest rates
#dvantages and disadvantages of $lack 7scholes Model
+dvantages2The main advantage of the black scholes model is speed( it let you to calculate a very large number of
option in a very short time.isadvantages2
• "t calculate the price at one point of time therefore it can be used for only +merican style exerciseoption.
• Most of the options traded in stock exchanges are +merican style. Therefore itCs use is limited.• "ts is used for call option pricing only.
$inomial Model for option Pricing
The )ox(8ubenstein !or )ox(8oss(8ubenstein% binomial option pricing model is a variation of theoriginal Black(Scholes option pricing model. "t was first proposed in 3RR by financialeconomists-engineers Vohn )arrington )ox, Stephen 8oss and Mark Edward 8ubenstein. The model is popular because it considers the underlying instrument over a period of time, instead of 5ust at one point in time.
8/17/2019 Notes Saim
http://slidepdf.com/reader/full/notes-saim 32/57
This model takes into account expected changes in various parameters over an option's life,thereby producing a more accurate estimate of option prices than created by models that consider onlyone point in time. Because of this, the )ox(8oss(8ubenstein model is especially useful for analy&ing+merican style options, which can be exercised at any time up to expiration !European style optionscan only be exercised upon expiration%.
The )ox(8oss(8ubenstein model uses a risk(neutral valuation method. "ts underlying principal
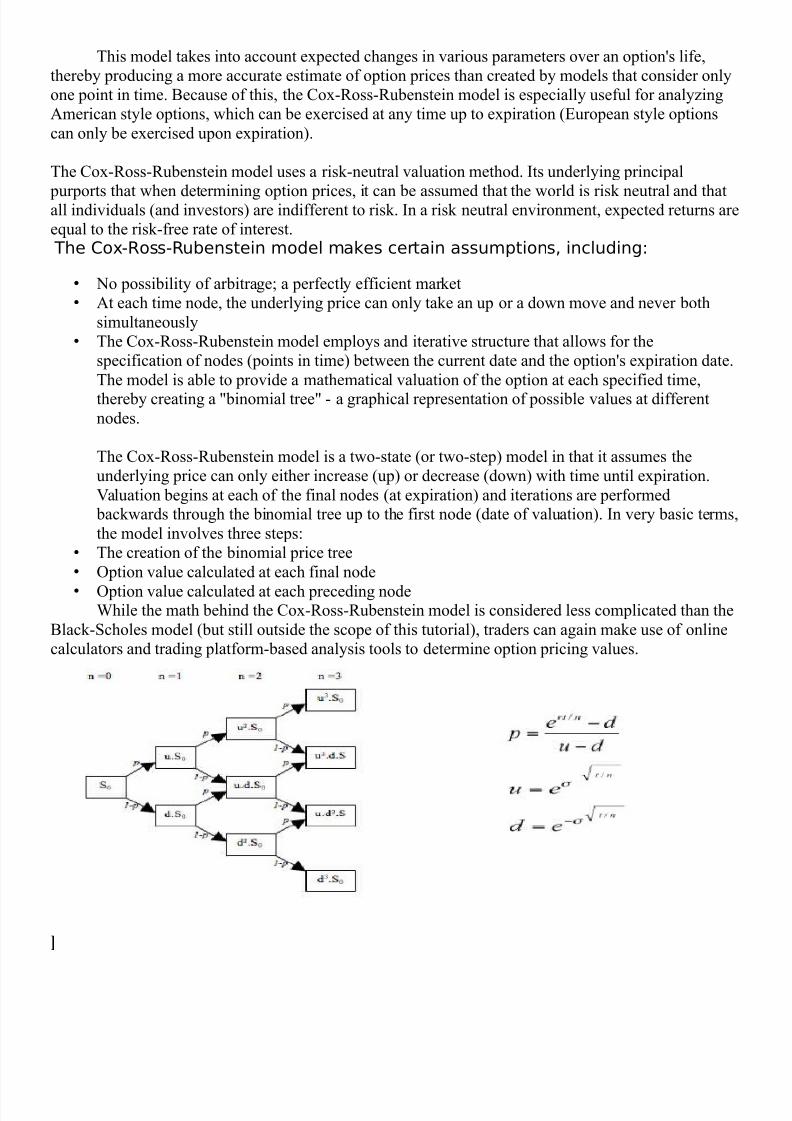
purports that when determining option prices, it can be assumed that the world is risk neutral and thatall individuals !and investors% are indifferent to risk. "n a risk neutral environment, expected returns aree*ual to the risk(free rate of interest. The Co45oss5ubenstein model makes certain assumptions' including>
• /o possibility of arbitrage0 a perfectly efficient market• +t each time node, the underlying price can only take an up or a down move and never both
simultaneously• The )ox(8oss(8ubenstein model employs and iterative structure that allows for the
specification of nodes !points in time% between the current date and the option's expiration date.The model is able to provide a mathematical valuation of the option at each specified time,thereby creating a 1binomial tree1 ( a graphical representation of possible values at differentnodes.
The )ox(8oss(8ubenstein model is a two(state !or two(step% model in that it assumes theunderlying price can only either increase !up% or decrease !down% with time until expiration.Ialuation begins at each of the final nodes !at expiration% and iterations are performed backwards through the binomial tree up to the first node !date of valuation%. "n very basic terms,the model involves three steps2
• The creation of the binomial price tree• $ption value calculated at each final node• $ption value calculated at each preceding node
hile the math behind the )ox(8oss(8ubenstein model is considered less complicated than theBlack(Scholes model !but still outside the scope of this tutorial%, traders can again make use of onlinecalculators and trading platform(based analysis tools to determine option pricing values.
(
8/17/2019 Notes Saim
http://slidepdf.com/reader/full/notes-saim 33/57
Futures"n finance, a futures contract !more collo*uially, futures% is a standardi&ed contract between two parties to buyor sell a specified asset of standardi&ed *uantity and *uality for a price agreed upon today !the futures price orstrike price% with delivery and payment occurring at a specified future date, the delivery date. The contracts arenegotiated at a futures exchange, which acts as an intermediary between the two parties. The party agreeing to buy the underlying asset in the future, the 1buyer1 of the contract, is said to be 1long1, and the party agreeing tosell the asset in the future, the 1seller1 of the contract, is said to be 1short1. The terminology reflects theexpectations of the partiesWthe buyer hopes or expects that the asset price is going to increase, while the sellerhopes or expects that it will decrease in near future.
"n many cases, the underlying asset to a futures contract may not be traditional commodities at all @ thatis, for financial futures the underlying item can be any financial instrument !also including currency, bonds, andstocks%0 they can be also based on intangible assets or referenced items, such as stock indexes and interest rates.nlike an option both parties of a futures contract must fulfill the contract on the delivery date. The sellerdelivers the underlying asset to the buyer, or, if it is a cash(settled futures contract, then cash is transferred fromthe futures trader who sustained a loss to the one who made a profit. To exit the commitment prior to thesettlement date, the holder of a futures position can close out its contract obligations by taking the opposite
position on another futures contract on the same asset and settlement date. The difference in futures prices isthen a profit or loss.
Marking to market7hile the futures contract specifies a trade taking place in the future, the purpose of the futures exchangeinstitution is to act as intermediary and minimi&e the risk of default by either party. Thus the exchange re*uires both parties to put up an initial amount of cash, the margin. +dditionally, since the futures price will generallychange daily, the difference in the prior agreed(upon price and the daily futures price is settled daily also!variation margin%. The exchange will draw money out of one party's margin account and put it into the other'sso that each party has the appropriate daily loss or profit. "f the margin account goes below a certain value, thena margin call is made and the account owner must replenish the margin account. This process is known asmarking to market . Thus on the delivery date, the amount exchanged is not the specified price on the contract but the spot value !i.e. the original value agreed upon, since any gain or loss has already been previously settled by marking to market%.
Features ;F Future utures contracts ensure their li*uidity by being highly standardi&ed, usually by specifying2
• The underlying asset or instrument. This could be anything from a barrel of crude oil to a short terminterest rate.
• The type of settlement, either cash settlement or physical settlement.• The amount and units of the underlying asset per contract. This can be the notional amount of bonds, a
fixed number of barrels of oil, units of foreign currency, the notional amount of the deposit over whichthe short term interest rate is traded, etc.• The currency in which the futures contract is *uoted.• The grade of the deliverable. "n the case of bonds, this specifies which bonds can be delivered. "n the
case of physical commodities, this specifies not only the *uality of the underlying goods but also themanner and location of delivery.
• The delivery month.• The last trading date.• $ther details such as the commodity tick, the minimum permissible price fluctuation.
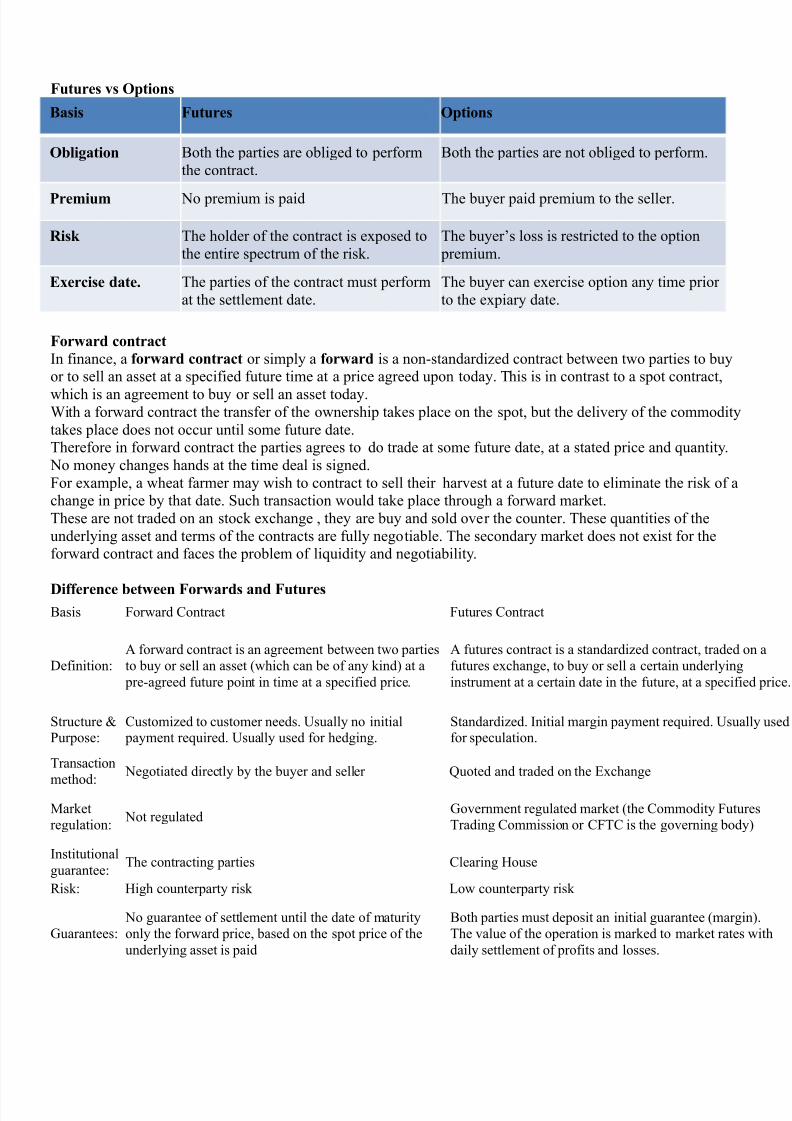
8/17/2019 Notes Saim
http://slidepdf.com/reader/full/notes-saim 34/57
Futures vs ;ptions
$asis Futures ;ptions
;bligation Both the parties are obliged to performthe contract.
Both the parties are not obliged to perform.
Premium /o premium is paid The buyer paid premium to the seller.
Risk The holder of the contract is exposed tothe entire spectrum of the risk.
The buyerCs loss is restricted to the option premium.
&ercise date, The parties of the contract must performat the settlement date.
The buyer can exercise option any time priorto the expiary date.
Forward contract
"n finance, a forward contract or simply a forward is a non(standardi&ed contract between two parties to buyor to sell an asset at a specified future time at a price agreed upon today. This is in contrast to a spot contract,
which is an agreement to buy or sell an asset today.ith a forward contract the transfer of the ownership takes place on the spot, but the delivery of the commoditytakes place does not occur until some future date.Therefore in forward contract the parties agrees to do trade at some future date, at a stated price and *uantity. /o money changes hands at the time deal is signed.7or example, a wheat farmer may wish to contract to sell their harvest at a future date to eliminate the risk of achange in price by that date. Such transaction would take place through a forward market.These are not traded on an stock exchange , they are buy and sold over the counter. These *uantities of theunderlying asset and terms of the contracts are fully negotiable. The secondary market does not exist for theforward contract and faces the problem of li*uidity and negotiability.
"ifference between Forwards and FuturesBasis 7orward )ontract 7utures )ontract
efinition2+ forward contract is an agreement between two partiesto buy or sell an asset !which can be of any kind% at a pre(agreed future point in time at a specified price.
+ futures contract is a standardi&ed contract, tradedfutures exchange, to buy or sell a certain underlyinginstrument at a certain date in the future, at a specif
Structure X#urpose2
)ustomi&ed to customer needs. sually no initial payment re*uired. sually used for hedging.
Standardi&ed. "nitial margin payment re*uired. sufor speculation.
Transaction
method2
/egotiated directly by the buyer and seller Yuoted and traded on the Exchange
Marketregulation2
/ot regulated<overnment regulated market !the )ommodity 7utuTrading )ommission or )7T) is the governing bod
"nstitutionalguarantee2
The contracting parties )learing Kouse
8isk2 Kigh counterparty risk Jow counterparty risk
<uarantees2 /o guarantee of settlement until the date of maturityonly the forward price, based on the spot price of theunderlying asset is paid
Both parties must deposit an initial guarantee !margThe value of the operation is marked to market ratedaily settlement of profits and losses.
8/17/2019 Notes Saim
http://slidepdf.com/reader/full/notes-saim 35/57
)ontractMaturity2
7orward contracts generally mature by delivering thecommodity.
7uture contracts may not necessarily mature by deliof commodity.
Expiry date2 epending on the transaction Standardi&ed
Method of pre(termination2
$pposite contract with same or different counterparty.)ounterparty risk remains while terminating withdifferent counterparty.
$pposite contract on the exchange.
)ontract
si&e2
epending on the transaction and the re*uirements of the
contracting parties. Standardi&ed
@ain or loss of the option Player
@ain or <oss of the Call $uyer7
hen a market price 5ust enough to exceed the strike price by 5ust to cover the premium, the profit is 9 to the buyer, if he exercises the option. This is the point of no profit and no loss and this will be called as Break(even point. "f the investor feels that there will not be any further price rise in the stock price, to make up the premiumcharges, he has to buy the break even point. "f there is a rise in the price of the stock beyond the break even point, he would gain profit. By making the option writer to sell the share to him at the strike price and resellingit in the market, he can earn profit.@ain or <oss of the Call 0riter7
hen the market price is lower than the strike price, the call buyer may not exercise the option, hence the premium is the only profit the call writer can gain. "f the price increases further it would be a loss to the callwriter.
@ain or loss of the option Player
@ain or <oss of the put $uyer7
The put buyer gets gain, if the market price of the optioned security is below the strike price and incurlosses, when the price is higher than the strike price.
@ain or <oss of the put 0riter7
The gains of the put buyer are the losses of the put writer. The put writer. The put writer has to be buy
at an agreed price even if the market price is lower than the strike price. 7pr example, the strike price of the putoption is 8s ;9 but the market price is 8s 6;, now the put writer has to buy it at 8s ;9 and incur a loss of 8s 3;less premium per share. But if the market price of the share increases the put writer will gain the premium because the put buyer may not be willing to sell the share at the lower rate. The strike price are lower than themarket price.
;ption trading strategies
• ;ption strategies are the simultaneous, and often mixed, buying or selling of one or more options thatdiffer in one or more of the options' variables. This is often done to gain exposure to a specific type ofopportunity or risk while eliminating other risks as part of a trading strategy. + very straight forwardstrategy might simply be the buying or selling of a single option, however option strategies often refer to
a combination of simultaneous buying and or selling of options.• $ptions strategies allow to profit from movements in the underlying that are bullish, bearish or neutral.
"n the case of neutral strategies, they can be further classified into those that are bullish on volatility andthose that are bearish on volatility. The option positions used can be long and-or short positions in calls.
$ullish strategies
• $ullish options strategies are employed when the options trader expects the underlying stock price tomove upwards. "t is necessary to assess how high the stock price can go and the time frame in which therally will occur in order to select the optimum trading strategy.
8/17/2019 Notes Saim
http://slidepdf.com/reader/full/notes-saim 36/57
• The most bullish of options trading strategies is the simple call buying strategy used by most noviceoptions traders.
• Stocks seldom go up by leaps and bounds. Moderately bullish options traders usually set a target pricefor the bull run and utili&e bull spreads to reduce cost. !"t does not reduce risk because the options canstill expire worthless.% hile maximum profit is capped for these strategies, they usually cost less toemploy for a given nominal amount of exposure. The bull call spread and the bull put spread arecommon examples of moderately bullish strategies.
• Mildly bullish trading strategies are options strategies that make money as long as the underlying stock
price does not go down by the option's expiration date.
$earish strategies
• $earish options strategies are employed when the options trader expects the underlying stock price tomove downwards. "t is necessary to assess how low the stock price can go and the time frame in whichthe decline will happen in order to select the optimum trading strategy.
• The most bearish of options trading strategies is the simple put buying strategy utili&ed by most noviceoptions traders.
• Stock prices only occasionally make steep downward moves. Moderately bearish options traders usuallyset a target price for the expected decline and utili&e bear spreads to reduce cost. hile maximum profit
is capped for these strategies, they usually cost less to employ. The bear call spread and the bear putspread are common examples of moderately bearish strategies.
• Mildly bearish trading strategies are options strategies that make money as long as the underlying stock price does not go up by the options expiration date. These strategies may provide a small upside protection as well. "n general, bearish strategies yield less profit with less risk of loss.
%eutral or non7directional strategies
/eutral strategies in options trading are employed when the options trader does not know whether theunderlying stock price will rise or fall. +lso known as non(directional strategies, they are so named because the potential to profit does not depend on whether the underlying stock price will go upwards. 8ather, the correctneutral strategy to employ depends on the expected volatility of the underlying stock price.
@uts( sell "TM !in the money% put and call$utterfly( buy "TM !in the money% and $TM !out of the money% call, sell two at the money calls, or vice versa.!trangle( the simultaneous buying or selling of out(of(the(money put and an out(of(the(money call, with thesame expiration. Similar to the straddle, but with different strike prices.
;ption @reeks
"n mathematical finance, the @reeks are the *uantities representing the sensitivity of the price of derivativessuch as options to a change in underlying parameters on which the value of an instrument or portfolio offinancial instruments is dependent. The name is used because the most common of these sensitivities are oftendenoted by <reek letters. )ollectively these have also been called the risk sensitivities, risk measures orhedge parameters,
The <reeks are vital tools in risk management. Each <reek measures the sensitivity of the value of a portfolio toa small change in a given underlying parameter, so that component risks may be treated in isolation, and the portfolio rebalanced accordingly to achieve a desired exposure0 see for example delta hedging."elta
"elta,, measures the rate of change of option value with respect to changes in the underlying asset's price. eltais the first derivative of the value of the option with respect to the underlying instrument's price .ega
ega measures sensitivity to volatility. Iega is the derivative of the option value with respect to the volatility ofthe underlying asset.Theta
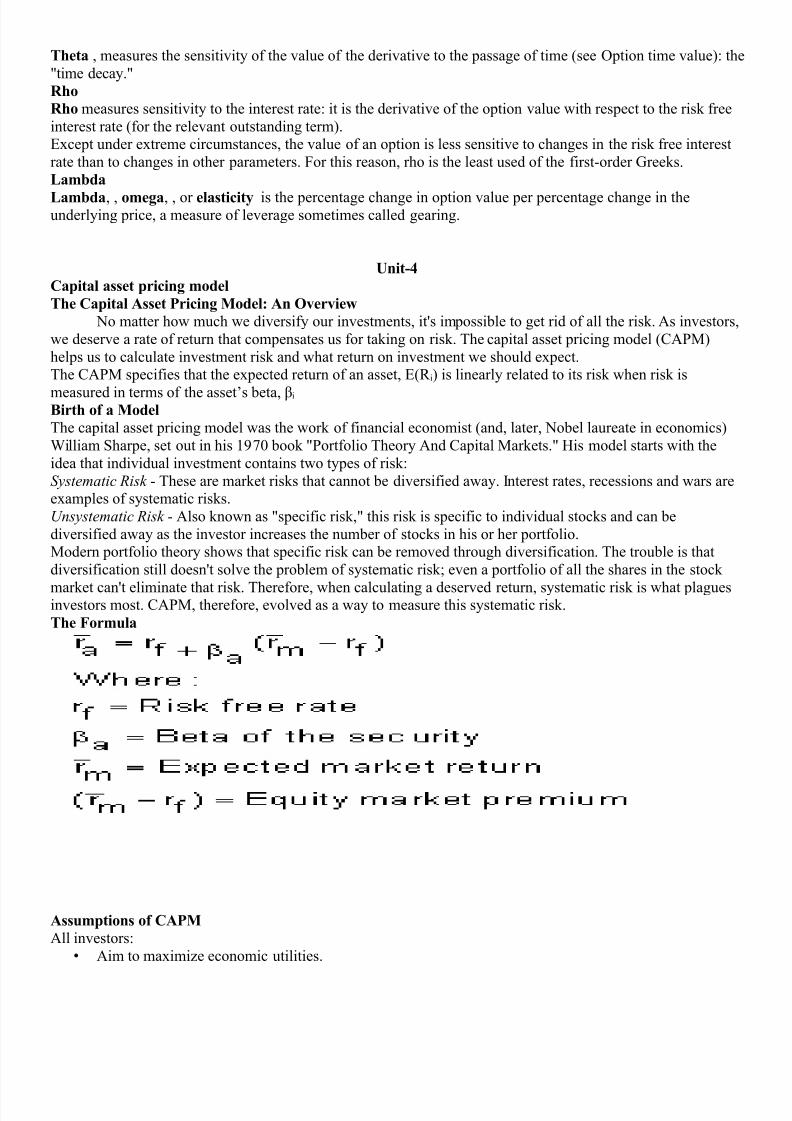
8/17/2019 Notes Saim
http://slidepdf.com/reader/full/notes-saim 37/57
Theta , measures the sensitivity of the value of the derivative to the passage of time !see $ption time value%2 the1time decay.1Rho
Rho measures sensitivity to the interest rate2 it is the derivative of the option value with respect to the risk freeinterest rate !for the relevant outstanding term%.Except under extreme circumstances, the value of an option is less sensitive to changes in the risk free interestrate than to changes in other parameters. 7or this reason, rho is the least used of the first(order <reeks.<ambda
<ambda, , omega, , or elasticity is the percentage change in option value per percentage change in theunderlying price, a measure of leverage sometimes called gearing.
5nit7B
Capital asset pricing model
The Capital #sset Pricing Model: #n ;verview
/o matter how much we diversify our investments, it's impossible to get rid of all the risk. +s investors,we deserve a rate of return that compensates us for taking on risk. The capital asset pricing model !)+#M%helps us to calculate investment risk and what return on investment we should expect.The )+#M specifies that the expected return of an asset, E!8 i% is linearly related to its risk when risk is
measured in terms of the assetCs beta, Zi
$irth of a Model
The capital asset pricing model was the work of financial economist !and, later, /obel laureate in economics%illiam Sharpe, set out in his 3R9 book 1#ortfolio Theory +nd )apital Markets.1 Kis model starts with theidea that individual investment contains two types of risk2!ystematic Risk ( These are market risks that cannot be diversified away. "nterest rates, recessions and wars areexamples of systematic risks."nsystematic Risk ( +lso known as 1specific risk,1 this risk is specific to individual stocks and can bediversified away as the investor increases the number of stocks in his or her portfolio.Modern portfolio theory shows that specific risk can be removed through diversification. The trouble is thatdiversification still doesn't solve the problem of systematic risk0 even a portfolio of all the shares in the stock
market can't eliminate that risk. Therefore, when calculating a deserved return, systematic risk is what plaguesinvestors most. )+#M, therefore, evolved as a way to measure this systematic risk.The Formula
#ssumptions of C#PM
+ll investors2• +im to maximi&e economic utilities.
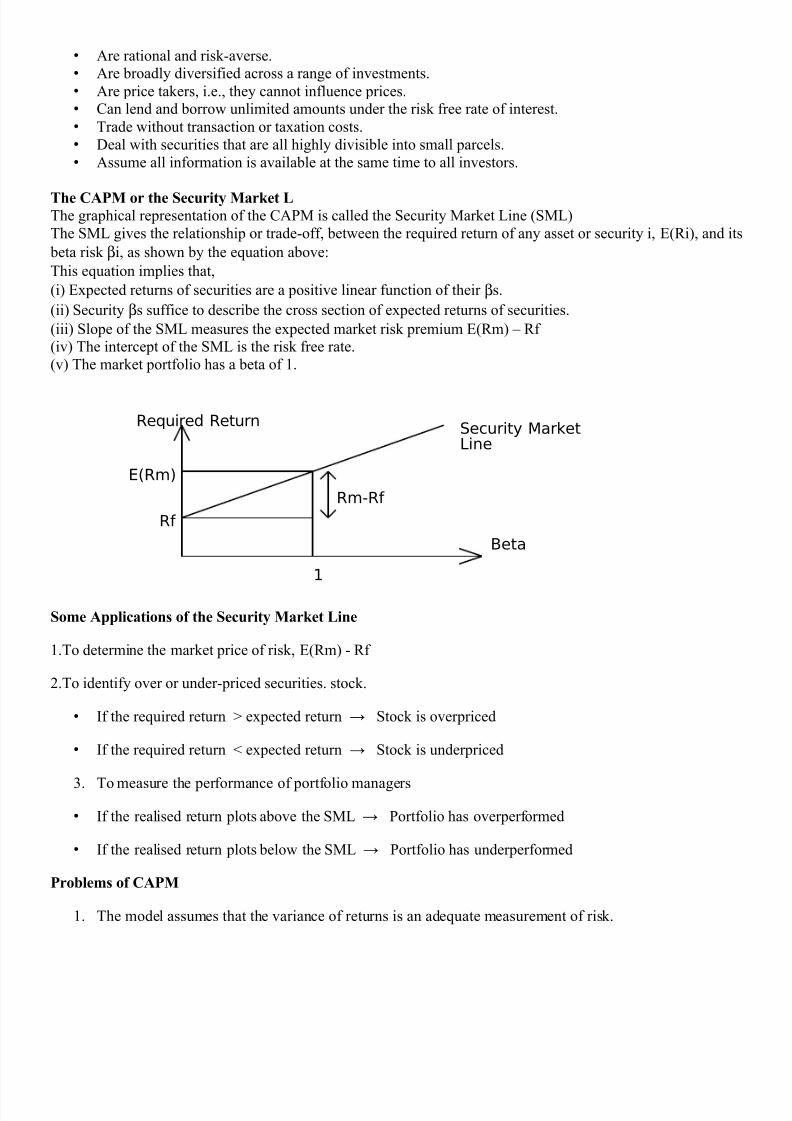
8/17/2019 Notes Saim
http://slidepdf.com/reader/full/notes-saim 38/57
• +re rational and risk(averse.• +re broadly diversified across a range of investments.• +re price takers, i.e., they cannot influence prices.• )an lend and borrow unlimited amounts under the risk free rate of interest.• Trade without transaction or taxation costs.• eal with securities that are all highly divisible into small parcels.• +ssume all information is available at the same time to all investors.
The C#PM or the !ecurity Market <The graphical representation of the )+#M is called the Security Market Jine !SMJ%The SMJ gives the relationship or trade(off, between the re*uired return of any asset or security i, E!8i%, and its
beta risk βi, as shown by the e*uation above2
This e*uation implies that,
!i% Expected returns of securities are a positive linear function of their βs.
!ii% Security βs suffice to describe the cross section of expected returns of securities.
!iii% Slope of the SMJ measures the expected market risk premium E!8m% @ 8f!iv% The intercept of the SMJ is the risk free rate.!v% The market portfolio has a beta of 3.
!ome #pplications of the !ecurity Market <ine
3.To determine the market price of risk, E!8m% ( 8f
4.To identify over or under(priced securities. stock.
• "f the re*uired return P expected return [ Stock is overpriced
• "f the re*uired return Q expected return [ Stock is underpriced
6. To measure the performance of portfolio managers
• "f the realised return plots above the SMJ [ #ortfolio has overperformed
• "f the realised return plots below the SMJ [ #ortfolio has underperformed
Problems of C#PM
3. The model assumes that the variance of returns is an ade*uate measurement of risk.
Security Marketine
5e;uired 5eturn
!eta
5f
"
E35m7
5m.5f
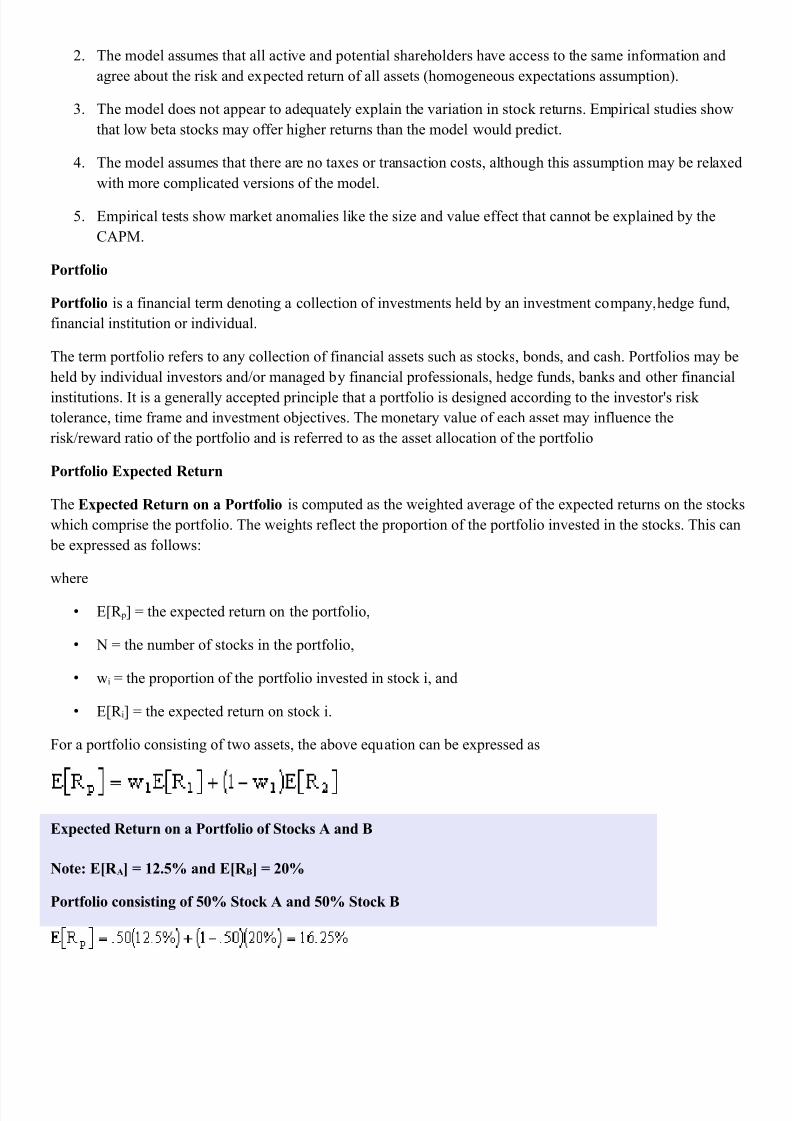
8/17/2019 Notes Saim
http://slidepdf.com/reader/full/notes-saim 39/57
4. The model assumes that all active and potential shareholders have access to the same information and
agree about the risk and expected return of all assets !homogeneous expectations assumption%.
6. The model does not appear to ade*uately explain the variation in stock returns. Empirical studies show
that low beta stocks may offer higher returns than the model would predict.
G. The model assumes that there are no taxes or transaction costs, although this assumption may be relaxed
with more complicated versions of the model.
;. Empirical tests show market anomalies like the si&e and value effect that cannot be explained by the
)+#M.
Portfolio
Portfolio is a financial term denoting a collection of investments held by an investment company, hedge fund,
financial institution or individual.
The term portfolio refers to any collection of financial assets such as stocks, bonds, and cash. #ortfolios may be
held by individual investors and-or managed by financial professionals, hedge funds, banks and other financial
institutions. "t is a generally accepted principle that a portfolio is designed according to the investor's risk
tolerance, time frame and investment ob5ectives. The monetary value of each asset may influence the
risk-reward ratio of the portfolio and is referred to as the asset allocation of the portfolio
Portfolio &pected Return
The &pected Return on a Portfolio is computed as the weighted average of the expected returns on the stocks
which comprise the portfolio. The weights reflect the proportion of the portfolio invested in the stocks. This can
be expressed as follows2
where
• E>8 p? = the expected return on the portfolio,
• / = the number of stocks in the portfolio,
• wi = the proportion of the portfolio invested in stock i, and
• E>8 i? = the expected return on stock i.
7or a portfolio consisting of two assets, the above e*uation can be expressed as
&pected Return on a Portfolio of !tocks # and $
%ote: &'R #( ) *+,-. and &'R $( ) +/.
Portfolio consisting of -/. !tock # and -/. !tock $
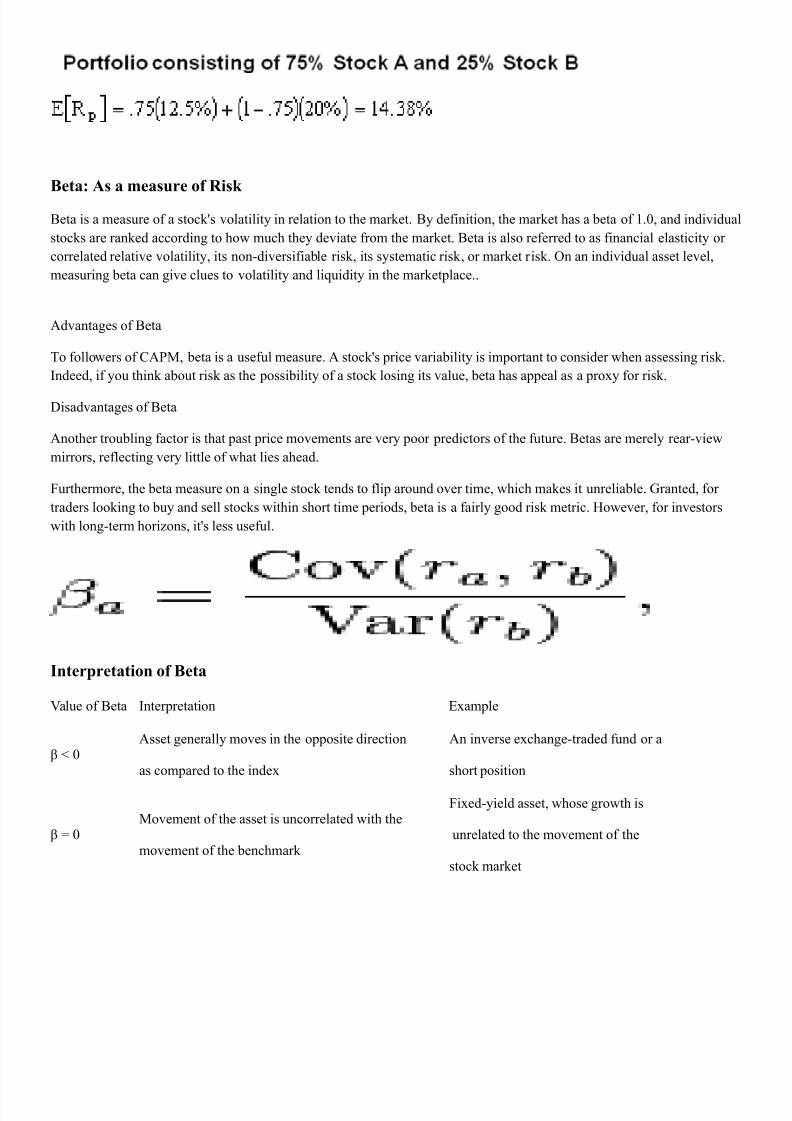
8/17/2019 Notes Saim
http://slidepdf.com/reader/full/notes-saim 40/57
$eta: #s a measure of Risk
Beta is a measure of a stock's volatility in relation to the market. By definition, the market has a beta of 3.9, and individual
stocks are ranked according to how much they deviate from the market. Beta is also referred to as financial elasticity or
correlated relative volatility, its non(diversifiable risk, its systematic risk , or market risk. $n an individual asset level,
measuring beta can give clues to volatility and li*uidity in the marketplace..
+dvantages of Beta
To followers of )+#M, beta is a useful measure. + stock's price variability is important to consider when assessing risk.
"ndeed, if you think about risk as the possibility of a stock losing its value, beta has appeal as a proxy for risk.
isadvantages of Beta
+nother troubling factor is that past price movements are very poor predictors of the future. Betas are merely rear(view
mirrors, reflecting very little of what lies ahead.
7urthermore, the beta measure on a single stock tends to flip around over time, which makes it unreliable. <ranted, for
traders looking to buy and sell stocks within short time periods, beta is a fairly good risk metric. Kowever, for investors
with long(term hori&ons, it's less useful.
6nterpretation of $eta
Ialue of Beta "nterpretation Example
Z Q 9+sset generally moves in the opposite direction
as compared to the index
+n inverse exchange(traded fund or a
short position
Z = 9Movement of the asset is uncorrelated with the
movement of the benchmark
7ixed(yield asset, whose growth is
unrelated to the movement of the
stock market
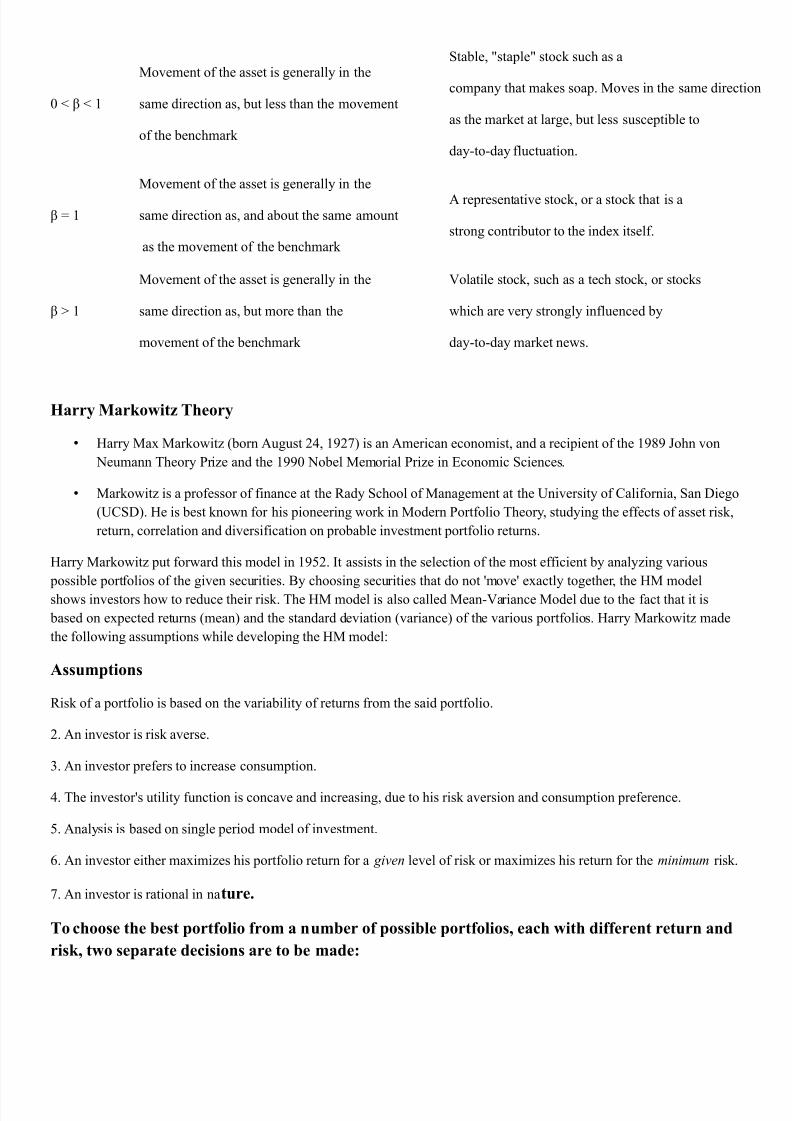
8/17/2019 Notes Saim
http://slidepdf.com/reader/full/notes-saim 41/57
9 Q Z Q 3
Movement of the asset is generally in the
same direction as, but less than the movement
of the benchmark
Stable, 1staple1 stock such as a
company that makes soap. Moves in the same direct
as the market at large, but less susceptible to
day(to(day fluctuation.
Z = 3
Movement of the asset is generally in the
same direction as, and about the same amount
as the movement of the benchmark
+ representative stock, or a stock that is a
strong contributor to the index itself.
Z P 3
Movement of the asset is generally in the
same direction as, but more than the
movement of the benchmark
Iolatile stock, such as a tech stock, or stocks
which are very strongly influenced by
day(to(day market news.
3arry Markowitz Theory
• Karry Max Markowit& !born +ugust 4G, 3R4% is an +merican economist, and a recipient of the 3R\R Vohn von
/eumann Theory #ri&e and the 3RR9 /obel Memorial #ri&e in Economic Sciences.
• Markowit& is a professor of finance at the 8ady School of Management at the niversity of )alifornia, San iego
!)S%. Ke is best known for his pioneering work in Modern #ortfolio Theory, studying the effects of asset risk,
return, correlation and diversification on probable investment portfolio returns.
Karry Markowit& put forward this model in 3R;4. "t assists in the selection of the most efficient by analy&ing various
possible portfolios of the given securities. By choosing securities that do not 'move' exactly together, the KM model
shows investors how to reduce their risk. The KM model is also called Mean(Iariance Model due to the fact that it is
based on expected returns !mean% and the standard deviation !variance% of the various portfolios. Karry Markowit& made
the following assumptions while developing the KM model2
#ssumptions
8isk of a portfolio is based on the variability of returns from the said portfolio.
4. +n investor is risk averse.
6. +n investor prefers to increase consumption.
G. The investor's utility function is concave and increasing, due to his risk aversion and consumption preference.
;. +nalysis is based on single period model of investment.
H. +n investor either maximi&es his portfolio return for a given level of risk or maximi&es his return for the minimum risk.
. +n investor is rational in nature,
To choose the best portfolio from a number of possible portfolios each with different return and
risk two separate decisions are to be made:
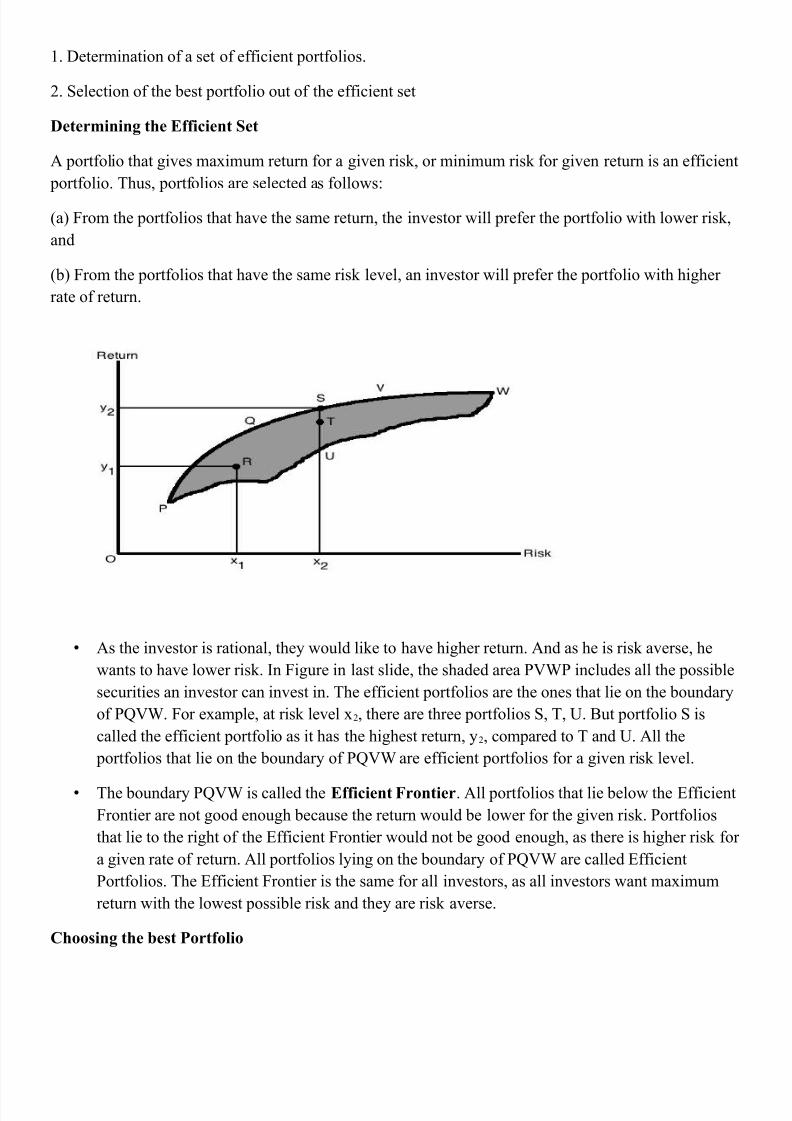
8/17/2019 Notes Saim
http://slidepdf.com/reader/full/notes-saim 42/57
3. etermination of a set of efficient portfolios.
4. Selection of the best portfolio out of the efficient set
"etermining the &fficient !et
+ portfolio that gives maximum return for a given risk, or minimum risk for given return is an efficient
portfolio. Thus, portfolios are selected as follows2
!a% 7rom the portfolios that have the same return, the investor will prefer the portfolio with lower risk,
and
!b% 7rom the portfolios that have the same risk level, an investor will prefer the portfolio with higher
rate of return.
• +s the investor is rational, they would like to have higher return. +nd as he is risk averse, he
wants to have lower risk. "n 7igure in last slide, the shaded area #I# includes all the possible
securities an investor can invest in. The efficient portfolios are the ones that lie on the boundary
of #YI. 7or example, at risk level x4, there are three portfolios S, T, . But portfolio S is
called the efficient portfolio as it has the highest return, y4, compared to T and . +ll the
portfolios that lie on the boundary of #YI are efficient portfolios for a given risk level.
• The boundary #YI is called the &fficient Frontier. +ll portfolios that lie below the Efficient
7rontier are not good enough because the return would be lower for the given risk. #ortfolios
that lie to the right of the Efficient 7rontier would not be good enough, as there is higher risk for
a given rate of return. +ll portfolios lying on the boundary of #YI are called Efficient
#ortfolios. The Efficient 7rontier is the same for all investors, as all investors want maximum
return with the lowest possible risk and they are risk averse.
Choosing the best Portfolio
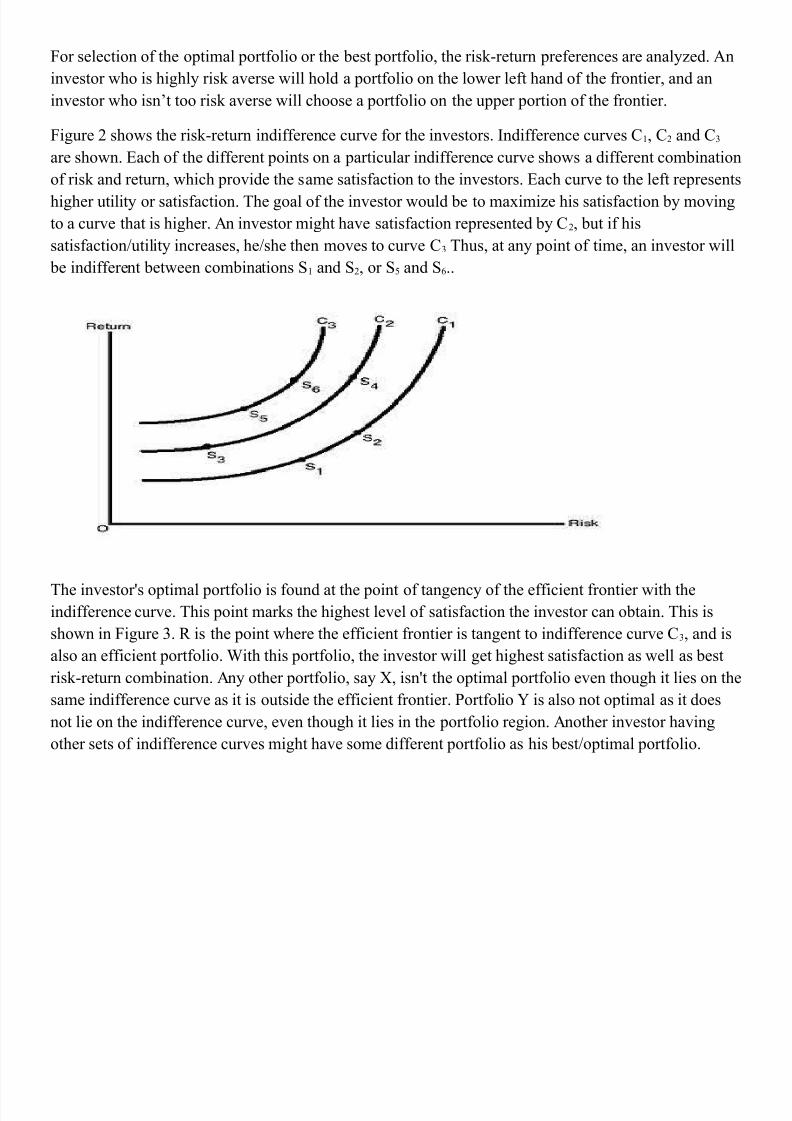
8/17/2019 Notes Saim
http://slidepdf.com/reader/full/notes-saim 43/57
7or selection of the optimal portfolio or the best portfolio, the risk(return preferences are analy&ed. +n
investor who is highly risk averse will hold a portfolio on the lower left hand of the frontier, and an
investor who isnCt too risk averse will choose a portfolio on the upper portion of the frontier.
7igure 4 shows the risk(return indifference curve for the investors. "ndifference curves )3, )4 and )6
are shown. Each of the different points on a particular indifference curve shows a different combination
of risk and return, which provide the same satisfaction to the investors. Each curve to the left represents
higher utility or satisfaction. The goal of the investor would be to maximi&e his satisfaction by moving
to a curve that is higher. +n investor might have satisfaction represented by )4, but if his
satisfaction-utility increases, he-she then moves to curve )6 Thus, at any point of time, an investor will
be indifferent between combinations S3 and S4, or S; and SH..
The investor's optimal portfolio is found at the point of tangency of the efficient frontier with theindifference curve. This point marks the highest level of satisfaction the investor can obtain. This is
shown in 7igure 6. 8 is the point where the efficient frontier is tangent to indifference curve )6, and is
also an efficient portfolio. ith this portfolio, the investor will get highest satisfaction as well as best
risk(return combination. +ny other portfolio, say ], isn't the optimal portfolio even though it lies on the
same indifference curve as it is outside the efficient frontier. #ortfolio is also not optimal as it does
not lie on the indifference curve, even though it lies in the portfolio region. +nother investor having
other sets of indifference curves might have some different portfolio as his best-optimal portfolio.
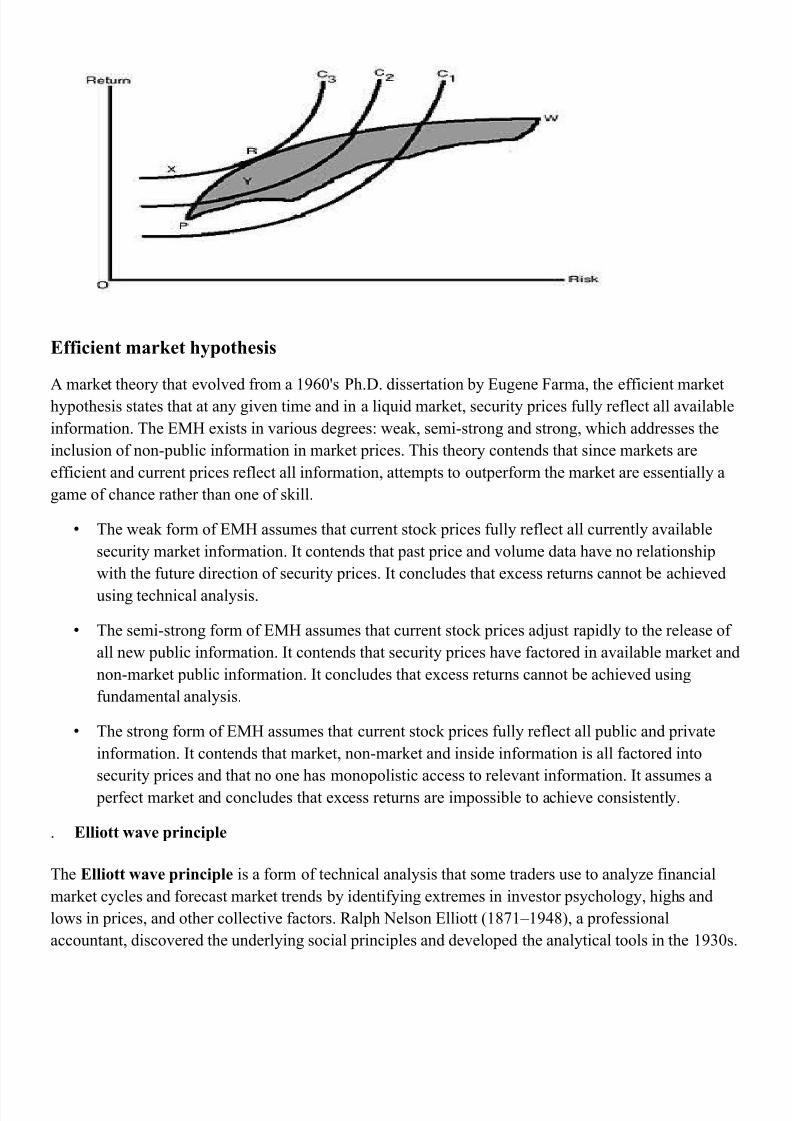
8/17/2019 Notes Saim
http://slidepdf.com/reader/full/notes-saim 44/57
&fficient market hypothesis
+ market theory that evolved from a 3RH9's #h.. dissertation by Eugene 7arma, the efficient markethypothesis states that at any given time and in a li*uid market, security prices fully reflect all available
information. The EMK exists in various degrees2 weak, semi(strong and strong, which addresses the
inclusion of non(public information in market prices. This theory contends that since markets are
efficient and current prices reflect all information, attempts to outperform the market are essentially a
game of chance rather than one of skill.
• The weak form of EMK assumes that current stock prices fully reflect all currently available
security market information. "t contends that past price and volume data have no relationship
with the future direction of security prices. "t concludes that excess returns cannot be achieved
using technical analysis.
• The semi(strong form of EMK assumes that current stock prices ad5ust rapidly to the release of
all new public information. "t contends that security prices have factored in available market and
non(market public information. "t concludes that excess returns cannot be achieved using
fundamental analysis.
• The strong form of EMK assumes that current stock prices fully reflect all public and private
information. "t contends that market, non(market and inside information is all factored into
security prices and that no one has monopolistic access to relevant information. "t assumes a
perfect market and concludes that excess returns are impossible to achieve consistently.
. &lliott wave principle
The &lliott wave principle is a form of technical analysis that some traders use to analy&e financial
market cycles and forecast market trends by identifying extremes in investor psychology, highs and
lows in prices, and other collective factors. 8alph /elson Elliott !3\3@3RG\%, a professional
accountant, discovered the underlying social principles and developed the analytical tools in the 3R69s.
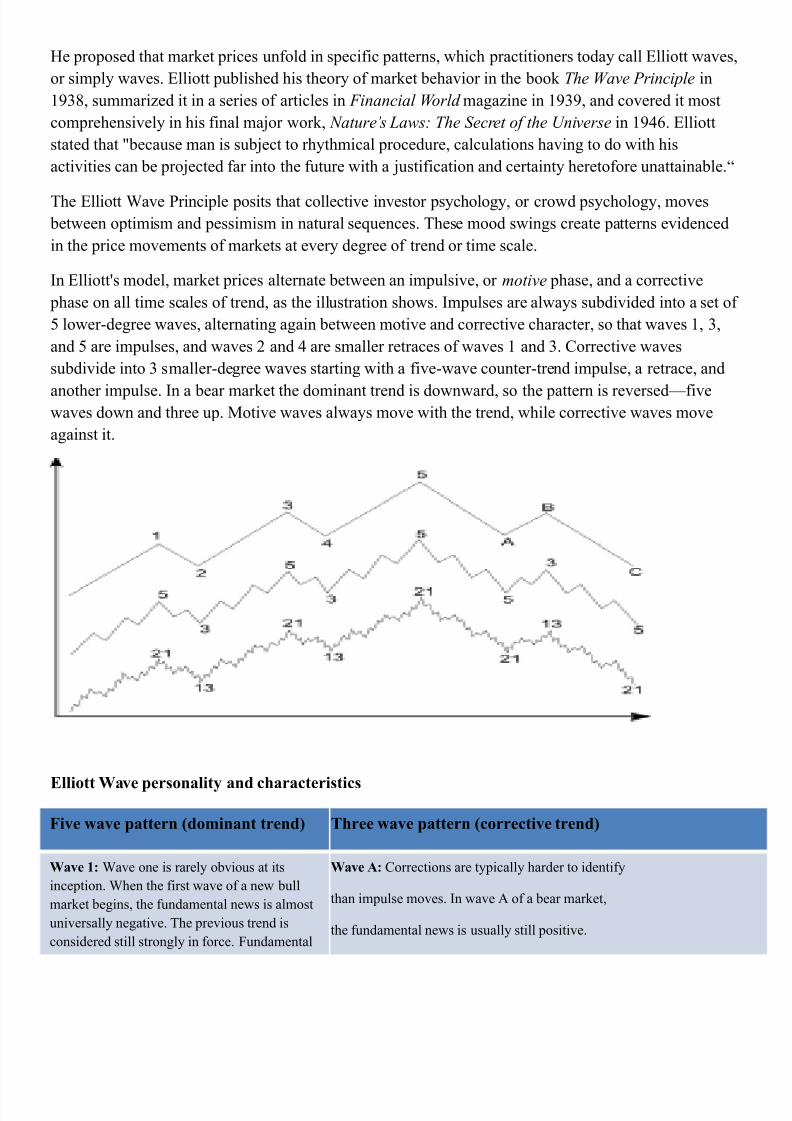
8/17/2019 Notes Saim
http://slidepdf.com/reader/full/notes-saim 45/57
Ke proposed that market prices unfold in specific patterns, which practitioners today call Elliott waves,
or simply waves. Elliott published his theory of market behavior in the book #$e %ave Principle in
3R6\, summari&ed it in a series of articles in inancial %orld maga&ine in 3R6R, and covered it most
comprehensively in his final ma5or work, &atures (a)s* #$e !ecret of t$e "niverse in 3RGH. Elliott
stated that 1because man is sub5ect to rhythmical procedure, calculations having to do with his
activities can be pro5ected far into the future with a 5ustification and certainty heretofore unattainable.A
The Elliott ave #rinciple posits that collective investor psychology, or crowd psychology, moves
between optimism and pessimism in natural se*uences. These mood swings create patterns evidenced
in the price movements of markets at every degree of trend or time scale.
"n Elliott's model, market prices alternate between an impulsive, or motive phase, and a corrective
phase on all time scales of trend, as the illustration shows. "mpulses are always subdivided into a set of
; lower(degree waves, alternating again between motive and corrective character, so that waves 3, 6,
and ; are impulses, and waves 4 and G are smaller retraces of waves 3 and 6. )orrective waves
subdivide into 6 smaller(degree waves starting with a five(wave counter(trend impulse, a retrace, and
another impulse. "n a bear market the dominant trend is downward, so the pattern is reversedWfivewaves down and three up. Motive waves always move with the trend, while corrective waves move
against it.
&lliott 0ave personality and characteristics
Five wave pattern =dominant trend> Three wave pattern =corrective trend>
0ave *: ave one is rarely obvious at its
inception. hen the first wave of a new bull
market begins, the fundamental news is almost
universally negative. The previous trend is
considered still strongly in force. 7undamental
0ave #: )orrections are typically harder to identify
than impulse moves. "n wave + of a bear market,
the fundamental news is usually still positive.
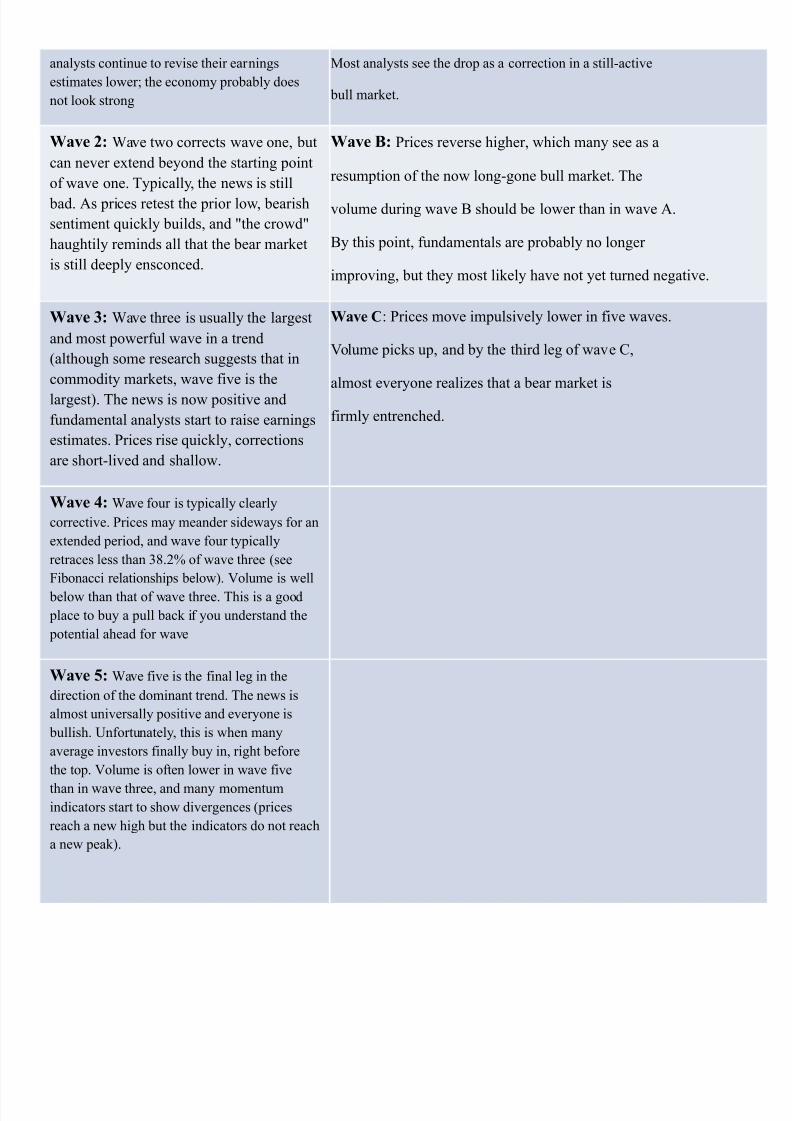
8/17/2019 Notes Saim
http://slidepdf.com/reader/full/notes-saim 46/57
analysts continue to revise their earnings
estimates lower0 the economy probably does
not look strong
Most analysts see the drop as a correction in a still(active
bull market.
0ave +: ave two corrects wave one, but
can never extend beyond the starting point
of wave one. Typically, the news is still
bad. +s prices retest the prior low, bearish
sentiment *uickly builds, and 1the crowd1
haughtily reminds all that the bear market
is still deeply ensconced.
0ave $: #rices reverse higher, which many see as a
resumption of the now long(gone bull market. The
volume during wave B should be lower than in wave +.
By this point, fundamentals are probably no longer
improving, but they most likely have not yet turned negative.
0ave 8: ave three is usually the largest
and most powerful wave in a trend
!although some research suggests that in
commodity markets, wave five is the
largest%. The news is now positive and
fundamental analysts start to raise earnings
estimates. #rices rise *uickly, corrections
are short(lived and shallow.
0ave C2 #rices move impulsively lower in five waves.
Iolume picks up, and by the third leg of wave ),
almost everyone reali&es that a bear market is
firmly entrenched.
0ave B: ave four is typically clearly
corrective. #rices may meander sideways for an
extended period, and wave four typically
retraces less than 6\.4: of wave three !see
7ibonacci relationships below%. Iolume is well
below than that of wave three. This is a good
place to buy a pull back if you understand the
potential ahead for wave
0ave -: ave five is the final leg in the
direction of the dominant trend. The news is
almost universally positive and everyone is
bullish. nfortunately, this is when many
average investors finally buy in, right before
the top. Iolume is often lower in wave five
than in wave three, and many momentum
indicators start to show divergences !prices
reach a new high but the indicators do not reach
a new peak%.
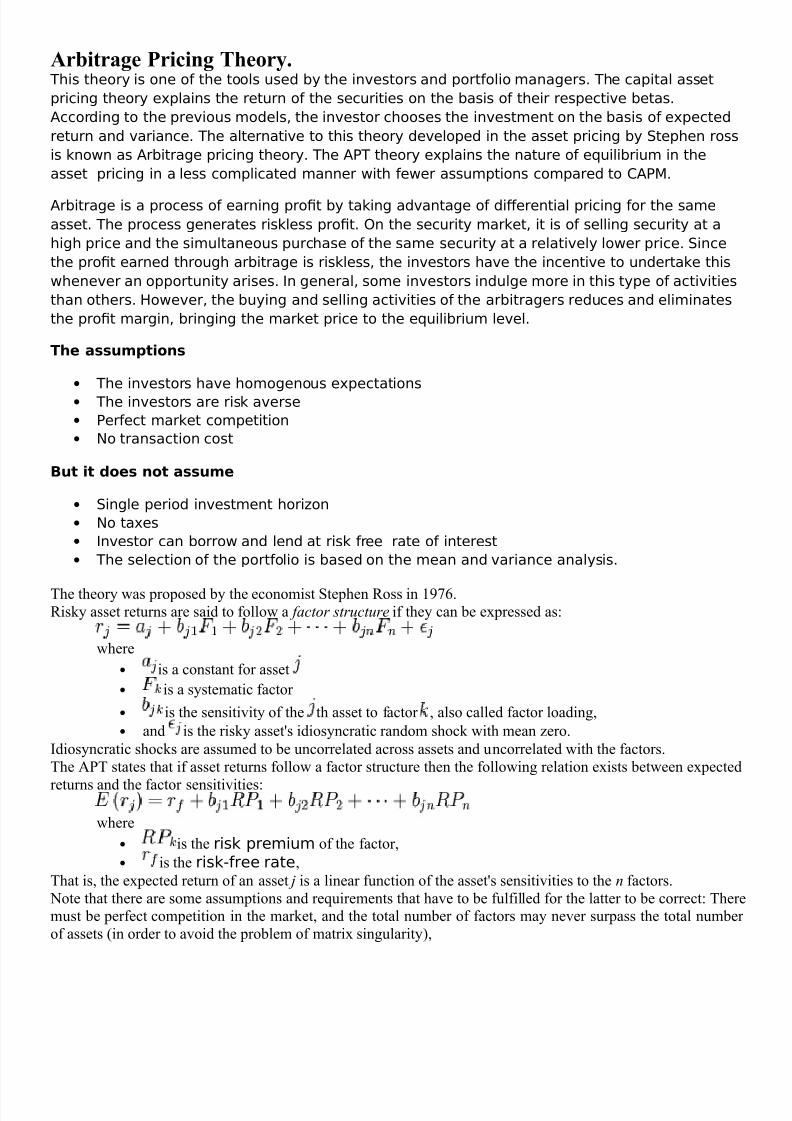
8/17/2019 Notes Saim
http://slidepdf.com/reader/full/notes-saim 47/57
#rbitrage Pricing Theory, This theory is one of the tools used by the in+estors and portfolio managers. The capital asset
pricing theory e4plains the return of the securities on the basis of their respecti+e betas.
According to the pre+ious models' the in+estor chooses the in+estment on the basis of e4pected
return and +ariance. The alternati+e to this theory de+eloped in the asset pricing by Stephen ross
is knon as Arbitrage pricing theory. The A?T theory e4plains the nature of e;uilibrium in the
asset pricing in a less complicated manner ith feer assumptions compared to CA?M.
Arbitrage is a process of earning pro,t by taking ad+antage of di=erential pricing for the same
asset. The process generates riskless pro,t. @n the security market' it is of selling security at a
high price and the simultaneous purchase of the same security at a relati+ely loer price. Since
the pro,t earned through arbitrage is riskless' the in+estors ha+e the incenti+e to undertake this
hene+er an opportunity arises. In general' some in+estors indulge more in this type of acti+ities
than others. oe+er' the buying and selling acti+ities of the arbitragers reduces and eliminates
the pro,t margin' bringing the market price to the e;uilibrium le+el.
&%e assumptions
• The in+estors ha+e homogenous e4pectations
• The in+estors are risk a+erse
• ?erfect market competition
• :o transaction cost
+ut it does not assume
• Single period in+estment hori(on
• :o ta4es
• In+estor can borro and lend at risk free rate of interest
• The selection of the portfolio is based on the mean and +ariance analysis.
The theory was proposed by the economist Stephen 8oss in 3RH.8isky asset returns are said to follow a factor structure if they can be expressed as2
where
• is a constant for asset
• is a systematic factor
• is the sensitivity of the th asset to factor , also called factor loading,
• and is the risky asset's idiosyncratic random shock with mean &ero.
"diosyncratic shocks are assumed to be uncorrelated across assets and uncorrelated with the factors.The +#T states that if asset returns follow a factor structure then the following relation exists between expected
returns and the factor sensitivities2
where
• is the risk premium of the factor,
• is the riskfree rate,
That is, the expected return of an asset + is a linear function of the asset's sensitivities to the n factors. /ote that there are some assumptions and re*uirements that have to be fulfilled for the latter to be correct2 Theremust be perfect competition in the market, and the total number of factors may never surpass the total numberof assets !in order to avoid the problem of matrix singularity%,

8/17/2019 Notes Saim
http://slidepdf.com/reader/full/notes-saim 48/57
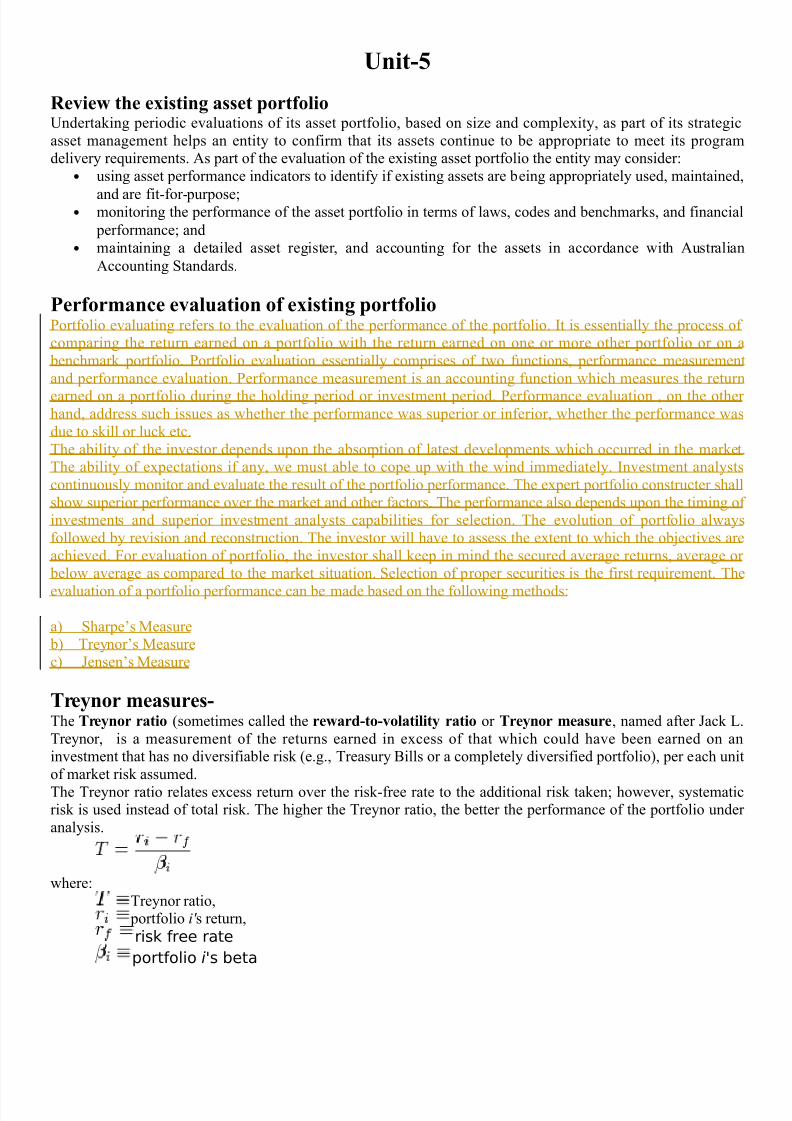
8/17/2019 Notes Saim
http://slidepdf.com/reader/full/notes-saim 49/57
5nit7-
Review the eisting asset portfoliondertaking periodic evaluations of its asset portfolio, based on si&e and complexity, as part of its strategicasset management helps an entity to confirm that its assets continue to be appropriate to meet its programdelivery re*uirements. +s part of the evaluation of the existing asset portfolio the entity may consider2
• using asset performance indicators to identify if existing assets are being appropriately used, maintained,
and are fit(for(purpose0• monitoring the performance of the asset portfolio in terms of laws, codes and benchmarks, and financial
performance0 and• maintaining a detailed asset register, and accounting for the assets in accordance with +ustralian
+ccounting Standards.
Performance evaluation of eisting portfolio#ortfolio evaluating refers to the evaluation of the performance of the portfolio. "t is essentially the process ofcomparing the return earned on a portfolio with the return earned on one or more other portfolio or on a benchmark portfolio. #ortfolio evaluation essentially comprises of two functions, performance measurementand performance evaluation. #erformance measurement is an accounting function which measures the return
earned on a portfolio during the holding period or investment period. #erformance evaluation , on the otherhand, address such issues as whether the performance was superior or inferior, whether the performance wasdue to skill or luck etc.The ability of the investor depends upon the absorption of latest developments which occurred in the marketThe ability of expectations if any, we must able to cope up with the wind immediately. "nvestment analystscontinuously monitor and evaluate the result of the portfolio performance. The expert portfolio constructer shallshow superior performance over the market and other factors. The performance also depends upon the timing ofinvestments and superior investment analysts capabilities for selection. The evolution of portfolio alwaysfollowed by revision and reconstruction. The investor will have to assess the extent to which the ob5ectives areachieved. 7or evaluation of portfolio, the investor shall keep in mind the secured average returns, average or below average as compared to the market situation. Selection of proper securities is the first re*uirement. The
evaluation of a portfolio performance can be made based on the following methods2
a% SharpeCs Measure b% TreynorCs Measurec% VensenCs Measure
Treynor measures7The Treynor ratio !sometimes called the reward7to7volatility ratio or Treynor measure, named after Vack JTreynor, is a measurement of the returns earned in excess of that which could have been earned on aninvestment that has no diversifiable risk !e.g., Treasury Bills or a completely diversified portfolio%, per each unitof market risk assumed.The Treynor ratio relates excess return over the risk(free rate to the additional risk taken0 however, systematicrisk is used instead of total risk. The higher the Treynor ratio, the better the performance of the portfolio underanalysis.
where2Treynor ratio, portfolio i' s return,
risk free rate
portfolio i's beta
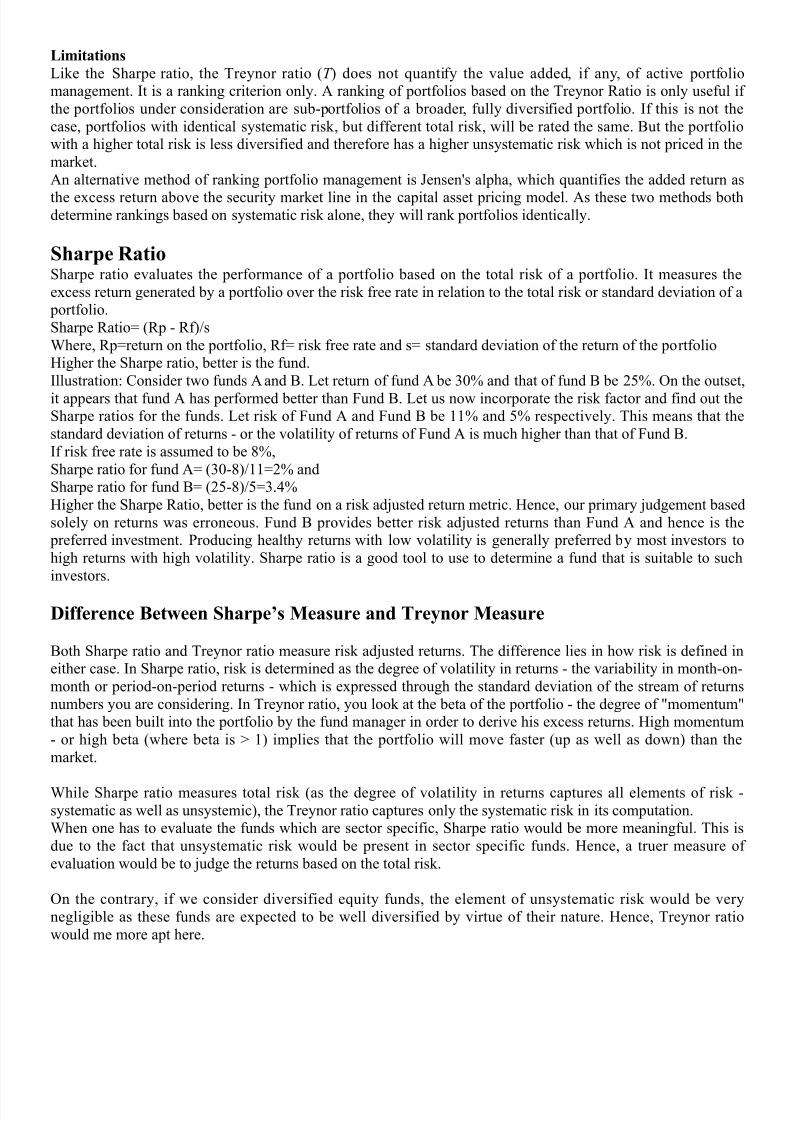
8/17/2019 Notes Saim
http://slidepdf.com/reader/full/notes-saim 50/57
<imitations
Jike the Sharpe ratio, the Treynor ratio !# % does not *uantify the value added, if any, of active portfoliomanagement. "t is a ranking criterion only. + ranking of portfolios based on the Treynor 8atio is only useful ifthe portfolios under consideration are sub(portfolios of a broader, fully diversified portfolio. "f this is not thecase, portfolios with identical systematic risk , but different total risk, will be rated the same. But the portfoliowith a higher total risk is less diversified and therefore has a higher unsystematic risk which is not priced in themarket.+n alternative method of ranking portfolio management is Vensen's alpha, which *uantifies the added return as
the excess return above the security market line in the capital asset pricing model. +s these two methods bothdetermine rankings based on systematic risk alone, they will rank portfolios identically.
!harpe RatioSharpe ratio evaluates the performance of a portfolio based on the total risk of a portfolio. "t measures theexcess return generated by a portfolio over the risk free rate in relation to the total risk or standard deviation of a portfolio.Sharpe 8atio= !8p ( 8f%-shere, 8p=return on the portfolio, 8f= risk free rate and s= standard deviation of the return of the portfolioKigher the Sharpe ratio, better is the fund."llustration2 )onsider two funds + and B. Jet return of fund + be 69: and that of fund B be 4;:. $n the outset,it appears that fund + has performed better than 7und B. Jet us now incorporate the risk factor and find out theSharpe ratios for the funds. Jet risk of 7und + and 7und B be 33: and ;: respectively. This means that thestandard deviation of returns ( or the volatility of returns of 7und + is much higher than that of 7und B."f risk free rate is assumed to be \:,Sharpe ratio for fund += !69(\%-33=4: andSharpe ratio for fund B= !4;(\%-;=6.G:Kigher the Sharpe 8atio, better is the fund on a risk ad5usted return metric. Kence, our primary 5udgement basedsolely on returns was erroneous. 7und B provides better risk ad5usted returns than 7und + and hence is the preferred investment. #roducing healthy returns with low volatility is generally preferred by most investors tohigh returns with high volatility. Sharpe ratio is a good tool to use to determine a fund that is suitable to suchinvestors.
"ifference $etween !harpe1s Measure and Treynor Measure
Both Sharpe ratio and Treynor ratio measure risk ad5usted returns. The difference lies in how risk is defined ineither case. "n Sharpe ratio, risk is determined as the degree of volatility in returns ( the variability in month(on(month or period(on(period returns ( which is expressed through the standard deviation of the stream of returnsnumbers you are considering. "n Treynor ratio, you look at the beta of the portfolio ( the degree of 1momentum1that has been built into the portfolio by the fund manager in order to derive his excess returns. Kigh momentum( or high beta !where beta is P 3% implies that the portfolio will move faster !up as well as down% than themarket.
hile Sharpe ratio measures total risk !as the degree of volatility in returns captures all elements of risk (systematic as well as unsystemic%, the Treynor ratio captures only the systematic risk in its computation.hen one has to evaluate the funds which are sector specific, Sharpe ratio would be more meaningful. This isdue to the fact that unsystematic risk would be present in sector specific funds. Kence, a truer measure ofevaluation would be to 5udge the returns based on the total risk.
$n the contrary, if we consider diversified e*uity funds, the element of unsystematic risk would be verynegligible as these funds are expected to be well diversified by virtue of their nature. Kence, Treynor ratiowould me more apt here.
8/17/2019 Notes Saim
http://slidepdf.com/reader/full/notes-saim 51/57
"t is widely found that both ratios usually give similar rankings. This is based on the fact that most of the portfolios are fully diversified. To summari&e, we can say that when the fund is not fully diversified, Sharperatio would be a better measure of performance and when the portfolio is fully diversified, Treynor ratio would better 5ustify the performance of a fund.
=c> Densen1s Measure:
Vensen attempts to construct a measure of absolute performance on a risk ad5usted basis. This measure is basedon )+#M model. "t measures the portfolio managerCs predictive ability to achieve higher return than expected
for the accepted riskiness. The ability to earn returns through successful prediction of security prices on astandard measurement. The Vensen measure of the performance of portfolio can be calculated by applying thefollowing formula28 p = 8 f O !8 M" @ 8 f % x Zhere,8 p = 8eturn on portfolio8 M" = 8eturn on market index8 f = 8isk free rate of return
Portfolio Management
7irst let's understand the meaning of terms #ortfolio and Management.3. Portfolio is a group of financial assets such as shares, stocks, bonds, debt instruments, mutual funds,
cash e*uivalents, etc. + portfolio is planned to stabili&e the risk of non(performance of various pools ofin+estment.
4. Mana"ement is the organi&ation and coordination of the activities of an enterprise in accordancewith well(defined policies and in achievement of its pre(defined ob5ectives.
/ow let's comprehend the meaning of term #ortfolio Management.3. Portfolio Mana"ement !#M% guides the investor in a method of selecting the best available
securities that will provide the expected rate of return for any given degree of risk and also to mitigate!reduce% the risks. "t is a strategic decision which is addressed by the top(level managers.
7or example, )onsider Mr. Vohn has 399,999 and wants to invest his money in the financial market other thanreal estate investments. Kere, the rational ob5ective of the investor !Mr. Vohn% is to earn a considerable rate ofreturn with less possible risk.So, the ideal recommended portfolio for investor Mr. Vohn can be as follows2(
!,9ectives of Portfolio Mana"ement
The main ob5ectives of portfolio management in finance are as follows2(
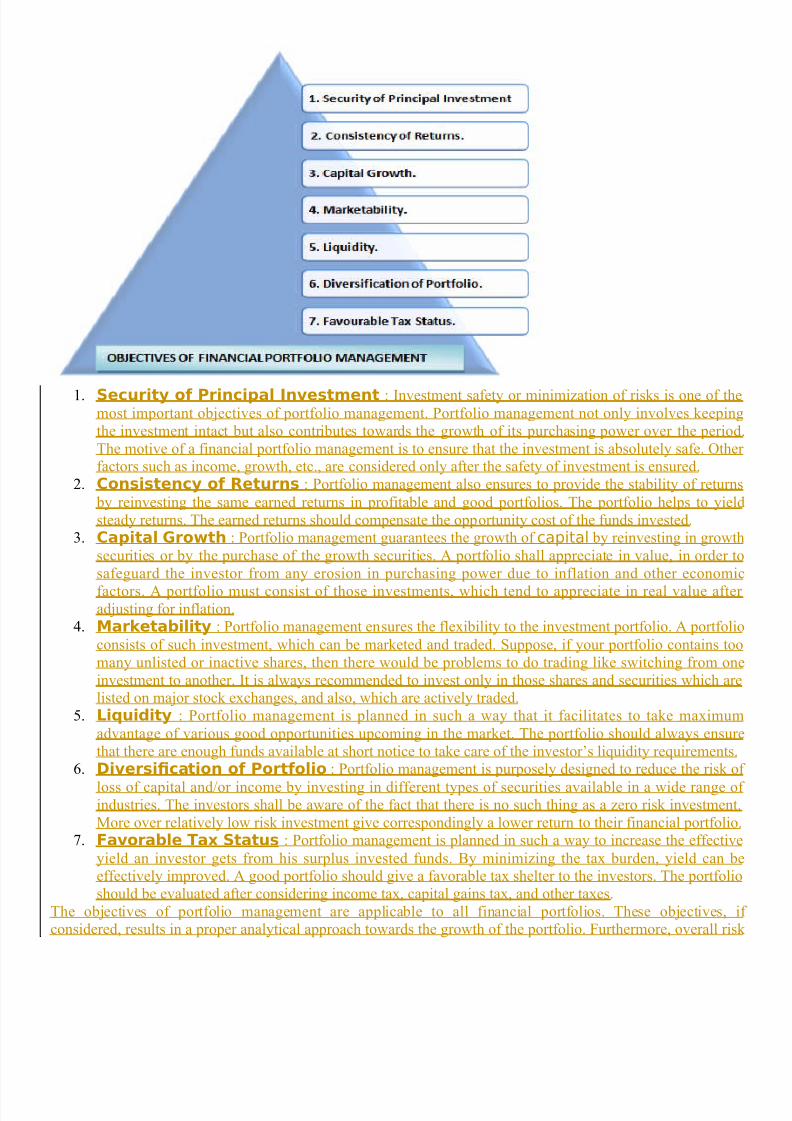
8/17/2019 Notes Saim
http://slidepdf.com/reader/full/notes-saim 52/57
8/17/2019 Notes Saim
http://slidepdf.com/reader/full/notes-saim 53/57
needs to be maintained at the acceptable level by developing a balanced and efficient portfolio. 7inally, a good portfolio of growth stocks often satisfies all ob5ectives of portfolio management.
P#!!6& M#%#@&M&%T
#assive management is an process is a holding a well diversified portfolio for a long term with the buy
and hold approach. #assive management refers to the investors attempt to construct a portfolio that
resembles the overall market returns. The simplest form of passive management is holding the index
fund that is designed to replicate a good and well defined index of the common stock such as BSE
sensex or /SE nifty. The fund manager buys every stock in the index in exact proportion of the stock
in that index. "f reliance industry stock constitutes ;: of the index, the fund also invests ;: in reliance
industry stock.
#CT6& M#%#@M&%T
+ctive management is holding securities based on the forecast about the future. The portfolio
managers vary their cash position or beta of the e*uity portion of the portfolio based on themarket forecast. The managers may indulge in group rotations. Kere, group rotation meanschanging the investment in different industries stocks depending on the assessed expectationregarding their future performance.
The formula planThe formula plan provide the basic rules and regulations for the purchase and sales of securitiesThe amount to be spent on the different types securities is fixed. The amount may be fixedeither in constant or variable ratio. This depends on the investors attitude towards risk and
return. The commonly used formula plans are rupee cost averaging, constant rupee value, theconstant ratio and the variable ratio plan.
#ssumption of the formula plan3. The first assumption is that certain percentage of the investor fund is allocated to fixed
income securities and common stock.4. The second assumption is that if the market moves higher, the proportion of the stocks in
the portfolio may either be decline or remain constant. The portfolio is more aggressivein low market and defensive when the market is on the rise.
6. The third assumption is that the stocks are bought and sold whenever there is a significant
change in price.G. The fourth one is that the investor should strictly follow the formula plan once he chosen
it.
8/17/2019 Notes Saim
http://slidepdf.com/reader/full/notes-saim 54/57
#dvantage of the formula plan
• Basic rule and regulation for the purchase and sale of securities are provided.
• The rules and regulations are rigid and help to overcome human emotion.
• The investor can earn higher profits by adopting the plan.
• + course of action is formulated according to the investors ob5ectives.
• "t controls the buying and selling of securities by the investors.
"isadvantages of the formula plan• The formula plan does cot help the selection of the securities.
• "t is strict and not flexible with the inherent problem of ad5ustment.
• This should be applied for long periods, otherwise the transaction coat may be high.
Mutual Fund 6ndustry+ mutual fund is a type of professionally managed collective investment vehicle that pools money from manyinvestors to purchase securities.
The first introduction of a mutual fund in "ndia occurred in 3RH6, when the <overnment of "ndia launched nitTrust of "ndia !T"%. ntil 3R\, T" en5oyed a monopoly in the "ndian mutual fund market. Then a host ofother government(controlled "ndian financial companies came up with their own funds. These included StateBank of "ndia, )anara Bank, and #un5ab /ational Bank . This market was made open to private players in 3RR6,as a result of the historic constitutional amendments brought forward by the then )ongress(led governmentunder the existing regime of Jiberali&ation, #rivati&ation and <lobali&ation !J#<%. The first private sector fundto operate in "ndia was ^othari #ioneer, which later merged with 7ranklin Templeton.
espite being available in the market for over two decades now with assets under management e*ualing 8s,\3,3,3;4 Jakhs !as of 4\ 7ebruary 4939% !Source2 +ssociation of Mutual 7unds, "ndia%, less than 39: of"ndian households have invested in mutual funds. + recent report on Mutual 7und "nvestments in "ndia published by research and analytics firm, Boston +nalytics, suggests investors are holding back from puttingtheir money into mutual funds due to their perceived high risk and a lack of information on how mutual fundswork. This report is based on a survey of approximately 39,999 respondents in 3; "ndian cities and towns as ofMarch 4939. There are G6 Mutual 7unds recently .
The primary reason for not investing appears to be correlated with city si&e. +mong respondents with a highsavings rate, close to G9: of those who live in metros and Tier " cities considered such investments to be veryrisky, whereas 66: of those in Tier "" cities said they did not know how or where to invest in such assets.
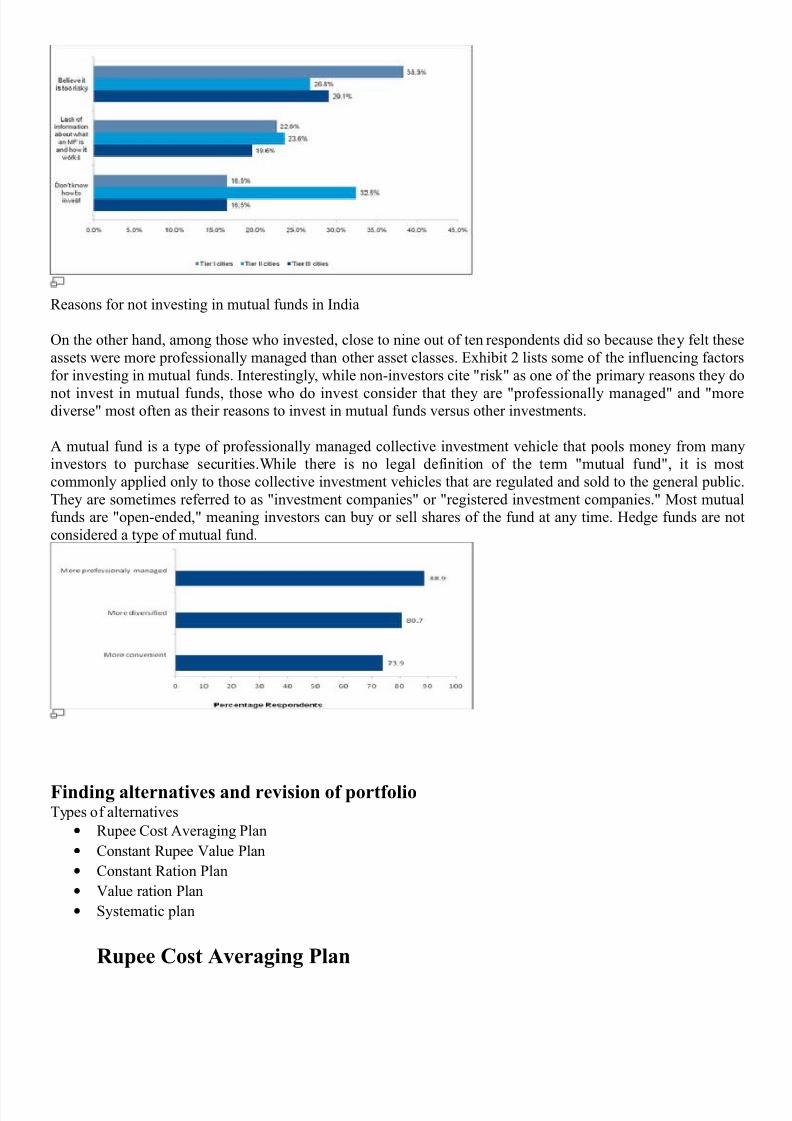
8/17/2019 Notes Saim
http://slidepdf.com/reader/full/notes-saim 55/57
8easons for not investing in mutual funds in "ndia
$n the other hand, among those who invested, close to nine out of ten respondents did so because they felt theseassets were more professionally managed than other asset classes. Exhibit 4 lists some of the influencing factorsfor investing in mutual funds. "nterestingly, while non(investors cite 1risk 1 as one of the primary reasons they do
not invest in mutual funds, those who do invest consider that they are 1professionally managed1 and 1morediverse1 most often as their reasons to invest in mutual funds versus other investments.
+ mutual fund is a type of professionally managed collective investment vehicle that pools money from manyinvestors to purchase securities.hile there is no legal definition of the term 1mutual fund1, it is mostcommonly applied only to those collective investment vehicles that are regulated and sold to the general public.They are sometimes referred to as 1investment companies1 or 1registered investment companies.1 Most mutualfunds are 1open(ended,1 meaning investors can buy or sell shares of the fund at any time. Kedge funds are notconsidered a type of mutual fund.
Finding alternatives and revision of portfolioTypes of alternatives
• 8upee )ost +veraging #lan
• )onstant 8upee Ialue #lan
• )onstant 8ation #lan
• Ialue ration #lan
• Systematic plan
Rupee Cost #veraging Plan
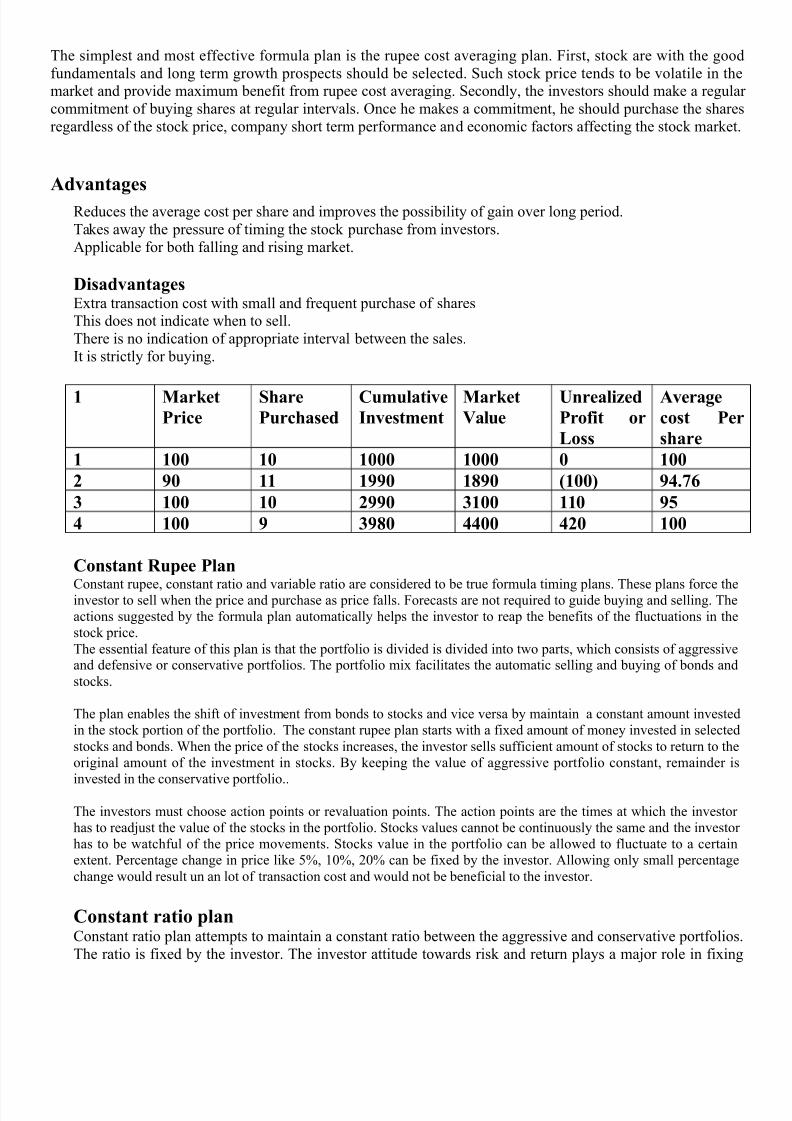
8/17/2019 Notes Saim
http://slidepdf.com/reader/full/notes-saim 56/57

8/17/2019 Notes Saim
http://slidepdf.com/reader/full/notes-saim 57/57
the ratio. The conservative investor may like to have more of bond and the aggressive investor, more ofstocks. $nce the ratio is fixed, it is maintained as the market moves up and down. +s usual, action pointsmay be may be the investor. "t may vary from investor to investor. The advantage of constant ratio plan isthe enthusiasm with which it forces the manager to counter ad5ust his portfolio cyclically. But this approachdoes not eliminate the necessity of selecting individual security.The limitation of the plan is that the money is shifted from the stocks portion to bond portion. Bond is also acapital market instrument and responds to market pressures. Bond and share prices may both rise and gall atthe same time, in the downtrend both prices decline and them gain.