Notes for a Presentation on the Physical Geography … · The highly fertile prairie chernozem...
54
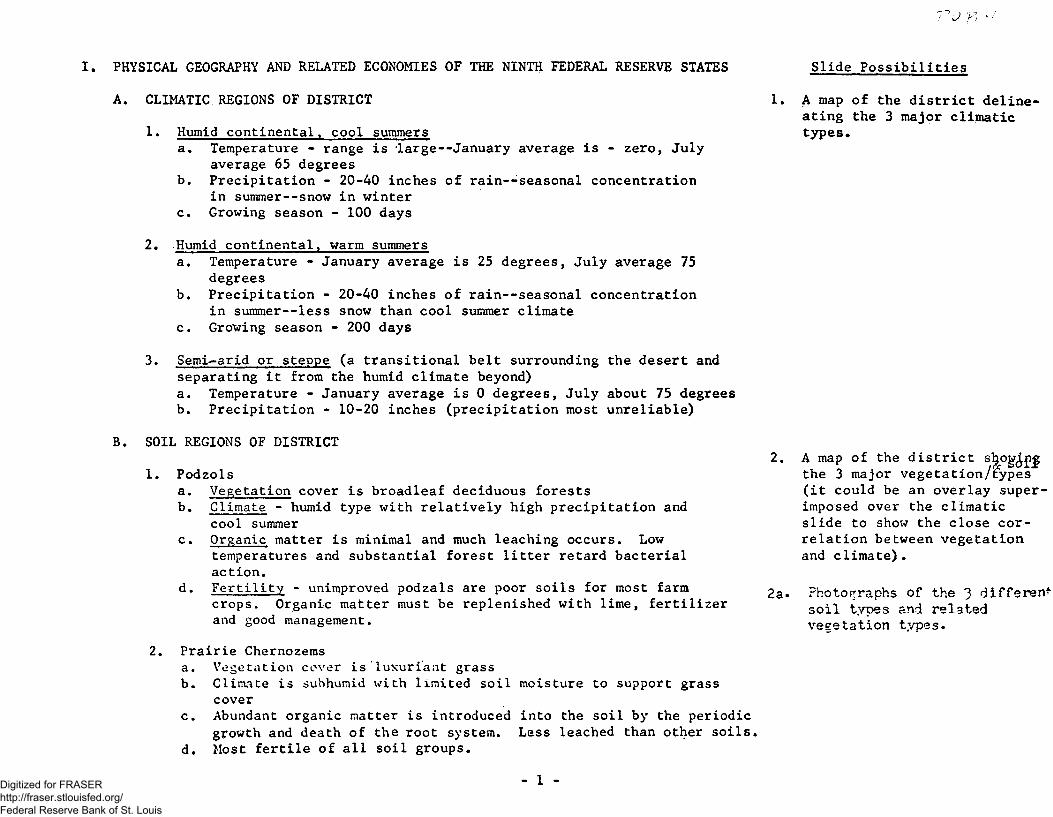
I. PHYSICAL GEOGRAPHY AND RELATED ECONOMIES OF THE NINTH FEDERAL RESERVE STATES A. CLIMATIC REGIONS OF DISTRICT 1. Humid continental, cool summers a. Temperature - range is large--January average is - zero, July average 65 degrees b. Precipitation - 20-40 inches of rain— 'seasonal concentration in summer--snow in winter c. Growing season - 100 days 2. Humid continental, warm summers a. Temperature - January average is 25 degrees, July average 75 degrees b. Precipitation - 20-40 inches of rain— seasonal concentration in summer--less snow than cool summer climate c. Growing season - 200 days 3. Semi^arid or steppe (a transitional belt surrounding the desert and separating it from the humid climate beyond) a. Temperature - January average is 0 degrees, July about 75 degrees b. Precipitation - 10-20 inches (precipitation most unreliable) B. SOIL REGIONS OF DISTRICT 1. Podzols a. Vegetation cover is broadleaf deciduous forests b. Climate - humid type with relatively high precipitation and cool summer c. Organic matter is minimal and much leaching occurs. Low temperatures and substantial forest litter retard bacterial action. d* Fertility - unimproved podzals are poor soils for most farm crops. Organic matter must be replenished with lime, fertilizer and good management. 2. Prairie Chernozems a. Vegetation cover is luxuriant grass b. Climate is subhumid with limited soil moisture to support grass cover c. Abundant organic matter is introduced into the soil by the periodic growth and death of the root system. Less leached than other soils. d. Most fertile of all soil groups. Slide Possibilities 1. A map of the district deline- ating the 3 major climatic types. 2. A map of the district the 3 major vegetation/types (it could be an overlay super- imposed over the climatic slide to show the close cor- relation between vegetation and climate). 2a. Photographs of the 3 different soil types and related vegetation types. - 1 - Digitized for FRASER http://fraser.stlouisfed.org/ Federal Reserve Bank of St. Louis
Transcript of Notes for a Presentation on the Physical Geography … · The highly fertile prairie chernozem...
I. PHYSICAL GEOGRAPHY AND RELATED ECONOMIES OF THE NINTH FEDERAL RESERVE STATESA. CLIMATIC REGIONS OF DISTRICT
1. Humid continental, cool summersa. Temperature - range is large--January average is - zero, July
average 65 degreesb. Precipitation - 20-40 inches of rain— 'seasonal concentration
in summer--snow in winterc. Growing season - 100 days
2. Humid continental, warm summersa. Temperature - January average is 25 degrees, July average 75
degreesb. Precipitation - 20-40 inches of rain— seasonal concentration
in summer--less snow than cool summer climatec. Growing season - 200 days
3. Semi^arid or steppe (a transitional belt surrounding the desert andseparating it from the humid climate beyond)a. Temperature - January average is 0 degrees, July about 75 degreesb. Precipitation - 10-20 inches (precipitation most unreliable)
B. SOIL REGIONS OF DISTRICT1. Podzols
a. Vegetation cover is broadleaf deciduous forestsb. Climate - humid type with relatively high precipitation and
cool summerc. Organic matter is minimal and much leaching occurs. Low
temperatures and substantial forest litter retard bacterial action.
d* Fertility - unimproved podzals are poor soils for most farmcrops. Organic matter must be replenished with lime, fertilizer and good management.
2. Prairie Chernozemsa. Vegetation cover is luxuriant grassb. Climate is subhumid with limited soil moisture to support grass
coverc. Abundant organic matter is introduced into the soil by the periodic
growth and death of the root system. Less leached than other soils.d. Most fertile of all soil groups.
Slide Possibilities1. A map of the district deline
ating the 3 major climatic types.
2. A map of the districtthe 3 major vegetation/types (it could be an overlay superimposed over the climatic slide to show the close correlation between vegetation and climate).
2a. Photographs of the 3 different soil types and related vegetation types.
- 1 -Digitized for FRASER http://fraser.stlouisfed.org/ Federal Reserve Bank of St. Louis

3. Chestnut brown soils ̂a. Vegetation cover is grass, but less luxuriant and deep rooted
than chernozemic.b. Climate is arid and dry.c. Organic matter is less abundant thian chernozemic.d. Fertility - easily tilled soils^ and most adaptable to cultiva
tion if irrigated.TERRAIN OF DISTRICT
A relief map of the district showing the wide variation of topography in the district.
Photographs of the various terrain features.
5. low6. high7. plains with hills or mountains
1. rolling and irregular plains2. flat plains3. hills 3a.
i
4. plateaus
Digitized for FRASER http://fraser.stlouisfed.org/ Federal Reserve Bank of St. Louis

AGRICULTURAL ECONOMIES IN THE DISTRICT STATESDAIRY FARMINGA. Geographic Location - central, east central and northwestern
Minnesota and northern WisconsinB. Physical Characteristics and Their Association to Dairy Regions
1. Humid climate with cool summera. Good pastures require 30 or more inches of rainfallb. Dairy cows do not produce good milk in hot weather
2. Dairying is often associated with rough topography a. Animals traverse rough land better than machines
3. Primary dairy regions are associated with the less fertile podzolic soilsa. Forage grasses such as alfalfa, timothy, and clover can
tolerate poorer soils than can corn or wheat.C. Alternative Land Uses
1. Given the climatic and associated soil conditions, dairying is the most remunerative form of agricultural economy for this particular region. The short growing season, cool summers and less fertile soils preclude a profitable growth of many crops.
D. Associated Industry within the Dairy Region1. Manufactured milk production - primarily butter (Minnesota) and
cheese (Wisconsin).E. Market and Transportation Principles Associated with the Location of
the Dairy Industries in Minnesota and Wisconsin.1. Due to the perishability of fluid milk and the long distance to
the primary U. S. markets in the East--it is more economical to manufacture butter and cheese which are higher value products that can stand greater transportation costs, than can fluid milk.
4. A map depicting the primary dairy region of the district. (Overlays of terrain features, soils, and climate may be used to show a correlation)
5. A map of the U.S. portraying Minn, and Wise, significance in butter and cheese productioi (graduated circles could be used).
Digitized for FRASER http://fraser.stlouisfed.org/ Federal Reserve Bank of St. Louis

F. Position of Ninth District within the U. S. (1964 figures)1. In number of milk cows on farms, Minnesota is second to Wisconsin
with 1,265,000 cows.2. Minnesota ranks second behind Wisconsin in milk production, with
10,968,000 million pounds.3. In the manufacture of butter, Minnesota is the leading state with
a total of 372,454,000 pounds.4. Wisconsin is the leading cheese producing state with 761,968
thousand pounds.II. COMMERCIAL CROP (PRIMARILY CORN) AND LIVESTOCK AREA
A. Geographic Location - southern Minnesota and southeastern South DakotaB. Physical Characteristics Associated with Commercial Crop Livestock Regions
1. Humid climate, with warm summersa. A relatively long growing season and warm climate with adequate
rainfall is necessary for good corn production.2. Terrain is level to undulating, permitting the utilization of labor
saving machinery and the retardation of soil erosion.3. Soils associated with major corn producing areas are the rich prairie
chernozems— a necessity for high production yields.C. Economic Activities Associated with Corn Production
1. This region concentrates on growing feed for livestock rather than food for man.
D. Demand, Market, and Transportation Factors Stimulating Livestock Productionin Contrast to Corn-Cash Crops1. Demand for corn bread and corn cereal is minimal in the U. S. compared
to beef and pork.
. Map delineating the commercial crop and livestock area of the district (transparent overlays showing correlations to climate, soil, and terrain could also be used).
Separate dot maps of hog, corn and livestock producing areas could be used.
- 4 -Digitized for FRASER http://fraser.stlouisfed.org/ Federal Reserve Bank of St. Louis

2. Value of corn is low in proportion to its bulk and subsequently cannot stand high transportation costs to major U. S. markets.
3. Corn may be converted into meat (in the form of livestock), resulting in a higher valued product— able to withstand higher transporation costs to the major urban markets of the East.
E. Associated Industry within Corn and Livestock Producing Region7. A map of the U.S. showing the
major meat packing centers (graduated circles could be used).
1. Since the advent of regrigeration (around 1870), the location of slaughter houses and meat packing plants have increasinly gravitated toward the raw material supply (hogs and cattle of the midwest) as opposed to the major markets of the eastern U. S. Originally, meatpacking plants were located near their markets, because the s.alable product was more perishable than the live animals.
2. This shift in location is due primarily to 3 factors: number one,with live animals, much weight is lost and many injuries occur enrouteto the slaughter house; secondly, freights charges are incurred on many products (hoofs, skulls, etc.) that become waste products^ and thirdly, production costs that go into the purchase of raw materials are very high. And the higher the ratio of raw material costs to total production costs, the stronger the tendency of a factory to locate nearer its source of materials.
G. Ninth District Commercial Crop and Livestock Position within U. S.1. Minnesota, the Dakotas, and Montana accounted for 11 per cent of the
total corn production in 1966.2. Minnesota was the fourth ranking state in total corn production in
the U. S. South Dakota ranked ninth (1966 figures).3. Of the total number of cattle slaughtered commercially in 1965, Ninth
district states slaughtered 7 per cent. Minnesota ranked fifth behind Iowa, Nebraska, Texas and California.
4. Of the total number of commercially slaughtered hogs, Ninth district states slaughtered 11 per cent. Minnesota ranked second behind Iowa.
1. Meat packing (of cattle and hogs) in southern Minnesota and the Twin Cities Metropolitan Area
F. Economic-Location Principles Associated with the Meat Packing Industry
- 5 -Digitized for FRASER http://fraser.stlouisfed.org/ Federal Reserve Bank of St. Louis
5. Minnesota is one of the principle states in meat packing.
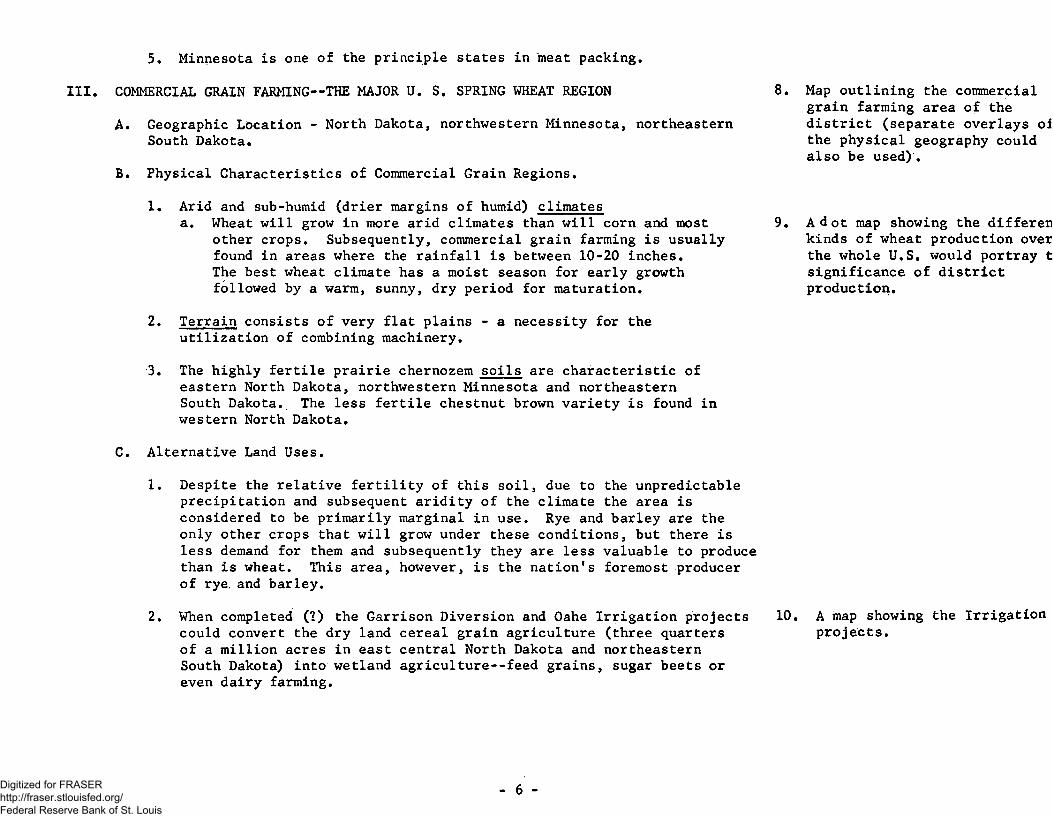
III. COMMERCIAL GRAIN FARMING— THE MAJOR U. S. SPRING WHEAT REGIONA. Geographic Location - North Dakota, northwestern Minnesota, northeastern
South Dakota.B. Physical Characteristics of Commercial Grain Regions.
1. Arid and sub-humid (drier margins of humid) climatesa. Wheat will grow in more arid climates than will corn and most
other crops. Subsequently, commercial grain farming is usually found in areas where the rainfall is between 10-20 inches.The best wheat climate has a moist season for early growth followed by a warm, sunny, dry period for maturation.
2. Terrain consists of very flat plains - a necessity for the utilization of combining machinery.
3. The highly fertile prairie chernozem soils are characteristic of eastern North Dakota, northwestern Minnesota and northeastern South Dakota. The less fertile chestnut brown variety is found in western North Dakota.
C. Alternative Land Uses.1. Despite the relative fertility of this soil, due to the unpredictable
precipitation and subsequent aridity of the climate the area is considered to be primarily marginal in use. Rye and barley are the only other crops that will grow under these conditions, but there is less demand for them and subsequently they are less valuable to produce than is wheat. This area, however, is the nation’s foremost producer of rye. and barley.
2. When completed (2) the Garrison Diversion and Oahe Irrigation projects could convert the dry land cereal grain agriculture (three quartersof a million acres in east central North Dakota and northeastern South Dakota) into wetland agriculture--feed grains, sugar beets or even dairy farming.
8. Map outlining the commercial grain farming area of the district (separate overlays oi the physical geography could also be used).
9. A dot map showing the differeti kinds of wheat production over the whole U.S. would portray t significance of district production.
10. A map showing the Irrigation projects.
- 6 -Digitized for FRASER http://fraser.stlouisfed.org/ Federal Reserve Bank of St. Louis

D. Associated Economic Activities.1. Flour milling - wheat from this area is milled in the Twin Cities 11
Metropolitan Area, the third ranking milling center in the U. S.E. Principles Associated with the Economic Locations of Flour Milling
1. Wheat-growing regions exert a strong pull on flour mills.a. 85 per cent of production costs go for grain purchases - the
higher the ratio of raw material costs to total production costs, the stronger the tendency to locate near raw material source.
b. Grain has a higher weight loss ratio. 40 per cent of the weight of the grain is "lost" in the manufacturing process - 100 tonsof wheat make only 60 tons of flour. High weight loss ratios mean that transportation costs are incurred on a high proportion of subsequent Vaste materials; thus, high weight loss ratios exert a pull toward raw material locations.
2. Market accessibility and low transportation costs (of the Great Lakes system) are also important factors, as exemplified by the first rank predominance of Buffalo in flour milling.
F. Small Grain Production in the District Compared to the Nation1. Ninth district states produced 91 per cent of the total spring wheat
in the nation. North Dakota is the national leader in production with 53 per cent of the total.
2. District states also lead the nation in barley and rye production, with 46 and 44 per cent of total production, respectively. North Dakota is the first ranking state in barley production with 23 per cent, South Dakota is the prime producer of rye with 23 per cent.
LIVESTOCK RANCHING ]A. Geographic Location - Montana, southwestern North Dakota and western
South Dakota.B. Physical Characteristics of Livestock Ranching Regions.
1. Climate is semi-arid with 10-20 inches of rainfall. The unreliability of precipitation prohibits the profitable production of crop agriculture.
2. Terrain is largely plains with some features of considerable relief.There is little correlation between ranching and topography.
- 7 -
. A map of the U.S. showing the major flour milling centers (a couple of additional slides could be used to show the historical change in significan of these cities).
. A map of the U.S. could be used to depict the significance of grain production in the districi (darker colors could be used for states with highest production levels).
. Map of the district showing the livestock ranching area.(Separate transparent overlays showing the physical geography correlation can be used too).
Digitized for FRASER http://fraser.stlouisfed.org/ Federal Reserve Bank of St. Louis
3. Chestnut brown soils are characteristic of the region.C. Alternative Land Uses
1. 20 inches of annual rainfall generally marks the limit for unirrigated farming. Beyond that line the drier regions are too risky for cropping and are generally devoted to animal culture.
2. Alfalfa occupies the largest acreage of any irrigated crop— it is used for supplemental winter feeding of livestock.
3. Total acres under irrigation increased by 23.5 per cent in South Dakota from 1949-1959. Montana and North Dakota increased 17.2 per cent and 17.6 per cent respectively for the same time period.Total acreage under irrigation was 7.6 per cent in Montana, 0.5 per cent in South Dakota and 0.2 per cent in North Dakota in 1959.
D. Associated Industry1. Very little slaughtering and meat packing takes place in the western
ranching area. Insufficient grasses and the lack of concentrated feed grains coupled with the long distance from the western range to eastern markets necessitates the shipping of most animals to feed lots in the corn belt for fattening before slaughter.
14. A map depicting the 20 inch rainfall line.
15. A bar graph showing the change in acres under irrigation in Montana and North Dakota (the bars could be set into a map of the two states instead of depicting the bar graphs with labels of the states).
- 8 -Digitized for FRASER http://fraser.stlouisfed.org/ Federal Reserve Bank of St. Louis

FOREST ECONOMIES IN THE NINTH DISTRICTA. Geographic Location of Forest Stands and Species
16. A map of the district showing the areas of major forest stands.
1. Western Montana - virgin growtha. Primary species - coniferous softwoods; ponderosa pine, 17.
lodgepale pine, douglas fir, western larch, engelmann spruce.2. Upper Great Lakes - second growth forest
a. Primary species - mixed coniferous softwoods and deciduous hardwoods1. Northern Minnesota - primarily softwoods; pine, spruce, fir2. Northwestern Wisconsin and Upper Michigan - largely hard
woods, especially aspenB. Related Industries
1. Lumber manufacturing of western Montana 18.a. Montana's forest industries are engaged primarily in the manu
facture of rough and finished lumber--utilized by the national markets in the building and construction industries.
b. The largest concentrated milling centers are located in Missoula, Kalispell, Columbia Falls, Whitefish, and Libby-Troy.
2. Pulp (and related products) manufacturing of the Lake States (pulp 19, manufacturing is the fastest growing segment of the forest products industry)a. The major pulp manufacturing state within the three state
region is Wisconsin, with about two-thirds of the total capacity.1. Historically, the bulk of this industry has been located on
major rivers or watercourses that have been ncecessary for 20.power and the large quantities of water utilized in the pulp making process. Subsequently, the Chippewa-Flambeau, Wisconsin Wolf, Fox and Menominee rivers are dotted with numerous pulp and paper mills.
C. Economic Position of District Forest Industries within the U. S.1. Primary competition for Montana's lumber industry comes from the
pacific northwest, where forest stands are larger and of a better quality. However, demand and subsequent value of Montana's forest resources increases as the Pacific northwest's stands are increasingly depleted.
Two maps (more detailed than the preceding) showing the different kinds of species grown in the Upper Great Laket and western Montana).
A map of the U.S. showing all major forest areas.
A map of Montana showing the major lumber manufacturing cities (this information could be shown with slide No. 17 above).A map of Wisconsin showing the pulp and paper mills located on major river courses
Digitized for FRASER http://fraser.stlouisfed.org/ Federal Reserve Bank of St. Louis

2. Locational disadvantages of the Great Lake States area for the pulpmanufacturing industries.a. Insufficient supplies of softwood (softwoods are more suitable
than hardwoods in the manufacture of pulp). The Great Lakes forests have not recovered from the devastation wrought at the turn of this century. Reforestation begun in the 1930's is a long and costly process involving approximately 100 years for proper rejuvenation. It is anticipated that this region, now producing only a fraction of the nation's wood output, will never regain its past importance.
b. Relatively long distance from major national markets.3. Locational advantages of the Great Lake States.
a. Adequate supplies of water.b. Modern technology has increasingly devised methods by which the
abundant supplies of hardwood may be used in the pulping process instead of softwood.
c. The higher valued products (specialty papers) manufactured in the Great Lake states area (as compared to the lower valued product-- wrapping and packaging paper— of the South) can stand the higher transportation costs to the major U.S. markets.
- 10 -Digitized for FRASER http://fraser.stlouisfed.org/ Federal Reserve Bank of St. Louis

I. RECREATION INDUSTRYA. Inventory of Facilities and Natural Resources Utilized for Recreational 21
Purposes by District Residents and Non-District Tourists.1. Upper Great Lake States.
a. The woods and lakes, very prevalent in northern Minnesota, northwestern Wisconsin and the Upper Peninsula of Michigan have made this area a prime spot for the vacationing sportsmen to hunt and fish in.
b. Snow skiing, made feasible by a more than adequate snow cover and steep enough slopes, has become a popular winter sport in northwestern Wisconsin, Upper Michigan, the Twin Cities Metropolitan Area and the Mesabi range country of northeastern Minnesota.
c. The regions many lakes and resorts have made this area a prime haven for vacationers seeking an escape from the midwestern summer heat.
d. Forests and park land (The area is dotted with an ample supplyof State and National Parks and Forests— so conducive to picnicking, camping, sightseeing and other outdoor recreational activities).1. Minnesota has 38 state parks and 2 national forests (Superior
and Chippewa).2. The boundary waters canoe area (northern Minnesota) is the
nation's foremost canoeing region.3. Upper Michigan has 3 national forests (Ottawa, Hiawatha,
Marquette), 2 wildlife areas and 15 state parks.4. Northwestern Wisconsin has 2 national forests (Chequamegon and
Nicolet), 1 wildlife area and 18 state parks.2. Dakota Recreation Facilities.
a. This area with its extensive area of level land and its continental climate--hot summers and very cold winters--offers few attractions to the tourist and there are consequently few resorts located in the area.
b. The Black Hills, with its forested mountains, Sylvan Lake Area,Wind Cave National Park, Custer State Park, and man-made Rushmore Memorial annually attracts thousands of tourists.
c. The dearth of woods and lakes severely limits hunting and fishing activities in this region with the exception of the concentration of ringnecked pheasants in South Dakota.
d. North Dakota has 1 national park (Theodore Roosevelt) and 6 state parks. South Dakota has 8 state parks, two national forests (Custer and the Black Hills) and 1 national park (Wind Cave).
. Pictorial scenes such as the following could be used:1. Hunting and fishing grout2. Lake resort sites3. Snow skiing4. National Parks (such as
Glacier and Yellowstone)5. Black Hills scenery6. Canoeing7. Wildlife areas.
- 11 -Digitized for FRASER http://fraser.stlouisfed.org/ Federal Reserve Bank of St. Louis
3. Montanaa. National Parks - Yellowstone and Glacier Parks are the primary
tourist attractions in Montana, annually attracting thousands of tourists.1. Yellowstone - is primarily a motorist park. It lacks spectac
ular mountains but contains a huge high-altitude lake, canyons, waterfalls, hydrothermal displays (geysers, not springs, etc.) perhaps unequaled throughout the world.
2. Glacier - is a scenic mountainous park— a haven for hikers, climbers, horseback riders and wilderness enthusiasts.
3. Other parks and forested areas include 11 national forests,10 national wilderness areas and 10 state parks.
4. The Rocky Mountains in the western portion of the state provide various slopes for Montana skiing activities.
- 12 -Digitized for FRASER http://fraser.stlouisfed.org/ Federal Reserve Bank of St. Louis

I. WATER POWER RESOURCES OF THE DISTRICTWater has no capacity within itself for producing energy. But as a liquid which responds easily to the influence of gravity, water is mobile— and its motion possesses the ability to develop power.Prior to the discovery of electricity, power generated by water-driven wheels could be transported only by mechanical means which spanned comparatively short distances. But the discovery of electricity— a form of energy into which water power can be converted into— unshackled factories and cities from the necessity of being located right by water power sites. Although electricity dissipates over distance, inventions have enabled it to be shipped economically as far as 400 miles.However, the actual distance which electricity is transported in any given area depends upon the costs of competing fuels— oil, gas and coal. Whenever the cost of generating electricity at a water power site plus the cost of transporting it to a market is more than the cost of building and operating a thermal plant at the market, the choice is likely to be made in favor of fuel— consuming power plants near the customers.
The entire above three paragraphs were taken intotb from Economic Geography. John.W. Alexander, University of Wisconsin, Prentice-Hall, 1963.
A. Significance of Water Power in the District.1. Water power is significant only as a generator of electricity in
meeting energy requirements.Water power produces just 17 per cent of the nations electricity, and less than 4 per cent of the country's total power demand.Water power is much more significant in the district than in the nation as a whole— 43 per cent of all electricity produced is generated by water. Considerable variation exists between district states as shown by the following figures.
- 13 -Digitized for FRASER http://fraser.stlouisfed.org/ Federal Reserve Bank of St. Louis

Proportion of Electricity Generated by Water Power: (1964)Minnesota North Dakota South Dakota Montana Michigan Wisconsin
6 % 64 % 85 7. 92 7. 3.57. 8 7.
22. Pie charts superimposed over a map of the district states showing the proportions of electricity generated by water power.
B. Estimated Undeveloped Water Power (1965)1. A physical environment conducive to the maximum production of
water power has a) a steep gradient in the river, b) a uniformily large supply of water from month to month, and c) a narrows somewhere in the rivers course where a dam may be constructed.Many potential water power sites, endowed with the above mentioned attributes remain undeveloped however, because of long distances to major markets demanding power.
2. Undeveloped Water Power as a Per Cent of Developed Water Power Capacity: (1965)
23. A picture of a dam site.
Minnesota 787.North Dakota 497.South Dakota 397.Montana 1837.Wisconsin 537.Michigan 697.
- 14 -Digitized for FRASER http://fraser.stlouisfed.org/ Federal Reserve Bank of St. Louis

As shown by the preceding statistics all district states have high proportions of undeveloped water power resources. The reasons for this may be a combination of the following interrelated factors:
1. Long distances from potential markets (primarily cities and factories) demanding power,
2. Competition from fuels; oil, gas, and coal, and3. Surplus of potential water power resources in relation to
demand in the production site region.C. Developed Water Power Sites in Montana, North Dakota and South Dakota.
(The Missouri Basin has provided an environment conducive to the construction of sundry dams throughout Montana and the Dakotas which have been harnessed for various reasons including: flood control, electric power generation, navigation, irrigation, recreation, wildlife development, provision of municipal and industrial water, and pollution abatement)1. Montana Dam Sites
a. Libby (proposed)b. Hungry Horsec. Knowles (proposed)d. Clark Canyone. Canyon Ferryf. Tiberg* Fresnoh. Anitai. Yellowtrailj. Little Big Hornk. Fort PeckSouth Dakota Dam Sitesa. Belle Fourcheb. Deer Fieldc. Pac Tolad. Angosturae. Shade Hillf. Oaheg* Blunth. Big Bendi. Fort Randallj* Gavins Point
23. A map of Montana and the Dakotas showing the major water courses and dam sites.
- 15 -Digitized for FRASER http://fraser.stlouisfed.org/ Federal Reserve Bank of St. Louis

North Dakota Dam Sitesa. Dickinsonb. Heart Buttec. Garrisond. Jamestowne. Bald Hill
Digitized for FRASER http://fraser.stlouisfed.org/ Federal Reserve Bank of St. Louis
1. Background of hydro-generated power in Minnesota 24.a. The early growth of Minneapolis may be attributed to the
waterpower site on the Falls of St. Anthony.b. The first hydroelectric station in the United States went
into operation on Upton Island at the Falls of St. Anthony 25.in 1882.
c. The development of Minneapolis as the leading flour milling center of the world in the 1890's is an important consequence of the harnessing of the St. Anthony Falls.
d. By 1910 there were 35 hydroelectic plants in Minnesota. The most important plants were located on the Mississippi River at Little Falls, St. Cloud and St. Anthony Falls; on the St. Croix at St. Croix Falls; on the Cannon River near Cannon Falls; onthe Rainy River at International Falls; and on the St. Louis River at Thonison.
e. In 1930 there were 67 hydroelectric plants of at least 100 hpr capacity in Minnesota.
2. Generation of Steam Power in Minnesota 26.a. Steam power, generated by coal gradually replaced hydro power,
and by 1960 only 6 per cent of all electricity was generated by water.
b. The largest and most important steam powered plants in the stateare located within the Mississippi River Basin in the Twin 27.Metropolitan Area, and include: The High Bridge Plant at St. Paul, the Black Dog plant near Bloomington, the Riverside plant at Minneapolis, and the Third Street plant in St. Paul.
Power Generated by Fuel in the District
A picture of St. Anthony Fall preferably dated around 1890-1910.A map of the Twin Cities are* showing the location of St. Anthony Falls on the Mississippi River.
A map of the Twin Cities area showing the Mississippi Rive* and the location of the majox steam powered plants.A picture of a major steam plant.
Digitized for FRASER http://fraser.stlouisfed.org/ Federal Reserve Bank of St. Louis

I. PHYSICAL GEOLOGY OF THE NINTH FEDERAL RESERVE DISTRICTA. The Earths Rocks are Divided into Three Main Groups - Based on Origin.
1. Igneous rocks - are the parents through which all other rocks arederived. (95 per cent of the rocks in the earth's outer 10 mile zone)a. Origin - all igneous rocks were formed from the solidifications
of magma. When magma is extruded at the surface it is called lava.
b. Crystallization - at first magma is a melt, a liquid solution of ions at high temperature. Once a decrease occurs in the heat that keeps the magma liquid, the melt starts to solidify. As the temperature continues to fall, the mixture solidifies until igneous rock is formed.
c. Variation - The great variety of igneous rocks is a product of the diverse compositions of magmas and the conditions under which they were crystallized. Some magmas are rich in iron and magnesium; others are rich in silicon and aluminum.
d. Mineral composition - igneous rocks may consist of interlocking grains of a single mineral, or a mixture of many or all of the nine silicate minerals: olivine, augite, hornblende, biotite, anorthite, albite, orthoclase, muscovite, and quartz.
2. Sedimentary rocks - (or metamorphic rocks derived from them compose75 per cent of the rocks at the earth’s surface).a. Origin - most sedimentary rocks are made up of particles derived
from the breakdown of pre-existing rocks. There are two main groups of rocks based on origin.1. Detrital sedimentary rocks - deposits may be accumulations of
minerals and rocks derived either from the erosion of existing rock or from the weathered products of these rocks. Examples are sandstone, mudstone, shale.
2. Chemical sedimentary rocks - deposits produced by chemical processes. These deposits are usually laid down by the precipitation of material dissolved in water. Examples are limestone, chalk, evaporites, etc.
b. Deposition of sediment - methods of transportation of material from one place to another are: water in streams and glaciers, underground, and ocean currents. Landslides and other gravity induced movements also play a part in the process as does the wind.
- 18 -Digitized for FRASER http://fraser.stlouisfed.org/ Federal Reserve Bank of St. Louis

1. Detrital material consisting of minerals and rock fragments is deposited when its agent of transportation no longer has enough energy to move it farther.
2. Material that has been carried along in solution ( to be deposited and formed into a chemical rock) is depositedby precipitation, a chemical process (either biochemical or inorganic in nature) by which dissolved material is converted into a solid and separated from the liquid solvent,
c. Mineral composition - like igneous rocks, sedimentary rocks are accumulations of minerals. The three most common being clay, quartz, and calcite.
3. Metaroorphic rocks - metamorphic means ’’changed forms," referring to the fact that the original rock has been changed from its primary form to a new form. Metamorphic rocks may be derived from any or all of the sedimentary and igneous rocks.a. Origin - Metamorphic rocks have been changed in the solid state
in response to pronounced alterations in temperature, pressure, and chemical environment— all brought about by the same forces that fold, fault, inject magma into the elevate or depress masses of rock. These forces bring about modification within the rocks themselves.The term metamorphism is limited to changes that take place in the texture of composition of solid rocks. Metamorphism can occur only while a rock is solid because once the rock's melting point has been reached, a magma is formed and are in the realm of igneous activity again.The agents of metamorphism are heat, deforming pressures, and chemically active fluid.
b. Types of metamorphic rocks - The many types of metamorphic rocks stem from the great variety of original rocks and the varying kinds of metamorphism.Metamorphic rocks are usually named on the basis of texture. A few of these rocks may also be classified by including the name of a mineral present in them. Examples of metamorphic rocks are slate (produced from shale), phyllite (similar to slate) and marble (derived from limestone).
- 19 -Digitized for FRASER http://fraser.stlouisfed.org/ Federal Reserve Bank of St. Louis

ONE OF THE THREE MAJOR GEOLOGICAL STRUCTURAL UNITS OF THE UNITED STATES - INCLUDED WITHIN THE NINTH FEDERAL RESERVE DISTRICTI. CANADIAN SHIELD AREA
A. GEOGRAPHIC LOCATION - The Canadian Shield is an elliptical area of about1,860,000 square miles occupying most of eastern and central Canada, extending into New York, Minnesota, Wisconsin, and Michigan.
B. SURFACE GEOGRAPHY - Shield topography is characterized by a low, flat, glaciated peneplain. Relief features of more than 300 feet are uncommon. Surface features include many lakes and exposed bedrock.
C. AGE OF SHIELD - The Shield is composed primarily of highly deformed and metamorphosed rocks of precambrian age (at least 600,000,000 years plus).
D. CONTINENTAL STABILITY - All of the world continents contain a core of precambrian rocks that is either exposed as a shield area or is covered by a thin layer of sediment.The precambrian rocks of North America form the nucleus of the continent. Around this core area, younger sediments were laid down and mountain systems were developed.The Canadian Shield includes a proportionately smaller part of the total volume of precambrian rock in North America; the rest is covered with younger sedimentary rocks, forming the basement of the continent.
E. ORIGIN OF THE PRECAMBRIAN SHIELD - In the Precambrian era the Canadian Shield was an area of geosynclinal JL/ activity and mountain building, but during succeeding eras the area was subjected only to broad uplifts, depressions and tilting movements. During most of the paleozoic era (preceding precambrian time) the shield was low but emergent (from the seas) and the streams which meandered over the surface provided little sediment over the area. In later periods of the paleozoic era the shield area was entirely inundated by the shallow seas, and thin layers of limestone were deposited over the metamorphic rocks. 1
1/ A geosyncline may be defined as "an elongated belt in the earth’s crust that is subsiding currently, or that has subsided for long periods in the past, sothat it acts, or has acted, as a trap or collecting '• asin for sediments removedby erosion from uplifted areas of the crust. Axi ones of maximum subsidencereceive great thicknesses of sediments until the; me unstable, -and the beltis then crushed by folding and elevated into a roc n chain.
_ on
. A map of the U.S. showing the 3 major geological structural units— outline the district states in heavy line for emphasis.
. Topographic map showing relief features of the Shield area.
. A chart of geological age would show ancientness of pre-cambrian rock.
Digitized for FRASER http://fraser.stlouisfed.org/ Federal Reserve Bank of St. Louis

F. NATURE OF THE ROCKS OF THE CANADIAN SHIELD1. About 80 per cent of the area is composed of granite gneiss
(believed to have been repeatedly intruded into sedimentary rocks).a. Granite and gneiss are believed to have been generated in orogeny
from the depths of geosynclines. Their ubiquity in the shield is indicative of a great many orogenic episodes.
b. The belts of sediment that are enclosed in the granite gneiss are made up of a variety of metamorphosed Archean rocks (Archean refers to early precambrian time).The most common sedimentary rocks in these belts are graywache and conglomerate. Graywache is composed of poorly sorted sand and silt sized particles of quartz, fledspar, dark minerals and rock fragments embedded in a matrix of chlarite. The pebbles in the conglomerates include a great variety of volcanic, sedimentary, and intrusive rocks.The most common Archean igneous rock is known as greenstone— as most of them have been metamorphosed to secondary green minerals.1. The Pods of the Archean sedimentary and volcanic rocks are
best interpreted as the lower parts of eugeosynclines that have been almost engulfed during orogeny by the granite that now surrounds them.
2. The sedimentary and volcanic rocks that are preserved in the granite gneisses are overlain by much different Proterozoic Rocks (of late precambrian time).Rocks of the Proterozoic type probably were deposited with eugeosynclinal lavas and sediments in early precambrian time but have since been eroded away owing to their relatively high position in the crust.Most of the existing Proterozoic Rocks are likely to belong to the younger mountain built areas of the shield.Most Proterozoic Rocks are quartzose sandstone, limestone, and dolomite.a. The most important area of Proterozoic Rocks is the Lake Superior
district of Minnesota, Wisconsin, and Michigan.1. The Mesabi Range basement rocks are composed of lower precambrian
granite and small patches of tightly folded metamorphosed sedimentary rocks. Gently dipping quartzites overlie the .basement rocks unconformably and are succeeded by the iron formation.
- 21 -Digitized for FRASER http://fraser.stlouisfed.org/ Federal Reserve Bank of St. Louis

Cherty iron oxides, iron silicates, and iron carbonates of the iron formation were weathered during precambrian time climatic conditions that favored the dissolution of the siliceous impurities by ground water and the concentration of the iron oxides.
2. Taconite is silica— rich iron formation. The ores are over- lain by a thick sequence of slates and the whole sedimentary sequence is intruded by gabbro but only gently folded,
b. The Keweenawan series is the youngest precambrian sedimentary group in the Lake Superior district. The lavas, feldspathic sandstones, quartz sandstones, and shales of this group were unconformably laid down over the deformed iron-bearing sediments in a basin that occupies the present position of Lake Superior.Deposits of metallic copper occur within the flows and conglomerates of the Keweenawan group.
- 22 -Digitized for FRASER http://fraser.stlouisfed.org/ Federal Reserve Bank of St. Louis

I. MINING OPERATIONS IN THE PORTION OF THE CANADIAN SHIELD AREA THAT IS LOCATED WITHIN THE NINTH DISTRICT.A. COPPER DEPOSITS 31
1. Geographic Location - Keweenaw peninsula in Upper Michigan2. Geologic characteristics of formation
a. Copper deposits are found in a variety of host rocks under greatly varied structural conditions.Periods of formation embrace most of known geologic time. Igneous activity is usually associated with the formation of copper deposits.
b. Keweenaw copper is unique among copper deposits in the world.Native copper--the chief ore mineral in the Keweenaw deposits— iscommonly found in the oxidized zone of most principal copperdeposits, but not in large quantities. The deposits of the LakeSuperior area and Corocaro, Bolivia, are the only one of economicimportance in which native copper is the chief ore mineral.t
3. Historical characteristics - There is a long history of copper mining in this area, some of it carried on by Indians before the advent of the white man. The first known history was recorded in 1636.
4. Importance of Keweenaw Copper in the U.S. - In 1850, Michigan mines became the principal U.S. copper producers, but with the discovery of copper in Montana in 1875, the Michigan deposits were quickly eclipsed and by 1888 the Montana mines had overtaken the Michigan production.
32Today, the Keweenaw mines (1966 figure) produce 5 per cent of the total copper mined in the U.S. The mines contain useful deposits but are among the deepest in the world. The costs of sinking new shafts to these depths and introducing the latest underground mining methods are too high to yield a profit-given current conditions.
B. IRON ORE FORMATIONS1. Geographic Location - Five iron ranges are situated in that portion 33
of the Shield in which the Ninth district lies. The Vermillion,Mesabi, and Cuyuna Ranges in Minnesota, the Menominee and Marquette Ranges in Michigan, and the Gogebic in Michigan-Wisconsin.
. Map showing location of Keweenaw Copper Deposits.
. A picture showing deep-shaft mining.
.. Map showing location and area of the 5 major ore formations.
- 23 -Digitized for FRASER http://fraser.stlouisfed.org/ Federal Reserve Bank of St. Louis

Geological Characteristicsa. In that portion of the Lake Superior district where the iron ore
parent rocks have been sufficiently leached of their silica content, the ores have, oxidized to hematite with an iron concentration between 50-60 per cent.
b. The iron ore of the Mesabi occurs in the Biwabik formation of the upper Huronian series of rocks. The ore bodies are comparatively shallow troughs, sloping to the southeast, which rest upon a basement of pokegama quartzites, greenstones, slates, granites, and schists. Virginia slate and other rocks lie above the ore bodies— the ore is usually covered by glacial drift. The ore bodies are often large enough and near enoughto the surface to allow a large part of the mining to be carried on by the open-pit method.The taconite reserves of Mesabi are immense. The zone that has still not been leached by weathering consists of a mineral called taconite, containing chert with hematite, magnetite, siderite, and hydrous iron silicates. The iron content averages around25 per cent.
Iron ore industry of Minnesota and the Lake Superior district.a. Minnesota is the most significant -state in iron ore production in
the Lake Superior district. And of the three Minnesota formations; Vermillion, Cuyuna, and Mesabi— the Mesabi is the largest and most important range.
b. Ore was first struck on the Mesabi range in 1890 at what was to become the Mountain Iron Mine of the Mesabi. An iron boom rapidly followed.
34. A block depicting ore formation of the Mesabi - such asEarth surface
Rockformation
35. A picture of iron ore as it i• in the open-pit.
By 1894 the first year of significant production of the Mesabi ores--Minnesota ore accounted for 25 per cent of the national total (as opposed to 6 per cent in 1890).By 1910 Minnesota ore accounted for 51 per cent of the U. S. total the Lake Superior district in its entirety; 76 per cent.Iron ore production of the Lake Superior district continued to 36. A pie chart or bar graphgrow proportionately faster than other ore producing areas in showing Lake Superior s pro-the U. S. until 1935 when the Lake Superior district accounted portion of U.S. ore producticfor 93 per cent of the U. S. total. After 1935, the Lake Superior; portion has continuously declined in output--presently (1966 statistics) it accounts for 76 per cent of the total production.
- 24 -Digitized for FRASER http://fraser.stlouisfed.org/ Federal Reserve Bank of St. Louis

c. Ore production on the Mesabi has also decreased in absolute terms as well as relatively. Most of the decrease (18 per cent since 1955) is due to depletion of resources and increasing foreign competition mainly from Venezuela and Canadian ores. Imports have increased by 97 per cent since 1955, and account for 34 per cent of total U.S. production.
d. The greatness of the Mesabi range is due mainly to its large size,(110 miles from east to west and two to three miles wide) nearness of ore to the surface, quality of the ore, proximity to Lake Superior (a cheap transportation artery), and ease of mining (due to its nearness to the surface most of it can be mined in open pits).
The manufactured iron ore industry in the Lake Superior district (Taconite on the Mesabi and Jaspilite on the Marquette range).a. Definition of Mineral compostion.
Taconite is a low grade magnetic iron ore composed largely of chert, iron silicates and iron oxides (in the form of magnetite). Actual recoverable iron is low, about 25 per cent.Jaspilite is a nonmegnetic hematite— jasper rock composed of hematite and quartz. Recoverable iron runs about 33 per cent.
b. Geographic location of low grade ores— Immense reserves are located on the Mesabi along the eastern and central portions of the range.The less significant jaspilite (in terms of production and reserves) is found on the Marquette range in Upper Michigan.The eastern ranges are narrower and steeper than the Mesabi, as a result smaller tonages are available near the surface and some are too narrow to mine by open pit.
c. Advantages of, and the process of manufacturing low grade iron ore.Taconite is not useful as it comes from the mine. A beneficiation and concentration process is necessary to remove the iron ore from the silicate wastes of the taconite rock. The processed taconite products are pellets that contain approximately 65 per cent iron (Lake Superior natural ores average around 50 per cent iron).
37. A map showing Minnesota'sinternal railroad as it transports ore to the Great Lakes,
38. A pie chart showing the composition of taconite.
39. A picture of taconite in its unprocessed state.
40. A picture of manufacturedtaconite pellets^or one of the steps in the processing procedure .
Digitized for FRASER http://fraser.stlouisfed.org/ Federal Reserve Bank of St. Louis

Due to the low iron content of taconite, the manufacturing process is a costly venture. The higher costs, however, are more than offset by the superior taconite product which will smelt more rapidly and produce high grade iron and steel more cheaply than can be done with the available natural ores.Processing of jaspilite is in principle the same as that for taconite. The rock is ground to separate the hematite particles from the remaining waste minerals.
d. Production trends of taconite. The high demand for steel(consumption rose 48 per cent between 1960-65) couples with the depletion of high grade natural ores has resulted in a 37 per cent decline in the direct shipment of natural ores since 1960, whereas the shipment of taconite has increased 91 per cent over the same time period.
5. Industries associated with iron ore.a. Iron ore production is only significant because of the importance
.of its end product--the manufacturing of steel.b. The steel industry in the district and the Lake Superior area is
only minimal in relation to the amount of iron ore production. Duluth, Minnesota however, is a minor iron and stejel center.
c. Locational characteristics of the iron and steel industry in the United States.1. It is largely a market oriented industry; the three major
centers being Chicago-Gary, Pittsburgh-Cleveland, and Sparrows Point, Maryland.All three centers are advantageously located in relation to market as well as to transportation arteries that provide cheap transport for raw materials. The Great Lakes provide iron ore to the Chicago-Gary and Cleveland-Pittsburgh complexes and the ocean provides cheap transportation for foreign ores to the iron and steel industries of the east coast.More coal than iron ore, is used in the manufacture of steel; and iron ore has historically moved toward coal and the major U.S. markets.
41. A map showing the three major steel centers of the U.S., and the flow of ore to these cities from their source area.
- 26 -Digitized for FRASER http://fraser.stlouisfed.org/ Federal Reserve Bank of St. Louis

C. NICKEL DEPOSITS1. Geographic location - Ely, Minnesota in northeastern Minnesota.2. Geological characteristics and associated origin
a. Metallic minerals (such as nickel) are concentration by igneous activity from cooling magma.
b. The nickel deposits at Ely are associated with the Duluth Gabbro intrusion, a mass of igneous magma formed by ancient lava flows.
3. Importance of nickel for the national defensea. Nickel is considered by the government to be a strategic and
critical metal— it is a necessity in the manufacture of certain military aircraft, vehicles, and munitions.
4. Significance of the Ninth district nickel deposits in relation toentire U. S. picture.a. The United States is the world's largest consumer of nickel but
produces only 3 per cent of total world output. Consequently, the U. S. must rely on foreign sources for nickel, (especially Canada) and imports from 90-95 per cent if its total consumption. The value of any additional deposits of nickel in the U.‘ S. is obvious.
D. LIMESTONE DEPOSITS1. Geographic location
a. Northern Michigan close to the Lake Superior shore2. Geological origin
a. Limestone is a biochemically formed sedimentary rock composed primarily of the mineral calcite. It is formed by the action of plants and animals that extract calcium carbonate from the waters which they inhabit. When the organism dies it deposits the calcium carbonate which over long periods of time may form thick accumulations of limestone.
3. Importance of location and existence of Lake Superior limestonea. These deposits are the United States primary source of metallurgical
limestone; used as a flux in the production of steel.b. Because of the limestone quaries proximity to the Great Lakes they
are economically only 30 miles from the blast furnaces of the Chicago-Gary iron-steel market (inspite of the actual 300 miles distance).
42. Map showing Nickel deposit location.
43. Pie chart showing proportion of Nickel imported into the U.S.
- 27 -Digitized for FRASER http://fraser.stlouisfed.org/ Federal Reserve Bank of St. Louis

(SECOND OF THE THREE MAJOR GEOLOGICAL STRUCTURAL UNITS OF THE U.S.; INCLUDED WITHIN THE NINTH DISTRICT)
I. STABLE INTERIOR LANDSA. GEOGRAPHICAL LOCATION WITHIN THE DISTRICT - North and South Dakota,
southern and northwestern Minnesota, and Montana— minus the north and southwestern portions.
B. STRUCTURAL GEOLOGY - The Stable Interior is an area encirling the exposed Precambrian rocks of the Canadian Shield.1. The tectonic history of this area is similar to that of the Shield,
with the exception of greater subsidence which occurred during the Paleozoic era.Subsidence and sedimentation were slow and much interrupted in this Interior zone. Tilting and warping, in the otherwise stable crust, were the only folding movements affecting the area. The thinness of the sediments (their composition of clean sandstones, limestones and evaporites) reflect this tectonic history of the area.
2. As a result of the subsidence, shallow seas flooded the area depositing sedimentary rocks of a few thousand feet thickness, over the Precambrian basement.Basins and Arches were uplifted by vertical forces in these areas of the region where subsidence was less than the surrounding shelf (that part of the stable interior between the basins and arches).
I. COAL MINING AND PRODUCTIONA. GEOGRAPHIC LOCATION - Substantial deposits of lignite are found over most
of western South Dakota as well as eastern and north central Montana. Subbituminous, and a small amount of anthracite coal is found deposited in western Montana.
B. TYPES OR KINDS OF COAL There are 3 main kinds of coal; all of which vary in quality depending upon the carbon, moisture and volatile gas content.1. Anthracite - An almost smokeless, very hard variety - high in carbon
content, low in moisture and volatile gases.2. Lignite - The softest and dirtiest - low in carbon, high in moisture
and volatile gases.3* Bituminous - The all-purpose type; intermediate between anthracite
and Hffnite in purltv and hardness.
44. Map of the district showing the Interior Lands.
45. Map showing locations of the 3 coal types deposited in th district.
Digitized for FRASER http://fraser.stlouisfed.org/ Federal Reserve Bank of St. Louis

C. GEOLOGICAL FORMATION AND ORIGIN OF COAL1. Coal differs from other minerals in its organic origin. It was
formed from vegetable matter - trees, shrubs, herbs, vines, etc. that accumulated in swamps and bogs over millions of years. After a deep burial over long periods of time, under a thick cover of other rocks, peat is converted to coal by heat and pressure. The longer the vagetative source material has undergone decay, the higher the carbon content will be. Peat is the first coal product when the decaying organic matter begins the coalification process. More deposits of vegetation that were affected by earth movement and the mountain building process were upgraded to high ranking carbon coals such as anthracite and bituminous.
2. Lignite is an intermediate between peat and bituminous coal— it is the first coalized product of peat. Had the vast lignitefields of North Dakota and Montana been affected by earth movement, they could have been upgraded to sub-bituminous or bituminous coal,a. Lignite is most extensively used for heat and power generation,
although it has been replaced to some extent by supplies of oil and gas for heating purposes. Lignite may also be used as a source of industrialized gas, as an absorbent for removing liquids from gases, and as an industrial carbon "for decolorizing and refining sugar. Lignite produced in the Dakota area, is consumed for the most part in the local market as a source of residential heating. Initially, coal mines in the western U. S. had the transcontinental railroad as an important customer, but this market shrunk as the number of diesel-electric locomotives increased. The thermal-based generating capacity of North Dakota, also utilizes lignite in the generation of electric power. The largest lignite- based power site in the U. S. is at Fergus Falls, Minnesota.
3. Sub-bituminous coal is a lower grade of bituminous coal, but is of higher rank than lignite. Although it is black and looks similar to bituminous the moisture content is high; around 15 to 30 per cent.Like lignite, sub-bituminous coal is entirely non coking.
46. A thick single bar graph sho' the rank or value of anthrac coal, bituminous, sub-bitumi lignite and peat.
- 29 -Digitized for FRASER http://fraser.stlouisfed.org/ Federal Reserve Bank of St. Louis

D. COAL PRODUCTION AND RESERVES IN THE NINTH DISTRICTMontana, and the Dakotas contain 35 per cent of the nations coal reserves. Most of this may be accounted for by the large lignite deposits of North Dakota and Montana, where the 438 million tons comprise 98 per cent of the national total. Inspite of the relatively large proportion of coal deposits, district production at 5 per cent is nearly negligible at the national level. The low level of production in relation to deposits is due largely to the lack of high ranking coking coals which are utilized in the manufacturing of steel. Relative distance from the nations primary manufacturing area, as the primary market for coal is the factory, is also a factor. There is no strong correlation between coal reserves and actual output in the U. S. The important coal fields are all in, or fairly near, highly industrialized regions.
II. OIL PRODUCTION AND INDUSTRY IN THE STABLE INTERIOR LANDSA. GEOGRAPHIC LOCATION OF OIL FIELDS - NW Montana and the Williston
Basin in western North Dakota.B. ASSOCIATED GEOLOGIC FORMATIONS - There is no relationship between
landform and oil; the underlying bedrock is what is important.1. 99 per cent of the Worlds crude oil productions associated with
sedimentary rocks. A geologic history of marine deposition is also necessary for the genesis of oil. Petroleum is formed from plant and animal remains that accumulated on the sea floor along with the materials that formed sedimentary rocks. An Impervious formation of clay or shale is a necessary adjunct in the accumulation of oil. Past earth movements have formed uplifted and up- folded sediments called anticlines that serve as traps (or barriers) for the oil that has been formulated in the Williston Basin.
2. Most accumulations of oil have natural gas associated with them.The gas may be dissolved in the oil or may form a gas cap of free gas above the oil in the upper part of a structure or trap.
47. Pie chart or some other grap' that shows the district's proportion of total coal reserves.
48. Chart or graph portraying th< district's proportion of toti lignite reserves in the U.S.
49. Map showing the location of the district oil fields.
- 30 -Digitized for FRASER http://fraser.stlouisfed.org/ Federal Reserve Bank of St. Louis

C. CHARACTERISTICS OF THE OIL AND GAS INDUSTRIES IN NORTH DAKOTA AND MONTANA1. Production and Reserves
a. 1965 production of oil in Montana and North Dakota amounted to26 and 33 million barrels, respectively. This was 2 per cent of the total national production.
b. In 1965 proven oil reserve totaled 274 million barrels in Montana and 395 million barrels in North Dakota - 2 per cent of the total U.S. reserves.
c. In 1964, 24 and 35 billion cubic feet of natural gas were respectively marketed in Montana and North Dakota. This accounted for .4 per cent of the U.S. production.
d. In 1964 there were 590 billion cubic feet of proven natural gas reserves in Montana, and there were 1,111 million cubic feet of proven reserves in North Dakota. This amounted to .6 per cent of the national total.
2. Pipeline Networka. Most of the district's crude oil is transported by pipeline— the
cheapest mode, of oil transport--with the exception of the tank cars from North Dakota that move into the Twin Cities and Duluth-Superior refinery locations. The oil producing regions relative remoteness from the nations oil consuming area is substantially offset by the cheap transportation afforded by this pipeline network.
50. Map showing the pipeline network.
D. PETROLEUM RELATED INDUSTRY IN THE NINTH DISTRICT1. Major U.S. refiners operate refineries in the Twin Cities Metropolitan
Area, Duluth-Superior, Mandan and Williston, North Dakota, Billings, Great Falls, Cutbank, Kevin, Chinook, Laurel, Mosby, and Wolf Point, Montana.
51. Map showing the location of district oil refineries.
2. The 13 oil refineries located throughout the Ninth district, comprise less than 1 per cent of all U.S. refineries. Crude capacity of these plants is 268,325 barrels per calendar day - 2.6 per cent of the U.S. total. (Jan. 1966 figures)a. Montana and North Dakota refineries utilize the crude oil of the
Williston Basin, whereas, Lake Head and Twin City oil refineries procure most of their crude from the more competitively situated Canadian oil fields.
52. Flow map showing source ofoil used by district refiners
- 31 -Digitized for FRASER http://fraser.stlouisfed.org/ Federal Reserve Bank of St. Louis

E. LOCATIONAL ASPECTS OF OIL REFINING IN THE UNITED STATES(Although oil refining in the Ninth district does not make a significant economic impact upon the national scene, considering the relatively meager reserves of the area and its geographic remoteness to the major U. S. markets - refining capacity in the district fairs quite well).a. Throughout the United States, the oil refining industry is
primarily market oriented. Although the nations largest market for petroleum products (the Northeast) is now an oil deficit area, it supports the worlds largest single concentration of refineries in the World (most of which receive oil by ocean going tankers from Louisiana, Texas and Venezuela). Within the Northeast, a few centers are inland - they are served by pipelines from the midcontinent field or with barges on the Mississippi - Illinois water system.
b. Three basic reasons why large refineries are established in large markets, even where such areas are barren of oil.1. It is easier to bring in one material and distill it centrally
into 100 different products for distribution to the surrounding consumers than to bring in 100 different products from refineries in distant oil fields.
2. It is cheaper to ship a small volume of crude oil than a larger aggregate volume of its derivatives.
3. Tanker shipping rates are lower on crude oil than on its products.F. PRIMARY POWER RESOURCES OF THE UNITED STATES
The following table indicates the prevailing trendfrom 1930 to 1966.1930 1940 1950 I960 1966
Anthracite Coal 7.7% 5.2% 3.0% 1.0% 0.6%Bituminous and Lignite 53.5 h i . 2 34.8 22.2 22.5Crude Petroleum (25 A ! 31.4 37.2 41.6 /40.1/Natural Gas 9.9 12.4 20.3 31.6 33.1Electricity n.a. n.a. 3.6 3.8
5 . A component line graph showing the change in energy consumptio;
- 32 -Digitized for FRASER http://fraser.stlouisfed.org/ Federal Reserve Bank of St. Louis
I. MINERAL RESOURCES AND ASSOCIATED MINING OF THE BLACK HILLSA. GEOGRAPHIC LOCATION - Southwestern South DakotaB. GEOLOGICAL BACKGROUND - The region sits in the midst of the Great Plains
like an upside down bowl. Its geologic history, predating the stable interior, belongs in time to the Precambrian - Canadian Shield era.The inverted appearance of the region began to take shape about 2 billion years ago when a great sea deposited silts, iron-bearing muds and sands on the bottom of the body of water that covered southwestern South Dakota. Earth pressure, continuous for millions of years, ultimately resulted in the formation of a low system of mountains shrouded with black appearing pine forests that came to be known as the Black Hills.
C. GOLD MINING AND PRODUCTION1. Geographic Location - Lead, South Dakota in the Black Hills Region2. Geological Formation - Nearly all gold-bearing deposits occur near
acidic igneous intrusions - hydro-thermal solutions were penetrated into the rocks surrounding a magma during the igneous activity. Gold normally occurs in sialic igneous rocks, particularly quartz.
3. Strategic Importance of Golda. There are not many industrial uses of gold that are essential to
the military defense of the nation - the strategic significance of gold is in maintaining fiscal solvency as it is used as the monetary base for currency and the settlement of international trade balances. The primary non-monetary use of gold is for jewelry and the decorative arts.
4. Production of South Dakota Golda. The production of South Dakota gold stood at 131 thousand troy
ounces at the end of 1965 - this represented 39 per cent of the national production. South Dakota has been the leading gold producing state in the nation since 1950. The Homestake mine alone has been the nation's leading gold mine for many years and is the largest gold mine in the Western hemisphere.
54. Map showing the location of the Black Hills along with gold, beryllium and uranium deposits.
55. Pie chart or some other graphi showing South Dakota gold production in the U.S.
- 33 -Digitized for FRASER http://fraser.stlouisfed.org/ Federal Reserve Bank of St. Louis

D. BERYLLIUM PRODUCTION AND INDUSTRY1. Geographic Location - Black Hills, southwestern South Dakota.2. Geology - Beryllium occurs principally in granite and syenitic
intrusive igneous rocks, chiefly pegmatite, and granite.3. The Beryllium Industry was founded on the ability of beryllium to
harden and strenghthen some soft and ductile metals and alloys, and the primary use of beryllium has been in this field. Most notable are the beryllium--copper alloys. In recent years considerable interest in beryllium has developed in the fields of nuclear energy and supersonic aircraft, missiles, and space vehicles.
4. Significant Production of Beryllium in the District.a. South Dakota is the leading beryllium concentration producing
state. The significance of South Dakota production is apparent given the fact that most beryllium consumed in the United States is imported.
E. URANIUM1. Geographic Location of Ninth District Deposits - Black Hills,
South Dakota; Fall River County.2. Geological Formation
a. Although a 150 uranium-bearing minerals are known only a few are found in large enough quantities to be of economic value.
b. The carnotite mineral is the primary source of South Dakota uranium ore. It occurs as pore fillings and impregnations in the sedimentary sandstone, mudstone and limestone formations of the Inyan Kara group of early cretaceous age.
3. Strategic Importance of Uraniuma. The principle utilization of uranium is in. fuel for nuclear
energy generation. Uranium, as the dominant source material of atomic energy has obvious strategic significance for the U. S.
4. Importance of District Uranium Productiona. The Colorado Plateau is the most important single uranium producing
area in the U. S. South Dakota uranium production and mining is secondary in comparison to the Colorado Plateau states, but considering the strategic significance of uranium, South Dakota ores cannot be considered trivial.
- 34 -Digitized for FRASER http://fraser.stlouisfed.org/ Federal Reserve Bank of St. Louis

(THIRD OF THE THREE MAJOR GEOLOGICAL STRUCTURAL UNITS OF THE U.S.; INCLUDED WITHIN THE NINTH DISTRICT)I. ROCKY MOUNTAIN MIOGEOSYNCLINE
A. GEOGRAPHIC LOCATION - western MontanaB. GEOLOGICAL STRUCTURE AND FORMATION
1. (See previous definition of geosyncline) A miogeosyncline is considered to be less of a geosyncline in contrast to a eugeosyncline ■located on the western coast of the U.S.) and which is considered to be a true geosyncline. A eugeosyncline is usually situated aroundthe volcanic islands that supply sediment, and consequently it receives a great thickness of graywacke type of sediments, conglomerates, and lava flows. In the inner zone, the miogeosyncline subsides slower and the sediments are somewhat sorted by wave action. Clay is separated from sand to form shale and sandstone rather than left as a mixed graywacke. The slower subsidence in the miogeosyncline accounts for the thinness of sediment.
2. "The miogeosynclinal environment may be thought of as transitional from that of the stable interior to that of the eugeosyncline.During times of tectonic quiet the rocks deposited in the miogeosyncline are similar to those of the interior but are thicker; during orogeny, the miogeosynclinal rocks are more closely related tothose of the eugeosyncline." The miogeosyncline is also differentiated from the eugeosyncline by its comparative lack of igneous activity.
I. MINERAL RESOURCES AND MINING IN THE ROCKY MOUNTAIN REGIONA. COPPER DEPOSITS AND ASSOCIATED MINING INDUSTRIES
1. Geographic Location - Major copper deposits are located at Butte, in 57. southwestern Montana.
2. Geological Structurea. Deposits of copper are found in a variety of host-rocks under 58.
greatly varied structural conditions.b. Copper deposits are characteristically associated with igneous
activity, and the same can be said for the Butte deposits. 59.c. Vein deposits are the result of filling open fissures or of
replacing wall rock along narrow cracks, thus forming workable ore bodies. The vein system at Butte, Montana is characteristicof this type of deposit.
56. Map of District showing 3 maj< structural units with Rocky Mountain area standing out.
?
?
Map of Montana showing Butte location.
Picture of a piece of raw copper.Picture of copper deposits at Butte Mine.
- -
Digitized for FRASER http://fraser.stlouisfed.org/ Federal Reserve Bank of St. Louis

3. Copper Mining and Productiona. The United States is the largest producer and consumer of
copper in the world; producing about one-fourth, and consuming one-third of it.
b. Since 1940, Montana has been the third ranking c :oper producing state in the nation. Prior to that time, the Be * mines were second only to Arizona mines.
c. Since 1920, Butte's proportion of the total amou f mined copper has ranged from 14 to 9 per cent. Since : the range has been from 8.1 to 9.1 per cent of total produ .on.
d. Salient Characteristics of Butte Mining - Becaus of the billions worth of valuable metals that have been extracted from these mines, the large hill upon which Butte was built has been given the name "The Richest Hill on Earth". Mining in Butte's Summit Valley District has been characterized and made famous by its deep-shaft mines. Increasing proportions of output, however, are from open-pit mines. Mining activity goeson 24 hours a day, and electricity is used in all operations.
e. Industries Associated with Copper Mining.1. Copper concentration - The first step in transforming
metallic copper is concentrating. The locational pattern of copper concentrating mills correlates closely with that of the copper mines at Butte. The reason for this is the high weight loss ratio of copper - that is for every 100 tons of ore processed, 97.5 tons become waste products. Transportation costs for a high weight loss product transported for a considerable distance are apparent.
2. Copper Smelting - The second step in the transformation of copper is smelting. The weight loss ratio, at 60 per cent, is still fairly high and subsequently, smelters usually locate close to the concentrators. The primary smelter utilizing Butte ores is located at Anaconda, 20 miles from the concentrator at Butte. Due to the high weight loss ratio, 90 per cent of the nation's smelters are located in the western copper belt.
60. Bar graph showing the proportion rby the U.S. and the proportion consumed.
61. Picture of this "Hill".
62. Picture of deep-shaft mining.
63. A map showing the location of the mine in addition to the copper concentrator, smelter and refiner in Montana.
- 36 -Digitized for FRASER http://fraser.stlouisfed.org/ Federal Reserve Bank of St. Louis

3. Copper Refining - The third step in transforming copper is refining. The weight loss ratio is very low, and what is lost is valuable. Consequently there is no economic disadvantage to paying freight on the lost product (as well as the copper) over a long distance. Subsequently, the attraction of raw material areas is substantially less for refineries than for smelters or concentrators. The copper refinery, located at Great Falls, is some 100 miles from Butte. Due to the low weight loss ratio and the value of the products that are lost, it is possible for refineries to be located entirely out of the copper resource area. One-half of the nations copper refineries are located on the Eastern Seaboard, a. Eastern refineries enjoy 3 favorable locational advantages,
1. close proximity to their market - the fabricating mill,2. nearness to foreign sources of copper (the U.S. is a
net importer of copper) and3. proximity to scrap copper which is produced in the
Northeastern United States.B. LEAD AND ZINC DEPOSITS AND MINING (Lead and Zinc ores are frequently 64. Map showing location of Zinc
found together and such is the case in the Butte Mining District) mines.1. Geographic Location - Butte-Mining District in southwestern Montana.2. Geologic Formation - The formation of lead and zinc are associated
with igneous activity. Lead and zinc deposits have been created 65. Picture of raw lead and zinc, mainly by the process of metasomatism, in which hydro-thermal solutions and magmatic gases have replaced some of the original components of the rock surrounding a magma.
3. Utilization of Lead and Zinca. The principal uses of lead are for storage batteries,
tetraethyl lead, cable covering, paint pigments, building construction, ammunition and various alloys.
b. Zinc is used widely for its ability to control corrosion of steel, for its alloying properties with copper in brass, and for die casting forms.
- 37 -Digitized for FRASER http://fraser.stlouisfed.org/ Federal Reserve Bank of St. Louis

4. Production of Lead and Zinc in the Butte Mining District.a. Production of lead, at 1.4 per cent and zinc at 5 per cent of
the national total (1966) are only minimal in relation to total national output.
5. Significance of District Lead and Zinc Production.a. The U.S. relies heavily upon foreign sources for lead and zinc.
Considering the United States relatively meager reserves in proportion to consumptive needs - Montana's relatively small proportion of domestic output cannot be viewed insignificantly.
GOLD AND SILVER DEPOSITS AND MINING1. Geographic Location - Butte Mining District in southwestern Montana.2. Geologic Formation - Gold and silver, commonly found together, are
deposited from the hydrothermal solutions that penetrate into the rock surrounding a magma during igneous activity. Deposition is the result of a drop in temperature and pressure as well as reaction to wall rock.
3. Utilization of Silver - Although silver serves as a base for paper currency, its principal use in recent years has been industrial.The primary industrial uses for silver include the manufacture of photographic materials, fabrications of sterling tableware and electroplate, silver solders and brazing alloys.
4. In the past 15 years, Montana gold production has fluctuated between 2.5 and 1.5 per cent of the national production - a mere drop in the bucket. Montana silver deposits are more plentiful than are gold deposits. In the past 15 years Butte silver mines have produced from 10 to 18 per cent of the nations output. (13 per cent in 1965) The U.S. is a net importer of silver.
CHROMIUM
66. Map of gold and silver mine locations.
67. Picture of gold and silver in the raw state.
1. Geographic Location - The Mouat deposit at Nye in southwestern Montana. 68. Map of chromium deposit locatat Nye.
Digitized for FRASER http://fraser.stlouisfed.org/ Federal Reserve Bank of St. Louis
2. Geological Formationa. Chromite is composed basically of oxides of chromium, iron,
aluminum, and magnesium in varying quantities. It occurs in intrusive peridotite, serpentine, and in the periodotitic parts of stratified igneous rock complexes.
3. Utilization of Chromiuma. The three major uses of chromite are in the manufacture of
metal and alloys, refractories, and chemicals. It is the primary alloying component of stainless steel, where it enhances resistance to corrosion, oxidation, wear, friction, creep and impact.
69. Bar graph showing proportion of chromium imported.
4. Strategic Significance of Montana Chromiuma. The Mouat Mine at Nye, Montana is the nations leading domestic
source of chromite. Since the United States is nearly totally dependent (about 90 per cent of consumption is imported) upon foreign sources for chromite; largely from Turkey, Rhodesia, Nyasaland, the Union of South Africa, and the Phillipines, those domestic sources that are available take on obvious importance.
- 39 -Digitized for FRASER http://fraser.stlouisfed.org/ Federal Reserve Bank of St. Louis

STRUCTURE AND FUNCTION OF THE URBANIZED CENTERS THROUGHOUT THE DISTRICT
A. RISE AND GROWTH OF URBAN CENTERS1. "Cities and service centers do not grow up by themselves. They 70.
ultimately depend for their life upon the surplus products of farmers, miners, foresters, and fishermen. But before surpluses of wheat, iron ore, logs and salmon can be consumed, they must be processed or manufactured. This need gives birth to service centers whose residents a) assemble surpluses, b) change the form of some of the commodities, or c) ship them on to other service centers, and in either case, d) in return distribute tractors, overalls, shoes, flour and so on to the farmers and other mining producers. Thus, a chain is welded together whereby primary production, transportation, manufacturing, and serving are all interrelated.In short, the foundation upon which urban centers rise is based on surplus production. Countrysides set cities up to do tasks that must be performed in central places. And the people in these countrysides must be generating excess before they can pay for the servicing performed for them in tertiary centers.11*
B. MANUFACTURING SECTOR OF THE DISTRICT'S URBAN CENTERS AND ITS RELATION TO SURPLUS PRODUCTION IN THE REGION(Manufacturing accounts for 20 per cent of all non-agricultural employment in the district. This compares to 30 per cent for the nation).1. Natural Resource orientation of the Manufacturing Sector:Resource - Tied Manufacturing as a Proportion of Total Manufacturing 71.(Resource - tied manufacturing defined as those employed in lumber and wood products, stone, clay and glass, primary metals, agricultural machinery, food and kindred products, paper and allied products and petroleum products.)
Minnesota 407.(TCMA) 24%North Dakota 50%South Dakota 67%Montana 60%Ninth District 56%
Economic Geography, John W. Alexander, Univ. of Wisconsin, Prentice-Hall, Inc. 1963.
A map of the district showing the following regions: fores products area, mining (northeastern Minnesota, Rocky Mour ains and Black Hills), corn belt, dairy region, wheat are and livestock region.
Bar graphs showing district states (and TCMA) proportions of Resource-tied manufacturin to total manufacturing.
- 40 -Digitized for FRASER http://fraser.stlouisfed.org/ Federal Reserve Bank of St. Louis

a. Food Processing Sectors - The following tables and figures indicate the significance of food processing in the manufacturing sector of the District.Food Processing as a Proportion of Total Manufacturing
Minnesota 22% 72. Bar graphs showing district(TCMA) 15% states (and TCMA) proportionsNorth Dakota 42% of food processing to totalSouth Dakota 51% manu fac tur ing.Montana 17%District 23%
Food Processing as a Proportion of All Resource-Tied Manufacturing
Minnesota 53%(TCMA) 53%North Dakota 84%South Dakota 77%Montana 28%District 40%
The above sets of figures indicate the relative importance of food processing in the Dakotas as compared to Minnesota and Montana. In terms of absolute importance, however, the 4 states rank as follows:
Number of Employees in Food Rank Processing Industries______Minnesota 66,000South Dakota 7,650Montana 3,800North Dakota 3,7901. Meat Products - The regions major meat packing industries, found 74.
in Minnesota and South Dakota, are coterminous with the livestock feeding area of the Upper Midwest.Both states export substantial quantities of meat products to other regions.Meat products employed 58 and 31 per cent of resource tied manufacturing in South Dakota and Minnesota, respectively, in 1960.
Map of district showing major livestock area and the cities which have major meat packing industries.
73. Bar graphs showing districtstates (and TCMA) proportions o: food processing to resource-tiec manufacturing.
- 41 -Digitized for FRASER http://fraser.stlouisfed.org/ Federal Reserve Bank of St. Louis

2. Dairy Products - Most of the regions surplus dairy products are produced and manufactured in Minnesota and Northwestern Wisconsin.Dairy processing industries employed 20 and 46 per cent of resource manufacturing in Minnesota and Wisconsin, respectively, in 1960.
3. Grain Products - In spite of the vast spring wheat area ofthe region, grain products provide very little non-agricultural. employment.Minnesota and Montana employed 12 and 14 per cent of their total resource manufactures in the processing of grain products.
4. Other Food ProductsA various assortment of foods are processed in the district, including beer, baked goods, frozen foods, canned foods and processed fats and oils,
b. Wood-Using SectorsLumber products and the pulp and paper manufactures are second only to food processing as a source of manufacturing.Lumber Manufacturing As a Proportion of Total Manufacturing
Minnesota 10%North Dakota -0-South Dakota 2%Montana 26%District 13%
Lumber Manufacturing As a Proption of Total Resource-Tied ManufacturesMinnesota 18%North DakotaSouth Dakota 3%Montana 45%District 23%
As shown by the above figures and tables, lumber manufacturing is an important industry in northern Minnesota and western Montana. Upper Michigan and northwestern Wisconsin are also important in wood processing. The Dakotas are barren of significant timber stands.
- 42 -Digitized for FRASER http://fraser.stlouisfed.org/ Federal Reserve Bank of St. Louis

c. Oil Refining and Primary MetalsThe primary metals and oil refining are most important in Montana where 23 per cent of the non-agricultural labor force is employed in oil refining and primary metal manufacturing.In 1960, primary metals and oil refining accounted for 4 per cent of the district's employment.
C. PATTERN-FUNCTION OF DISTRICT URBAN CENTERS1. Minimum Convenience Centers
"The district's economic progress from subsistence to convenience has brought forth hundreds of service centers of various sizes, of which the most ubiquitous appear to be the small retail and service towns referred to as "minimum convenience" centers.This particular group or classification of towns belong to the basic type of "convenience" outlet recognized in retail marketings as the minimal level of retail establishment and include just one eating place, bank, hardware store, drug store, grocery store, gasoline station, general merchandise, variety, garage, auto, and implement dealer".*
2. Urban Concentrations of 10,0004- InhabitantsAbove the "minimum convenience" level of urban concentration, "higher- level centers are distinguished by increments of increasingly specialized retail stores. Above that level the trade centers distinguish themselves primarily on the basis of wholesale establishments".**In addition to the Twin Cities Metropolitan Area there are 51 urban concentrations of 10,000 or more persons. The following is a listing of those cities with 1965 population estimates, plus a classification of their primary function.***
* The Urbanization of the Upper Midwest: 1930-60. John R. Borchert.** The Urbanization of the Upper Midwest: 1930-60, John R. Borchert.*** City functions taken from The Industrial Structure of American Cities, by
Gunnar Alexandersson, University of Nebraska Press, 1956.
- 43 -Digitized for FRASER http://fraser.stlouisfed.org/ Federal Reserve Bank of St. Louis
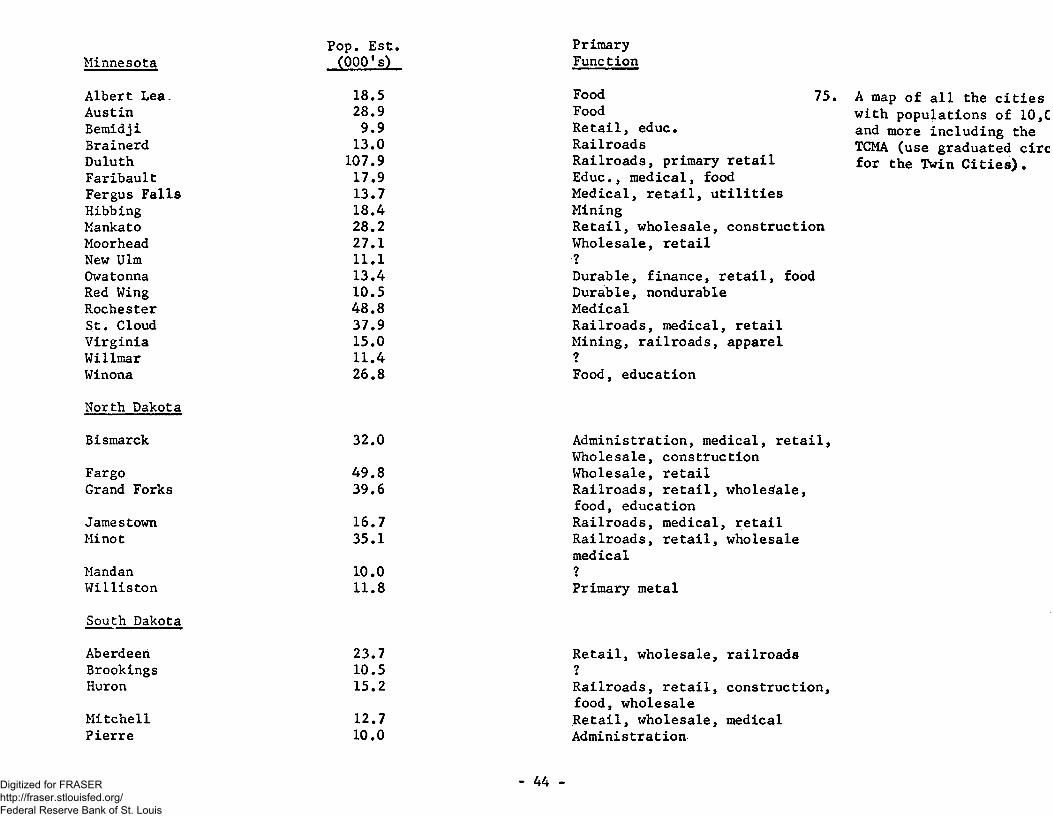
Pop. Est.Minnesota (000's)
Albert Lea. 18.5Austin 28.9Bemidji 9.9Brainerd 13.0Duluth 107.9Faribault 17.9Fergus Falls 13.7Hibbing 18.4Mankato 28.2Moorhead 27.1New Ulm 11.1Owatonna 13.4Red Wing 10.5Rochester 48.8St. Cloud 37.9Virginia 15.0Willmar 11.4Winona 26.8North DakotaBismarck 32.0Fargo 49.8Grand Forks 39.6Jamestown 16.7Minot 35.1Mandan 10.0Williston 11.8South DakotaAberdeen 23.7Brookings 10.5Huron 15.2Mitchell 12.7Pierre 10.0
- 44
PrimaryFunction
Food 75. A map of all the citiesFood with populations of 10,CRetail, educ. and more including theRailroads TCMA (use graduated circRailroads, primary retail for the Twin Cities).Educ., medical, food Medical, retail, utilities MiningRetail, wholesale, construction Wholesale, retail ?Durable, finance, retail, foodDurable, nondurableMedicalRailroads, medical, retail Mining, railroads, apparel ?Food, education
Administration, medical, retail, Wholesale, construction Wholesale, retail Railroads, retail, wholesale, food, education Railroads, medical, retail Railroads, retail, wholesale medical ?Primary metal
Retail, wholesale, railroads 1Railroads, retail, construction, food, wholesale Retail, wholesale, medical Administration
Digitized for FRASER http://fraser.stlouisfed.org/ Federal Reserve Bank of St. Louis
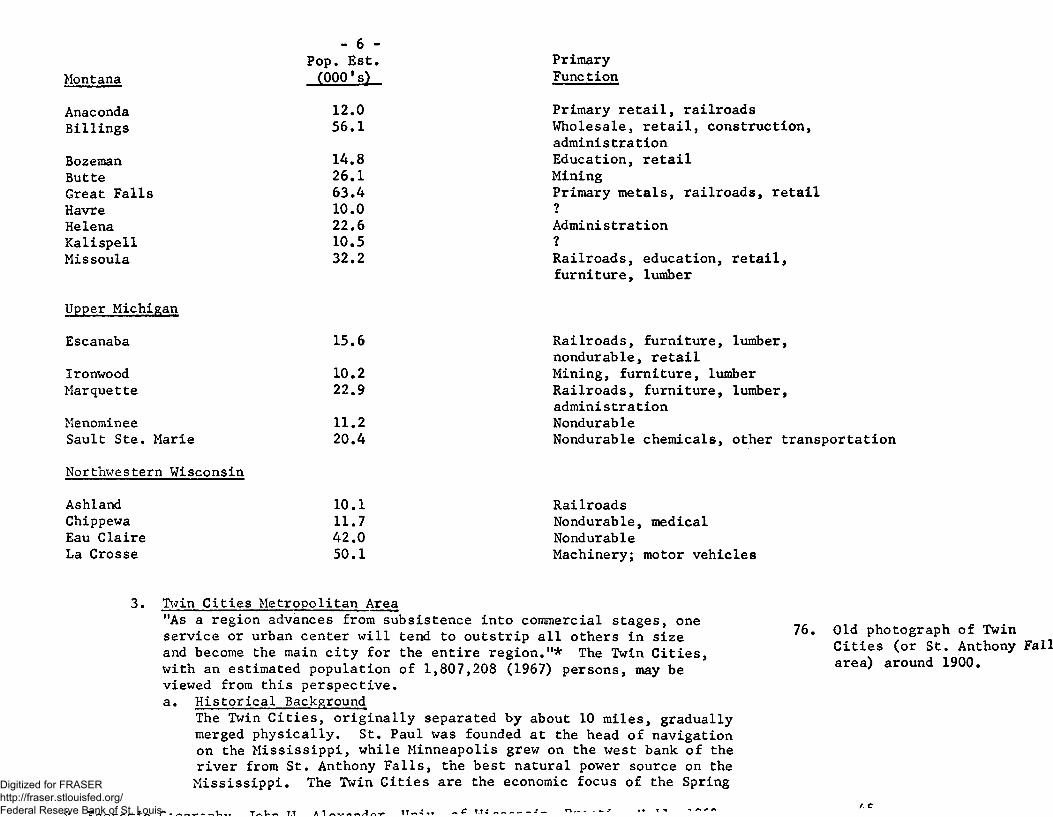
- 6 - Pop. Est.
Montana (0001s)Anaconda 12.0Billings 56.1Bozeman 14.8Butte 26.1Great Falls 63.4Havre 10.0Helena 22.6Kalispell 10.5Missoula 32.2
Upper MichiganEscanaba 15.6Ironwood 10.2Marquette 22.9Menominee 11.2Sault Ste. Marie 20.4Northwestern WisconsinAshland 10.1Chippewa 11.7Eau Claire 42.0La Crosse 50.1
PrimaryFunctionPrimary retail, railroadsWholesale, retail, construction,administrationEducation, retailMiningPrimary metals, railroads, retail7AdministrationRailroads, education, retail, furniture, lumber
Railroads, furniture, lumber,nondurable, retailMining, furniture, lumberRailroads, furniture, lumber,administrationNondurableNondurable chemicals, other transportation
RailroadsNondurable, medical NondurableMachinery; motor vehicles
3. Twin Cities Metropolitan Area"As a region advances from subsistence into commercial stages, one service or urban center will tend to outstrip all others in size and become the main city for the entire region."* The Twin Cities, with an estimated population of 1,807,208 (1967) persons, may be viewed from this perspective,a. Historical Background
The Twin Cities, originally separated by about 10 miles, gradually merged physically. St. Paul was founded at the head of navigation on the Mississippi, while Minneapolis grew on the west bank of the river from St. Anthony Falls, the best natural power source on the Mississippi. The Twin Cities are the economic focus of the Spring
76. Old photograph of TwinCities (or St. Anthony Fall area) around 1900.
Digitized for FRASER http://fraser.stlouisfed.org/ Federal Reserve Bank of St. Louis

Picture of logs floating down stream.Picture of stockyards.Picture of flour mills.
white pine forests of the north, ease of floating logs down the Mississippi River, and the available water power from the Falls of St. Anthony. With the depletion of timber resources and the declining lumber industry - the processing of wheat expanded.Minneapolis has been, for a long time, the principal collecting point for spring wheat from Minnesota and the Dakotas. Although flour milling has declined with the growth of the Great Lakes grain trade, and the expansion of milling at Kansas City in the winter Wheat Belt, Minneapolis has maintained her position as the nations third most important milling city.About 1900, St. Paul became known for its slaughtering and meat packing - industry. St. Paul is still noted for its slaughter houses; as cattle from the western ranges are fattened on farms surrounding the Twin Cities, sold in their stockyards, slaughtered in their packing-houses and sent in the form of meat to the eastern market.The significance of butter processing in the Twin Cities is an obvious reflection of the regions dairy hinterland,
b. Present Urban Structure of the Twin CitiesAlthough the food processing industries - so important for the initial growth impetus of Minneapolis-St. Paul - have remained significant, the Twin Cities economic base has become more diversified. The urban economic base may be viewed by examining the emp1oyment s true ture.The following table (October 1967 data) is a breakdown of the employment structure of the TCMA. (The employment structure is used as the best single indicator of an urban centers basic functions and structure because it refers to the way the working population of a place is divided up among the various categories of economic activity).
Wheat Country to the west, the Dairy Region to the north and east, 77. and the Commercial Crop and Livestock Region to the south.The raw materials of these regions most easily assembled at Minneapolis-St. Paul, were significant in the establishment of 78.initial industries. From 1840 until the early 1900's the lumber industry dominated manufacturing, due to the proximity of the 79.
- 46 -Digitized for FRASER http://fraser.stlouisfed.org/ Federal Reserve Bank of St. Louis
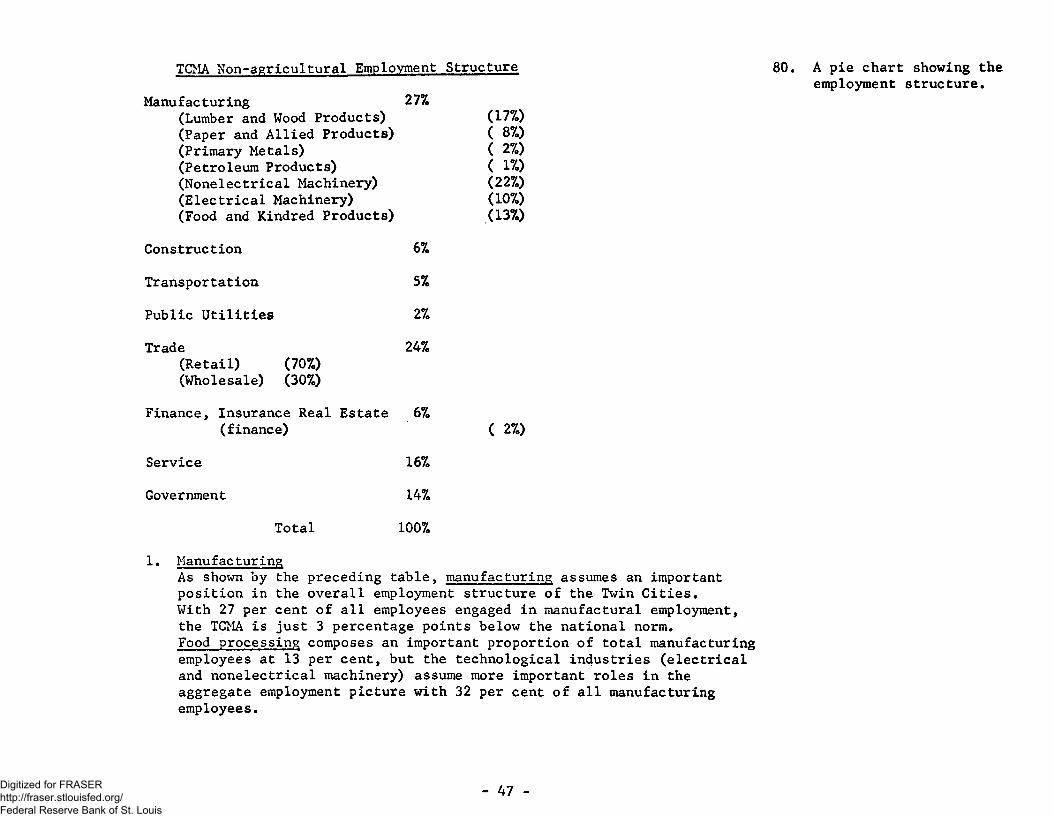
TCMA Non-agricultural Employment StructureManufacturing 27%
(Lumber and Wood Products) (17%)(Paper and Allied Products) ( 8%)(Primary Metals) ( 2%)(Petroleum Products) ( 1%)(Nonelectrical Machinery) (22%)(Electrical Machinery) (10%)(Food and Kindred Products) (13%)
Construction 6%Transportation 5%Public Utilities 2%Trade 24%
(Retail) (70%)(Wholesale) (30%)
Finance, Insurance Real Estate 6%(finance) ( 2%)
Service 16%Government 14%
Total 100%1. Manufac turing
As shown by the preceding table, manufactur ing assumes an important position in the overall employment structure of the Twin Cities.With 27 per cent of all employees engaged in manufactural employment, the TCMA is just 3 percentage points below the national norm.Food processing composes an important proportion of total manufacturing employees at 13 per cent, but the technological industries (electrical and nonelectrical machinery) assume more important roles in the aggregate employment picture with 32 per cent of all manufacturing employees.
. A pie chart showing the employment structure.
- 47 -Digitized for FRASER http://fraser.stlouisfed.org/ Federal Reserve Bank of St. Louis

2. Technological Industriesa. Although a wide assortment of technological industries are
established throughout the Upper Midwest and the Twin Cities Metropolitan Area - electronics and data processing are the only industries that are sufficiently established to rank among the top ten producing areas in the country.Presently, non-electric machines (data processing is included in this category) comprise 18 per cent of all Minnesota manufactures, and 22 per cent of all Twin City manufacturing.The electronics sector comprises 8 per cent of all Minnesota manufacturing and 10 per cent of the Twin City manufacturing employment.
b. Most technological industries in the Ninth District are located in the Twin Cities Metropolitan Area and various cities within a 100-mile radius of the metropolitan area.The prime locational advantage of the Twin Cities for attracting Technological industries to the area is due largely to the presentee of the University of Minnesota. Many technological firms throughout the United States owe their existence to an Institution of Higher Education. This is due primarily to the availability of engineers and scientists— so necessary in production development and research--provided by educational institutions.The location of the Twin Cities on the periphery of the major manufacturing belt and market of the nation, is not a hindrance as transportation costs on finished goods produced by technological industries are low, and their value is high.
3. Wholesale and Retail TradeTrade, with 24 per cent of the total non-agricultural working force encompases an important segment of total employment in the TCMA. However, retail trade (which makes up 70 per cent of the total trade employment) is the most universally important economic activity, ranking first in the employment structure of most cities.
81. A picture of the insideoperations in one of the dat processing and electronics firms.
- 48 -Digitized for FRASER http://fraser.stlouisfed.org/ Federal Reserve Bank of St. Louis

The important thing to note is the high proportion of wholesaling activity, with 30 per cent of all trade employees. In the aggregate, wholesaling accounts for a seemingly low proportion of all non- agricultural employees at 7 per cent of the total. However, this proportion is high enough (1 standard deviation above the national average of employees in wholesaling) to rank Minneapolis-St. Paul as one of the major (9th in rank) wholesaling outlets in the nation.*
Wholesale Establishments and Dollar SalesNumber $000 Percentage
SMSA'S (1963) Estab.'s Sales National T<New York 31,368 57,562 16.0%Chicago 12,206 23,682 6.6%Los Angeles 12,216 17,138 4.8%Philadelphia 7,476 10,252 2.9%Detroit 5,643 9,952 2.7%San Francisco 5,804 9,901 2.7%Boston 5,809 8,192 2.2%St. Louis 3,853 6,582 1.8%MPLS-ST.PAUL 3,160 6,565 1.8%Cleveland 3,665 6,323 1.7%
United States 308,177 358,386
* Minneapolis-St. Paul significance as wholesaling and financial center, and standard deviation computation, derived by geographer Howard Nelson as cited in "Economic Geography" by John W. Alexander, Univ. of Wisconsin, Prentice- Hall, 1963.
82. A map of the U.S. showingthe 10 major wholesale centers
- 49 -Digitized for FRASER http://fraser.stlouisfed.org/ Federal Reserve Bank of St. Louis

4. FinanceFinance, with 2 per cent of the total employment in Minneapolis- St. Paul appears to be of minimal significance in the overall employment picture. But within the national scene, the TCMA'S employment finance is 2 standard deviations above the national average. The following table indicates the significance of Minneapolis-St. Paul as one of the nation's leading financial centers.
Top 15 Finance, Insurance and Real Estate Centers in the United States - 1966Per Cent of Pop. in Fin.Ins. & Real Estate
New York 9.5Dallas 8.0San Francisco 7.2Atlanta 7.0Boston 6.8Miami 6.6Kansas City (Mo.) 6.3Phoenix 6.4MPLS-ST. PAUL 5.8Chicago 5.7Seattle 5.7Los Angeles 5.5Philadelphia 5.2Baltimore 5.1
83. Map of the U.S. showing top 15 financial centers of the nation.
- 50 -Digitized for FRASER http://fraser.stlouisfed.org/ Federal Reserve Bank of St. Louis

D. NON-AGRICULTURAL EMPLOYMENT STRUCTURE OF- THE NINTH DISTRICT - 1967Trans.and
Fin.Ins.
Manu. Mining Const. P. Ut. Trade R. Est. Service Gov'Minnesota 257. 17. 67. 7% 247. 57. 157. 177.(TCMA) 27 mm 6 7 24 6 16 14North Dakota 6 1 7 8 28 4 17 28South Dakota 9 1 6 6 27 4 17 30Montana 13 4 4 9 24 4 14 28Ninth District 20 2 6 7 24 5 16 20United States* * 1966 Figures
30 1 5 6 21 5 15 17
1. Ninth District Deviation from the United States AverageThe primary difference between the district and nation is the larger porportion of manufactural employees for the nation at 30 per cent, compared to 20 per cent in the District. Other differences include a slightly higher proportion of trade employees in the district (24 per cent compared to 21 per cent) and the higher proportion of government employees in the district (20 per cent as opposed to 17 per cent).
2. Variation Among District StatesThe primary difference is Minnesota's larger proportion of employees engaged in manufacturing, at 25 per cent of the total employment, compared to 6, 9, and 13 per cent for North Dakota, South Dakota, and Montana, respectively. This difference is due largely to the dominance of the Twin Cities Metropolitan Area. Another dissimilarity between district states is the higher proportion of mining employees, at 4 per cent in Montana, as opposed to 1 per cent in the other ' district states. The only other noticeable difference is the larger proportion of governmental employees in Montana and the Dakotas (28-30 per cent), compared to Minnesota (14 per cent).
84. A bar graph of the distri< (and the TCMA) showing th< different proportions of manufacturing employment.
- 51 -Digitized for FRASER http://fraser.stlouisfed.org/ Federal Reserve Bank of St. Louis

E.- TRANSPORTATION AND URBANIZATION(The transportation network of any region is interrelated with the natural resource base and the urbanization process, as illustrated below)1. There are six factors that must be operative if economic trans
portation is to occur between any two points. (North Dakota and Illinois may be used as examples)a. There must be a surplus product , such as wheat in North Dakota.b. Illinois must desire the surplus product. Two places are said
to be complementary if such a relationship exists-surplus product and a desire for that product.
c. North Dakota must have a competitive advantage in the production of her surplus. No matter how much wheat she produces beyond her own needs, she may fail in her bids for sales of wheat(or flour) to Illinois customers if other wheat growing regions produce wheat at less cost.
d. Illinois must have the ability to pay for Dakota wheat.e. There must be an absence of intervening opportunity. Complemen
tariness alone does not bring about trade between two areas; only when there is no nearer complementary source to each will trade be encouraged between Dakota and Illinois.
f. Both ability to pay and absence of intervening opportunity are, in turn, influenced by transferability, that is, the cost of transportation measured by the time required for the trip, and money, or its equivalent in credit. No matter how perfectly complementary the two areas, no matter how complete the absence of intervening opportunity, there would be no trade in wheat from Dakota to Illinois if transfer costs exceeded the ability and desire to pay.
2. Several relationships involving railways, highways, waterways, airlines and pipelines apply to the group as a whole and are involved with the operation of the foregoing general factors.a. Location of Population
There is a locational relationship between transportation and population; that is, the larger the population, the greater the transportation. Conversely, the transportation has had an influence on location of population. The great migrations of recent times (such as westward into the United States) have been expedited and even stimulated by transportation facilities. Here then is a reciprocal relationship, which comes first is difficult to say, but it is certain that each influences the other and a chain reaction sets in.
. Map of U.S. showing rail trai portation routes and larger population concentrations.
- 52 -Digitized for FRASER http://fraser.stlouisfed.org/ Federal Reserve Bank of St. Louis

b. Location of Surplus ProductA very close relationship exists between production and transportation. Areas that generate a surplus of any commodity in economic demand also foster transportation media, often constructed in the face of stiff impediments, to move that surplus to potential customers.
c. Location of MarketsAs production determines one end of transportation routes, consumption can fix the other. Consumption is, in fact, the major cause for the intense development of transportation in Europe and Anglo-America, the world's two main markets.
d. Industrialization and UrbanizationThese two processes go hand in hand, influencing the spread of economic exchange; cities invite roads, railways, pipelines, and airways. Whether on a world, nation, state, or county basis, the correlation between transport development and industrial urban development is high, as visual comparisons of the world pattern of manufacturing and of major cities with Atlas maps of world railways, highways, waterways, pipelines, and airways will reveal.Unquestionably cities attract transportation. Conversely, transportation is a maker of cities. A focus of routes is a favorable location for a city, and cities with the heaviest traffic tend to grow most rapidly.
The entire preceding section beginning with E. Transportation and Urbanization was extracted intoto from Economic Geography. John W. Alexander, University of Wisconsin,'Prentice-Hall, 1963.
3. Transportation Network of the Ninth Districta. Water Transportation
The two principal water systems in the district are the Mississippi River and the Great Lakes. (Water is the most economical form of transportation for low-value bulk commodities over long distances)1. Mississippi River - Minneapolis and St. Paul are the chief 86. Map of the district plus thosi
Mississippi River ports that serve the Upper Midwest region. states through which the MissThese ports (St. Paul handles considerably more traffic than flows indicating flow of impodoes Minneapolis) serve primarily as centers of imports of into Mpls-St. Paul ports,domestic bulk commodities such as petroleum products, stone, sand and shells.
- 53 -Digitized for FRASER http://fraser.stlouisfed.org/ Federal Reserve Bank of St. Louis

2. Great Lakes - Duluth-Superior is an important port fordomestic traffic, with iron ore dominating its tonnage and grain the second most important commodity. In contrast to the Mississippi River ports at Minneapolis-St. Paul, Duluth Superior is primarily an export port.
b. Rail TransportationRaw materials are the basic commodities that are transported from District states by rail for processing and manufacture. They are as follows:
Wheat - all district statesCattle and Calves - MontanaFresh Meat - South Dakota, Minnesota, and WisconsinLumber - Montana, Minnesota, Michigan, and Wisconsin
c. Air TransportationThe only significant air terminal in the district is located 89. Map of district showing major.i.-.in the Twin Cities Metropolitan Area. Airports of lesser airports and major air routes,sicrificance are located at Great Falls, Billings, Rapid City,Sioux Falls, Fargo and Duluth.The primary function of air communications within the district is passenger service.
88. Map of the rail network showir commodity flows transported.
87. Map of district including the Great Lakes--show commodity flows to the Lakes.
V /I P v* £
___ y\ j V . v?
’ o ’J.uin/ Supcnor •
Ok - 54 -Digitized for FRASER http://fraser.stlouisfed.org/ Federal Reserve Bank of St. Louis