Note: This product is published by the Oregon Department of Agriculture (ODA), in cooperation with...
17
Note: This product is published by the Oregon Department of Agriculture (ODA), in cooperation with the Oregon Department of Forestry (ODF). Contact: Pete Parsons, ODF Meteorologist Seasonal Climate Seasonal Climate Forecast Forecast Verification Verification January – March 2015 January – March 2015 Issued: April 19, 2015 Issued: April 19, 2015
-
Upload
linette-preston -
Category
Documents
-
view
220 -
download
0
Transcript of Note: This product is published by the Oregon Department of Agriculture (ODA), in cooperation with...
Note: This product is published by the OregonDepartment of Agriculture (ODA), in cooperationwith the Oregon Department of Forestry (ODF).
Contact: Pete Parsons, ODF Meteorologist503-945-7448 [email protected]
ODA Production support from Diana Walker and Andy Zimmerman
Note: This product is published by the OregonDepartment of Agriculture (ODA), in cooperationwith the Oregon Department of Forestry (ODF).
Contact: Pete Parsons, ODF Meteorologist503-945-7448 [email protected]
ODA Production support from Diana Walker and Andy Zimmerman
Seasonal Climate Seasonal Climate ForecastForecast
VerificationVerificationJanuary – March 2015January – March 2015
Issued: April 19, 2015Issued: April 19, 2015
Format and Purpose:Format and Purpose: A side-by-side comparison of the A side-by-side comparison of the ““Seasonal Seasonal Climate ForecastClimate Forecast”” vs. what vs. what (Actually Occurred) (Actually Occurred) is is done for both the 1-month & 3-month forecasts.done for both the 1-month & 3-month forecasts.To assess the utility of this forecast and form a To assess the utility of this forecast and form a basis for basis for ““adjustmentsadjustments”” to the forecast method*. to the forecast method*. Some recent forecast Some recent forecast ““adjustmentsadjustments”” have have dramatically impacted forecast accuracy (next dramatically impacted forecast accuracy (next slide).slide).Note: 1981-2010 long-term averages are used.Note: 1981-2010 long-term averages are used.
** See See ““Forecasting Methods…Forecasting Methods…”” at: at:http://www.oregon.gov/ODA/programs/NaturalResources/Pages/Weather.aspx
Verification Updates:Verification Updates: This forecast method has greatest skill during This forecast method has greatest skill during El Niño El Niño (warm)(warm) or or La Niña (cold)La Niña (cold) events. ENSO-neutral winters events. ENSO-neutral winters are more varied and usually have more are more varied and usually have more ““extremeextreme”” weather weather events.events. A return to the A return to the ““cool phasecool phase”” of the Pacific Decadal of the Pacific Decadal Oscillation (PDO) occurred no later than 2007, but Oscillation (PDO) occurred no later than 2007, but the the real-time value of the PDO index (warm or cool) appears real-time value of the PDO index (warm or cool) appears to be the more-dominant factor for this type of analog to be the more-dominant factor for this type of analog work.work. Only Only ““cool phasecool phase”” PDO years were used to create the PDO years were used to create the forecasts issued this past autumn. However, the real-time forecasts issued this past autumn. However, the real-time PDO index is PDO index is highly positivehighly positive, which may help to explain , which may help to explain this winterthis winter’’s significant increase in forecast error.s significant increase in forecast error. Current forecasts consider years in both warm and cool Current forecasts consider years in both warm and cool phases of the PDO,phases of the PDO, which should decrease this error. which should decrease this error.
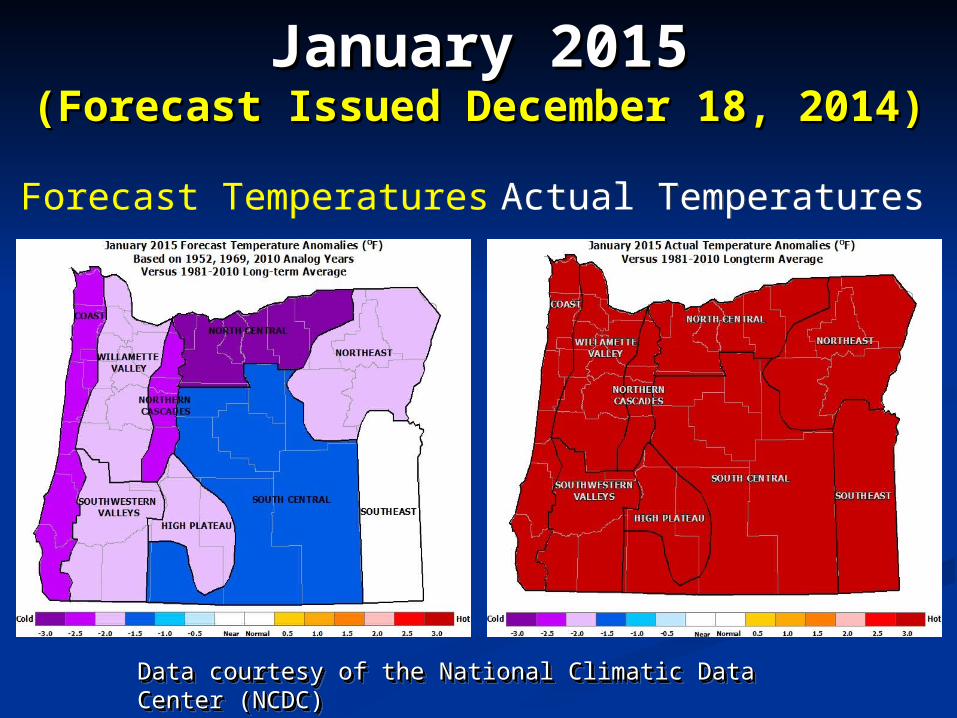
January 2015January 2015(Forecast Issued December 18, 2014)(Forecast Issued December 18, 2014)
Actual TemperaturesActual Temperatures
Data courtesy of the National Climatic Data Center Data courtesy of the National Climatic Data Center (NCDC)(NCDC)Data courtesy of the National Climatic Data Center Data courtesy of the National Climatic Data Center (NCDC)(NCDC)
Forecast TemperaturesForecast Temperatures
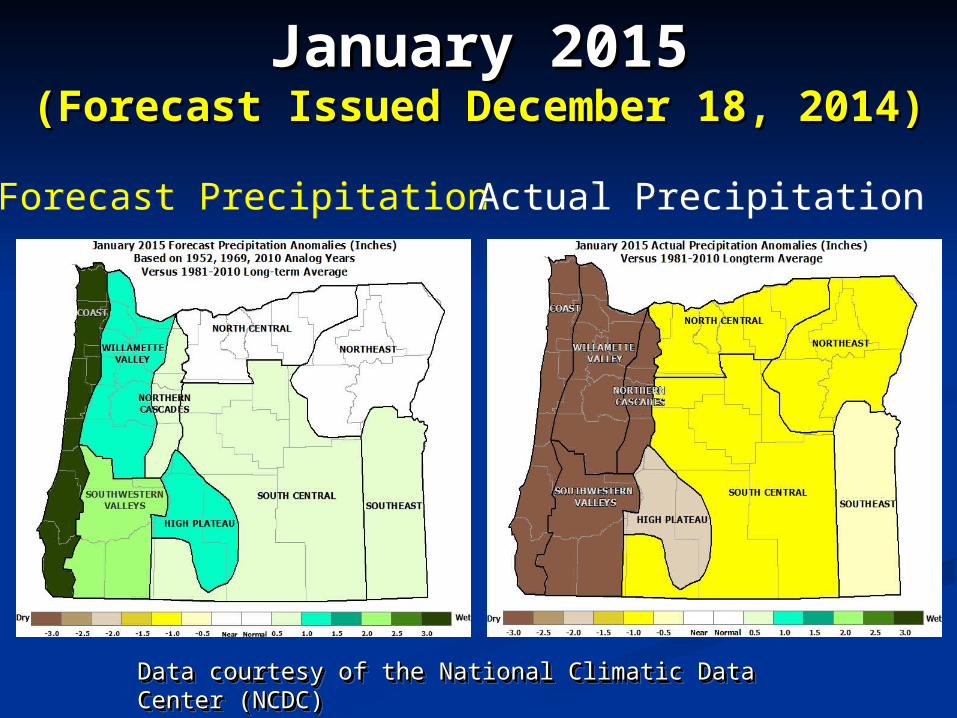
January 2015January 2015(Forecast Issued December 18, 2014)(Forecast Issued December 18, 2014)
Forecast PrecipitationForecast Precipitation Actual PrecipitationActual Precipitation
Data courtesy of the National Climatic Data Center Data courtesy of the National Climatic Data Center (NCDC)(NCDC)Data courtesy of the National Climatic Data Center Data courtesy of the National Climatic Data Center (NCDC)(NCDC)
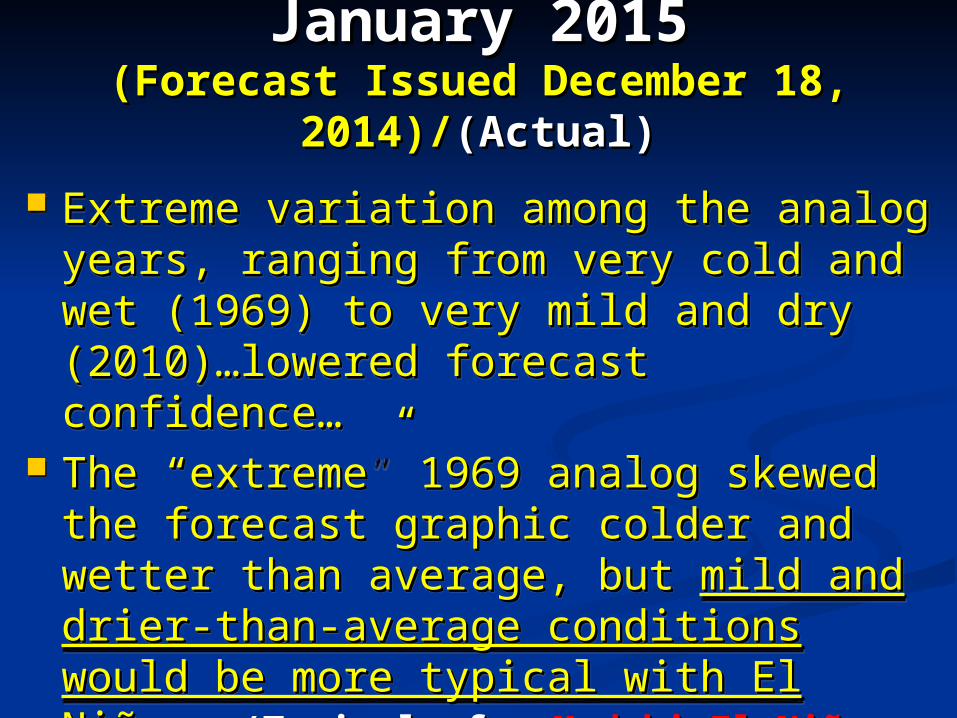
January 2015January 2015(Forecast Issued December 18, (Forecast Issued December 18,
2014)/2014)/(Actual)(Actual)
Extreme variation among the analog Extreme variation among the analog years, ranging from very cold and wet years, ranging from very cold and wet (1969) to very mild and dry (2010)…(1969) to very mild and dry (2010)…lowered forecast confidence…lowered forecast confidence…
The The ““extremeextreme”” 1969 analog skewed the 1969 analog skewed the forecast graphic colder and wetter than forecast graphic colder and wetter than average, but average, but mild and drier-than-mild and drier-than-average conditions would be more average conditions would be more typical with El Niño.typical with El Niño. (Typical of a (Typical of a Modoki El Niño (occurs when the Modoki El Niño (occurs when the tropical SST warming is confined mainly tropical SST warming is confined mainly to the west-central Pacific Ocean)to the west-central Pacific Ocean), , conditions were much warmer and drier conditions were much warmer and drier than average statewide.)than average statewide.)
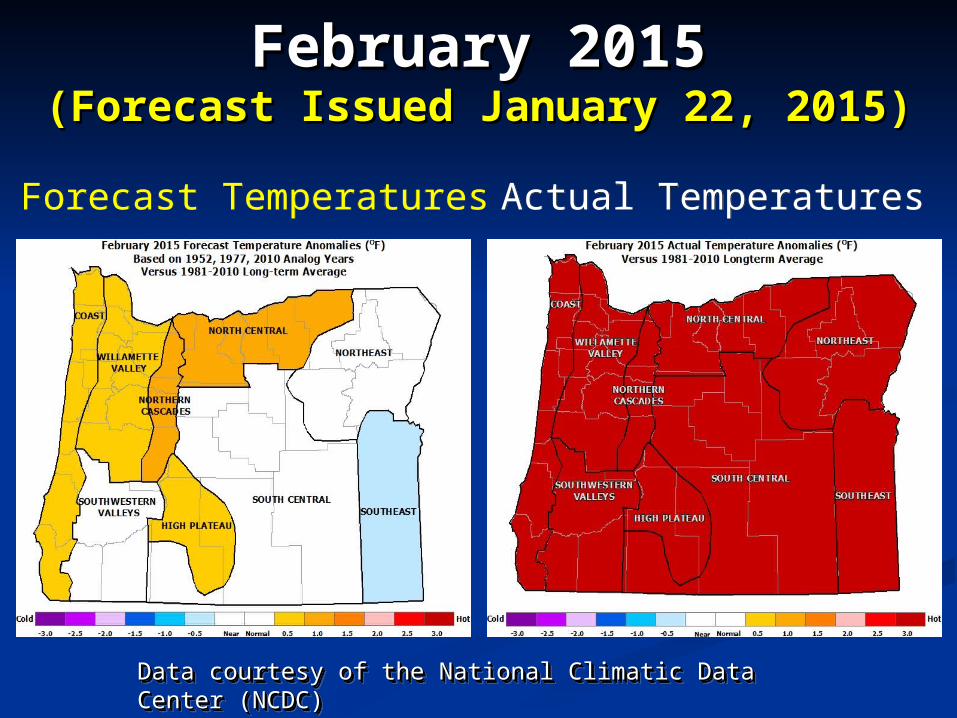
February 2015February 2015(Forecast Issued January 22, 2015)(Forecast Issued January 22, 2015)
Forecast TemperaturesForecast Temperatures Actual TemperaturesActual Temperatures
Data courtesy of the National Climatic Data Center Data courtesy of the National Climatic Data Center (NCDC)(NCDC)Data courtesy of the National Climatic Data Center Data courtesy of the National Climatic Data Center (NCDC)(NCDC)
February 2015February 2015(Forecast Issued January 22, 2015)(Forecast Issued January 22, 2015)
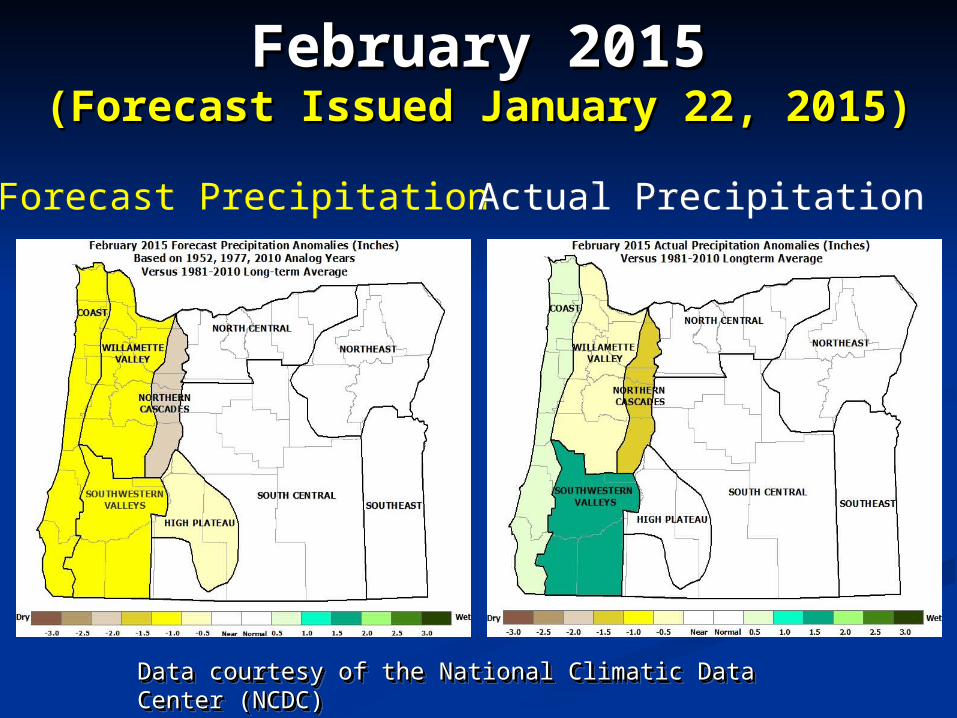
Forecast PrecipitationForecast Precipitation Actual PrecipitationActual Precipitation
Data courtesy of the National Climatic Data Center Data courtesy of the National Climatic Data Center (NCDC)(NCDC)Data courtesy of the National Climatic Data Center Data courtesy of the National Climatic Data Center (NCDC)(NCDC)
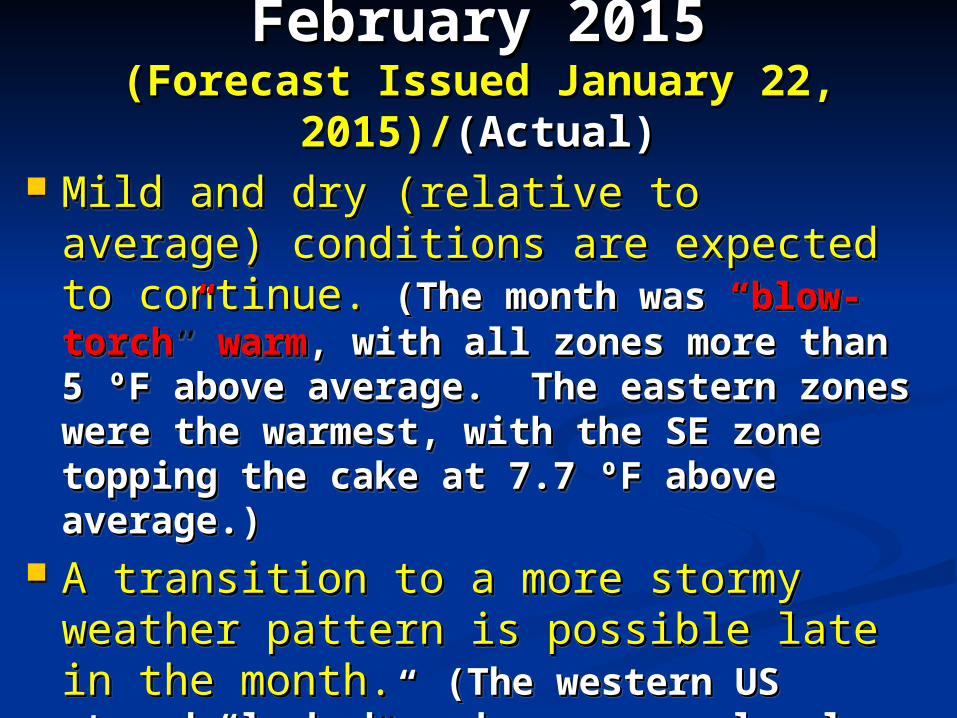
February 2015February 2015(Forecast Issued January 22, (Forecast Issued January 22,
2015)/2015)/(Actual)(Actual) Mild and dry (relative to average) Mild and dry (relative to average)
conditions are expected to continue. conditions are expected to continue. (The month was (The month was ““blow-torchblow-torch”” warm warm, with , with all zones more than 5 ºF above average. all zones more than 5 ºF above average. The eastern zones were the warmest, The eastern zones were the warmest, with the SE zone topping the cake at 7.7 with the SE zone topping the cake at 7.7 ºF above average.)ºF above average.)
A transition to a more stormy weather A transition to a more stormy weather pattern is possible late in the month. pattern is possible late in the month. (The western US stayed (The western US stayed ““lockedlocked”” under under an anomalously strong upper-level ridge an anomalously strong upper-level ridge of high pressure. Mild moisture surges, of high pressure. Mild moisture surges, to start and end the month, kept to start and end the month, kept precipitation totals near average, but precipitation totals near average, but mountain snowfall was dismal.)mountain snowfall was dismal.)
Mild and dry (relative to average) Mild and dry (relative to average) conditions are expected to continue. conditions are expected to continue. (The month was (The month was ““blow-torchblow-torch”” warm warm, with , with all zones more than 5 ºF above average. all zones more than 5 ºF above average. The eastern zones were the warmest, The eastern zones were the warmest, with the SE zone topping the cake at 7.7 with the SE zone topping the cake at 7.7 ºF above average.)ºF above average.)
A transition to a more stormy weather A transition to a more stormy weather pattern is possible late in the month. pattern is possible late in the month. (The western US stayed (The western US stayed ““lockedlocked”” under under an anomalously strong upper-level ridge an anomalously strong upper-level ridge of high pressure. Mild moisture surges, of high pressure. Mild moisture surges, to start and end the month, kept to start and end the month, kept precipitation totals near average, but precipitation totals near average, but mountain snowfall was dismal.)mountain snowfall was dismal.)

March 2015March 2015(Forecast Issued February 19, 2015)(Forecast Issued February 19, 2015)
Forecast TemperaturesForecast Temperatures Actual TemperaturesActual Temperatures
Data courtesy of the National Climatic Data Center Data courtesy of the National Climatic Data Center (NCDC)(NCDC)Data courtesy of the National Climatic Data Center Data courtesy of the National Climatic Data Center (NCDC)(NCDC)
March 2015March 2015(Forecast Issued February 19, 2015)(Forecast Issued February 19, 2015)
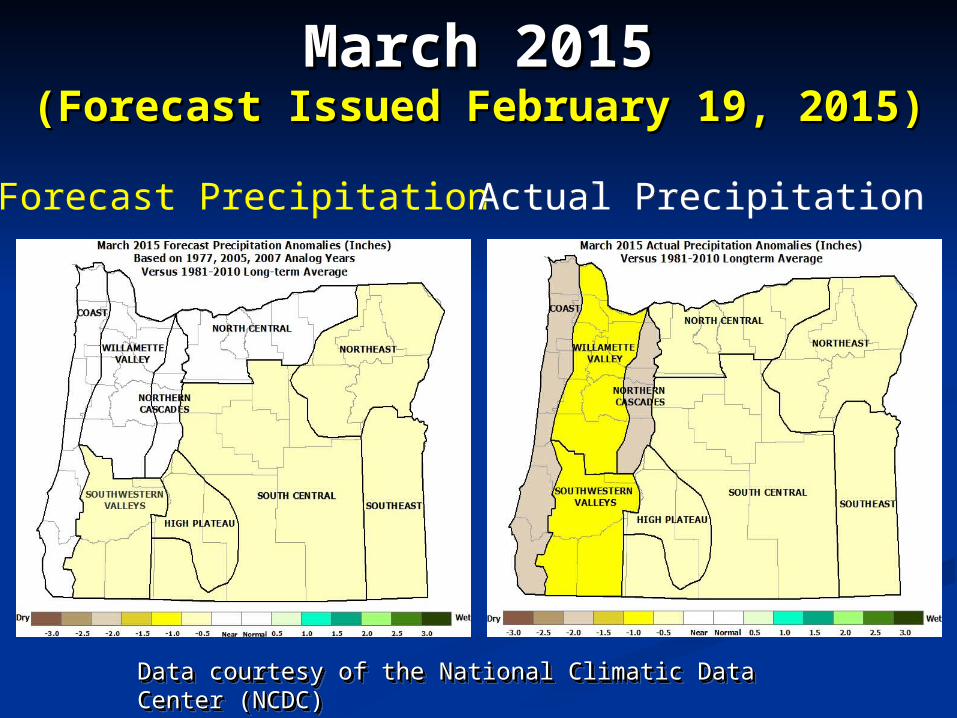
Forecast PrecipitationForecast Precipitation Actual PrecipitationActual Precipitation
Data courtesy of the National Climatic Data Center Data courtesy of the National Climatic Data Center (NCDC)(NCDC)Data courtesy of the National Climatic Data Center Data courtesy of the National Climatic Data Center (NCDC)(NCDC)
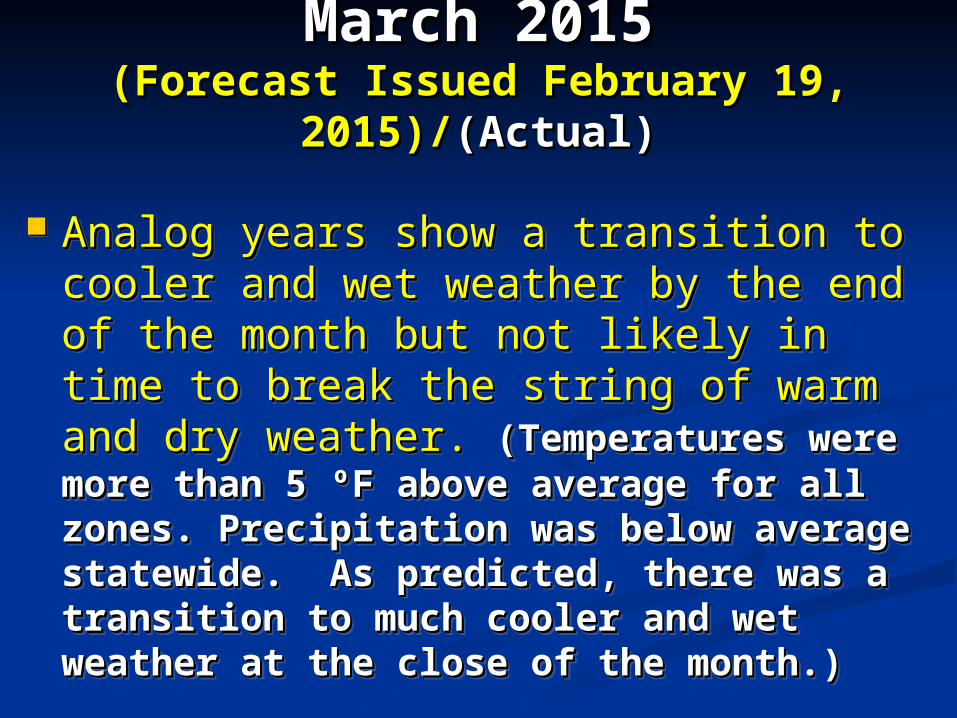
March 2015March 2015(Forecast Issued February 19, (Forecast Issued February 19,
2015)/2015)/(Actual)(Actual)
Analog years show a transition to Analog years show a transition to cooler and wet weather by the end of cooler and wet weather by the end of the month but not likely in time to the month but not likely in time to break the string of warm and dry break the string of warm and dry weather. weather. ((Temperatures were more than Temperatures were more than 5 ºF above average for all zones. 5 ºF above average for all zones. Precipitation was below average Precipitation was below average statewide. As predicted, there was a statewide. As predicted, there was a transition to much cooler and wet transition to much cooler and wet weather at the close of the month.) weather at the close of the month.)
Analog years show a transition to Analog years show a transition to cooler and wet weather by the end of cooler and wet weather by the end of the month but not likely in time to the month but not likely in time to break the string of warm and dry break the string of warm and dry weather. weather. ((Temperatures were more than Temperatures were more than 5 ºF above average for all zones. 5 ºF above average for all zones. Precipitation was below average Precipitation was below average statewide. As predicted, there was a statewide. As predicted, there was a transition to much cooler and wet transition to much cooler and wet weather at the close of the month.) weather at the close of the month.)
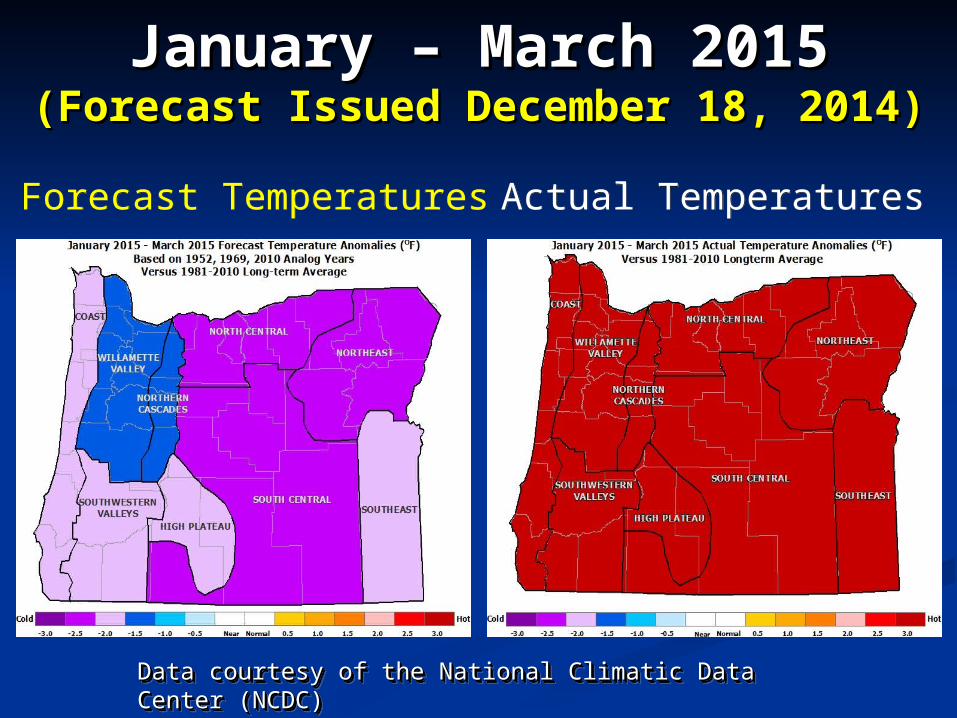
January – March 2015January – March 2015(Forecast Issued December 18, 2014)(Forecast Issued December 18, 2014)
Forecast TemperaturesForecast Temperatures Actual TemperaturesActual Temperatures
Data courtesy of the National Climatic Data Center Data courtesy of the National Climatic Data Center (NCDC)(NCDC)Data courtesy of the National Climatic Data Center Data courtesy of the National Climatic Data Center (NCDC)(NCDC)
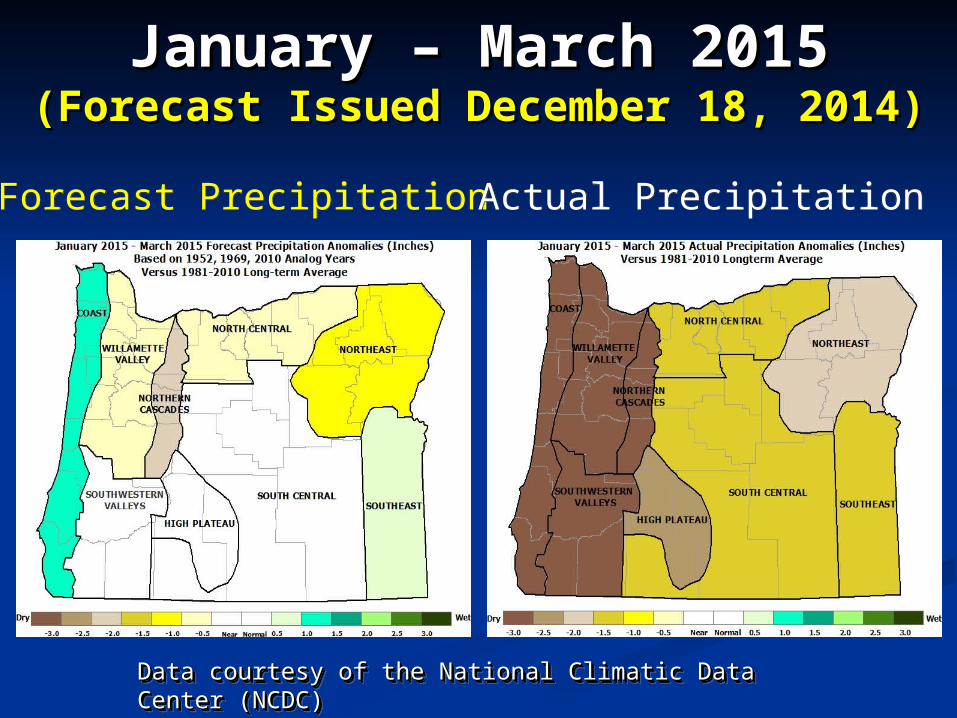
January – March 2015January – March 2015(Forecast Issued December 18, 2014)(Forecast Issued December 18, 2014)
Forecast PrecipitationForecast Precipitation Actual PrecipitationActual Precipitation
Data courtesy of the National Climatic Data Center Data courtesy of the National Climatic Data Center (NCDC)(NCDC)Data courtesy of the National Climatic Data Center Data courtesy of the National Climatic Data Center (NCDC)(NCDC)
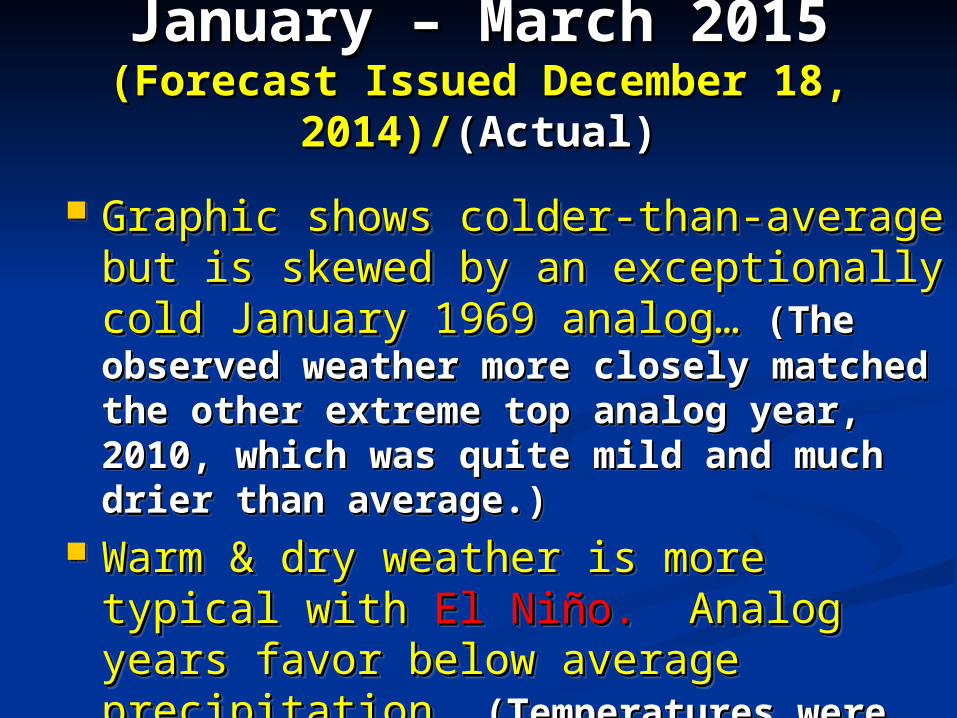
January – March 2015January – March 2015(Forecast Issued December 18, (Forecast Issued December 18,
2014)/2014)/(Actual)(Actual)
Graphic shows colder-than-average but Graphic shows colder-than-average but is skewed by an exceptionally cold is skewed by an exceptionally cold January 1969 analog…January 1969 analog… (The observed (The observed weather more closely matched the other weather more closely matched the other extreme top analog year, 2010, which extreme top analog year, 2010, which was quite mild and much drier than was quite mild and much drier than average.)average.)
Warm & dry weather is more typical Warm & dry weather is more typical with with El Niño. El Niño. Analog years favor below Analog years favor below average precipitation. average precipitation. (Temperatures (Temperatures were more than 5 ºF above average in all were more than 5 ºF above average in all zones and locally zones and locally near the warmest on near the warmest on recordrecord. Precipitation was well-below . Precipitation was well-below average statewide with average statewide with record low record low mountain snowpacks mountain snowpacks in some areasin some areas.).)
Pete Parsons, ODF Meteorologist503-945-7448 [email protected]
Pete Parsons, ODF Meteorologist503-945-7448 [email protected]
Your Feedback is Welcome! Your Feedback is Welcome!
Updated Mid-MonthUpdated Mid-Month