Notch2 controls non-autonomous Wnt-signalling in chronic ...
17
ARTICLE Notch2 controls non-autonomous Wnt-signalling in chronic lymphocytic leukaemia Maurizio Mangolini 1 , Frederik Götte 2 , Andrew Moore 1 , Tim Ammon 2 , Madlen Oelsner 2 , Gloria Lutzny-Geier 3 , Ludger Klein-Hitpass 4 , James C. Williamson 5 , Paul J. Lehner 5 , Jan Dürig 6 , Michael Möllmann 6 , Lívia Rásó-Barnett 7 , Katherine Hughes 8 , Antonella Santoro 1 , Simón Méndez-Ferrer 1,9 , Robert A.J. Oostendorp 2 , Ursula Zimber-Strobl 10 , Christian Peschel 2,11 , Daniel J. Hodson 1 , Marc Schmidt-Supprian 2,11 & Ingo Ringshausen 1 The Wnt signalling pathway, one of the core de-regulated pathways in chronic lymphocytic leukaemia (CLL), is activated in only a subset of patients through somatic mutations. Here we describe alternative, microenvironment-dependent mechanisms of Wnt activation in malig- nant B cells. We show that tumour cells specifically induce Notch2 activity in mesenchymal stromal cells (MSCs) required for the transcription of the complement factor C1q. MSC- derived C1q in turn inhibits Gsk3-β mediated degradation of β-catenin in CLL cells. Addi- tionally, stromal Notch2 activity regulates N-cadherin expression in CLL cells, which interacts with and further stabilises β-catenin. Together, these stroma Notch2-dependent mechanisms induce strong activation of canonical Wnt signalling in CLL cells. Pharmacological inhibition of the Wnt pathway impairs microenvironment-mediated survival of tumour cells. Similarly, inhibition of Notch signalling diminishes survival of stroma-protected CLL cells in vitro and disease engraftment in vivo. Notch2 activation in the microenvironment is a pre-requisite for the activation of canonical Wnt signalling in tumour cells. DOI: 10.1038/s41467-018-06069-5 OPEN 1 Wellcome Trust/ MRC Cambridge Stem Cell Institute & Department of Haematology, University of Cambridge, Cambridge CB2 0AH, UK. 2 Department of Hematology and Medical Oncology, Klinikum rechts der Isar der Technischen Universität München, Munich 81675, Germany. 3 Department of Internal Medicine 5, Haematology and Oncology, Friedrich-Alexander-University Erlangen-Nürnberg, Erlangen 91054, Germany. 4 Institute of Cell Biology, Faculty of Medicine, University of Duisburg-Essen, Essen 45122, Germany. 5 Cambridge Institute for Medical Research (CIMR), University of Cambridge, Cambridge CB2 0XY, UK. 6 Department of Hematology, University Hospital Essen,, University of Duisburg-Essen, Essen 45122, Germany. 7 Haematopathology and Oncology Diagnostic Service (HODS), Cambridge University Hospitals NHS Foundation Trust, Cambridge CB2 0QQ, UK. 8 Department of Veterinary Medicine, University of Cambridge, Cambridge CB3 0ES, UK. 9 NHS Blood and Transplant, Cambridge CB2 0PT, UK. 10 Helmholz Zentrum, Research Unit Gene Vectors, Munich 81377, Germany. 11 German Cancer Consortium, DKFZ, Heidelberg 69120, Germany. These authors contributed equally: Maurizio Mangolini, Frederik Götte. Correspondence and requests for materials should be addressed to I.R. (email: [email protected]) NATURE COMMUNICATIONS | (2018)9:3839 | DOI: 10.1038/s41467-018-06069-5 | www.nature.com/naturecommunications 1 1234567890():,;
Transcript of Notch2 controls non-autonomous Wnt-signalling in chronic ...

ARTICLE
Notch2 controls non-autonomous Wnt-signallingin chronic lymphocytic leukaemiaMaurizio Mangolini1, Frederik Götte2, Andrew Moore 1, Tim Ammon2, Madlen Oelsner2,
Gloria Lutzny-Geier 3, Ludger Klein-Hitpass4, James C. Williamson5, Paul J. Lehner5, Jan Dürig6,
Michael Möllmann6, Lívia Rásó-Barnett7, Katherine Hughes 8, Antonella Santoro1, Simón Méndez-Ferrer 1,9,
Robert A.J. Oostendorp 2, Ursula Zimber-Strobl10, Christian Peschel2,11, Daniel J. Hodson1,
Marc Schmidt-Supprian2,11 & Ingo Ringshausen 1
The Wnt signalling pathway, one of the core de-regulated pathways in chronic lymphocytic
leukaemia (CLL), is activated in only a subset of patients through somatic mutations. Here we
describe alternative, microenvironment-dependent mechanisms of Wnt activation in malig-
nant B cells. We show that tumour cells specifically induce Notch2 activity in mesenchymal
stromal cells (MSCs) required for the transcription of the complement factor C1q. MSC-
derived C1q in turn inhibits Gsk3-β mediated degradation of β-catenin in CLL cells. Addi-
tionally, stromal Notch2 activity regulates N-cadherin expression in CLL cells, which interacts
with and further stabilises β-catenin. Together, these stroma Notch2-dependent mechanisms
induce strong activation of canonical Wnt signalling in CLL cells. Pharmacological inhibition of
the Wnt pathway impairs microenvironment-mediated survival of tumour cells. Similarly,
inhibition of Notch signalling diminishes survival of stroma-protected CLL cells in vitro and
disease engraftment in vivo. Notch2 activation in the microenvironment is a pre-requisite for
the activation of canonical Wnt signalling in tumour cells.
DOI: 10.1038/s41467-018-06069-5 OPEN
1Wellcome Trust/ MRC Cambridge Stem Cell Institute & Department of Haematology, University of Cambridge, Cambridge CB2 0AH, UK. 2Department ofHematology and Medical Oncology, Klinikum rechts der Isar der Technischen Universität München, Munich 81675, Germany. 3 Department of InternalMedicine 5, Haematology and Oncology, Friedrich-Alexander-University Erlangen-Nürnberg, Erlangen 91054, Germany. 4 Institute of Cell Biology, Faculty ofMedicine, University of Duisburg-Essen, Essen 45122, Germany. 5 Cambridge Institute for Medical Research (CIMR), University of Cambridge, CambridgeCB2 0XY, UK. 6 Department of Hematology, University Hospital Essen,, University of Duisburg-Essen, Essen 45122, Germany. 7 Haematopathology andOncology Diagnostic Service (HODS), Cambridge University Hospitals NHS Foundation Trust, Cambridge CB2 0QQ, UK. 8 Department of VeterinaryMedicine, University of Cambridge, Cambridge CB3 0ES, UK. 9 NHS Blood and Transplant, Cambridge CB2 0PT, UK. 10 Helmholz Zentrum, Research UnitGene Vectors, Munich 81377, Germany. 11 German Cancer Consortium, DKFZ, Heidelberg 69120, Germany. These authors contributed equally: MaurizioMangolini, Frederik Götte. Correspondence and requests for materials should be addressed to I.R. (email: [email protected])
NATURE COMMUNICATIONS | (2018) 9:3839 | DOI: 10.1038/s41467-018-06069-5 | www.nature.com/naturecommunications 1
1234
5678
90():,;

In recent years, the landscape of genomic mutations in chroniclymphocytic leukaemia (CLL) has become significantly morecomplex, now allowing the identification of very small sub-
clones1–3. These mutations cluster in key cellular pathways reg-ulating response to DNA damage, inflammation, chromatinremodelling and RNA processing4. In addition, somatic muta-tions affecting the highly conserved Wnt signalling pathway werereported to be present in a subset of CLL patients5. The expres-sion of the key transcriptional factor β-catenin is tightly regulatedthrough post-translational mechanisms. Functional in vitro stu-dies demonstrated that the survival of leukaemic B cells is indeeddependent on the Wnt pathway, particularly in patients carryingthese mutations5,6. In vivo evidence for the significance of theWnt pathway originate from studies in the Tcl1 model, demon-strating that the deletion of the Wnt receptor Fzd6 significantlydelays tumourigenesis7.
In spite of the success in deciphering the genomic complexityof CLL, no universal drivers of the disease have been identified.Instead, the emerging picture of the pathogenesis of CLL is thatthese mutations operate in conjunction with tumourigenic cuesfrom the microenvironment8,9. In this sense, malignant B cells donot survive nor proliferate autonomously, but these aspects oflymphomagenesis are co-dependent on bystander cells of themicroenvironment. Among these, bone marrow-derivedmesenchymal stromal cells (BMSCs) play a central role in pro-viding pro-survival factors for CLL cells. Work from many groupsdemonstrated that BMSCs regulate various biological processes inleukaemic B cells, including metabolic changes10,11, alterations inthe expression of surface12,13 and anti-apoptotic proteins14,thereby contributing to drug resistance15. Notably, the commu-nication between CLL cells and BMSCs is bi-directional, alsoresulting in morphological and transcriptional changes in stromalcells16. Here we describe a signalling pathway underlying themutual activation of BMSCs and tumour cells, which depends onthe CLL-mediated activation of Notch2 in stromal cells, and thereciprocal activation of the canonical Wnt pathway in CLL cells.
ResultsMSCs induce gene expression reprogramming in CLL cells.CLL is characterised by an enormously diverse spectrum ofdisease-associated mutations. Correspondingly, the fitness of cellscannot solely be maintained by cell-intrinsic signals, but isexquisitely dependent on cues provided by the tumour micro-environment. We previously established a co-culture system toinvestigate the heterotypic interactions between stromal cells andprimary CLL cells16. EL08-1D2 cells are primary stromal cellsderived from mouse embryonic (E11) livers supporting humanhaematopoietic stem cell (HSC) activity17. To assess to whatextent mesenchymal stromal cells can influence the biology ofCLL cells, we performed deep RNA sequencing on purified CLLcells, obtained from 6 individual untreated patients, cultured onEL08-1D2 cells for 48 h. Stringent filtering was applied by con-sidering only those significant genes (uncorrected p < 0.05), whichshowed raw reads >20 in ≥ 4 samples. Comparison of theseresults to RNA-sequencing (RNA-seq) data from the respectivemono-culture in the absence of stromal cells showed an up-regulation of 2268 genes (>2-fold) and a down-regulation of 1076genes (>2-fold; Fig. 1a). Subjecting this transcriptomic data toGene Set Enrichment Analysis (GSEA) identified transcriptionalchanges in gene sets involved in cell adhesion, cell metabolismand signalling (Fig. 1b and Supplementary Figure 1a,b and 2a).Figure 1c depicts a heat map of the 50 most significantly up- anddown-regulated genes. Notably, among those induced, genesaffecting remodelling of the microenvironment are highly over-represented. To investigate which signalling pathways in CLL
cells mediate these transcriptional changes, we performed amultiplex immunoblot assay from CLL cells, co-cultured for 6 hon EL08-1D2 cells or mono-cultured. Results from this experi-ment indicate that BAD, PRAS40 and glycogen synthase kinase 3-β (GSK3-β) were phosphorylated by direct contact to stromalcells (Fig. 1d; to facilitate reading, throughout the figures, proteinsdetected in B cells are labelled in blue, stromal cell-derived pro-teins in black). As these proteins are known targets of AKT, ourfindings are in line with data suggesting that contact to stromalcells triggers a pro-survival signal via phosphatidylinositol-3-kinase and AKT in CLL cells18. In contrast to HSCs19, the pro-vision of pro-survival effects of EL08-1D2 cells on primary CLLcells requires a direct cell–cell contact, as disruption of this directcell interaction abolishes anti-apoptotic signals to CLL cells(Fig. 1e and Supplementary Figure 2b, Supplementary Figure 11ashows the gating strategy used to detect live and apoptotic CLLcells). This demonstrates that some of the most important signalsfrom the stroma to CLL cells cannot be transmitted by solublefactors but rely on direct cellular interactions.
CLL cells activate Notch2 signalling in BMSCs. Notably, asshown previously20,16, CLL cells are able to receive anti-apoptoticsignals from numerous different mouse and human mesenchymalcells, suggesting that this cell–cell communication is based onevolutionary highly conserved signalling principles. Since theNotch pathway constitutes such an ancient signalling pathway, weinvestigated whether the crosstalk between BMSCs and CLL cellsinvolves Notch signalling. Firstly, we assessed the expression ofNotch ligands on primary CLL cells. In agreement with a previousreport21, CLL cells constitutively express the Notch ligands Jag-ged-1, Jagged-2 and Delta (DLL) (Fig. 2a and SupplementaryFigure 3a). On the opposing EL08-1D2 cells, Notch1 and Notch2had by far the highest surface expression (Fig. 2b). This expressionprofile was very similar in cultured primary mouse BMSCs(Supplementary Figure 3b). To exclude the possibility that Notchexpression was related to in vitro propagation of BMSCs, weinvestigated Notch expression in BMSCs from 10-week-old Nes-tinGFP mice, which express green fluorescent protein (GFP) in asubset of BMSCs with colony-forming unit fibroblastic capacity22.We observed Notch1 and Notch2 expression in NestinGFP-MSCs,endothelial cells and osteoblasts, although expression levels weresignificantly lower than on in vitro cultured BMSCs (Supple-mentary Figure 3c; Supplementary Figure 11b shows the gatingstrategy used to detect various BMSC populations). The presenceof Notch ligands on CLL cells and receptors on BMSCs suggestedthat CLL could activate Notch signalling in stromal cells. SinceNotch3 and Notch4 lack a classical transactivation domain andwere only expressed at comparatively low levels on EL08-1D2cells, we focussed on the function of Notch1 and Notch2. Uponbinding of Notch ligands, two consecutive proteolytic cleavagesrelease the Notch intracellular domain (ICD), which then acts as atranscription factor by interacting with the DNA binding proteinCSL. Surprisingly, although Notch1 was expressed on EL08-1D2cells in mono-culture, cleaved Notch1 levels significantlydecreased after contact to primary CLL cells (Fig. 2c). In contrast,cleaved Notch2 levels increased in EL08-1D2 cells and primaryhuman BMSCs following activation by CLL cells (Fig. 2d, e andSupplementary Figures 4a,b). In line with this observation, nuclearNotch2 levels became more abundant in BMSCs co-cultured withCLL cells (Fig. 2f). The up-regulation of total Notch2 in BMSCswas abrogated by the presence of a gamma-secretase inhibitor(Fig. 2g). No activation of Notch3 or Notch4 was detected in CLL-activated stromal cells (Supplementary Figure 4c). These data in-dicate that malignant B cells specifically activate Notch2 signallingin BMSCs.
ARTICLE NATURE COMMUNICATIONS | DOI: 10.1038/s41467-018-06069-5
2 NATURE COMMUNICATIONS | (2018) 9:3839 | DOI: 10.1038/s41467-018-06069-5 | www.nature.com/naturecommunications

a
Up regulatedgenes (>2-fold)
Down regulatedgenes (<2-fold)
MetabolismAdhesionSignaling
p = 0.01321 genes
p = 0.05755 genes
1536 genes
732 genes
d
6 h mono-culture 6 h on EL08-1D2
abcdefg
BAD (Ser112)
PRAS40 (Thr246)
GSK3-β (Ser9)– +
––++
20
40
60
80
100
% A
popt
otic
CLL
cel
ls
****p =0.64
e
c
>4× mean <0.25× mean
Mono-culture
CLL
-01
CLL
-02
CLL
-03
CLL
-04
CLL
-05
CLL
-06
CLL
-01
CLL
-02
CLL
-03
CLL
-04
CLL
-05
CLL
-06
On EL08-1D2
Fol
d-ch
ange
COL1A2 COL3A2 RNASE1 GPNMB MMP9 EFEMP1 FN1 CRABP1 MS4A4A POTEF HOXC6 PRRX1 FOXG1 BGN MEIS1 WLS FPR3 NR2F2 RORB ADGRL2 FBN1 COL4A5 SPP1 CDH2 MTRNR2L10 TFAP2A COL1A1 DAB2 RND3 MMP2 NFIB MEIS2 POTEI MMP16 CREB3L1 MECOM LOXL1 RBFOX2 NRP1 PBX1 LOX STAB1 SPARC HOXC10 NCKAP1 CADM1 CP GULP1 TUSC3 CAMK1 PPP1R15A JUNB DUSP4 RGCC CDKN1A ZNF165 CRIP1 LOC102724428 FOXJ1 ENDOU RAB36 TSC22D3 GPR176 CRIP2 ZNF331 ARL4A NIPAL4 CNIH2 FUT5 TPPP NR4A1 RRP12 MAPK8IP1 CFAP45 FAM222A PPIL6 KIF18A JUN AGPAT4-IT1 DUSP8 ATF3 LOC100294362 FER1L4 EGR4 MIR22HG NR4A3 MYADM CCDC173 ARG2 NR4A2 GRASP LOC284454 LMNA DUSP1 KLF4 FOXO6 ODF3L1 FOS MAK FOSB
REACTOME_PURINE_METABOLISM
GO_CELLULAR_LIPID_CATABOLIC_PROCESS
KEGG_FATTY_ACID_METABOLISM
HALLMARK_FATTY_ACID_METABOLISM
REACTOME_METABOLSIM_OF_NUCLEOTIDES
KEGG_PURIN_METABOLISM
KEGG_PHOSPHATIDYLINOSITOL_SIGNALING_SYSTEM
KEGG_REGULATION_OF_ACTIN_CYTOSKELETON
REACTOME_GLUCOSE_METABOLISM
KEGG_LEUKOCYTE_TRANSENDOTHELIAL_MIGRATION
HALLMARK_APICAL_JUNCTION
HALLMARK_GLYCOLYSIS
HALLMARK_PI3K_AKT_MTOR_SIGNALLING
0.0 0.5 1.0 1.5 2.0
0.0 0.1 0.2 0.3
Normalised enrichment score(NES)
b
[q - value]
61 2 3 4 561 2 3 4 5
EL08-1D2 Transwell
9
8
7
6
5
4
3
2
–Log
10 (
p-v
alue
)
–Log2 (fold change)
1
010 5 0 5 10
Fig. 1 Activation of CLL cells by BSMCs. a Volcano plot showing the differentially up- and down-regulated genes in CLL cells after 48 h of co-culture onEL08-1D2 cells compared to cells cultured for 4 h in mono-culture (4 h was chosen to avoid gene expression changes related to cell death). RNA-sequencing was performed on samples from 6 individual patients. b Transcriptomic data were subjected to Gene Set Enrichment (GSEA) analyses toidentify pathways in CLL activated by contact to stromal cells. Gene sets are listed in order of Normalised Enrichment Scores (top black X-axis). FDR qvalues for each gene set are indicated by the red dotted line (lower red X-axis). c Heat map showing the 50 most significantly up- and down-regulatedgenes in CLL cells in response to contact with stromal cells. d Cell extracts from CLL mono-culture or from cells cultured for 6 h on EL08-1D2 cells wereanalysed using a human intracellular phosphorylation antibody array. Representative results from four different patients and experiments are shown. e CLLcells were cultured in medium only (red circles) or on EL08-1D2 cells (black squares) for 5 days before analysing apoptotic cells by Annexin-V/PI staining.Transwells were used to disrupt direct cell–cell contacts (blue triangles). Error bars show mean ± SEM from 9 patients;****p < 0.0001
NATURE COMMUNICATIONS | DOI: 10.1038/s41467-018-06069-5 ARTICLE
NATURE COMMUNICATIONS | (2018) 9:3839 | DOI: 10.1038/s41467-018-06069-5 | www.nature.com/naturecommunications 3

f
a b
Notch-receptor expression on EL08-1D2
Notch1-APCIsotype Ab
100
80
60
40
20
0
Notch2-PE100
80
60
40
20
0
100
80
60
40
20
0
Notch3-APC
Notch4100
80
60
40
20
0
Notch4-PE0–103 103 104 0–103 103 104 0–103 103 104
0–103 103 104
0–103 103 104 0–103 103 104
0–103 103 1040
20
40
60
80
100
0
20
40
60
80
100
0
20
40
60
80
100Jagged-1-PE
Isotype Ab
Jagged-2-PE DLL1-PE
Notch-ligand expression on CLL cells
MergedDAPI Notch2
EL0
8-1D
2m
ono-
cultu
reE
L08-
1D2
+ C
LLco
-cul
ture
E
L08-
1D2
+ C
LLco
-cul
ture
+ D
AP
T
d
CleavedNotch2
Actin
CLL
EL08-1D2
100 -
45 -
kDa
–
CLL
-10
CLL
-11
CLL
-12
CLL
-13
+ + + +
–
CLL
-10
CLL
-11
CLL
-12
CLL
-13
+ + + +
–
CLL
-17
CLL
-18
CLL
-19
CLL
-20
+ + + +
CLL
c
CleavedNotch1
Actin
EL08-1D2
100 -
45 -
kDa
CleavedNotch2
Actin
Human BMSCs
CLL
e
kDa
100 -
45 -
DAPI
EL0
8-1D
2m
ono-
cultu
reE
L08-
1D2
+ C
LLco
-cul
ture
g
315 X
Notch2
Fig. 2 CLL cells activate Notch2 in BMSCs. a Constitutive expression of the Notch ligands Delta-1, Jagged-1 and Jagged-2 was analysed in primary CLL cellsby flow cytometry. Representative results from three different patients are shown. b Constitutive expression of Notch1-4 in primary EL08-1D2 cells wasassessed by flow cytometry. Two separate experiments revealed identical results. c Notch1 activity in EL08-1D2 cells was assessed by immunoblotting forNotch1ICD 48 h after co-culturing primary CLL cells from 4 different patients on stromal cells. d Notch2 activity in EL08-1D2 cells was assessed byimmunoblotting for Notch2ICD 48 h after co-culturing primary CLL cells from the same 4 patients as shown in (c). e Notch2ICD levels were analysed bywestern blotting in human bone marrow stromal-derived cells and human bone marrow stromal-derived cells co-cultured with CLL primary cells. f Confocalmicroscopy analysis of Notch2 expression in EL08-1D2 following 48 h co-culture with primary CLL cells or mono-culture. Images were captured withidentical exposure time and settings between mono-cultures and co-cultures. Representative images from three independent experiments are shown.g Notch2 expression on EL08-1D2 cells was assessed on mono-cultured cells or on cells which were co-cultured for 48 h in the absence or presence of20uM DAPT. Scale bar= 100 μm. One representative experiment out of three is shown
ARTICLE NATURE COMMUNICATIONS | DOI: 10.1038/s41467-018-06069-5
4 NATURE COMMUNICATIONS | (2018) 9:3839 | DOI: 10.1038/s41467-018-06069-5 | www.nature.com/naturecommunications
Notch2 regulates distinct gene sets in activated BMSCs. To gaininsights into the transcriptional program orchestrated by Notch2,we generated Notch2-deficient BMSC from Notch2 conditionalknockout (Notch2fl/fl) mice23 and ablated Notch2 by treatmentwith Cre protein (HTNC) (Fig. 3a). Successful ablation of Notch2protein was confirmed by flow cytometry and western blotting(Fig. 3b). Subsequently primary CLL cells were cultured onNotch2-proficient and -deficient confluent monolayers of BMSCs.After 5 days, RNA was isolated from purified stromal cells andgene expression profiles were assessed using the AffymetrixGeneChip platform. Unsupervised analyses of transcriptomesusing principle component analysis indicate that Notch2 con-stitutively regulates genes in BMSCs in the absence of CLL cells(Fig. 3c, compare light blue to orange clusters; enriched genes setsare presented in Supplementary Figure 5a). However, activationof stromal cells by direct contact to malignant B cells inducessignificant Notch2-dependent changes in their gene expressionprofiles (Fig. 3c, red and dark blue clusters). Functional enrich-ment analyses of transcriptomes from CLL co-cultured stromalcells confirmed a Notch gene expression signature present inNotch2fl/fl cells (Fig. 3d and Supplementary Figure 5b). In addi-tion, Notch2 regulates genes involved in inflammation andextracellular matrix formation, both important components ofthe CLL microenvironment (Fig. 3d). After applying an arbitrarycut-off of twofold and a false discovery rate (FDR) of <0.01, weidentified 76 annotated genes induced and 155 repressed (Sup-plementary data 1 and 2) in BMSCs by Notch2. Only after contactto CLL cells, 88 and 74% of the respective gene sets were regu-lated (Fig. 3e). The heat map in Fig. 3f depicts the genes that weremost strongly up- or down-regulated in Notch2-deficient andCLL-activated BMSCs. We then subjected consistently alteredtarget probe sets to overrepresentation analysis using the Gene-Trail software and found significant enrichments for the geneontology (GO) terms regulation of cell adhesion (p= 0.0007) andintegrin-binding (p= 0.002). Notably, these analyses also identi-fied Wnt-protein binding (p= 0.029) as a gene cluster regulatedby Notch2. Genes with known functions in these pathways or inCLL biology are listed in order of their degree of regulation byNotch2 (Fig. 3f, right panel).
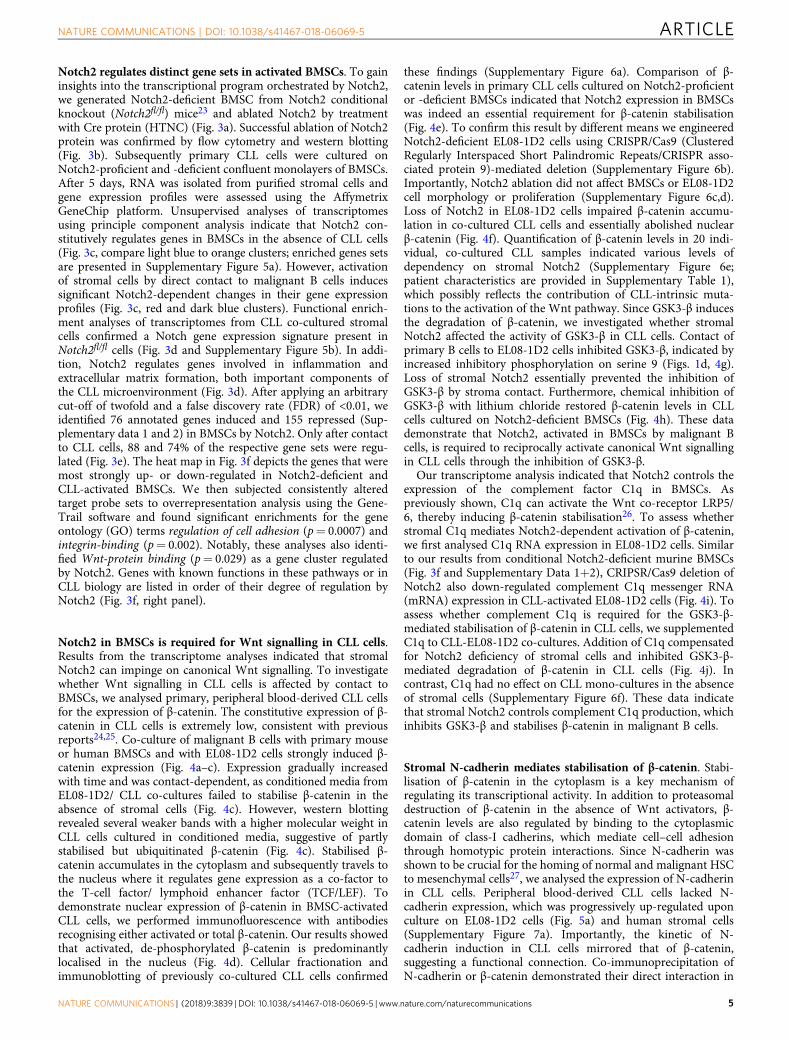
Notch2 in BMSCs is required for Wnt signalling in CLL cells.Results from the transcriptome analyses indicated that stromalNotch2 can impinge on canonical Wnt signalling. To investigatewhether Wnt signalling in CLL cells is affected by contact toBMSCs, we analysed primary, peripheral blood-derived CLL cellsfor the expression of β-catenin. The constitutive expression of β-catenin in CLL cells is extremely low, consistent with previousreports24,25. Co-culture of malignant B cells with primary mouseor human BMSCs and with EL08-1D2 cells strongly induced β-catenin expression (Fig. 4a–c). Expression gradually increasedwith time and was contact-dependent, as conditioned media fromEL08-1D2/ CLL co-cultures failed to stabilise β-catenin in theabsence of stromal cells (Fig. 4c). However, western blottingrevealed several weaker bands with a higher molecular weight inCLL cells cultured in conditioned media, suggestive of partlystabilised but ubiquitinated β-catenin (Fig. 4c). Stabilised β-catenin accumulates in the cytoplasm and subsequently travels tothe nucleus where it regulates gene expression as a co-factor tothe T-cell factor/ lymphoid enhancer factor (TCF/LEF). Todemonstrate nuclear expression of β-catenin in BMSC-activatedCLL cells, we performed immunofluorescence with antibodiesrecognising either activated or total β-catenin. Our results showedthat activated, de-phosphorylated β-catenin is predominantlylocalised in the nucleus (Fig. 4d). Cellular fractionation andimmunoblotting of previously co-cultured CLL cells confirmed
these findings (Supplementary Figure 6a). Comparison of β-catenin levels in primary CLL cells cultured on Notch2-proficientor -deficient BMSCs indicated that Notch2 expression in BMSCswas indeed an essential requirement for β-catenin stabilisation(Fig. 4e). To confirm this result by different means we engineeredNotch2-deficient EL08-1D2 cells using CRISPR/Cas9 (ClusteredRegularly Interspaced Short Palindromic Repeats/CRISPR asso-ciated protein 9)-mediated deletion (Supplementary Figure 6b).Importantly, Notch2 ablation did not affect BMSCs or EL08-1D2cell morphology or proliferation (Supplementary Figure 6c,d).Loss of Notch2 in EL08-1D2 cells impaired β-catenin accumu-lation in co-cultured CLL cells and essentially abolished nuclearβ-catenin (Fig. 4f). Quantification of β-catenin levels in 20 indi-vidual, co-cultured CLL samples indicated various levels ofdependency on stromal Notch2 (Supplementary Figure 6e;patient characteristics are provided in Supplementary Table 1),which possibly reflects the contribution of CLL-intrinsic muta-tions to the activation of the Wnt pathway. Since GSK3-β inducesthe degradation of β-catenin, we investigated whether stromalNotch2 affected the activity of GSK3-β in CLL cells. Contact ofprimary B cells to EL08-1D2 cells inhibited GSK3-β, indicated byincreased inhibitory phosphorylation on serine 9 (Figs. 1d, 4g).Loss of stromal Notch2 essentially prevented the inhibition ofGSK3-β by stroma contact. Furthermore, chemical inhibition ofGSK3-β with lithium chloride restored β-catenin levels in CLLcells cultured on Notch2-deficient BMSCs (Fig. 4h). These datademonstrate that Notch2, activated in BMSCs by malignant Bcells, is required to reciprocally activate canonical Wnt signallingin CLL cells through the inhibition of GSK3-β.
Our transcriptome analysis indicated that Notch2 controls theexpression of the complement factor C1q in BMSCs. Aspreviously shown, C1q can activate the Wnt co-receptor LRP5/6, thereby inducing β-catenin stabilisation26. To assess whetherstromal C1q mediates Notch2-dependent activation of β-catenin,we first analysed C1q RNA expression in EL08-1D2 cells. Similarto our results from conditional Notch2-deficient murine BMSCs(Fig. 3f and Supplementary Data 1+2), CRIPSR/Cas9 deletion ofNotch2 also down-regulated complement C1q messenger RNA(mRNA) expression in CLL-activated EL08-1D2 cells (Fig. 4i). Toassess whether complement C1q is required for the GSK3-β-mediated stabilisation of β-catenin in CLL cells, we supplementedC1q to CLL-EL08-1D2 co-cultures. Addition of C1q compensatedfor Notch2 deficiency of stromal cells and inhibited GSK3-β-mediated degradation of β-catenin in CLL cells (Fig. 4j). Incontrast, C1q had no effect on CLL mono-cultures in the absenceof stromal cells (Supplementary Figure 6f). These data indicatethat stromal Notch2 controls complement C1q production, whichinhibits GSK3-β and stabilises β-catenin in malignant B cells.
Stromal N-cadherin mediates stabilisation of β-catenin. Stabi-lisation of β-catenin in the cytoplasm is a key mechanism ofregulating its transcriptional activity. In addition to proteasomaldestruction of β-catenin in the absence of Wnt activators, β-catenin levels are also regulated by binding to the cytoplasmicdomain of class-I cadherins, which mediate cell–cell adhesionthrough homotypic protein interactions. Since N-cadherin wasshown to be crucial for the homing of normal and malignant HSCto mesenchymal cells27, we analysed the expression of N-cadherinin CLL cells. Peripheral blood-derived CLL cells lacked N-cadherin expression, which was progressively up-regulated uponculture on EL08-1D2 cells (Fig. 5a) and human stromal cells(Supplementary Figure 7a). Importantly, the kinetic of N-cadherin induction in CLL cells mirrored that of β-catenin,suggesting a functional connection. Co-immunoprecipitation ofN-cadherin or β-catenin demonstrated their direct interaction in
NATURE COMMUNICATIONS | DOI: 10.1038/s41467-018-06069-5 ARTICLE
NATURE COMMUNICATIONS | (2018) 9:3839 | DOI: 10.1038/s41467-018-06069-5 | www.nature.com/naturecommunications 5

c
a
mBMSC Notch2fl/fl
+HTNC
CD19 beads
b
Notch2 (PE)
+HTNC–HTNC
– + HTNC
Notch2
Actin
Also induced in the absence of CLL
Repressed in the absence of CLL
Also repressed in the absence of CLL
Induced in the absence of CLL
114
36
5
67
36
Notch2-repressed genes(FDR < 0.01; fold change ≥2 )
2.2 * 10–7
2.5 * 10–6
3.6 * 10–4
9.4 *10–4
1.1 * 10–4
2.0 * 10–6
3.4 * 10–5
1.1 * 10–4
1.5 * 10–4
9.4 * 10–5
1.0 * 10–6
3.5 * 10–7
5.7 * 10–9
2.7 * 10–8
1.2 * 10–3
8.8 * 10–5
2.2 * 10–5
5.3 * 10–4
3.0 * 10–4
1.0 * 10–4
2.2 * 10–4
2.8 * 10–4
5.8 * 10–4
6.8 * 10–5
6.2 * 10–6
fC
LL-2
1
CLL
-22
CLL
-23
CLL
-24
CLL
-25
CLL
-26
CLL
-21
CLL
-22
CLL
-23
CLL
-24
CLL
-25
CLL
-26
Notch2fl/fl Notch2–/–
Notch 1Sfrp2C1qbC1qaCcl5Dmp1ItgalFmodNfkbidC1qa
Gene
3.0 * 10–5
3.3 * 10–5
3.4 * 10–4
1.3 * 10–3
1.1 * 10–3
3.8 * 10–6
2.0 * 10–5
1.4 * 10–3
6.3 * 10–7
6.0 * 10–5
Ccl9Ccr2Grem1Fbln7Cdh13Epsti1Wif1Ltbp1Vnn1SelpKitlFgf7Timp2Ccr5Il33Tgfbr2PdgfdFbln1Cadm2Mmp13Sfrp4Apol9a/bApodLeprLum
p -value
Fol
d-ch
ange
e
d
>4× mean<0.25× mean
Affymetrix GEPCLL
PCA (48.5%)
100
8
54
–37
–83
–130
–173
Notch2–/– BMSC
Affymetrix GEP100
80
60
40
20
0S
eki_
infla
mm
ator
y_re
spon
se_l
ps_u
p
Che
mok
ine_
rece
ptor
_bin
ding
Keg
g_no
tch_
sign
alin
g_pa
thw
ay
Rea
ctom
e_co
llage
n_fo
rmat
ion
Rea
ctom
e_m
yd88
_mal
_cas
cade
Keg
g_no
tch_
sign
alin
g_pa
thw
ay
Rea
ctom
e_si
gnal
ing_
by_n
otch
1
Hal
lmar
k_in
flam
mat
ory
resp
onse
Inte
grin
_bin
ding
Hal
lmar
k_no
tch_
sign
allin
g
Hal
lmar
k_w
nt_b
eta_
cate
nin_
sign
allin
g
Hal
lmar
k_pi
3k_a
kt_m
tor_
sign
allin
g
Keg
g_gl
ycol
ysis
_glu
cone
ogen
esis
Hal
lmar
k_hy
poxi
a
3
2
1
0
–1
–2
–3 –0.4
–0.3
–0.2
–0.1
0.0
0.1
0.2
0.3
0.4
Nor
mal
ised
enr
ichm
ent s
core
(NE
S)
q -value
45
kDa
mBMSC Notch2–/–
100 101 102 103 104
100
Notch2 fl/fl
mBMSCs
PC
#2 (
9.76
%)
PC#1 (38.7%)
–101 –30 42 114
Notch2fl/fl BMSC
Notch2fl/fl BMSC+ CLL
Notch2–/– BMSC+ CLL
Notch2-induced genes(FDR < 0.01; fold change ≥2 )
Fig. 3 Notch2 gene regulation in BMSCs. a Schematic representation of the experimental model. b Flow cytometry and immunoblot analyses of Notch2 inNotchfl/fl stromal cells following in vitro CRE recombination. c Principal component analyses of the transcriptomes from three Notch2-proficient (orangecircles) and Notch2-deficient (light blue circles) BMSCs and from five Notch2 wild-type (red circles) or knockout (dark blue) BMSCs cultured with CLLcells for 5 days. d GSEA comparing the expression of genes associated with the presence or absence of Notch2 expression in BMSCs co-cultured withprimary CLL cells. Gene sets are listed in order of Normalised Enrichment Scores (left black Y-axis). FDR q values for each gene set are indicated by the reddotted line (right red Y-axis). e Pie-chart of Notch2-induced (left) and Notch2-repressed genes (right). f Heat map showing the 200 most significantly up-and down-regulated genes in Notch2-deficient BMSCs in response to contact with CLL cells. Genes listed in red have known functions in regulating Wntsignalling
ARTICLE NATURE COMMUNICATIONS | DOI: 10.1038/s41467-018-06069-5
6 NATURE COMMUNICATIONS | (2018) 9:3839 | DOI: 10.1038/s41467-018-06069-5 | www.nature.com/naturecommunications

CLL cells (Fig. 5b and Supplementary Figure 7b). In contrast to β-catenin, N-cadherin levels were transcriptionally regulated in CLLcells (Fig. 5c). In order to address whether homotypic N-cadherininteractions between CLL cells and BMSCs were required tostabilise β-catenin, we generated N-cadherin-deficient stromal
cells. Depletion of N-cadherin from EL08-1D2 cells did not affecttheir baseline expression of Notch2 (Fig. 5d). Of note, loss of N-cadherin also did not affect expression levels of E-cadherin(Supplementary Figure 7c). However, N-cadherin-deficient stro-mal cells failed to induce N-cadherin expression in primary CLL
ca
– + mBMSCs
β-catenin
Actin
d
Actin
HTNC
24 h 48 h 24 h 48 h
–– – –
++
+ – EL08-1D2
Supernatant (CM)
Actin
[gRNA]cnt ΔNotch2
TBP
XIAP
C N C N
b
Actin
– – – – + + + + hBMSCs
GFPDAPIMerged
Control(2nd ab)
fe
kDa kDa
kDakDa kDa
×63
100
45
100
45
CLL
-27
CLL
-28
CLL
-29
CLL
-30
CLL
-27
CLL
-28
CLL
-28
CLL
-30
β-catenin100
45
β-catenin
β-catenin
β-catenin(Ser33/37/Th41)Non-phospho (active)
β-catenin (Ser45)Non-phospho (active)
100
45
– +
β-catenin
Not
ch2f/f
Not
ch2f/f
100
40
50
β-catenin
g
i
– + EL08-1D2
P(Ser9) Gsk3-β
Gsk3-β
P(Ser9) Gsk3-β
Gsk3-β
cnth
LiCl
Actin
cnt
C1q – – 1 0.5
P(Ser9) Gsk3-β
Gsk3-β
Actin
j
0.0
0.5
1.0
C1qa
* ** *
kDakDa
kDa
100
50
50
β-catenin
– – 1 2 10 [mM]
β-catenin
ΔNotch2 [gRNA]
cnt
ΔNot
ch2
cnt
ΔNot
ch2
cnt
ΔNot
ch2
100
50
50
45
C1qb C1qc
Rel
ativ
e ge
ne e
xpre
ssio
nin
EL0
8-1D
2 (+
CLL
)
ΔNotch2 [gRNA]
100
50
50
45
[μg/ml]
β-catenin
Fig. 4 Stromal Notch2 regulates β-catenin in CLL cells. a β-Catenin expression in primary CLL cells co-cultured on murine BMSCs for 5 days or mono-cultured. b β-Catenin expression in four different primary CLL cells co-cultured on human primary BMSCs. c Lane 1+2: β-catenin expression was evaluatedin primary CLL cells after 24 and 48 h in direct co-culture with EL08-1D2. Lane 3: conditioned media (CM) from the 48 h co-cultures or fresh medium (lane4) was used as culture medium for freshly thawed cells of the same patient. β-Catenin expression was assessed after 24 h. Representative results fromthree different patients are shown. d β-Catenin localisation was assessed in primary CLL cells co-cultured on EL08-1D2 cells for 24 h. Specific non-phosphoantibodies were used to detect the active form of β-catenin. Representative results from two different patients are shown. e β-Catenin expression inprimary CLL cells cultured for 5 days on Notch2+/+ or Notch2-/- mBMSCs. f Analysis of cytoplasmic and nuclear β-catenin levels in primary CLL cells co-cultured for 48 h on BMSCs in which Notch2 was deleted by CRISPR/Cas9. Representative results from three different patients are shown. g Phospho-GSK3-β expression in primary CLL cells co-cultured on EL08-1D2 cells for 24 h. Representative results from three different experiments are shown. h β-Catenin expression in CLL cells co-cultured on Notch2-deficient EL08-1D2 cells. After 24 h on stromal cells, co-cultures were exposed to increasing dosesof lithium chloride (LiCl) for additional 3 h before CLL cells were harvested. One representative experiment out of three is shown. i Quantitative reverse-transcription polymerase chain reaction analysis of the C1q complex in Notch2-deficient EL08-1D2 (blue symbols) cells normalised to expression in controlcells (transfected with a control guide RNA, dark symbols). Shown is the mean ± SEM of six independent experiments, using different primary CLL cells;*p < 0.05, **p < 0.01. j β-Catenin expression in CLL cells co-cultured on Notch2-deficient EL08-1D2 cells. After 24 h on stromal cells, co-cultures wereexposed to increasing doses of C1q for additional 24 h before CLL cells were harvested. Representative results from three different experiments are shown
NATURE COMMUNICATIONS | DOI: 10.1038/s41467-018-06069-5 ARTICLE
NATURE COMMUNICATIONS | (2018) 9:3839 | DOI: 10.1038/s41467-018-06069-5 | www.nature.com/naturecommunications 7

cells (Fig. 5e). In agreement with the idea that N-cadherin con-tributes to the stabilisation of β-catenin, this lack of N-cadherininduction in CLL cells was associated with significantly reducedβ-catenin levels (Fig. 5e). Thus, our data demonstrate that inaddition to Notch2-mediated GSK3-β inhibition in CLL cells, fullstabilisation of β-catenin in malignant B cells also requires N-cadherin expression induced by stromal N-cadherin.
Since conditioned media from CLL/BMSC co-culture failed tofully stabilise β-catenin in CLL cells (Fig. 4c), membrane-boundfactors must also be required to inhibit its degradation. Wetherefore performed plasma membrane profiling of EL08-1D2
cells, which allows the quantitative proteomic analysis of cellsurface proteins28 in the presence and absence of Notch2. Plasmamembrane proteins were labelled as described in the Methodssection after CLL cells were removed from stromal cells. Onlystromal cells with a purity of >98% were further analysed by massspectrometry (Supplementary Figure 7d). Following mass spec-trometry analysis, we identified 1055 plasma membrane proteinsas defined by GO terms, representing 34% of the total number ofproteins identified. This subset accounted for 64% oftotal abundance of proteins identified by mass spectrometry,indicating successful enrichment for plasma membrane proteins
β-catenin
N-cadherin
Actin
(hours)– + + + + + +– +–
12 24 36 48 60
Isotype controlN-cadherinIP:
N-cadherin
β-catenin
Heavy chain
EL08-1D2EL08-1D2
d Rel
ativ
e ge
ne e
xpre
ssio
n in
CLL
(fol
d in
crea
se, c
o-cu
lture
com
pare
d to
mon
o-cu
lture
)
N-cadherin
Notch2
Actin
sgG
FP
sgN
cad#
2
sgN
cad#
1
WT
EL08-1D2
Cas9
N-cadherin
Actin
β-catenin
sgG
FP
sgN
cad#
2
sgN
cad#
1
– + + + EL08-1D2
e
PC
1 (2
3.6%
)
PC2 (4.89%)
PLS plot (28.5%)
–6 –4 –2 0 2 4 –6
0
5
–5
–10
EL08-1D2monoculture
EL08-1D2 + CLL(Notch2 wild-type)
EL08-1D2 + CLL(Δ Notch2)
9
8
7
6
5
4
3
2
1
0–2 1 0 1 2 –2 1 0 1 23 4 5 6 7
6
5
4
3
2
1
0
Plasma membrane proteinsUp-regulated in EL08-1D2 + CLL
vs. EL08-1D2 mono-culture
Plasma membrane proteinsRegulated in EL08-1D2 + CLLvs. EL08-1D2 ΔNotch2 + CLL
Notch2
(see also supplementary table 2)
Fv4C3ar1
Lrrc15 NrcamCD55
Cspg4 Enpep
L1cam
PtprcSellCxcr5
Entpd1
Gpr183Sema4dItgb2
Tspan33Sema4a
Itgax
Lpar5
H2-AaH2-T24
cnt ΔNotch2
β-catenin
Actin
N-cadherin
[gRNA]
ji
Rel
ativ
e ge
neex
pres
sion
in C
LL
0.0
0.5
1.0**
0
10
20
30
40
***
p =0.053
100
45
130
kDa
kDa
kDa
100
45
130
150
130
100
45
100
130
50
100
130
45
kDa
(see also supplementary table 3)–Log
10 (p
-val
ue)
–Log
10 (p
-val
ue)
Log2 (fold change)Log2 (fold change)
CNT ΔNotch2
β-catenin N-cadherin
N-cadherin
a b c
f g h
ARTICLE NATURE COMMUNICATIONS | DOI: 10.1038/s41467-018-06069-5
8 NATURE COMMUNICATIONS | (2018) 9:3839 | DOI: 10.1038/s41467-018-06069-5 | www.nature.com/naturecommunications
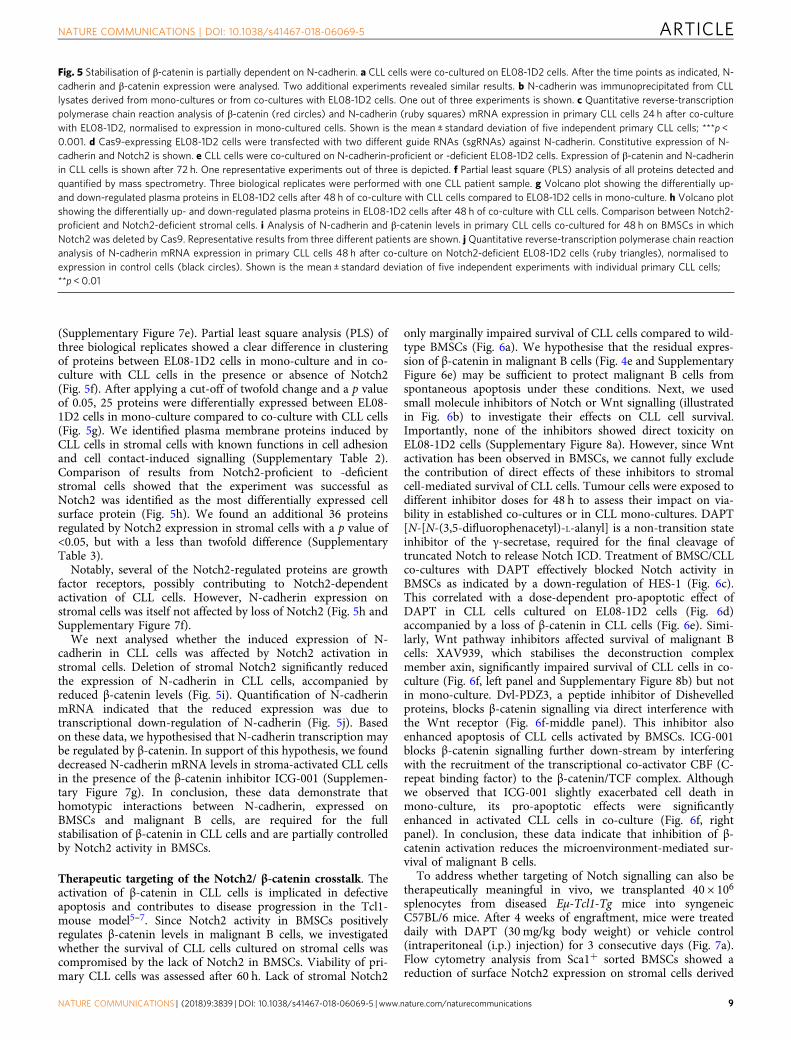
(Supplementary Figure 7e). Partial least square analysis (PLS) ofthree biological replicates showed a clear difference in clusteringof proteins between EL08-1D2 cells in mono-culture and in co-culture with CLL cells in the presence or absence of Notch2(Fig. 5f). After applying a cut-off of twofold change and a p valueof 0.05, 25 proteins were differentially expressed between EL08-1D2 cells in mono-culture compared to co-culture with CLL cells(Fig. 5g). We identified plasma membrane proteins induced byCLL cells in stromal cells with known functions in cell adhesionand cell contact-induced signalling (Supplementary Table 2).Comparison of results from Notch2-proficient to -deficientstromal cells showed that the experiment was successful asNotch2 was identified as the most differentially expressed cellsurface protein (Fig. 5h). We found an additional 36 proteinsregulated by Notch2 expression in stromal cells with a p value of<0.05, but with a less than twofold difference (SupplementaryTable 3).
Notably, several of the Notch2-regulated proteins are growthfactor receptors, possibly contributing to Notch2-dependentactivation of CLL cells. However, N-cadherin expression onstromal cells was itself not affected by loss of Notch2 (Fig. 5h andSupplementary Figure 7f).
We next analysed whether the induced expression of N-cadherin in CLL cells was affected by Notch2 activation instromal cells. Deletion of stromal Notch2 significantly reducedthe expression of N-cadherin in CLL cells, accompanied byreduced β-catenin levels (Fig. 5i). Quantification of N-cadherinmRNA indicated that the reduced expression was due totranscriptional down-regulation of N-cadherin (Fig. 5j). Basedon these data, we hypothesised that N-cadherin transcription maybe regulated by β-catenin. In support of this hypothesis, we founddecreased N-cadherin mRNA levels in stroma-activated CLL cellsin the presence of the β-catenin inhibitor ICG-001 (Supplemen-tary Figure 7g). In conclusion, these data demonstrate thathomotypic interactions between N-cadherin, expressed onBMSCs and malignant B cells, are required for the fullstabilisation of β-catenin in CLL cells and are partially controlledby Notch2 activity in BMSCs.
Therapeutic targeting of the Notch2/ β-catenin crosstalk. Theactivation of β-catenin in CLL cells is implicated in defectiveapoptosis and contributes to disease progression in the Tcl1-mouse model5–7. Since Notch2 activity in BMSCs positivelyregulates β-catenin levels in malignant B cells, we investigatedwhether the survival of CLL cells cultured on stromal cells wascompromised by the lack of Notch2 in BMSCs. Viability of pri-mary CLL cells was assessed after 60 h. Lack of stromal Notch2
only marginally impaired survival of CLL cells compared to wild-type BMSCs (Fig. 6a). We hypothesise that the residual expres-sion of β-catenin in malignant B cells (Fig. 4e and SupplementaryFigure 6e) may be sufficient to protect malignant B cells fromspontaneous apoptosis under these conditions. Next, we usedsmall molecule inhibitors of Notch or Wnt signalling (illustratedin Fig. 6b) to investigate their effects on CLL cell survival.Importantly, none of the inhibitors showed direct toxicity onEL08-1D2 cells (Supplementary Figure 8a). However, since Wntactivation has been observed in BMSCs, we cannot fully excludethe contribution of direct effects of these inhibitors to stromalcell-mediated survival of CLL cells. Tumour cells were exposed todifferent inhibitor doses for 48 h to assess their impact on via-bility in established co-cultures or in CLL mono-cultures. DAPT[N-[N-(3,5-difluorophenacetyl)-L-alanyl] is a non-transition stateinhibitor of the γ-secretase, required for the final cleavage oftruncated Notch to release Notch ICD. Treatment of BMSC/CLLco-cultures with DAPT effectively blocked Notch activity inBMSCs as indicated by a down-regulation of HES-1 (Fig. 6c).This correlated with a dose-dependent pro-apoptotic effect ofDAPT in CLL cells cultured on EL08-1D2 cells (Fig. 6d)accompanied by a loss of β-catenin in CLL cells (Fig. 6e). Simi-larly, Wnt pathway inhibitors affected survival of malignant Bcells: XAV939, which stabilises the deconstruction complexmember axin, significantly impaired survival of CLL cells in co-culture (Fig. 6f, left panel and Supplementary Figure 8b) but notin mono-culture. Dvl-PDZ3, a peptide inhibitor of Dishevelledproteins, blocks β-catenin signalling via direct interference withthe Wnt receptor (Fig. 6f-middle panel). This inhibitor alsoenhanced apoptosis of CLL cells activated by BMSCs. ICG-001blocks β-catenin signalling further down-stream by interferingwith the recruitment of the transcriptional co-activator CBF (C-repeat binding factor) to the β-catenin/TCF complex. Althoughwe observed that ICG-001 slightly exacerbated cell death inmono-culture, its pro-apoptotic effects were significantlyenhanced in activated CLL cells in co-culture (Fig. 6f, rightpanel). In conclusion, these data indicate that inhibition of β-catenin activation reduces the microenvironment-mediated sur-vival of malignant B cells.
To address whether targeting of Notch signalling can also betherapeutically meaningful in vivo, we transplanted 40 × 106
splenocytes from diseased Eμ-Tcl1-Tg mice into syngeneicC57BL/6 mice. After 4 weeks of engraftment, mice were treateddaily with DAPT (30 mg/kg body weight) or vehicle control(intraperitoneal (i.p.) injection) for 3 consecutive days (Fig. 7a).Flow cytometry analysis from Sca1+ sorted BMSCs showed areduction of surface Notch2 expression on stromal cells derived
Fig. 5 Stabilisation of β-catenin is partially dependent on N-cadherin. a CLL cells were co-cultured on EL08-1D2 cells. After the time points as indicated, N-cadherin and β-catenin expression were analysed. Two additional experiments revealed similar results. b N-cadherin was immunoprecipitated from CLLlysates derived from mono-cultures or from co-cultures with EL08-1D2 cells. One out of three experiments is shown. c Quantitative reverse-transcriptionpolymerase chain reaction analysis of β-catenin (red circles) and N-cadherin (ruby squares) mRNA expression in primary CLL cells 24 h after co-culturewith EL08-1D2, normalised to expression in mono-cultured cells. Shown is the mean ± standard deviation of five independent primary CLL cells; ***p <0.001. d Cas9-expressing EL08-1D2 cells were transfected with two different guide RNAs (sgRNAs) against N-cadherin. Constitutive expression of N-cadherin and Notch2 is shown. e CLL cells were co-cultured on N-cadherin-proficient or -deficient EL08-1D2 cells. Expression of β-catenin and N-cadherinin CLL cells is shown after 72 h. One representative experiments out of three is depicted. f Partial least square (PLS) analysis of all proteins detected andquantified by mass spectrometry. Three biological replicates were performed with one CLL patient sample. g Volcano plot showing the differentially up-and down-regulated plasma proteins in EL08-1D2 cells after 48 h of co-culture with CLL cells compared to EL08-1D2 cells in mono-culture. h Volcano plotshowing the differentially up- and down-regulated plasma proteins in EL08-1D2 cells after 48 h of co-culture with CLL cells. Comparison between Notch2-proficient and Notch2-deficient stromal cells. i Analysis of N-cadherin and β-catenin levels in primary CLL cells co-cultured for 48 h on BMSCs in whichNotch2 was deleted by Cas9. Representative results from three different patients are shown. j Quantitative reverse-transcription polymerase chain reactionanalysis of N-cadherin mRNA expression in primary CLL cells 48 h after co-culture on Notch2-deficient EL08-1D2 cells (ruby triangles), normalised toexpression in control cells (black circles). Shown is the mean ± standard deviation of five independent experiments with individual primary CLL cells;**p < 0.01
NATURE COMMUNICATIONS | DOI: 10.1038/s41467-018-06069-5 ARTICLE
NATURE COMMUNICATIONS | (2018) 9:3839 | DOI: 10.1038/s41467-018-06069-5 | www.nature.com/naturecommunications 9

from DAPT-treated mice compared to vehicle control mice(Fig. 7b and Supplementary Figure 12), similar to our in vitroobservation (Fig. 2g). These data indicate that this treatmentschedule targeted Notch2 on BMSCs in vivo. Assessment of C1qtranscripts in sorted Sca1+ BMSCs showed a reduction of mRNAlevels by DAPT treatment (Fig. 7c), indicative of Notchinhibition. Notably, DAPT treatment reduced the number oftumour cells in the bone marrow by 50% (Fig. 7d). To assesswhether DAPT treatment had an impact on cell proliferation, welabelled tumour cells with Far-Red CellTracker before transplan-tation. The progressive decay of the dye with each cell divisionallows tracking of cell proliferation. At 3 days after transplanta-tion, mice were treated for 3 days with DAPT (Fig. 7e). Analysisof bone marrow-resident tumour cells showed that DAPTtreatment delayed cell proliferation based on an increasedstaining for Far-Red CellTracker compared to vehicle controlmice (Fig. 7f, g). Lastly, to translate these observations intohuman CLL, we reconstituted primary CLL cells from 4individual, untreated patients in NSG mice. Notably, 3 of thesepatients did not carry Notch1 mutations (mutation status for 1patient was not assessed). Peripheral blood mononuclear cells(PBMCs) from each patient were injected intravenously in 8 mice
per patient as previously described29. To allow time for CLL cellsto home to lymphoid organs before therapy, mice were treatedafter 5 days once daily with DAPT, receiving a total of 10 dosesover the course of 12 days (Fig. 7h). At 4 weeks after engraftment,mice were killed and lymphoma burden was assessed by flowcytometry and histology. Haematoxylin and eosin (H&E) stainingshowed multifocal infiltration of neoplastic lymphocytes in thesplenic parenchyma, interspersed in areas of extramedullaryhaematopoiesis, the latter a normal feature of murine spleen.Mitotic figures were present within the lymphoid infiltrates.Staining of spleens with anti-human CD20 showed fewer CLLcells in DAPT-treated mice compared to control mice (Fig. 7i).For quantification, the degree of CLL infiltration was assessed byflow cytometry, confirming that DAPT treatment impairedsplenic engraftment in the CLL-PDX model (Fig. 7j).
Next, we investigated the expression of activated, de-phosphorylated β-catenin in human lymph node biopsies fromCLL patients. We found nuclear expression of β-catenin throughoutthe infiltrated lymph node in 6 out of 6 samples investigated (Fig. 8aand Supplementary Figure 9). In addition to immunofluorescence,we utilised immunohistochemistry (IHC) for β-catenin staining onhuman lymph node and bone marrow sections. We observed a fine,
Notch2
HES-1
Actin
– + – + – + DAPT
CLL-31 CLL-32 CLL-33
% A
popt
otic
CLL
cel
ls
***
10
20
30
40
50
Notch2GST
AxinDVL
Notch2 ICN
DAPT
XAV939PDZ
CBFICG-001
LRPFZD
MSC
CLL�-catenin
�-catenin
20
40
60
0
DAPT
***
***p=ns
% A
popt
otic
CLL
cel
ls
p=ns****
% A
popt
otic
CLL
cel
ls
XAV939 Dvl-PDZ 3 ICG-001
p=ns**60
80
40
20
60
80
40
20
100
60
80
40
20
100
p=ns*******
– + DAPT
Actin
β-cateninkDa
30
100
45
kDa100
45
0 1 5 10 [μM]0 5 10 20 [μM]
0 1 5 10 [μM]
0 10 50 [μM]
Notch2WT Δ Notch2
a b
c d e
f
Fig. 6 Increased sensitivity to Wnt inhibitors in primary CLL cells in the presence of BMSCs. a CLL cells were cultured for 5 days on mouse-derived BMSCs,either proficient (black squares) or deficient (blue triangles) for Notch2 (combining results from Cre-mediated and CRISPR/Cas9-mediated deletion ofNotch2). Apoptotic cells were analysed by Annexin-V/PI staining. Error bars show mean ± SEM from 30 patients; ***p= 0.0004. b Schematicrepresentation of the targeted proteins used in this study. c Three different CLL cells were co-cultured on EL08-1D2 cells for 72 h in the absence orpresence of DAPT. Notch signalling was assessed by immunoblotting EL08-1D2 cell lysates for the expression of HES-1. d CLL cells were co-cultured onEL08-1D2 cells for 72 h. Then, increasing doses of DAPT were added for 48 h. Apoptotic CLL cells were detected by flow cytometry and staining forAnnexin-V/PI. Error bars show mean ± SEM from 11 patient samples. e Analysis of β-catenin levels in primary CLL cells co-cultured for 48 h on BMSCs inthe presence of DAPT. A representative result from three different patients is shown. f Similarly to data shown in (d), CLL co-cultures were exposed toincreasing doses of the Wnt inhibitors XAV939, Dvl-PDZ3 or ICG-001 before cell death was assessed. Error bars show mean ± SEM from 11 patientsamples; *p < 0.05, **p < 0.01, ***p < 0.001, ****p < 0.0001
ARTICLE NATURE COMMUNICATIONS | DOI: 10.1038/s41467-018-06069-5
10 NATURE COMMUNICATIONS | (2018) 9:3839 | DOI: 10.1038/s41467-018-06069-5 | www.nature.com/naturecommunications

perinuclear dot positivity within the CLL cells across all tissue sitesin all samples investigated. Notably, within tissue sections, thedegree of positive staining varied from cells with an absentexpression of β-catenin to cells, which showed a brighter staining(Supplementary Figure 10). These data suggested that Wntsignalling is active in CLL cells in tissues.
Lastly, we tested whether β-catenin and N-cadherin weresimilarly regulated by contact to BMSCs in B cells from othermalignancies. Co-culture of malignant B cells from a leukaemicpatient with diffuse large B-cell lymphoma (DLBCL) on EL08-1D2 cells induced a strong up-regulation of β-catenin andminimal N-cadherin expression. Two out of three high-grade
104
105
106
107
CLL
cel
ls p
er s
plee
n
Vehicle
*
Hae
mat
oxili
n &
eos
inhC
D20
770
1424
MFI
917
884
1074
1320
DAPT
Vehicle
Day0
Day5
Day28
2 treatment cohorts:vehicle controls (N =16)DAPT (30 mg/kg BW) (N =16)(OD daily dosing, 10 doses)
FACShistopathology
Day17
Day0
Day0
Day7
Day3
2 treatment cohortsvehicle control DAPT(30 mg/kg BW)(OD daily dosing, 4 doses)
FACS
Day28–30
C57BL/6
Day+3
Cell tracker labelledTCL1-Tg cells
PrimaryCLL cells
TCL1-Tg cells
FACS sortingSca1+ MSCs
1.0
0.8
0.6
0.4
0.2
Vehicle DAPT
Cel
l tra
cker
[MF
I]
0
500
1000
1500
2000
*
15
10
5
**
DAPT
Vehicle
Non-injected
Notch2-PE
100
50
2 treatment cohortsvehicle controlDAPT (30mg/KG BW)(OD daily dosing, 4 doses)
Sca1+ BMSCs
*
Vehicle
** ** **
–103 0 103 104
C57BL/6
NSG
% N
otch
2 ex
pres
sion
on S
ca1+
MS
Cs
(rel
ativ
e to
veh
icle
)DAPT –103 0 103 104
[Bone marrow CD19+CD5+]cell tracker
VehicleDAPTVehicle DAPT
Bon
e m
arro
w in
filtr
atio
n[%
CD
19+ C
D5+
cells
)
Gen
e ex
pres
sion
in S
ca1+
mB
MS
Cs
(rel
ativ
e to
veh
icle
con
trol
mic
e)
C1qa C1qb C1qc
Vehicle DAPT
DAPT
a e
b f
dc g
h
i j
*
* *
NATURE COMMUNICATIONS | DOI: 10.1038/s41467-018-06069-5 ARTICLE
NATURE COMMUNICATIONS | (2018) 9:3839 | DOI: 10.1038/s41467-018-06069-5 | www.nature.com/naturecommunications 11
B-cell lymphoma (hgNHL) lines showed stroma-dependentstabilisation of β-catenin without significant changes in N-cadherin expression, suggesting that the regulation of N-cadherinis different in CLL and hgNHL cells. Primary malignant B cellsfrom patients with Mantle cell lymphoma (MCL) exhibited asimilar regulation of β-catenin and N-cadherin as CLL cells(Fig. 8b). These data indicate that BMSCs can contribute tocanonical Wnt signalling in numerous B-cell malignancies.
DiscussionThe contribution of the tumour microenvironment to diseasedevelopment, maintenance and progression has increasingly beenacknowledged in recent years. Here we describe that the cross-activation of CLL cells and BMSCs results in Notch2 activation instromal cells, which is in turn required for the activation of Wntsignalling in malignant B cells (Fig. 8c). The contribution of de-regulated Wnt/β-catenin pathway to tumourigenesis of solidtumours and haematological malignancies is well establishedthrough in vitro and in vivo studies30. In CLL, activation of thecanonical Wnt pathway was reported by several groups, based onthe constitutive over-expression of Wnt and dishevelled proteinsand β-catenin target genes24,31,32. DNA hypermethylation of Wntinhibitors is one mechanism reported to underlie this activationof Wnt signalling33,34. More recently, next-generation sequencingidentified somatic mutations in multiple genes regulating β-catenin expression in altogether 14% of patients5. Our dataindicate that contact to BMSCs in the microenvironment is suf-ficient to activate canonical Wnt signalling in malignant B cells.Since β-catenin stabilisation in CLL cells cultured on BMSCs isextremely robust and was observed in all our samples withoutexceptions, we conclude that the activation of the canonical Wntpathway can occur in the absence of activating somatic muta-tions. An important question is how β-catenin contributes todisease initiation and progression. This issue was previouslyaddressed, using small molecule inhibitors or gene silencing anddata indicate that the survival of malignant B cells directlydepends on Wnt signalling5,6. In agreement with this, our resultsdemonstrate that small molecule inhibitors of Wnt signalling canovercome the protection of CLL cells by stromal cells in vitro.However, these studies only allow for drawing of limited con-clusions about the role of β-catenin in vivo. Since reported Wnt/β-catenin target genes supposedly include Myc and cyclin D1, it isreasonable to speculate that this pathway is also important for cellproliferation and disease progression in CLL. Indeed, in atransplantation assay, we also noticed reduced cell proliferation ofTcl-1-driven tumours in vivo. Further evidence in support of thisidea originates from the Eμ-Tcl1 mouse model crossed into Fzd6
knockout mice, demonstrating that the Fzd6 receptor for Wntligands is up-regulated during B-cell leukaemogenesis7, similar toprimary human CLL cells24. Lack of Fzd6 significantly delayeddisease progression, associated with a lack of β-catenin expressionin malignant B cells.
Our data further advance the mechanistic understanding ofcanonical Wnt signalling in CLL by identifying Notch2, activatedthrough CLL contact in mesenchymal stromal cells, as a keyregulator of β-catenin in malignant B cells. This strict dependencyof Notch2 was an unexpected and remarkable finding as BMSCsconstitutively express all four Notch receptors. Notch1 andNotch2 are structurally similar with a 52% homology between thetwo proteins (56% for human proteins). However, Notch1 (or anyother Notch receptor) was unable to compensate for the loss ofNotch2 in CLL-activated BMSCs with regard to activating Wntsignalling in malignant B cells. In line with this observation, wefound loss of cleaved Notch1 in co-cultured BMSCs, in strikingcontrast to Notch2. This raises the question of how CLL cellspreferably activate Notch2 signalling. One possibility is thatNotch ligands bind with different signal strength to individualNotch receptors, thereby defining signal specificity35,36. In addi-tion, post-translational modifications of the extracellular domainof Notch have been identified as another mechanism of regulatingNotch–ligand interactions19. In addition, CLL cells may provideconditions to BMSCs permitting the recently suggested form ofcis-activation of Notch signalling37.
It is noteworthy that the degree of dependency on stromalNotch2 for β-catenin stabilisation in CLL cells varied betweensamples and we found that 25% of all primary CLL samples didnot depend on Notch2 activity to express β-catenin in co-culture.Although this is not unexpected given the heterogeneity of thedisease, to date we cannot explain this finding. We hypothesisethat somatic mutations in Wnt signalling genes, present in asubset of patients5, may overcome the dependency on stromalNotch2, while still being responsive to Notch2-independent,BMSC-mediated regulation of the Wnt pathway.
Gene expression profiles indicate that Notch2 signalling isconstitutively active and regulates gene expression in BMSCs. Inline with this observation, cleaved Notch2 was detectable in allprimary (human and mouse) BMSCs in the absence of CLL cells.Contact to CLL cells induced substantial, Notch2-dependentchanges in gene expression. The majority of these regulated geneswere suppressed by Notch2, in keeping with the observation thatNotch signalling can be largely repressive. Ultimately, thesechanges are required for the full stabilisation of β-catenin inmalignant B cells. Our experiments identified several, Notch2-dependent soluble factors, which can contribute to the
Fig. 7 Notch targeting in vivo. a Schematic representation of the experimental design: mice transplanted with 40 × 106 splenocytes from diseased TCL1+-Tgmice were treated after 4 weeks with 4 consecutive doses of 30mg/kg DAPT or vehicle control (i.p. injection; once daily). b Notch2 expression analysis inbone marrow stromal Sca1+ cells of transplanted mice, treated with DAPT (ruby circles) or vehicle control (blue circles); (n= 5 for each treatment group;two different primary tumours were transplanted). Relative quantification of the MFI of treated versus untreated mice is shown on the right panel,*p < 0.05. c RT-qPCR analysis of the C1q complex in BMSC-Sca1+ cells of mice treated with DAPT, normalised to the expression in mice treated withvehicle. Because of low RNA yield, Sca1+ cells were sorted from three individual mice and then combined for RNA extraction. Shown is the mean ± standarddeviation of three technical repeats. d Quantification of bone marrow CD19+CD5+ cells of mice treated with DAPT (red symbols) or vehicle control (bluesymbols) using flow cytometry (n= 5 per treatment group, two different primary tumours were transplanted); **p < 0.01. e Schematic representation ofthe experimental design. f Far-Red CellTracker fluorescence of bone marrow-derived CD5+CD19+ cells, 7 days following transplantation (n= 3 pertreatment group). g Quantification of the MFI of treated and untreated mice shown in (f); *p < 0.05. h Schematic scheme of the CLL-PDX model. Freshlyisolated PBMCs from four untreated CLL patients were injected intravenously into four mice respectively. At 5 days after transplantation, mice were treatedonce daily with DAPT at a dose of 30mg/kg body weight or vehicle control (i.p. injection). Mice received a total of 10 doses over the course of 12 days.i Lymphoma burden in the spleen was assessed by flow cytometry (staining for CD5+, CD19+ cells) and histology. The thin white arrow indicates areas ofextramedullary haematopoiesis; thick white arrow: mitotic figure. *Cells with morphology and CD20 staining consistent with neoplastic cells. Scale bars:lines 1 and 3= 300 μm; line 2= 100 μm, insert in line 2= 30 μm. j Number of splenic CD19+CD5+ presents in mice treated with DAPT (yellow triangles)or vehicle control (ruby squares); **p < 0.01
ARTICLE NATURE COMMUNICATIONS | DOI: 10.1038/s41467-018-06069-5
12 NATURE COMMUNICATIONS | (2018) 9:3839 | DOI: 10.1038/s41467-018-06069-5 | www.nature.com/naturecommunications

CLL cells activate Notch2 in MSCs
CLL
MSC
Nuc
leus
Nuc
leus
Cyt
opla
sm
Cyt
opla
sm
RBPJNot
ch2
ICD
Frizzled
LRP
5/6
C1qa, C1qb, C1qc
C1q
�-catenin
�-catenin
�-catenin
�-catenin
�-catenin
�-catenin
�-catenin
PU U
N-cadherin
P
U
APC
TCF/LEF
CLL
MSC
Nuc
leus
Nuc
leus
Cyt
opla
sm
Cyt
opla
sm
RBPJ RBPJ
Notch1Notch2
Notch2 ICD
Not
ch2
ICD
Jagged-1/2Delta1/4
Frizzled
LRP
5/6
TCF/LEF
CLL
MSC
Nuc
leus
Nuc
leus
Cyt
opla
sm
Cyt
opla
sm
RBPJNot
ch2
ICD
Frizzled
LRP
5/6
C1qa, C1qb, C1qc
C1q
GSK3-�
N-cadherin
P
TCF/LEF
Primary DLBCL Namalwa CLLSUDHL4
– + – + – + – + – +
N-cadherin
β-catenin
Actin
– – – + + + EL08-1D2
130 -
100 -
45 -
kDa
DAPI CD19
β-catenin(Ser45)
Non-phospho(active) Merged
DAPI Control Control Merged
N-cadherin stabilises β-cateninStromal C1q inhibits GSK3-β in CLL
OCI-LY8 Primary mantle cell lymphoma B cells
MCL-
01
MCL-
02
MCL-
03
MCL-
01
MCL-
02
MCL-
03
�-catenin
GSK3-�
a
b
c
Fig. 8 a β-Catenin was assessed in lymph node sections of CLL patients by microscopy. A specific non-phospho-antibody for β-catenin was used to detectthe active form of the protein. One representative result from six different patients is shown. Scale bar= 100 μm. b β-Catenin and N-cadherin expression inprimary B cells from a patient with leukaemic DLBCL (left panel) or from three patients diagnosed with Mantle cell lymphoma (MCL) after 5 days of co-culture on EL08-1D2 cells (right panel). High-grade NHL cell lines (Namalwa= Burkitt lymphoma; SU-DHL-4 and OCI-LY8=DLBCL) were cultured onstromal cells for 48 h (middle panel). c Schematic presentation of the mutual activation of BMSCs and CLL cells. (Left) CLL cells induce Notch2 activationin BMSCs. (Middle) Stromal Notch2 in turn regulates the expression of complement C1q and other soluble factors, required for the inhibition of GSK3-βand stabilisation of β-catenin in malignant B cells. (Right) In addition, up-regulated N-cadherin in CLL cells interacts with β-catenin and further contributesto its stabilisation. This figure was partly produced using the Smart Servier Medical Art, available from https://smart.servier.com/image-set-download/and licensed under a Creative Common Attribution 3.0 Generic License. http://smart.servier.com/
NATURE COMMUNICATIONS | DOI: 10.1038/s41467-018-06069-5 ARTICLE
NATURE COMMUNICATIONS | (2018) 9:3839 | DOI: 10.1038/s41467-018-06069-5 | www.nature.com/naturecommunications 13

stabilisation of β-catenin in CLL cells. Of these, complement C1qappears to play an important role for the inhibition of GSK3-β inmalignant B cells. Beside its role in innate immunity, it wasrecently demonstrated that C1q, produced by stromal cells, hasindependent cancer-promoting activities in solid tumours38. Insupport of this idea, sera from CLL patients were found to con-tain higher C1q levels than normal controls39. Mechanistically, itwas shown that this activation can occur upon binding of C1q toFz receptors and subsequently C1s becomes activated. Cleavage ofLRP5/6 by C1s then activates canonical Wnt signalling26. Ourdata demonstrate that the addition of C1q to CLL stroma co-cultures can compensate for Notch2 deficiency in BMSCs withregard to Wnt activation. Notably, C1q had no effect on β-cateninstabilisation in CLL mono-cultures, indicating that stromal cellsprovide additional, essential signals to activate this pathway (e.g.,C1s, N-cadherin).
In addition to the C1q complex, the Wnt inhibitors Sfpr4 andWif1 were up-regulated in Notch2-deficient stromal cells andtheir Notch2-mediated suppression in wild-type cells may furtherfacilitate Wnt activation by BMSCs. Therefore, it is reasonable toassume that numerous factors act in a collaborative manner tostabilise β-catenin. The contribution of an individual factor to theactivation of Wnt signalling will likely depend on its local con-centration and accessibility in the niche.
Notably, conditioned media from CLL-MSC co-cultures lackthe ability to vigorously stabilise β-catenin, indicating that Notch2must co-regulate membrane-tethered proteins required for Wntactivation. We hypothesised that N-cadherin may be one of thesefactors, since β-catenin can bind tightly to type-I cadherins.Ablation of N-cadherin in BMSCs indeed significantly reduces N-cadherin and β-catenin expression in CLL cells. Plasma mem-brane profiling of BMSCs revealed several Notch2-regulatedproteins expressed in stromal cells, which could be required forcell adhesion and also affect both the activation of stromal andCLL cells. Importantly, ablation of Notch2 from stromal cellssignificantly inhibited the induction of N-cadherin in CLL cells.Since N-cadherin and β-catenin expression, induced by BMSCs,follow a similar kinetic, it is reasonable to speculate that N-cadherin transcription is directly regulated by β-catenin, con-stituting a positive feed-back loop to further enhance β-cateninexpression in tissues.
In addition to these mechanisms, Notch2-dependent altera-tions in the composition of extracellular matrix may affectintegrin signalling in CLL cells and tissue stiffness. The lattereffect was shown to induce aberrant mechanotransduction,leading to β-catenin stabilisation through disintegration of thedeconstruction complex40.
The identification of Notch2-regulated activation of Wnt inmalignant B cells raises the question of whether this signallingpathway constitutes a meaningful target for therapeutic inter-ventions. Our data demonstrate that treatment with the γ-secretase inhibitor DAPT significantly impairs engraftment in aCLL-PDX model. This clearly establishes γ-secretase as a ther-apeutic target in CLL. Notch proteins are prominent targets of γ-secretase and our in vitro experiments suggest that inhibition ofNotch2 activity on stromal cells should be a contributing factor tothe overall effect of DAPT. However, other effects such as directinhibition of Notch signalling on CLL cells and interference withother γ-secretase-dependent pathways surely play additionalroles. However, the net effect of γ-secretase inhibition in vivoresulted in reduced cell proliferation and clearly diminishedengraftment.
In spite of the recent clinical success with B-cell receptor (BCR)inhibitors and B-cell lymphoma-2 (Bcl-2) antagonists, the diseasestill remains incurable due to residual cells surviving in protectiveniches. Therefore, treatment of minimal residual disease (MRD)
remains an on-going clinical objective with the aim to fully era-dicate the disease. We believe that Notch2 microenvironment-mediated activation of β-catenin can be relevant for MRD inprotective niches in the bone marrow and other lymphoid organs.Our analyses of β-catenin in sections from CLL patients indicatethat a substantial fraction of cells harbours activated, nuclear β-catenin. These data contrast another report showing absence ofnuclear β-catenin in bone marrow sections, which may be relatedto different antibodies used for these analyses. The degree of β-catenin activation by stroma-derived signals certainly depends onthe duration of these cell–cell interactions in vivo as well as on thetissue concentrations of soluble, Wnt-regulating factors. Itremains to be experimentally addressed to what extend BMSC-induced β-catenin regulates gene expression in tissues. For this,we currently perform chromatin immunoprecipitation-sequencing experiments on stroma-activated CLL cells.
In support of the idea that Wnt activation is characteristic forthe niche in CLL, it was demonstrated that BMSC-mediatedactivation of the Wnt pathway protects CML-progenitors fromTKI-treatment27. Similarly, microenvironment-mediated stabili-sation of β-catenin increases drug resistance in acute leukae-mias41. Therefore, Notch- or Wnt inhibitors may be best used incombination therapies in B-cell malignancies. Alternatively, sin-gle agent therapies may have the potential to achieve deeper,MDR-negative, remission when given as consolidation treatment.Since we also identified BMSC-mediated stabilisation of β-cateninin MCL and hgNHL B cells, such treatment modalities may berelevant also in other B-cell malignancies.
MethodsPrimary cells and cell culture. After informed patients’ consent and in accordancewith the Helsinki declaration, peripheral blood was obtained from patients with adiagnosis of CLL, DLBCL and MCL. These studies were approved by the localethical committee of the Technical University Munich (project number 1894/07)and by the Cambridgeshire Research Ethics Committee (07/MRE05/44). HumanBMSCs were collected from individuals who underwent bone marrow aspirationfor diagnostic purposes and in whom subsequently a haematological disease wasruled out. Patients consented to the use of this material for research purposes.Murine BMSCs were established from femora and tibiae of 4- to 8-week-old miceaccordingly. PBMCs were isolated from heparinised blood samples from patientsby centrifugation over a Ficoll-Hypaque layer (PAN-Biotech, Aidenbach, Ger-many). If the content of CD5+CD19+ cells was less than 90%, CLL cells werefurther purified by incubating cells with anti-CD2 and anti-CD14 magnetic beads(Dynabeads, Thermo Scientific, Winsford, UK) according to the manufacturer’sinstructions. After purification, B cells from CLL patients were generally >95% pureas assessed by flow cytometry. Samples for RNA-seq were >98% pure. After har-vest, malignant B cells were either frozen down as viable cells or cultured in RPMI1640 (Gibco, Darmstadt, Germany) supplemented with 10% foetal calf serum,penicillin/streptomycin 50 U/ml, Na-pyruvate 1 mM, L-glutamine 2 mM, L-aspar-agine 20 mg/ml, 2-mercaptoethanol 0.05 mM, HEPES 10 mM and minimumessential medium (MEM) non-essential amino acids (Gibco). No differences wereobserved between thawed cells and fresh cells with regards to the results presentedin this study. EL08-1D2 and all primary mouse bone marrow stromal cell cultureswere cultured in MEM Alpha+GlutaMAX medium (ThermoFisher Scientific,Winsford, UK) supplemented with 10% foetal calf serum (Gibco), 10% horse serum(Sigma-Aldrich, Dorset, UK), 10 μM 2- mercaptoethanol and 1% penicillin/strep-tomycin (Gibco). For co-culture experiments, 15 × 104 EL08-1D2 cell were seededin a 6 multi-well plate 24 h before the addition of primary CLL cells at a con-centration of 106 cells/ml (equalling 3 × 10⁶ total primary CLL cells).
Cell lines used for the experiments depicted in Fig. 8b were obtained from DrDaniel Hodson as a gift from the Staudt lab (National Cancer Institute, Bethesda,USA). Cell lines and primary stromal cells were frequently tested for mycoplasmato ensure contamination-free conditions.
Transwell co-culture assays. EL08-1D2 or primary human bone marrow stromalcell were seeded in 24 multi-well plates. After 24 h, purified primary CLL cells wereadded in 1 μm transwell insert (Sarstedt, Nümbrecht, Germany) at the con-centration of 106/ml.
Reagents. Nuclear-cytoplasmic protein separation was performed with NE-PER™Nuclear and Cytoplasmic Extraction kit (ThermoFisher Scientific, Winsford, UK)according to the manufacturer’s instructions.
ARTICLE NATURE COMMUNICATIONS | DOI: 10.1038/s41467-018-06069-5
14 NATURE COMMUNICATIONS | (2018) 9:3839 | DOI: 10.1038/s41467-018-06069-5 | www.nature.com/naturecommunications

The agents DAPT, ICG-001 and XAV939 were purchased from Selleckchem(Newmarket, UK). Dvl-PDZ 3 was purchased from Merck Millipore (Billerica, MA,USA).
Antibodies. A list of all antibodies used in the study, including catalogue numbersand dilution, can be found in Supplementary Table 4. Uncropped images of themost important western blots are provided in Supplementary Figure 13.
Expression analysis/qPCR. Total RNA was isolated using the RNeasy Mini Kit(Qiagen, Manchester, UK), and complementary DNA (cDNA) was obtained usingthe qScriptTM cDNA SuperMix kit (QuantaBio, Beverly, MA, USA). Quantitativereverse-transcription polymerase chain reaction (RT-qPCR) was performed onisolated mRNA using the fast SYBR reagents and a ViiA 7 real-time PCR system(Life Technologies, Warrington, UK). Gene target expression levels were normal-ised to GAPDH, and values are represented as fold change relative to control usingthe ΔΔCt method. Primer sequences for quantitative RT-PCR can be found insupplementary table 5.
Immunofluorescence. EL08-1D2 and CLL cells, after co-culture on glass coverslipscoated with poly-L-lysine for 24 h, were fixed and permeabilised using ice-coldmethanol. After blocking the sections with 4% normal goat serum in phosphate-buffered saline (PBS) at room temperature for 30 min, β-catenin antibodies, β-Catenin (D10A8) XP® Rabbit, Non-phospho (Active) β-Catenin (Ser45) (D2U8Y)XP® Rabbit and Non-phospho (Active) β-Catenin (Ser33/37/Thr41) (D13A1)Rabbit (Cell Signaling Technology, Leiden, The Netherlands) were incubated at4 °C overnight followed by Anti-rabbit IgG (H+L), F(ab’)2 Fragment (Alexa Fluor®488 Conjugate) (Cell Signaling Technology, Leiden, The Netherlands).
Lymph node tissue samples were rehydrated and the Antigen Retrieval Reagent-Acidic buffer (R&D Systems) was used according to the manufacture’s instruction.After blocking the sections with 4% normal horse serum in PBS at roomtemperature for 30 min, Non-phospho (Active) β-Catenin (Ser45) (D2U8Y) XP®Rabbit (Cell Signaling Technology, Leiden, The Netherlands) and CD19[2E2B6B10] (Abcam, Cambridge, UK) were incubated at 4 °C overnight followedby Anti-rabbit IgG (H+L), F(ab’)2 Fragment (Alexa Fluor® 488 Conjugate) (CellSignaling Technology, Leiden, The Netherlands) and Goat Anti-Mouse IgG H&L(Cy5 ®) (Abcam, Cambridge, UK).
Nuclei were stained with ProLong™ Gold Antifade Mountant with 4′,6-diamidino-2-phenylindole (DAPI; ThermoFisher Scientific, Winsford, UK) andimages were captured using the Leica TCS Sp5 confocal (Leica Microsystems, IL,USA) or the EVOS FL Cell Imaging System (ThermoFisher Scientific, Winsford,UK). The images were processed using ImageJ software.
Multiplex protein signalling array. Primary CLL cells were mono-cultured or co-cultured on EL08-1D2 cells for 6 h. Phosphorylation of common signalling path-ways was detected using The PathScan® Intracellular Signaling Array Kit (Che-miluminescent Readout) (Cell Signaling Technology, Leiden, The Netherlands)according to the manufacturer’s instruction. The image of the slide was capturedwith the Azure Biosystem c300 (Dublin, CA, USA) digital imaging system.
Flow cytometry. Multicolour flow cytometric analysis of Nestin+, endothelial andosteoblast compartments was performed at 2 months of age as previously repor-ted42. In brief, Nestin+ mesenchymal cells and other stromal cell populations wereisolated from femur and tibia. Bones were crushed in a mortar with a pestle anddigested with 2 ml of collagenase (Stem Cell Technologies, 07092) and 1 mg/mlCollagenase IV (Sigma) at 37 °C in strong agitation for 30 min. Cells were thenfiltered through a 40 µm mesh and red blood cells lysed with 1× Pharmlyse (BD)for 10 min on ice.
Apoptosis was detected using the Annexin-V Apoptosis Detection Kit I(eBioscience, Winsford, UK). Samples were acquired on a LSRII flow cytometer(BD Biosciences, Oxford, UK) and analysed using FlowJo software (Tree Star).
Antibodies for fluorescence-activated cell sorting analysis are listed inSupplementary Table 6.
CRISPR/Cas9 plasmids. Single-guide RNA (sgRNA) sequences were cloned intolentiCRISPRv2 (the individual sequences are listed in supplementary table 7).Lentiviral infections of EL08-1D2 and murine bone marrow stromal cells with thespecific sgRNA constructs were performed. Following 48 h of puromycin selection(2 μg/ml), cells were negatively sorted for Notch2 expression and cultured forfurther experiments.
Mass spectrometry. Plasma membrane profiling was performed as describedpreviously28. Peptides were subsequently labelled with TMT reagents (ThermoFisher Scientific, Winsford, UK), pooled and cleaned up using a SEP-PAK C18cartridge (Waters) prior to high pH RP fractionation as previously described43
High pH fractions were pooled orthogonally into 12 samples for analysis by liquidchromatography–mass spectrometry on an Orbitrap Fusion (Thermo Fisher Sci-entific, Winsford, UK) utilising synchronous precursor selection mode to isolatereporter ions essentially as previously described43. Data were searched using the
MASCOT (Matrix Science, UK) search node within Proteome Discoverer v2.1(Thermo Fisher Scientific, Winsford, UK). The database used was the SwissProtMouse Reference Proteome including an appended database of common con-taminants. Statistical differences between replicate groups were assessed using animplementation of LIMMA within the R environment includingBenjamini–Hochberg correction for multiple hypothesis testing. The resulting p/qvalues are reported.
Microarray and RNA-seq. Microarray analyses were performed using the Affy-metrix GeneChip platform employing the Express Kit protocol for sample pre-paration and microarray hybridisation (Affymetrix, Santa Clara, CA). Total RNA(200 ng) was converted into biotinylated cRNA, purified, fragmented and hybri-dised to MG-430_2.0 microarrays (Affymetrix). The arrays were washed andstained according to the manufacturer’s recommendation and finally scanned in aGeneChip scanner 3000 (Affymetrix) with G7 update. Array images were processedusing the RMA algorithm implemented in PartekGS (Partek, St. Louis, MO).
RNA samples for RNA-seq were measured by Nanodrop spectrophotometryand then analysed on the Agilent Bioanalyzer RNA Nano chip. Samples (100 ngtotal RNA) were then processed for next-generation sequencing using the OvationHuman FFPE RNA-Seq Multiplex System Kit (NuGEN, 0340-32, 0341–32). Duringlibrary preparation, a unique method (InDA-C) was used to deplete unwantedreads derived from ribosomal RNA. The size distribution of the resulting librarieswas analysed on Agilent Bioanalyzer HS DNA chips. All libraries showed theexpected size profile and sufficient yield. Since the kit contains a limited number ofbarcodes, two library pools containing 9 samples each were generated forsequencing and quantified using the NEB Library Quant kit, a SYBRgreen-basedqPCR method. The sequencing of the library pool was performed on a HiSeq 2500High Output flow cell in the paired-end mode. For quantification of RNAs, qm-filtered alignments were imported into PartekGS. Subsequently, differentiallyexpressed genes were identified using the analysis of variance (ANOVA) testimplemented in PartekGS. The stepup method for multiple testing correction wasapplied to generate corrected p values.
CLL-PDX model. These animal studies were performed in accordance with statelaw and were approved by the local ethical committee of the University Essen-Duisburg, Germany (project numbers 14-6080-BO and G1124/10). NOD.Cg-PrkdcscidIl2rgtm1Wjl/SzJ (NSG) (5- to 10-week-old) mice were used as recipientsfor transplantation of primary human CLL cells as described previously29. A totalof 108 mononuclear cells were intravenously transplanted into NSG mice 24 h aftertreatment with Busulfan (30 mg/kg) (Selleckchem, Newmarket, UK). Mice werekilled 4 weeks after transplantation. For analysis of engraftment, one half of themurine spleen was fixed in buffered 3.7% formalin and afterwards embedded inparaffin for further immunohistochemical analyses. The other half of the spleenwas mechanically homogenised, pressed through 70 μm nylon sieves (BD Bios-ciences, Oxford, UK), and suspended in PBS for further analysis by flow cytometry.
Eμ-tcl1tg mice. These animal studies have been regulated under the Animals(Scientific Procedures) Act 1986 Amendment Regulations 2012 following ethicalreview by the University of Cambridge Animal Welfare and Ethical Review Body(AWERB-PPL number P846C00DB). Eμ-Tcl1tg mice44 were kindly provided byDr. Carlo Croce. Tumour cells from moribund Eμ-Tcl1tg were labelled withCellTrace™ Far-Red Cell Proliferation Kit (ThermoFisher Scientific, Winsford, UK)according to the manufacturer’s instructions. 40 × 106 cells were then transplantedintraperitoneally into 6- to 8-week-old syngeneic C57BL/6 mice. Mice were killed7 days after transplantation.
Mouse immunohistochemistry. H&E-stained histological sections from 33 indi-vidual mice were examined by a board-certified veterinary pathologist blinded tothe identification codes indicating whether the mouse had received vehicle orDAPT. Immunohistochemical staining for human CD20 (1:400; RB-9013; rabbitpolyclonal antibody; Thermo Fisher Scientific, Winsford, UK) was carried outfollowing de-paraffinization and antigen retrieval (20 min at 90 °C) in a PT Link,Pre-Treatment Module for Tissue Specimens utilising Dako Envision Flex TargetAntigen Retrieval Solution High pH (both from Dako Agilent Technologies,Stockport, UK). A routine immunohistochemistry protocol employing an auto-mated system (Dako Autostainer) was followed. Negative control slides weretreated with isotype- and species-matched immunoglobulins. Negative controltissue from a mouse without splenic lesions was obtained from the archives of theDepartment of Veterinary Medicine.
Human immunohistochemistry. Immunohistochemistry was performed on wholeformalin-fixed, paraffin-embedded (FFPE) sections on both lymph node and bonemarrow tissues. Reactions were performed on Leica Bond-III (Leica Microsystems,IL, USA). CD20 (monoclonal mouse anti-human CD20, clone L26, Dako) antibodywas diluted 1:100 with 20 min heat retrieval in 9.0 pH buffer, while the β-catenin(ready to use primary β-catenin antibody, clone 17C2, Leica) antibody was pre-diluted with 20 min heat retrieval in 6.9 pH buffer.
NATURE COMMUNICATIONS | DOI: 10.1038/s41467-018-06069-5 ARTICLE
NATURE COMMUNICATIONS | (2018) 9:3839 | DOI: 10.1038/s41467-018-06069-5 | www.nature.com/naturecommunications 15

Statistical analyses. Statistical analyses of the results were performed by one-wayANOVA followed by Student’s t-test. Throughout the study, statistical significancewas defined as ****p < 0.0001, ***p < 0.001, **p < 0.01, *p < 0.05 or ns (statisticallynon significant).
Data availabilityThe authors declare that the data supporting the findings of this study are available withinthe paper and its supplementary information. The gene expression profile data have beendeposited in the GEO database under accession numbers GSE99724 (Microarrays, Fig. 1)and GSE99614 (RNA-seq, Fig. 3). The mass spectrometry proteomics data have beendeposited to the ProteomeXchange Consortium via the PRIDE partner repository with thedataset identifier PXD010401 and https://doi.org/10.6019/PXD010401. All other remainingdata are available within the article and Supplementary Files, or available from the authorsupon request.
Received: 20 September 2017 Accepted: 31 July 2018
References1. Quesada, V. et al. Exome sequencing identifies recurrent mutations of the
splicing factor SF3B1 gene in chronic lymphocytic leukemia. Nat. Genet. 44,47–52 (2012).
2. Puente, X. S. et al. Whole-genome sequencing identifies recurrent mutationsin chronic lymphocytic leukaemia. Nature 475, 101–105 (2011).
3. Landau, D. A. et al. Evolution and impact of subclonal mutations in chroniclymphocytic leukemia. Cell 152, 714–726 (2013).
4. Wang, L. et al. SF3B1 and other novel cancer genes in chronic lymphocyticleukemia. N. Engl. J. Med. 365, 2497–2506 (2011).
5. Wang, L. et al. Somatic mutation as a mechanism of Wnt/β-catenin pathwayactivation in CLL. Blood 124, 1089–1098 (2014).
6. Gandhirajan, R. K. et al. Small molecule inhibitors of Wnt/beta-catenin/lef-1 signaling induces apoptosis in chronic lymphocytic leukemia cells in vitroand in vivo. Neoplasia 12, 326–335 (2010).
7. Wu, Q.-L., Zierold, C. & Ranheim, E. A. Dysregulation of Frizzled 6 is acritical component of B-cell leukemogenesis in a mouse model of chroniclymphocytic leukemia. Blood 113, 3031–3039 (2009).
8. Hacken, Ten,E. & Burger, J. A. Microenvironment interactions and B-cellreceptor signaling in chronic lymphocytic leukemia: implications for diseasepathogenesis and treatment. Biochim. Biophys. Acta 1863, 401–413 (2016).
9. Kipps, T. J. et al. Chronic lymphocytic leukaemia. Nat. Rev. Dis. Prim. 3,16096 (2017).
10. Jitschin, R. et al. Stromal cell-mediated glycolytic switch in CLL-cells involvesNotch-c-Myc signaling. Blood 125, 3432–3436 (2015).
11. Zhang, W. et al. Stromal control of cystine metabolism promotes cancer cellsurvival in chronic lymphocytic leukaemia. Nat. Cell Biol. 14, 276–286 (2012).
12. Ding, W. et al. Bi-directional activation between mesenchymal stem cells andCLL B-cells: implication for CLL disease progression. Br. J. Haematol. 147,471–483 (2009).
13. Marquez, M.-E., Hernández-Uzcátegui, O., Cornejo, A., Vargas, P. & DaCosta, O. Bone marrow stromal mesenchymal cells induce down regulation ofCD20 expression on B-CLL: implications for rituximab resistance in CLL. Br.J. Haematol. 169, 211–218 (2015).
14. Patel, V., Chen, L. S., Wierda, W. G., Balakrishnan, K. & Gandhi, V. Impact ofbone marrow stromal cells on Bcl-2 family members in chronic lymphocyticleukemia. Leuk. Lymphoma 55, 899–910 (2014).
15. Vogler, M. et al. Concurrent up-regulation of BCL-XL and BCL2A1 inducesapproximately 1000-fold resistance to ABT-737 in chronic lymphocyticleukemia. Blood 113, 4403–4413 (2009).
16. Lutzny, G. et al. Protein kinase c-β-dependent activation of NF-κB in stromalcells is indispensable for the survival of chronic lymphocytic leukemia B cellsin vivo. Cancer Cell. 23, 77–92 (2013).
17. Oostendorp, R. A. J. et al. Stromal cell lines from mouse aorta-gonads-mesonephros subregions are potent supporters of hematopoietic stem cellactivity. Blood 99, 1183–1189 (2002).
18. Ding, W. et al. Platelet-derived growth factor (PDGF)-PDGF receptorinteraction activates bone marrow-derived mesenchymal stromal cells derivedfrom chronic lymphocytic leukemia: implications for an angiogenic switch.Blood 116, 2984–2993 (2010).
19. Oostendorp, R. A. J. et al. Long-term maintenance of hematopoietic stem cellsdoes not require contact with embryo-derived stromal cells in cocultures. StemCells 23, 842–851 (2005).
20. Kurtova, A. V. et al. Diverse marrow stromal cells protect CLL cells fromspontaneous and drug-induced apoptosis: development of a reliable andreproducible system to assess stromal cell adhesion-mediated drug resistance.Blood 114, 4441–4450 (2009).
21. Nwabo Kamdje, A. H. et al. Role of stromal cell-mediated Notch signaling inCLL resistance to chemotherapy. Blood Cancer J. 2, e73 (2012).
22. Méndez-Ferrer, S. et al. Mesenchymal and haematopoietic stem cells form aunique bone marrow niche. Nature 466, 829–834 (2010).
23. Besseyrias, V. et al. Hierarchy of Notch-Delta interactions promoting T celllineage commitment and maturation. J. Exp. Med 204, 331–343 (2007).
24. Lu, D. et al. Activation of the Wnt signaling pathway in chronic lymphocyticleukemia. Proc. Natl. Acad. Sci. USA 101, 3118–3123 (2004).
25. El-Gamal, D. et al. PKC-β as a therapeutic target in CLL: PKC inhibitor AEB071demonstrates preclinical activity in CLL. Blood 124, 1481–1491 (2014).
26. Naito, A. T. et al. Complement C1q activates canonical Wnt signaling andpromotes aging-related phenotypes. Cell 149, 1298–1313 (2012).
27. Zhang, B. et al. Microenvironmental protection of CML stem and progenitorcells from tyrosine kinase inhibitors through N-cadherin and Wnt-β-cateninsignaling. Blood 121, 1824–1838 (2013).
28. Weekes, M. P. et al. Latency-associated degradation of the MRP1 drug transporterduring latent human cytomegalovirus infection. Science 340, 199–202 (2013).
29. Dürig, J. et al. A novel nonobese diabetic/severe combined immunodeficientxenograft model for chronic lymphocytic leukemia reflects important clinicalcharacteristics of the disease. Cancer Res. 67, 8653–8661 (2007).
30. Zhan, T., Rindtorff, N. & Boutros, M. Wnt signaling in cancer. Oncogene 36,1461–1473 (2017).
31. Gutierrez, A. et al. LEF-1 is a prosurvival factor in chronic lymphocyticleukemia and is expressed in the preleukemic state of monoclonal B-celllymphocytosis. Blood 116, 2975–2983 (2010).
32. Khan, A. S. et al. Dishevelled proteins are significantly upregulated in chroniclymphocytic leukaemia. Tumour Biol. 37, 11947–11957 (2016).
33. Chim, C. S., Pang, R. & Liang, R. Epigenetic dysregulation of the Wntsignalling pathway in chronic lymphocytic leukaemia. J. Clin. Pathol. 61,1214–1219 (2008).
34. Kulis, M. et al. Epigenomic analysis detects widespread gene-body DNAhypomethylation in chronic lymphocytic leukemia. Nat. Genet. 44, 1236–1242(2012).
35. Van de Walle, I. et al. Specific Notch receptor-ligand interactions controlhuman TCR-αβ/γδ development by inducing differential Notch signalstrength. J. Exp. Med. 210, 683–697 (2013).
36. Gama-Norton, L. et al. Notch signal strength controls cell fate in thehaemogenic endothelium. Nat. Commun. 6, 8510 (2015).
37. Elowitz, M. B., Santat, L. A. & Nandagopal, N. Cis-activation in the Notchsignaling pathway. Preprint at bioRxiv https://doi.org/10.1101/313171 (2018).
38. Bulla, R. et al. C1q acts in the tumour microenvironment as a cancer-promoting factor independently of complement activation. Nat. Commun. 7,10346 (2016).
39. Hidvégi, T. et al. FN-C1q and C1 INH C1r-C1s complexes as indicators ofcomplement activation in patients with chronic lymphocytic leukaemia.Immunol. Lett. 22, 1–6 (1989).
40. Nowell, C. S. et al. Chronic inflammation imposes aberrant cell fate inregenerating epithelia through mechanotransduction. Nat. Cell Biol. 18,168–180 (2016).
41. Hu, K. et al. Galectin-3 mediates bone marrow microenvironment-induceddrug resistance in acute leukemia cells via Wnt/β-catenin signaling pathway. J.Hematol. Oncol. 8, 1 (2015).
42. Arranz, L. et al. Neuropathy of haematopoietic stem cell niche is essential formyeloproliferative neoplasms. Nature 512, 78–81 (2014).
43. Greenwood, E. J. et al. Temporal proteomic analysis of HIV infection revealsremodelling of the host phosphoproteome by lentiviral Vif variants. eLife 5,12112 (2016).
44. Bichi, R. et al. Human chronic lymphocytic leukemia modeled in mouse bytargeted TCL1 expression. Proc. Natl. Acad. Sci. USA 99, 6955–6960 (2002).
AcknowledgementsWe would like to express our deepest gratitude to patients who donated blood forresearch purposes. In particular, we thank Dr. Joanna Baxter and her team for enrol-ling patients in these studies. We are also grateful for the help of Dr. Marco Galardini forhis bioinformatics support. This work was funded by Cancer Research UK (CRUK;C49940/A17480) and by the Deutsche Forschungsgemeinschaft (DFG, FOR 2033 (pro-jects B3, B6 and B7)). I.R. is a senior CRUK fellow.
Author contributionsM.Ma., F.G., A.M., T.A., M.O., A.S. and G.L-G. planned, performed and analysed allin vitro experiments. NestinGFP mice were provided by S.M-F; L.K-H. performed andanalysed microarray and RNA-seq experiments. P.J.L. and J.C.W. ran and analysedplasma membrane profiling mass spectrometry experiments. J.D., M.Mö. and K.H.performed and analysed the PDX experiments. L.R-B. provided IHC tissue staining fromlymph node and bone marrow biopsies. EL08-1D2 cells were provided by R.A.J.O.Notch2f/f mice and BMSCs from these mice were obtained from U.S. B-cell lymphoma
ARTICLE NATURE COMMUNICATIONS | DOI: 10.1038/s41467-018-06069-5
16 NATURE COMMUNICATIONS | (2018) 9:3839 | DOI: 10.1038/s41467-018-06069-5 | www.nature.com/naturecommunications
lines were originally obtained from L.Staudt and provided by D.H. M.S-S., C.P., D.H. andI.R. contributed conceptually to this work. M.S.S. and I.R. wrote the manuscript.
Additional informationSupplementary Information accompanies this paper at https://doi.org/10.1038/s41467-018-06069-5.
Competing interests: The authors declare no competing interests.
Reprints and permission information is available online at http://npg.nature.com/reprintsandpermissions/
Publisher's note: Springer Nature remains neutral with regard to jurisdictional claims inpublished maps and institutional affiliations.
Open Access This article is licensed under a Creative CommonsAttribution 4.0 International License, which permits use, sharing,
adaptation, distribution and reproduction in any medium or format, as long as you giveappropriate credit to the original author(s) and the source, provide a link to the CreativeCommons license, and indicate if changes were made. The images or other third partymaterial in this article are included in the article’s Creative Commons license, unlessindicated otherwise in a credit line to the material. If material is not included in thearticle’s Creative Commons license and your intended use is not permitted by statutoryregulation or exceeds the permitted use, you will need to obtain permission directly fromthe copyright holder. To view a copy of this license, visit http://creativecommons.org/licenses/by/4.0/.
© The Author(s) 2018
NATURE COMMUNICATIONS | DOI: 10.1038/s41467-018-06069-5 ARTICLE
NATURE COMMUNICATIONS | (2018) 9:3839 | DOI: 10.1038/s41467-018-06069-5 | www.nature.com/naturecommunications 17