L’indice aggregato FEEM SI: obiettivi, metodologia e risultati
NOTA DILAVORO12.2012
Development Finance for Universal Energy Access
By Giorgio Gualberti, Instituto Superior Técnico, Lisbon, Portugal Morgan Bazilian, United Nations Industrial Development Organization, Vienna, Austria Erik Haites, Margaree Consultants,Toronto, Canada Maria da Graça Carvalho, Instituto Superior Técnico, Lisbon, Portugal

The opinions expressed in this paper do not necessarily reflect the position of Fondazione Eni Enrico Mattei
Corso Magenta, 63, 20123 Milano (I), web site: www.feem.it, e-mail: [email protected]
Energy: Resources and Markets Series Editor: Giuseppe Sammarco Development Finance for Universal Energy Access By Giorgio Gualberti, Instituto Superior Técnico, Lisbon, Portugal Morgan Bazilian, United Nations Industrial Development Organization, Vienna, Austria Erik Haites, Margaree Consultants,Toronto, Canada Maria da Graça Carvalho, Instituto Superior Técnico, Lisbon, Portugal Summary The United Nations General Assembly declared 2012 the “International Year of Sustainable Energy for All”, officially recognising the urgent need to put energy at the centre of the global development agenda. In parallel, a strong international policy effort is being made to achieve the goal of universal energy access to modern energy services by 2030. To support these efforts, a dramatic scaling-up of financing to the energy sector will be required through official development aid, other official flows, climate financing and various private flows. In this paper we analyse the recent evolution of development policies and finance for the energy sector using both descriptive and analytical tools. We find that, although development finance for the energy sector rose considerably during the past decade, the financial flows have not been directed towards the countries with the lowest levels of energy access. Keywords: Development Finance, Energy Policy, Energy Access JEL Classification: F35, Q40, O20
Address for correspondence: Giorgio Gualberti Instituto Superior Técnico Technical University of Lisbon Pav. de Mecânica I, 2º Avenida Rovisco Pais 1049-001 Lisboa Portugal E-mail: [email protected]

1
Development Finance for Universal Energy Access
Giorgio Gualberti, Instituto Superior Técnico, Lisbon, Portugal
Morgan Bazilian, United Nations Industrial Development Organization, Vienna,
Austria
Erik Haites, Margaree Consultants,Toronto, Canada
Maria da Graça Carvalho, Instituto Superior Técnico, Lisbon, Portugal
Abstract: The United Nations General Assembly declared 2012 the “International
Year of Sustainable Energy for All”, officially recognising the urgent need to put
energy at the centre of the global development agenda. In parallel, a strong
international policy effort is being made to achieve the goal of universal energy
access to modern energy services by 2030. To support these efforts, a dramatic
scaling-up of financing to the energy sector will be required through official
development aid, other official flows, climate financing and various private flows. In
this paper we analyse the recent evolution of development policies and finance for
the energy sector using both descriptive and analytical tools. We find that, although
development finance for the energy sector rose considerably during the past
decade, the financial flows have not been directed towards the countries with the
lowest levels of energy access.
Keywords: Development Finance; Energy Policy; Energy Access

2
1. Introduction
In the last decade the centrality of energy for the economic, environmental and
social dimensions of sustainable development has been widely recognised and,
accordingly, energy issues have attracted greater attention by the international
community (UNCSD, 2001), (World Bank, 2001) (UN-Energy, 2005) (IEA, 2011b).
Recently, the UN Secretary-General's Advisory Group on Energy and Climate
Change (AGECC) recommended that the international community adopt the two
complementary goals of:
1) Ensuring universal access to modern energy services by 2030
2) Reducing energy intensity by 40 per cent by 2030 (UN-AGECC,
2010).
A third goal of supplying 30% of energy demand from renewable sources by 2030
has also been discussed in international fora for possible inclusion to the next round
of Millennium Development Goals (IISD, 2011). In addition, the UN General
Assembly has approved a resolution establishing 2012 as the “International Year of
Sustainable Energy for All”. Energy issues likely will be central to the negotiations at
the United Nations Conference on Sustainable Development (Rio+20) to be held in
Rio de Janeiro in 2012 (UN, 2010a; UN, 2010b).
Access to modern energy services is very limited in many developing countries. The
number of people lacking access to electricity is estimated to be roughly 1.3 billion,
44% of which are in sub-Saharan Africa and 22% in India. The number of people
without clean cooking facilities is more than twice as large, 2.7 billion, or 39% of the
world population (IEA, 2011b).
The objective of our analysis is to understand to what extent development finance
is being committed to the countries with lower access to modern energy services,

3
and to what purpose, framing the analysis in the historical evolution of the
international assistance for the sector.
Several authors have estimated the investments and financial resources required to
achieve universal energy access (Bazilian et al., 2010b), (IEA et al., 2010), (World
Bank, 2006) (UN-AGECC, 2010). Some of this literature found that existing energy
sector investment flows are not sufficient to provide electricity service to those
who currently lack access – even if all investment was to be directed toward
expanding access (which will not be the case). The financing gap is considerable,
especially for Least Developed Countries (LDCs) which have the lowest access
rates and the greatest difficulty securing financing (Bazilian et al., 2011).
Development finance from bilateral and multilateral donors is an important source
of resources for the energy sector, especially when and where other sources of
financing like domestic savings, foreign direct investment and commercial loans are
limited.
Despite the importance of the energy sector for developing countries (and in
donors’ policies and allocations) there exist few analyses of the characheristics of
development finance for the energy sector: Tirpak and Adams have compiled details
of bilateral and multilateral assistance for the energy sector to 2005, with a focus on
renewable energy sources (Tirpak, Adams, 2008) and the OECD produced a short
pamphlet presenting some statistics on energy aid (OECD, 2010). Neither of these
studies take into account energy access levels.
To address some of the gaps in the literature, we:
review historical trends in the allocation of international assistance to the
energy sector and analyse how they have changed in the light of policy
developments;
compare the distribution of development finance for the energy sector with
an indicator of access to modern energy services during the last decade; and

4
describe the distribution of recent energy commitments by purpose, origin
and destination.
For the analysis we use the most comprehensive project-level statistics available
from the AidData.org database (Tierney et al., 2011) and compare the results with
those obtained using data from the Creditor Reporting System (CRS) of the OECD.
The rest of the paper is divided into four sections: in the second section we discuss
the methodology, indicators and datasets used; in the third we identify three main
periods in the evolution of aid policies for the energy sector and their related
financial commitments; in the fourth section we provide a detailed analysis of the
development finance data for energy after 2000, after which we draw conclusions.
2 Methodology and Data Sources
2.1 Methodology
A large part of the aid literature explores the determinants of aid. Typically these
studies involve multivariate analysis that attempts to relate each donor’s aid
commitments to a series of explanatory variables (e.g. GDP, poverty, commercial
ties, colonial past, governance, geographical position and others) (e.g. (Alberto,
Dollar, 2000) (Collier, Dollar, 2002) (Clist, 2011) (Berthélemy & Tichit, 2004)
(Knack et al., 2010) (Hoeffler, Outram, 2008) (Dollar, Levin, 2006)).
Some studies examine the allocation of aid with respect to sectoral indicators: for
example Thiele and others estimate the coherence of aid commitments to the
MDGs using a set of Tobin models (Thiele et al., 2007); Pitt and others explore the
coherence of aid for the health sector with health indicators using linear regressions
with panel data (Pitt et al., 2010); Baulch utilizes concentration curves and Suits
indexes to compare different donor's allocations with respect to selected MDG
indicators (Baulch, 2006).
The use of multivariate regression is a very well established methodology to
understand the motivations for the level of aid, but concentration curves are a tool

5
that we believe is better suited to examine the distribution of aid among recipient
countries, providing a clear understanding of the share of aid committed to various
quantiles of the reference population and, together with their numerical
counterpart, Suits Indexes1, permit a practical comparison of donor’s behaviors.
Concentration curves and Suits indexes are often used to evaluate the distribution
of international aid with respect to a specific “need indicator" (Koch, 2007)
(Baulch, 2006) (Koch et al., 2007) (Cogneau, Lambert, 2006) (Suwa-Eisenmann,
Verdier, 2007) (Gwatkin et al., 2005) (White, McGillivray, 1995) as well as in the
analysis of health variables against an economic condition (O’' Donnell et al., 2008).
Given that our objective is to examine the distributional aspects of development
finance rather than donor’s motivations, we follow the methodology used by Baulch
(2006) and we compare development finance commitments with energy access
levels using concentration curves and Suits indexes. However, in contrast with
Baulch, we take into consideration only the development finance allocated to one
sector (energy). Annex I provides a detailed explanation of Concentration Curves
and Suits indexes.
2.1.1. Measuring energy access
There is a growing literature on defining and measuring access to modern energy
services (e.g., (Bazilian et al., 2010a) (Pachauri et al., 2004) (Nussbaumer et al.,
2011) (Practical Action, 2010) (Mirza, Szirmai, 2010) (IEA, 2010) (IAEA et al.,
2005)).
For our statistical analysis, we need an indicator that a) has data for a large number
of countries and b) is a clear measure of deprivation of access to modern energy
services. There exist only two energy indicators with almost universal coverage: the
share of population with access to electricity (electrification share) and the installed
1 Suits indexes are a numerical counterpart of the concentration curves and vary between -1 and +1,
with a Suits index of -1 representing finance allocated entirely to the countries with lower energy
access, and vice versa. See Annex I for details.
6
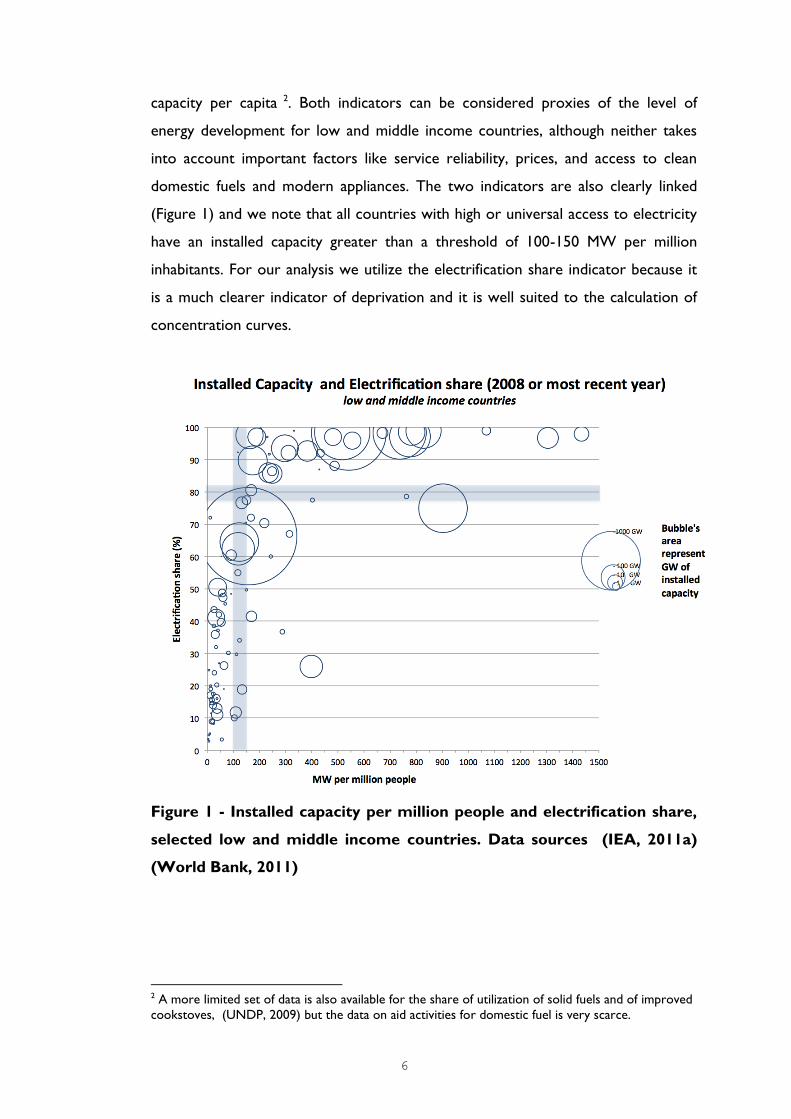
capacity per capita 2. Both indicators can be considered proxies of the level of
energy development for low and middle income countries, although neither takes
into account important factors like service reliability, prices, and access to clean
domestic fuels and modern appliances. The two indicators are also clearly linked
(Figure 1) and we note that all countries with high or universal access to electricity
have an installed capacity greater than a threshold of 100-150 MW per million
inhabitants. For our analysis we utilize the electrification share indicator because it
is a much clearer indicator of deprivation and it is well suited to the calculation of
concentration curves.
Figure 1 - Installed capacity per million people and electrification share,
selected low and middle income countries. Data sources (IEA, 2011a)
(World Bank, 2011)
2 A more limited set of data is also available for the share of utilization of solid fuels and of improved
cookstoves, (UNDP, 2009) but the data on aid activities for domestic fuel is very scarce.

7
2.2 Data sources and limitations
Development finance statistics are coded by sector and purpose3. We limit our
analysis to the “Energy Generation and Supply”4 sector that includes finance for the
purposes of electricity production and distribution, gas and petroleum distribution,
and energy policy and administrative management5 (OECD, 2011) (OECD, 2010).
Some development finance also goes to the upstream fossil fuels and minerals
mining sector 6 (2.2% compared of the total for energy generation and supply for
2000-2009). Although it is linked to the broader energy sector, it is not generally
focused on expansion of energy access and thus is excluded from this analysis.
For similar reasons we have not included development finance for the “forestry for
energy”7 sector (forestry projects for the purposes of producing biomass for energy
use). In addition, finance for this purpose is negligible (0.01% compared to the total
financing for energy, 2000-2009).
We note that household energy use is not well represented in aid statistics. There
are no codes to track aid activities with the specific purpose of raising the
penetration and use of improved stoves. The “Biomass” code (0.3% of the total)
includes both aid activities related to domestic fuels and biomass fuelled power
plants. A search on the title and description of projects found fewer than 100
records (out of 774095) that included the word “stoves” in the title or in the long
description and were related to the diffusion of improved cook stoves after 2000,
including emergency aid. Adding other search keys yielded results in the same order
of magnitude. Clearly further research is needed on the aid activities for household
energy use.
3 The projects are classified with a five – digit coding scheme: the first three digits indicates the
sector and the remaing two the purpose.
4 CRS code 230 5 Development Aid for the "Energy Generation and Supply“ sector refers to the following CRS
compatible purpose codes, 23000, 23005, 23010, 23020, 23030, 23040, 23050, 23061, 23062,
23063, 23064, 23065, 23066, 23067, 23068, 23069, 23070, 23081 and 23082 (OECD, 2008). 6 Under the “Mineral resources and Mining” sector for the purposes of Coal (32261) and Oil and
Gas (32262) 7 CRS purpose code 31261

8
We use the dataset collected and distributed by AidData.org and the OECD - CRS
data for comparison8. Appendix II presents a detailed comparison between the two
datasets. If not otherwise specified, all data presented refers to (Official)
Development Finance - (O)DF - that includes both Official Development
Assistance – ODA - and Other Official flows - OOF - and is expressed at
constant prices (2009) (OECD, 2008)9.
The indicators for electrification rates and population without electricity access are
taken from the IEA Energy Access Database and, when not available, from UNDP10
(IEA, 2011a) (UNDP, 2009).
3. International donors’ policies for the energy sector
Bilateral and multilateral donors have given assistance to the energy sector of
developing countries since the 1940’s11. Since that time, the modalities, scopes and
funding committed to the sector have changed considerably, resulting from, inter
alia, the complex interaction between the evolution of general aid policies, the
transformation of the energy sector and the economic paradigm in both developing
and developed countries (Barnett, 1993) (Bacon, Besant-Jones, 2002).
The influence of donors, and in particular the World Bank Group, has been much
larger than solely financing the development of public infrastructure; it extended to
8 We have utilized the most recent 2.0 AidData Research Release, updated in November 2011 and
the full CRS dataset updated in July 2011. 9 We refer to AidData figures as "Development Finance" rather than "Official Development Finance
ODF" because AidData figures, unlike the OECD's, are not from official sources. The Difference
between OECD ODF and AidData Development Finance is in large part due to additional donors /
recipients in AidData, and to a different treatment of data, especially for multilateral financing. More
details on the differences in Annex II. 10 Energy Access Statistics are available only for lower- middle income countries, but development
finance is allocated also to middle-higher income and transition economies. We have made the
assumption that all OECD, Ex-Soviet Union, Arab States have full electricity coverage if not
otherwise indicated (Albania, Armenia, Azerbaijan, Belarus, Bosnia-Herzegovina, Brunei, Bulgaria,
Croatia, Cyprus, Czech Republic, Estonia, Georgia, Hungary, Israel, Kazakhstan, Korea, Kosovo,
Kyrgyz Republic, Latvia, Lithuania, Macedonia FYR, Maldives, Moldova, Montenegro, Poland, Qatar,
Romania, Russia, Saudi Arabia, Serbia, Singapore, Slovak Republic, Slovenia, Sts Ex-Yugo. Unspec.,
Tajikistan, Turkey, Turkmenistan, Ukraine, Uzbekistan). 11 The first World Bank projects for the electricity sector in developing countries date back to the
‘40s http://go.worldbank.org/QEKNM08HO0. Bilateral donors declared electricity projects in
developing countries since data began being collected, 1973. In 1980 the OECD set up a group of
“Energy Correspondents” and initiated a dialoge on policy issues in aid for energy (Führer, 1996).
9
support for design of energy policies and market organization (Manibog et al., 2003).
Despite the importance of the sector, bilateral and multilateral donors (and
recipients) have not, until very recently, made (successful) attempts to coordinate
energy sector assistance policies establishing shared objectives or modalities
(Karlsson-Vinkhuyzen, 2010).
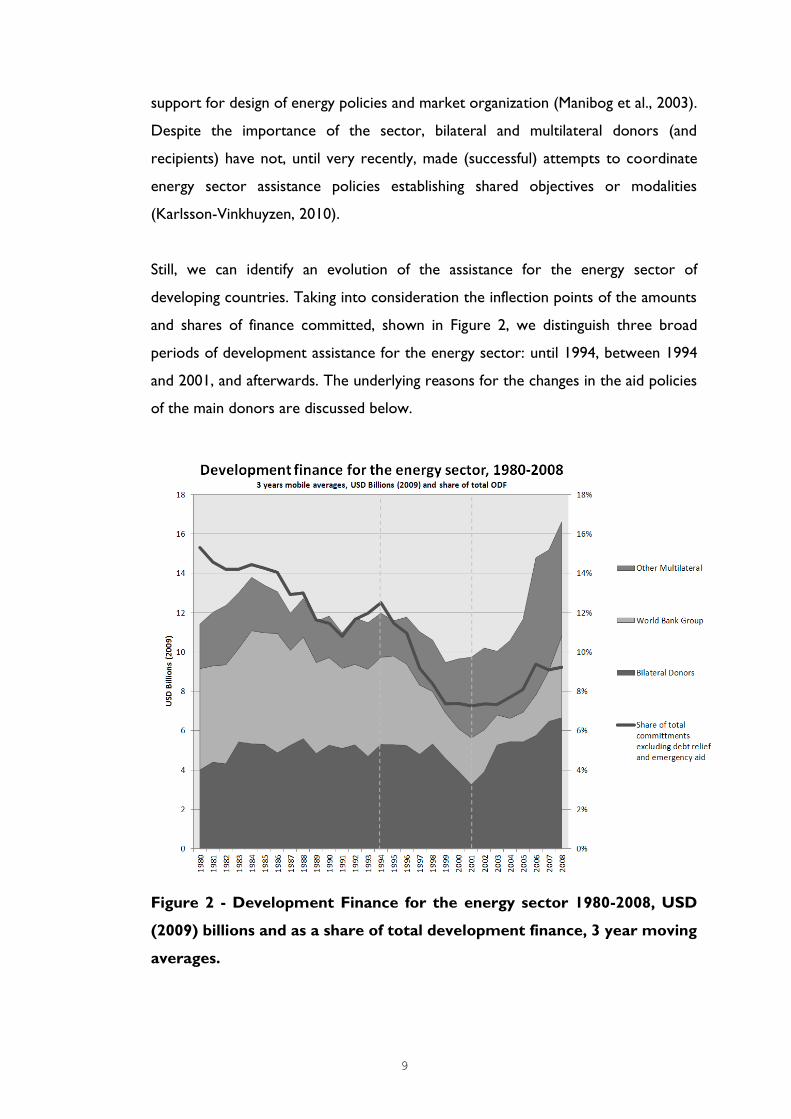
Still, we can identify an evolution of the assistance for the energy sector of
developing countries. Taking into consideration the inflection points of the amounts
and shares of finance committed, shown in Figure 2, we distinguish three broad
periods of development assistance for the energy sector: until 1994, between 1994
and 2001, and afterwards. The underlying reasons for the changes in the aid policies
of the main donors are discussed below.
Figure 2 - Development Finance for the energy sector 1980-2008, USD
(2009) billions and as a share of total development finance, 3 year moving
averages.

10
During the first period we identify (1980-1994) the amount committed yearly to the
energy sector of developing countries was relatively constant between 11 and 13
USD billion (2009$), representing between 11% and 15% of the total
commitments12; at that time one third of the financing was provided by the World
Bank Group.
The dominant model for the industry at the time was that of state-owned
monopolistic utilities although - by the end of the eighties – some countries had
begun to restructure their electricity sector and the World Bank started to
reconsider the modalities of its energy financing (Sioshansi, 2006) (Munasinghe et al.,
1988).
The second period we identify (1994-2001) is characterized by a rapid reduction in
Development Finance – in particular from the WBG and bilateral donors - and by
the contemporary worldwide diffusion of energy sector reforms (Helm, 2007)
(Hogan, 2002).
The World Bank Group reduced its total commitments from more than 4 USD
billion (2009$) in 1993 to less than 2 billion in 2000, due to the entry in force of a
new lending policy that, starting from 1993, focused on creating the conditions for
private investment rather than directly financing energy utilities13 and also due to
the then prevailing belief that efforts to expand energy access in rural areas were
not repaying their costs (World Bank, 1995) (World Bank, 1993).
In this period the Bank concentrated up to 90% of its financing in countries that
were implementing reforms14 (Manibog et al., 2003), rapidly adopted by more than
12 The OECD estimates that the coverage of Aid Statistics constantly improved over time, from 70%
in the mid 90’s to more than 90% in the ‘00s. The data related to the ‘80s therefore have to be used
with caution (OECD), the same warning applies to the AidData database that is in large part based
on OECD. 13 The amount of private capital invested in developing countries rose considerably between 1990
and the Asian Financial Crisis of 1997 (albeit the private flows were concentrated in relatively few
countries). After 1997 however private flows fell by 75% and never recovered, leaving many
developing countries in this period with diminished investment for their energy sector, both from
public and private sources (Besant-Jones, 2006). 14 The World Bank Evaluation Department notes that the reform package evolved over time and it
comprehended 7 main areas: (i) commercialization; (ii) corporatization; (iii) arm’s-length regulation;
(iv) unbundling; (v) private participation in production (greenfield and divestiture); (vi) private
11
80 developing and transition countries but not without encountering obstacles or
criticisms that in some cases led to their reversal (Manibog et al., 2003)
(Rosenzweig et al., 2004) (ESMAP, 2005) (Yi-chong, 2006) (Williams, Ghanadan,
2006) (Singh, 2006) (Voll et al., 2006) (Sioshansi, 2006) (Douglas, 2006) (Jamasb,
2006) (Prasad, 2008) (Gualberti et al., 2009).
The decrease of bilateral finance between 1994 and 2001 is linked both to internal
developments inside Japan – the main bilateral donor15 - and to the fact that policy
changes at the World Bank have had a guidance effect on the behaviour of many
bilateral donors (The Institute of Development Studies, 2003).
We identify a third period beginning in 2000-2001, when development finance again
started to rise both in absolute terms and as a share compared of total (Figure 2).
Although these inflection points are not caused by a single event, we note that just
after the establishment of the Millennium Development Goals (MDGs) – that
ignored the energy theme - the international agenda rapidly expanded to include a
multitude of initiatives that stressed the central role of access to modern energy
services to reach the MDGs and reduce poverty (e.g. the 9th, 14th and 15th sessions
of the UN Commission on Sustainable development, The World Summit on
Sustainable Development in Johannesburg, with its implementation plan (JPOI) and
its Partnerships, the formation of UN-Energy, the recommendations of the AGECC
and the designation of the International Year of Sustainable Energy for All16)
participation in transmission and distribution (greenfield and divestiture); and (vii) building
competitive markets in production, transmission and distribution. It also notes that the main
outcomes have been of three types: 1) introduction of Independent Power Producers (IPPs), 2)
privatization of the integrated enterprise and 3) unbundling the monopolistic enterprise and
privatization of its segments (Manibog et al., 2003).
15 Japan has always been the main bilateral donor for the sector. In the first half of the ‘90s Japan
increased its commitments for the energy sector almost threefold until peaking in 1995, more than
compensating a concomitant reduction in German, French and Italian aid. In the second half of the
nineties Japanese aid quickly fell to the levels of the eighties, bringing down considerably the total
bilateral commitments. Analysing Japanese aid for the energy sector Yamaguchi notes that on several
occasions between 1989 and 1992 Japan declared its intention to expand aid in environmental areas
(including energy) and that the decrease in the commitments at the end of the decade is probably to
be attributed to Japanese economic crisis of those years (Yamaguchi, 2005).
16 On those occasions (and many others) a great deal of attention has also been devoted to the
environmental aspects of the use of energy, its linkages with climate policies and the promotion of
renewable energy sources and energy efficiency through climate and development finance (Tirpak,

12
(UNCSD, 2001) (WSSD, 2002) (UN-Energy, 2005) (IISD, 2007; IISD, 2006) (UN-
AGECC, 2010) (Karlsson-Vinkhuyzen, 2010) (UNDESA).
During this third period the assistance policies of the Bank moved to a more
integrated approach initially with the “Fuel for thought” (1999) energy strategy and
the Energy Program of 200117 followed by a Guidance note in 2004 that
reconsidered the role of public utilities. The more recent developments in the
Bank’s policies for the energy sector are contained in the Sustainable Infrastructure
Action Plan18 (2008) and the latest Energy Strategy Approach, that underwent public
consultations in 2010-2011 (World Bank, 2001) (World Bank, 1999) (World Bank,
2004) (World Bank, 2008) (World Bank, 2009).
All these international policy activities are linked to the recovery of development
finance from the slump of the previous decade. The amount committed in the first
decade of the new millennium, is rising quickly and reached the record levels of
more than 16 USD billion in 200919.
In the next section we try to answer the question of how these flows have been
allocated and to what purposes.
4 - Analysis of the distribution of the financing flows for the energy sector
(2000-2009)
4.1 Distribution by share of access
We analysed the distribution of Development Finance for the energy sector
between 2000 and 2009 and we find that energy is not prioritised in donors’
Adams, 2008). However Michaelowa and Michaelowa tested for correlation between climate policy
development and ODA for renewable energy and energy efficiency and found no positive correlation
(Michaelowa, Michaelowa, 2010). 17 The 2001 document remained an informal document, but had nevertheless an important impact
inside the Bank. 18 That included the principles of 1) economic and financial sustainability, 2) social inclusion and 3)
local and global environmental sustainability 19 For 2009 the CRS points to a record commitments of 19.6 USD billion, while AidData figures for
the same year is 16.8 USD billion. See Annex I for a comparison between the two datasets.

13
commitments to low electrification countries. In fact, more than 65% of the total
Energy Sector Development Finance is committed to countries with an
electrification level higher than 75% (Table 1). Countries with low electrification
share (i.e. where less than 50% of the households have access to electricity) are
home to around 54% of the world population without access to electricity but less
than 15% of the total financing for energy is committed to them. The energy
commitments as a share of total development finance is only 5.4% for low access
countries, against a share of 10.4% for high electrification countries. Thus it seems
clear that the level of energy access was not a principal metric for donor decision
making.
Recipient Countries
by Electrification Level
Low
Mid
(excluding
India)
India High Other
Countries
Regional
and
global
flows
Total
<50% 50-75% 75% >75% not
available -
Population without
electricity access 707.5 239.4 288.8 68.2 - - 1304.0
Share of world
population without
access 54.3% 18.4% 22.1% 5.2% - - -
Total development
finance committed
2000-2009 energy
sector (Billions of
2009 USD)
18.1 8.5 10.0 80.7 0.1 6.4 123.8
Share of development
finance for energy
committed to each
country group
14.6% 6.9% 8.1% 65.2% 0.1% 5.1% 100%
Share of energy
commitments over
total (excluding
emergency aid and
debt relief)
5.8% 7.2% 15.0% 10.4% 1.0% 2.8% 8.2%
Table 1 – Distribution of Development Finance by group of countries and
number of people without access to electricity. Shares and totals 2000-
2009 in 2009 USD billion, based on AidData.org.
14
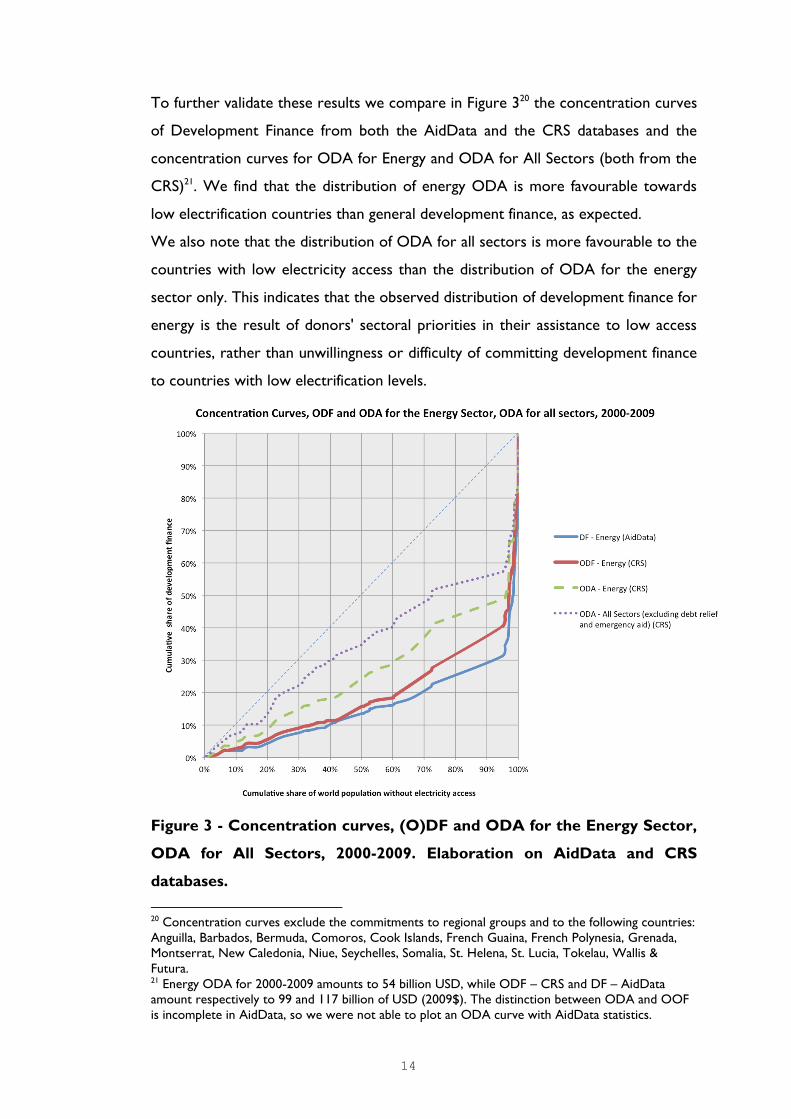
To further validate these results we compare in Figure 320 the concentration curves
of Development Finance from both the AidData and the CRS databases and the
concentration curves for ODA for Energy and ODA for All Sectors (both from the
CRS)21. We find that the distribution of energy ODA is more favourable towards
low electrification countries than general development finance, as expected.
We also note that the distribution of ODA for all sectors is more favourable to the
countries with low electricity access than the distribution of ODA for the energy
sector only. This indicates that the observed distribution of development finance for
energy is the result of donors' sectoral priorities in their assistance to low access
countries, rather than unwillingness or difficulty of committing development finance
to countries with low electrification levels.
Figure 3 - Concentration curves, (O)DF and ODA for the Energy Sector,
ODA for All Sectors, 2000-2009. Elaboration on AidData and CRS
databases.
20 Concentration curves exclude the commitments to regional groups and to the following countries:
Anguilla, Barbados, Bermuda, Comoros, Cook Islands, French Guaina, French Polynesia, Grenada,
Montserrat, New Caledonia, Niue, Seychelles, Somalia, St. Helena, St. Lucia, Tokelau, Wallis &
Futura. 21 Energy ODA for 2000-2009 amounts to 54 billion USD, while ODF – CRS and DF – AidData
amount respectively to 99 and 117 billion of USD (2009$). The distinction between ODA and OOF
is incomplete in AidData, so we were not able to plot an ODA curve with AidData statistics.
15
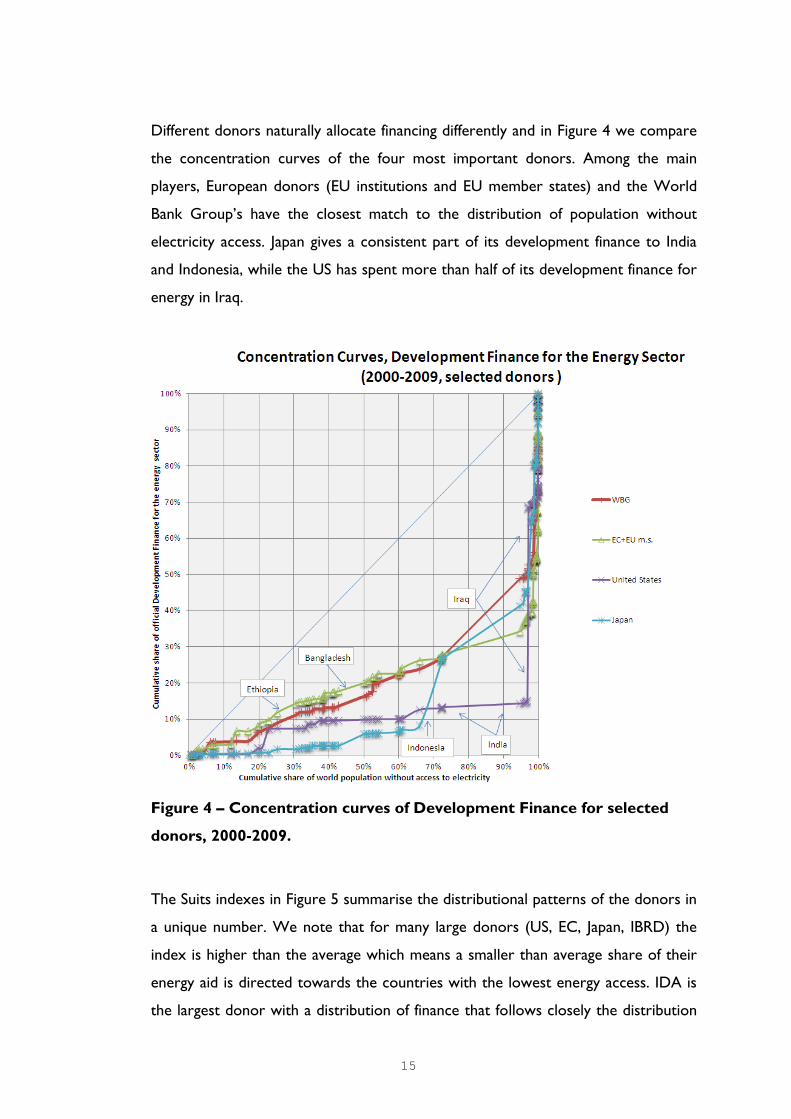
Different donors naturally allocate financing differently and in Figure 4 we compare
the concentration curves of the four most important donors. Among the main
players, European donors (EU institutions and EU member states) and the World
Bank Group’s have the closest match to the distribution of population without
electricity access. Japan gives a consistent part of its development finance to India
and Indonesia, while the US has spent more than half of its development finance for
energy in Iraq.
Figure 4 – Concentration curves of Development Finance for selected
donors, 2000-2009.
The Suits indexes in Figure 5 summarise the distributional patterns of the donors in
a unique number. We note that for many large donors (US, EC, Japan, IBRD) the
index is higher than the average which means a smaller than average share of their
energy aid is directed towards the countries with the lowest energy access. IDA is
the largest donor with a distribution of finance that follows closely the distribution

16
of people without access. India also presents a distribution of finance skewed
towards low access countries. The donor that allocates its energy aid in the most
pro electricity–access way is Portugal (whose commitments however amounted to
0.25% of total energy aid).
In analyzing the Suits indexes and the concentration curves it must be remembered
that many multilateral donors have a mandate to assist a specified group of
countries. Suits indexes and concentration curves should be interpreted as a
photograph of global development finance for the energy sector. They do not
involve a value judgment about the donors, or the quality of their financing
activities. The aid they provide and how it is allocated is obviously influenced by
many factors whose analysis is outside the scope of this paper.

17
Figure 5 - Suits Indexes for energy related Development Finance
committed between 2000 and 2009 and share of commitments of total
energy Development Finance.

18
4.2. Distribution by purpose, donor and type
Commitments for the energy sector are composed of funding for a variety of
purposes, and although there is not a specific category to identify actions to expand
electricity access, it is worth noting that the funding for electricity transmission and
production is around the 60% of the total, to which must be added a portion of the
funding for projects with multiple purposes (mainly from the WBG) that amount to
more than 20% of the total for low electricity access countries (Table 2).
All countries Low Electricity
Access Countries
(<50%)
Electrical transmission and distribution 24.4% 26.7%
Energy Policy and administrative
management
20.5% 17.5%
Power Generation - non renewable
energy sources
19.2% 15.0%
Power Generation - renewable energy
sources
12.3% 10.9%
Hydro and geothermal Energy 4.5% 6.1%
Gas and Petroleum distribution and
storage
3.8% 0.1%
Nuclear Power & Nuclear Safety 2.5% 0.7%
Energy Education and Research 0.3% 0.2%
Biomass and Biofuels 0.3% 0.6%
Multiple purposes or unspecified 12.2% 22.4%
Table 2 - Development Finance for the Energy Sector by Purpose and
Group of recipient countries, 2000-2009. Shares of total energy funding.
The major donors have remarkably different distributions of the purpose of their
financing for the energy sector (Figure 6). For example Japan – the largest bilateral
donor – directs a large share of its funding to non-renewable energy sources (but

19
also a high share in Hydro and Geothermal), while EU Member States (of which
Germany represents roughly half the total) tends to finance other types of
renewable energy sources (solar and wind, above all). The EU Institutions have a
very large share of aid for energy policy and administrative management, while the
US delivers a large part of their aid to electricity transmission projects, in addition
to being the most important donor in the nuclear energy sector. The World Bank
Group also invests significant resources in electricity transmission and renewable
energy sources but, due to its tendency to finance large projects with many
different components, it has a high share of financing for which it has been
impossible to assign a unique purpose.
Figure 6 - Development Finance by donor and purpose, shares of total
2000-2009 in 2009 USD .

20
5. Conclusions
Our study analysed the distribution of donor countries financial commitments for
the energy sector with the objective of understanding their characteristics in
comparison with levels of access to electricity service in developing countries.
We framed the analysis in the historical development of donor policies for the
energy sector, identifying three broad periods. We compared the distribution of
development finance of all donors against an indicator of access to electricity in
recipient countries using concentration curves and Suits Indexes. There are some
limitations to our analysis: the first is that not all development finance is devoted to
expanding access even in countries with low access levels, the second is that
although the electrification share can be considered a good proxy of energy
development of a country, there are many electricity related factors that are equally
important like, inter alia, reliability of service, prices, state of infrastructure,
institutional setting, environmental and social concerns, energy security and
economic sustainability. The use of an electricity indicator, while justified by the fact
that great part of energy-related development finance is related to the electricity
sector, excludes from the analysis the important issue of access to modern
domestic fuels and appliances, for which further research is clearly needed. Finally,
recent progress in both aid statistics and energy indicators is extremely important
but further refinement is still required for more insightful analysis.
Our main finding is that energy access is not a priority among the many concerns
for donor funding. Low-electrification countries (i.e., the countries where less than
50% of households have access to electricity) comprise 54% of the 1.3 billion people
without access, but receive less than 15% of the total energy-related development
finance for the sector.
There are of course many factors that influence each donor’s allocation of
development assistance. Nevertheless, the current pattern seems to indicate that
less development finance is channelled into the energy sectors of the countries with
the lowest levels of energy access. If international efforts to improve energy access
are to be successful, this pattern will need to change or supplemental and
hypothecated funds will be required.

21
Acknowledgments:
The authors would like to thank Andrew Barnett (The Policy Practice), Katharina
Michaelowa (University of Zurich), Maria Yetano Roche (Wupperthal Institute),
Patrick Nussbaumer (UNIDO), Luke Murray (Primal Renewable Energies) and
Robert Mosolgo (AidData) for their valuable suggestions and kind support. All
remaining errors are responsibility of the authors.
Disclaimer:
This document has been produced without formal United Nations editing.
Responsibility for the opinions expressed rests solely with the authors. The views
expressed in this document do not necessarily reflect the views of the Secretariat of
the United Nations Industrial Organization.
The designations employed, descriptions and classifications of countries, and the
presentation of this document do not imply the expression of any opinion
whatsoever on the part of the Secretariat of the United Nations Industrial
Development Organization (UNIDO) concerning the legal status of any country,
territory, city or area or of its authorities, or concerning the delimitation of its
frontiers or boundaries, or its economic system or degree of development. Terms
such as “developed”, “industrialized” and “developing” are intended for statistical
convenience and do not necessarily express a judgement. Any indication of, or
reference to, a country, institution or other legal entity does not constitute an
endorsement.
List of Acronyms:
AFDB - African Development Bank
AFDF - African Development Fund
AFESD - Arab Fund for Economic and Social Development
ASDB - Asian Development Bank
ASDF - Asian Development Fund

22
BADEA - Arab Bank for Economic Development in Africa
CAF - Comunidad Andina de Fomento – Development Bank of Latin America
CDB - Caribbean Development Bank
CRS – Creditor Reporting System of the OECD
EBRD - European Bank for Reconstruction and Development
EC - European Communities
GEF - Global Environment Fund
IADB - Inter American Development Bank
IBRD - International Bank for Reconstruction and Development
IDA - International Development Agency
IFC - International Finance Corporation
ISDB - Islamic Development Bank
LDCs – Least Developed Countries (UN Latest Official Definition)
NADB - North American Development Bank
NDF - Nordic Development Fund
OECD – Organization for Economic Co-Operation and Development
OPEC - Organization of Petroleum Exporting Countries
SSA – Sub Saharan Africa Countries
UNDP - United Nations Development Program
WBG – World Bank Group

23
References
Alberto, A.; Dollar, D. (2000). Who Gives Foreign Aid to Whom and Why.
Journal of Economic Growth 5, 33-63.
Bacon, R.W.; Besant-Jones, J. (2002). Global Electric Power Reform, Privatization
and Liberalization of the Electric Power Industry in Developing Countries. Energy
& Mining Sector Board Discussion Paper Series
Barnett, A. (1993). Aid donor policies and power sector performance in
developing countries. Energy Policy 21, 100-113.
Baulch, B. (2006). Aid distribution and the MDGs. World Development 34, 933-
950.Elsevier
Bazilian, M.; Nussbaumer, P.; Gualberti, G.; Haites, E.; Levi, M.; Siegel, J.; Kammen,
D.M.; Fenhann, J. (2011). Informing the Financing of Universal Energy Access: An
Assessment of Current Financial Flows. The Electricity Journal Elsevier
Bazilian; Nussbaumer; Cabraal; Centurielli; Detchon Reid (2010a). Measuring
Energy Access: Supporting A Global Target. The Earth Institute - Columbia
University - Expert group meeting held at Columbia University, New York, 31 March
2010
Bazilian; Nussbaumer; Haites; Levi; Howells; Yumkella (2010b). Understanding the
Scale of Investment for Universal Energy Access. Geopolitics of Energy 32
Besant-Jones, J.E. (2006). Reforming Power Markets in Developing Countries:
What Have We Learned? (The World Bank; Energy and Mining Sector Board).
Clist (2011). 25Years of Aid Allocation Practice: Whither Selectivity? Energy Policy
39, 1724 -
1734.http://www.sciencedirect.com/science/article/pii/S0305750X1100101X
Cogneau; Lambert (2006). L'aide au développement et les autres flux nord-sud:
Complémentarité ou substitution ? OECD Development Centre Working Papers, No.
251, OECD Publishing. http://www.oecd-ilibrary.org/development/l-aide-au-
developpement-et-les-autres-flux-nord-sud_424111731107
Collier, P.; Dollar, D. (2002). Aid allocation and poverty reduction. European
Economic Review 46, 1475-1500.Elsevier
Dollar, D.; Levin, V. (2006). The increasing selectivity of foreign aid, 1984-2003.
World Development 34, 2034-046.Elsevier

24
Douglas, J.B. (2006). Power Sector Reform in Developing Countries: A Return to
Basics. The Electricity Journal 19, 63-70.Elsevier
Dyer; Anderlini (2011). China’s lending hits new heights
Financial Times January 17, 2011http://www.ft.com/cms/s/0/488c60f4-2281-11e0-
b6a2-00144feab49a.html#axzz1SjoFxxoN
EIA (2011). International Energy Statistics
ESMAP (2005). Power Sector reform in Africa: Assessing Impact on Poor People
The World Bank
Führer, H. (1996). The story of official development assistance. A History of the
Development Assistance Committee and the Development Co-operation
Directorate in Dates, Names and Figures. Organisation for Economic Co-
operation and Development, Paris
Gualberti; Alves; Micangeli; da Graça Carvalho, M. (2009). Electricity privatizations
in Sahel: A U-turn? Energy Policy 37, 4189-4207.Elsevier
Gwatkin, D.R., Wagstaff, A., and Yazbeck, A. (2005). Reaching the poor with
health, nutrition, and population services: what works, what doesn't, and why
(World Bank Publications).
Helm, D. (2007). The new energy paradigm (Oxford: Oxford University Press).
Hoeffler, A.; Outram, V. (2008). What Determines the Allocation of Aid? The
Centre for the Study of African Economies Working Paper Series , 299.bepress
Hogan, W.W. (2002). Electricity market restructuring: reforms of reforms. Journal
of Regulatory Economics 21, 103-132.Springer
IAEA; IEA; UNDESA; EUROSTAT; European Environment Agency (2005). Energy
Indicators for Sustainable Development: Guidelines and Methodologies.
IEA (2010). World Energy Outlook 2010. Paris. International Energy Agency.
IEA (2011a). Electricity Access Database
IEA (2011b). Energy for all - Financing access for the poor. Special early excerpt of
the World Energy Outlook 2011
IEA; UNDP; UNIDO (2010). Energy Poverty: How to make modern energy access
universal? excerpt of the world energy outlook 2010.
http://siteresources.worldbank.org/DEVCOMMINT/Documentation/21046509/DC
2006-0012(E)-CleanEnergy.pdf
25
IISD (2006). Summary of the 14th Session of the Commission on Sustainable
Development
IISD (2007). Summary of the 15th Session of the Commission on Sustainable
Development
IISD (2011). Summary of the Vienna Energy Forum: 21-23 June 2011
http://www.iisd.ca/ymb/energy/vef/2011/html/ymbvol93num11e.html
Jamasb, T. (2006). Between the state and market: Electricity sector reform in
developing countries. Utilities Policy 14, 14-30.Elsevier
Kakwani, N.C. (1977). Applications of Lorenz Curves in Economic Analysis.
Econometrica 45, 719-727.The Econometric
Societyhttp://www.jstor.org/stable/1911684
Karlsson-Vinkhuyzen, S.I. (2010). The United Nations and global energy
governance: past challenges, future choices. Global Change, Peace & Security
22, 175-195.Routledge
Knack, S.; Rogers, H.; Eubank, N. (2010). Aid Quality and Donor Rankings', World
Bank Policy Research Working Paper. Washington, DC
Koch (2007). Blind Spots on the map of Aid Allocations - Concentration and
Complementarity of International NGO Aid. . United Nations University - UNU
WIDER Research Paper 2007/45
Koch, D.J.; Westeneng, J.; Ruben, R. (2007). Does marketisation of aid reduce the
country-level poverty targeting of private aid agencies? The European Journal of
Development Research 19, 636-657.Routledge
Manibog, Dominguez, and Stephan (2003). Power for Development - A review of
the World Bank Group’s Experience with Private Participation in the Electricity
Sector (Washington D.C.: World Bank Operation Evaluation Department).
Michaelowa, A.; Michaelowa, K. (2010). Old Wine in New Bottles? The Shift of
Development Aid towards Renewable Energy and Energy Efficiency. Center for
Comparative and International Studies (CIS)
Mirza, B., and Szirmai, A. (2010). Towards a new measurement of energy poverty:
A cross-community analysis of rural Pakistan (UNU-MERIT, Maastricht Economic
and Social Research and Training Centre on Innovation and Technology).
Munasinghe, M., Gilling, J., and Mason, M. (1988). A review of World Bank lending
for electric power (World Bank).

26
Nussbaumer, P.; Bazilian, M.; Modi, V.; Yumkella, K.K. (2011). Measuring Energy
poverty: Focusing on What Matters. OPHI working paper no.42
OECD User’s Guide to the CRS Aid Activities database.
www.oecd.org/dac/stats/crsguide
OECD (2008). OECD glossary of statistical terms (Organisation for Economic Co-
operation and Development).
OECD (2010). Measuring Aid for Energy www.oecd.org/dac/stats/energy
OECD (2011). Purpose Codes: sector classification.
O’' Donnell, O.; van Doorslaer, E.; Wagstaff, A.; Lindelow, M. (2008). Analyzing
Health Equity Using Household Survey Data: A Guide to Techniques and their
Implementation (2008) Washington. DC: The World Bank ch.7 Concentration
Curves
Pachauri, S.; Mueller, A.; Kemmler, A.; Spreng, D. (2004). On Measuring Energy
Poverty in Indian Households. World Development 32, 2083 - 2104.
Pitt, C.; Greco, G.; Powell-Jackson, T.; Mills, A. (2010). Countdown to 2015:
assessment of official development assistance to maternal, newborn, and child
health, 2003–08. Lancet 376, 1485 -
1496.http://www.sciencedirect.com/science/article/pii/S0140673610613025
Practical Action (2010). poor people's energy outlook 2010
Prasad, G. (2008). Energy sector reform, energy transitions and the poor in Africa.
Energy Policy 36, 2806-811.Elsevier
Rosenzweig, M.B.; Voll, S.P.; Pabon-Agudelo, C. (2004). Power Sector Reform:
Experiences from the Road. The Electricity Journal 17, 16-28.Elsevier
Singh, A. (2006). Power sector reform in India: current issues and prospects.
Energy Policy 34, 2480-490.
Sioshansi, F.P. (2006). Electricity Market Reform: What Have We Learned? What
Have We Gained? The Electricity Journal 19, 70 - 83.
Suits, D.B. (1977). Measurement of Tax Progressivity. The American Economic
Review 67, 747-752.American Economic
Associationhttp://www.jstor.org/stable/1813408
Suwa-Eisenmann, A.; Verdier, T. (2007). Aid and trade. Oxford Review of
Economic Policy 23, 481.Oxford Univ Press

27
The Institute of Development Studies (2003). Energy, Poverty and Gender: a
Review of the Evidence and Case Studies in Rural China - A Report for the World
Bank
Thiele, R.; Nunnenkamp, P.; Dreher, A. (2007). Do donors target aid in line with
the millennium development goals? A sector perspective of aid allocation. Review
of World Economics 143, 596-630.Springer
Tierney, M.J.; Nielson, D.L.; Hawkins, D.G.; Timmons Roberts, J.; Findley, M.G.;
Powers, R.M.; Parks, B.; Wilson, S.E.; Hicks, R.L. (2011). More Dollars than Sense:
Refining Our Knowledge of Development Finance Using AidData. World
Development Elsevier
Tirpak, D.; Adams, H. (2008). Bilateral and multilateral financial assistance for the
energy sector of developing countries. Climate Policy 8, 135-151.Earthscan
UN (2010a). International Year of Sustainable Energy for All - Resolution adopted
by the General Assembly - A/RES/65/151 - 20 Dec. 2010 - . http://daccess-
ods.un.org/access.nsf/Get?Open&DS=A/RES/65/151&Lang=E
UN (2010b). Progress to date and remaining gaps in the implementation of the
outcomes of the major summits in the area of sustainable development, as well as
an analysis of the themes of the Conference - Report of the Secretary-General .
Preparatory Committee for the United Nations Conference on Sustainable
Development First session 17-19 May 2010
UN-AGECC (2010). Energy for a Sustainable Future - Summary Report and
Recommendations
UNCSD (2001). Commission on Sustainable Development - Report on the Ninth
session - 5 May 2000 and 16-27 April 2001
http://www.un.org/esa/sustdev/csd/ecn172001-19e.htm
UNDESA Partnerships for Sustainable Development - CSD Partnerships Database.
http://webapps01.un.org/dsd/partnerships/public/partnerships/title_all_1.html
UNDP (2009). The Energy Access Situation in Developing Countries UNDP
UN-Energy (2005). The Energy Challenge for Achieving the Millennium
Development Goals United Nations
Voll, S.P.; Rosenzweig, M.B.; Pabon-Agudelo, C. (2006). Power Sector Reform: Is
There a Road Forward? The Electricity Journal 19, 24-37.Elsevier

28
White, H.; McGillivray, M. (1995). How Well is Aid Allocated? Descriptive
Measures of Aid Allocation: A Survey of Methodology and Results. Development
and Change 26, 163-183.Blackwell Publishing Ltdhttp://dx.doi.org/10.1111/j.1467-
7660.1995.tb00547.x
Williams, J.H.; Ghanadan, R. (2006). Electricity reform in developing and transition
countries: A reappraisal. Energy 31, 815-844.Elsevier
World Bank (1993). The World Bank's Role in the Electric Power Sector -
Policies for Effective Institutional, Regulatory, and Financial Reform - World Bank
Policy Paper No. 11676
World Bank (1995). Rural Electrification: a Hard look at Costs and Benefits.
Operations Evaluation Department
World Bank (1999). Fuel for Thought - an environmental strategy for the energy
sector (
World Bank (2001). The World Bank Group's Energy Program: Poverty
Reduction, Sustainability And Selectivity World Bank
World Bank (2004). Public and Private Sector Roles in the Supply of Electricity
Services World Bank
World Bank (2006). An Investment Framework for Clean Energy and
Development: A progress report. DC2006-0012
World Bank (2008). Sustainable Infrastructure Action Plan - FY 2009-2011
World Bank (2009). Energy Strategy Approach Paper
World Bank (2011). World Development Indicators.
WSSD (2002). Johannesburg Declaration on Sustainable Development - From our
origins to the future .
http://www.un.org/esa/sustdev/documents/WSSD_POI_PD/English/POI_PD.htm
Yamaguchi, H. (2005). Assessing the Sustainability of Japan’s Foreign Aid Program:
An Analysis of Development Assistance to Energy Sectors of Developing
Countries. Bulletin of Science, Technology & Society 25, 412.Sage Publications
Yi-chong, X. (2006). The myth of the single solution: electricity reforms and the
World Bank. Energy 31, 802-814.Elsevier
Yitzhaki, S.; Olkin, I. (1991). Concentration Indices and Concentration Curves.
Lecture Notes-Monograph Series 19, 380-392.Institute of Mathematical
Statisticshttp://www.jstor.org/stable/4355687

29
Appendix I – Concentration curves and Suits Indexes
Concentration Curves
A concentration curve is conceptually similar to a Lorenz curve, although it involves
the addition of another ranking variable (Yitzhaki, Olkin, 1991; Kakwani, 1977). To
understand if the financing for the energy sector is allocated to the countries that
“need it most” we plot the cumulative share of development finance committed to
the energy sector (vertical axis) against the cumulative share of population without
access to modern energy over the world total (horizontal axis). To build the graph
we order the countries in terms of a ranking variable (i.e. the electrification share)
starting from the country with the lowest share. The graph is divided diagonally by a
45º line that represents the hypothetical distribution of aid that is allocated in direct
proportion to the share of the world’s people without access to electricity.
Thus, if the curve is above the 45º line, it shows that the aid is allocated to the
countries that have less access to modern energy. In the opposite case, a curve
below the 45o line shows that the financing flows tend to be directed more towards
countries with higher levels of energy development. Relative distributions of
different donors can be easily compared graphically. As an example, Figure 2
presents a comparison of the concentration curves of the International
Development Agency (IDA) and of the International Bank for Reconstruction and
Development (IBRD), the two branches of the World Bank Group dedicated to
finance respectively lower and middle-income countries.

30
Figure 7- Comparison of the IDA and IBRD concentration curves, 2000-
2009. IDA is dedicated to financing the poorest countries and its
concentration curve indicates - as expected - that its financing is directed
more to the countries with low levels of energy access than IBRD, whose
activities are directed to middle income countries that have higher levels
of energy access.
Suits Indexes
Concentration curves have a numerical counterpart, Suits indexes
A Suits index is an analogue of the Gini coefficient but varies between -1 and +1
(Suits, 1977). A Suits index of -1 represents aid allocated entirely to the poorest
country (in our case to the country with the lowest electrification rate), while a
Suits index of +1 represents a distribution of aid exclusively to the country with the
highest (universal) electricity access. A Suits index of 0 represents a distribution
along the 45º line. Suits indexes are a practical tool to compare the aid distribution

31
of different donors, or to compare the evolution of the distribution patterns over
time.
However the Suits index, like the Gini coefficient, can produce ambiguous results
when two concentration curves (or Lorenz curves) cross. The Suits index is able to
summarize an important part of information in one unique number but should not
be used as the only criterion to analyse the equality of a distribution.
The Suits index for a discrete distribution is calculated with Sd = 1 - pi (CA i +CA
i -1) where: Sd is the Suits index for the donor d; pi is the share of the world
population without access to electricity belonging to country i; CA i is the share of
cumulative development finance allocated to the country i and all the countries with
lower electrification levels. The Suits Index values corresponding to the
concentration curves in Figure 7 are 0.1 for the IDA and 0.8 for the IDRB. These
values indicate that IDA (close to zero) funding is distributed approximately in
accordance with the level of electricity access while the IDRB value (close to 1)
indicates that its funds are distributed to countries that have high levels of
electricity access.
32
Appendix II – Comparison between AidData and the CRS databases.
The Creditor Reporting System (CRS) of the Development Assistance Committee
(DAC) of the OECD is the main source of project level aid data from the OECD
countries and dates back to 1973. The 22 member countries of the DAC are
committed to report their aid activities through precise reporting directives and
definitions22. In addition, some multilateral organizations and other bilateral donors
(non-members of the DAC) submit data on a voluntary basis. The DAC also
compiles a list of the countries that are eligible for the ODA23 and updates it every
three years. The DAC distinguishes Official Development Assistance and Other
Official Flows, and publishes both commitments and disbursements as well as much
other information related to each project.
AidData Database is a project run by the Development Gateway, Brigham Young
University and the College of William and Mary. It is a merger of two previous
projects aimed at ameliorating international aid statistics, called Accessible
Information on Development Activities (AiDA) and Project-Level Aid (PLAID),
started respectively in 2001 and 2003.
AiDA and PLAID merged in 2009: the first AidData version was made public in
2010 and in November 2011 the 2.0 research release was been published. The
version 2.0 data have been used for this research. At its core is the CRS data, albeit
consolidated per project instead of per year (with some exceptions). It also includes
projects financed by several Multilateral Donors (taken from their websites or
annual reports) and bilateral donors not part of the OECD, as well as recipients
outside the DAC list, if the financing activity has a development purpose and is
financed by a development agency. For certain multilateral donors AidData
substitute the data reported in the CRS if a more complete data set is available in
the donor’s documentation.
22 http://www.oecd.org/dataoecd/16/53/1948102.pdf 23 www.oecd.org/dac/stats/daclist

33
In AidData, all the new projects are classified using an extended coding scheme, that
is compatible with the CRS. The only difference between the coding schemes is the
insertion of two new codes: 23000 and 23005, which represent projects with an
unknown purpose or projects with mixed purposes. The OECD traditionally
recommends that donors use the codes that end in “010” for projects that fall
outside the other code headings (OECD, 2011). However, this led to an inflation in
the number of the projects coded under the purpose of “Energy Policy and
Administrative Management” (23010) in the CRS database. AidData staff is trying to
re-code those projects to understand which are effectively for “Energy Policy” and
which not.
Another difference is that the donors covered by AidData but not the CRS do not
provide disbursement figures, and so, contrary to the CRS, the commitment and
disbursement datasets are de-linked and it is not always possible to analyse
disbursements and commitments on a project basis.
If we compare the commitments data of the CRS with those of AidData (Figure 8),
we note that the information relating to bilateral donors from the two databases
match closely, and that AidData bilateral numbers are always slightly higher than
those of the CRS.

34
Figure 8 - Comparison of AidData and CRS databases, 1980-2009, USD
2009 billion, energy sector only.
This is due to two concomitant factors:
1) The non-DAC bilateral donors are not present in the CRS but
appear in AidData: Taiwan, Thailand, Saudi Arabia, Slovak Republic, Poland,
Kuwait, Liechtenstein, Iceland, India, Chile, Colombia, Brazil24.
2) There are recipient countries that in certain cases are not
considered by the CRS On-line (but that were included in the last CD-Rom
edition) and that were included in AidData. For example Belarus, Bulgaria,
Czech Republic, Estonia, Hungary, Korea, Latvia, Lithuania, Poland, Romania,
24 The most notable absence from both the CRS and AidData is development aid by China. The
Financial Times estimated the figures to be very high, even higher than the World Bank figures in
2009, but unfortunately no public dataset is available (Dyer, Anderlini, 2011).

35
Russia, Slovakia, Slovenia and Ukraine are not included in the on-line version
of the CRS.
The difference between the two databases is much bigger for multilateral donors.
AidData consistently reports higher values than CRS (with the exception of 2009).
In particular AidData reports projects for the following donors that are not
included in the CRS: AFESD, ASDF, BADEA, CAF, CDB, ISDB, NADB, NTF,
WORLD BANK CARBON FINANCE UNIT, WORLD BANK IFC.
To this higher availability of multilateral donors has to be added the fact that even
for some donors that are reported in the CRS, like the GEF, AidData presents data
for a much longer period.

NOTE DI LAVORO DELLA FONDAZIONE ENI ENRICO MATTEI
Fondazione Eni Enrico Mattei Working Paper Series
Our Note di Lavoro are available on the Internet at the following addresses: http://www.feem.it/getpage.aspx?id=73&sez=Publications&padre=20&tab=1
http://papers.ssrn.com/sol3/JELJOUR_Results.cfm?form_name=journalbrowse&journal_id=266659 http://ideas.repec.org/s/fem/femwpa.html
http://www.econis.eu/LNG=EN/FAM?PPN=505954494 http://ageconsearch.umn.edu/handle/35978
http://www.bepress.com/feem/
NOTE DI LAVORO PUBLISHED IN 2012 CCSD 1.2012 Valentina Bosetti, Michela Catenacci, Giulia Fiorese and Elena Verdolini: The Future Prospect of PV and CSP
Solar Technologies: An Expert Elicitation Survey CCSD 2.2012 Francesco Bosello, Fabio Eboli and Roberta Pierfederici: Assessing the Economic Impacts of Climate
Change. An Updated CGE Point of View CCSD 3.2012 Simone Borghesi, Giulio Cainelli and Massimiliano Mozzanti: Brown Sunsets and Green Dawns in the
Industrial Sector: Environmental Innovations, Firm Behavior and the European Emission Trading CCSD 4.2012 Stergios Athanassoglou and Valentina Bosetti: Modeling Ambiguity in Expert Elicitation Surveys: Theory and
Application to Solar Technology R&D CCSD 5.2012 William Brock, Gustav Engstrom and Anastasios Xepapadeas: Energy Balance Climate Models and the
Spatial Structure of Optimal Mitigation Policies CCSD 6.2012 Gabriel Chan, Robert Stavins, Robert Stowe and Richard Sweeney: The SO2 Allowance Trading System and
the Clean Air Act Amendments of 1990: Reflections on Twenty Years of Policy Innovation ERM 7.2012 Claudio Morana: Oil Price Dynamics, Macro-Finance Interactions and the Role of Financial Speculation ES 8.2012 Gérard Mondello: The Equivalence of Strict Liability and Negligence Rule: A « Trompe l'œil » Perspective CCSD 9.2012 Eva Schmid, Brigitte Knopf and Nico Bauer: REMIND-D: A Hybrid Energy-Economy Model of Germany CCSD 10.2012 Nadia Ameli and Daniel M. Kammen: The Linkage Between Income Distribution and Clean Energy
Investments: Addressing Financing Cost CCSD 11.2012 Valentina Bosetti and Thomas Longden: Light Duty Vehicle Transportation and Global Climate Policy: The
Importance of Electric Drive Vehicles ERM 12.2012 Giorgio Gualberti, Morgan Bazilian, Erik Haites and Maria da Graça Carvalho: Development Finance for
Universal Energy Access