not constitute an endorsement by MCC of · Mission for the Formulation and Management of MCA ......
45
The production of the constraints analyses posted on this website was led by the partner governments, and was used in the development of a Millennium Challenge Compact or threshold program. Although the preparation of the constraints analysis is a collaborative process, posting of the constraints analyses on this website does not constitute an endorsement by MCC of the content presented therein. 2014-001-1569-02
-
Upload
nguyenhuong -
Category
Documents
-
view
218 -
download
3
Transcript of not constitute an endorsement by MCC of · Mission for the Formulation and Management of MCA ......

The production of the constraints analyses posted on this website was led by
the partner governments, and was used in the development of a Millennium Challenge
Compact or threshold program. Although the preparation of the constraints analysis is a
collaborative process, posting of the constraints analyses on this website does not constitute an endorsement by MCC of
the content presented therein.
2014-001-1569-02

One people – One goal – One faith
PRIMATURE
Mission for the Formulation and Management of MCA Senegal
Constraints Analysis on economic growth and
private sector development
FINAL REPORT
April 30, 2008

i
CONTENTS
1. INTRODUCTION ................................................................................................................................................ 1
1.1. MACROECONOMIC FRAMEWORK .............................................................................................................................. 1
1.2. GROWTH ANALYSIS AND PERFORMANCE OF THE SÉNÉGALESE ECONOMY........................................................................ 2
1.3. POVERTY PROFILE ................................................................................................................................................ 6
1.4. CONCLUSION ....................................................................................................................................................... 7
2. MAJOR CONSTRAINTS ON ECONOMIC GROWTH AND THE DEVELOPMENT OF THE PRIVATE SECTOR ................................................................................................................................................. 9
2.1. DEVELOPMENT OF PRIVATE INVESTMENT .................................................................................................................. 9
2.2. CONSTRAINTS ON THE PRIVATE INVESTMENT ........................................................................................................... 12
2.2.1. Human resources ..................................................................................................................................... 12
2.2.1.1. Elevated cost of labor .......................................................................................................................................... 11
2.2.1.2. Labor Productivity ................................................................................................................................................ 13
2.2.2. Financing ............................................................................................................................................................. 14
2.3. INFRASTRUCTURE DEFICIT ................................................................................................................................... 15
2.3.1. Transportation Infrastructure .............................................................................................................................. 15
2.3.1.1. Density of the weak road network ......................................................................................................................... 15
2.3.1.2. Unequal geographical distribution ......................................................................................................................... 16
2.3.1.3. Condition and quality of the roads ......................................................................................................................... 16
2.3.1.4. Urban mobility ..................................................................................................................................................... 18
2.3.1.5. Rural transportation .......................................................................................................................................................... 18
2.3.1.6. Underutilization of other means of transportation ................................................................................................... 18
2.3.2. Water resource infrastructure .................................................................................................................... 19
2.3.2.1. Access to drinking water ...................................................................................................................................... 20
2.3.2.2. Access for economic uses .................................................................................................................................... 20
2.3.3. Deficit in energy services ........................................................................................................................... 21
2.4. REGULATORY FRAMEWORK AND INSUFFICIENT INSTITUTIONAL INCENTIVES ................................................................... 22
2.4.1. Slow, rigid and high costs of processing ..................................................................................................... 22
2.4.2. Performance of administration and corruption ............................................................................................. 24
2.4.3. Problem of land access ............................................................................................................................. 25
2.4.4. Lack of confidence in the application of a regulatory framework and the justice system .................................... 25

ii
LIST OF ACRONYMS:
AATR Autonomous Agency of Road Works
ANSD Arrange national statistics and demography
BCI Consolidated investment budget
BM The World Bank
BTP Construction industry
CEDEAO The economic Community of the states of West Africa
CPI The Presidential Council for Investments
DASP Direction of Support to the Private Sector - Ministry for the Economy and
Finances
DEM Direction of the exploitation and maintenance
DGPRE Direction for the management and the resource requirements planning out of
water
DHY Direction of water resources
ESAM Senegalese household survey
ESPS Investigations of follow-up of poverty in Senegal
FCFA Franc for the African financial community
GFCF Gross fixed capital formation
GIE Economic interest group
ICS Chemical industries of Senegal
MEF Ministry for the economy and finances
OECD Organization for the co-operation and the economic development
OHADA Organization for the harmonization of laws of the businesses in Africa
ONG Nongovernmental organization
PAST Program for Adaptation of the Transport Sector
GDP Gross Domestic Product
LDC The least advanced countries
SME Small and medium-sized companies
SME Small and average industries
RGPH General census of the population and the habitat
SAR African company of refining
SCA Strategy of accelerated growth
SFD Decentralized capitalizations
SENELEC Senegalese Public Corporation of National Electricity
SOTRAC Company of public transport of the Cap Verde
TCN Title of debt security
UEMOA West African Economic and Monetary Union

iii

iv
METHODOLOGY
This constraints analysis on economic growth and private sector development was coordinated by MFG-
MCA Senegal, with technical support from a core group of experts organized for this purpose (DPEE,
ANDS, CREATED, CRES, CEPOD, DASP). Work was carried out in several stages:
Production of the working paper
Documentary review: MFG-MCA collected a series of documents, studies and recent investigations that
have dealt with the issue. Simultaneously, MCC’s economist also conducted preliminary analysis of the
documents at his disposal. At the time of the MCC mission in Dakar, the two teams compared their
reviews and evaluated the quality and relevance of the aforementioned documents. This led to the
identification of three categories of documents:
Class A: 3 principal documents address the majority of the issues in question. This includes the action
plan for implementation of the Strategy for Accelerated Growth (SCA), the World Bank’s investment
climate evaluation, the 2007 economic and financial report, and prospects for 2008 (see reference in the
Appendix).
Class B: Documents and investigations which provide recent data.
Class C: Additional sources, particularly documents on strategies and sectoral policies (DSRP-2,
sectoral policy letters, etc).
Examination of the data: The MFG-MCA Senegal team carefully studied all the documents and
identified primary constraints, limitations and complementary data requirements.
Retreat of analysis: The core group of experts reconvened in a residential seminar to review the results
of the studies and develop their analyses. The team worked in three phases by using various tools such
as “the problem tree” and “benchmarking”: a problem identification phase, followed by causal analysis,
and finally, prioritization. The MCA-Senegal team then finalized a temporary draft document.
Exchange with the MCC: Exchanges were organized with the MCC team in order to prioritize problems
and reach an agreement on the major binding constraints, building upon the experience of MCC and
other countries.
National distribution workshop: The final phase of this process involves sharing the results with the key
actors (government departments, civil society organizations, private sector, universities) in order to
reach a consensus on binding constraints, which will guide the development of the concept papers.

v
PRINCIPAL CONCLUSIONS Since the devaluation of the FCFA, Senegal has maintained a positive slope for economic growth with an annual average of approximately 5%. These results were achieved within a context of political stability by inflation control, the implementation of an effective fiscal policy and structural reforms. Generally, Senegal has a healthy macroeconomic framework, thanks to a prudent monetary and budgetary policy. At this level, there are not risks that can affect private investment and entrepreneurialism. However, analysis of the economy’s evolution shows that the country is confronted with a growth rate leveling off at around 5%, particularly due to the primary sector’s low productivity, which accounts for only 13.8% of the GDP even though it employs 58% of the population, with low levels of private investment despite an upward trend these past few years. In fact, even though the total investment rate regularly increased, passing from 20.5% in 2000 to a rate of 25.5% in 2006, the private sector’s share of this growth remains relatively weak compared to countries experiencing critical increases in economic growth and reductions in poverty (i.e. Malaysia, China). With growth rates between 5-6% per year, Senegal will still belong to the group of lower income countries in 2015 and will not achieve the Millennium Development Goals (OMD). The major constraints limiting private investment are located at the microeconomic level and relate to: - the deficit in infrastructure (roads, energy, water) and - inadequacies in the business environment. The gaps in terms of transportation infrastructure are the result of a minimally developed road network which is of poor quality and only concentrated in the western fringe of the country. The energy sector suffers from low productivity and problems in service quality, which generate increased access costs, additional costs for the private sector and a poor access rates for the rural population. The cost of accessing energy in Senegal is among the highest in West Africa (nearly 60% more expensive than the Ivory Coast). Regarding access to water, access for domestic use (drinking water) is less problematic for the Senegalese, as Senegal’s rate of access is relatively high compared to other countries. Thus, Senegal is not confronted with the problem of unavailable water resources (only 7% of available and renewable water resources are utilized) but rather with inadequate investment in the mobilization of surface, subterranean, and runoff water for economic purposes (e.g., for agricultural, industrial production), particularly in the inland areas of the country with strong potential. With regard to the investment climate, some constraints remain. Despite reforms undertaken recently by the authorities, the effects of these reforms are still not visible. Major obstacles that persist are related to the regulation of labor laws, the legal framework for resolving legal disputes, and access to land. Finally, with reference to financing, increased difficulties with access to financing are external to the banking system, which shows some stability. The major constraints in this sector are related to problems with contract execution and debt recovery, which explain, in part, the weakness of credit and the demanding guarantees required by the banks. In this sector, prudent measures, as required by the Central Bank of West Africa (BCEAO), limit the possibility of allocating long-term credits which cannot be covered by long-term deposits.

1
1. Introduction
Senegal is in a strategic position geographically due to its location on the western Atlantic
coast. It is delineated by land borders with Mauritania to the north, Mali to the east, and
Guinea-Bissau and Guinea to the south. The territory has a surface area of 196,722 square
kilometers and includes 14 administrative regions.1 According to the General Census of
Population and Habitat (RGPH-3), conducted in 2002, the population of Senegal totaled
9,855,383 inhabitants, with 50.8% women and 49.2% men. This population is distributed
between cities (41.6%) and rural areas (58.4%). The demographic growth rate remains
relatively strong (2.46%), notwithstanding a small drop over the course of the last two
censuses. The demographic distribution reflects a very young population (54.4% of
Senegalese are younger than 20, whereas people 65 years or older account for 3.9% of the
population).
1.1. Macroeconomic framework
In 2006, the GDP at current prices and the GDP per capita were respectively 4.846 billion and
437,562 FCFA.
Final consumption (growth of 6.8% in value) increased faster than the gross domestic product
over recent years, which caused a reduction in the domestic savings rate from 11.2% in 2000
to 9.7% in 2005 and then to 8.8% in 2006. This growth is primarily derived from personal
consumption expenditures (5.7%), which grew due to remittances sent by Senegalese living
abroad, such that final public consumption grew 3.2% in 2006.
Investment rates reached 25.3% in 2006, following a 19.9% increase in gross fixed capital
expenditure (FBCF), which was a result of positive externalities owing to the large increase of
public FBCF beginning in 2004 (14.8%) through public infrastructure improvements.
However, direct foreign investments (IDE) were relatively weak (58 million USD in 2006),
were compared to other countries, including Uganda at 307 million USD, Ghana at 435
million USD, and Malaysia 6.06 million USD. In terms of gross fixed capital expenditure,
foreign private investment in Senegal accounts for 2.8%, whereas it accounts for 14.3% in
Uganda, 17% in Ghana and 20.1% in Malaysia. In 2006, Senegal ranked 128th out of a total
141 countries based on these numbers. Private investments are concentrated in the
telecommunication, mining and tourism sectors.
1 Senegal officially counted 11 administrative regions until January 2008, when three new regions were created (Sedhiou, Kedouga, Kaffrine).

2
Regarding foreign trade of goods and services, this sector was marked by a decrease in
traditional exports (peanut products, fishing, phosphate, phosphoric acid), which resulted in a
0.8% decrease in the total value of exports. Imports, on the other hand, experienced a 4.7%
increase. Thus, the trade balance deficit became more pronounced, and in 2006 reached 792
billion FCFA.
The inflation rate, measured by the GDP deflator, was 3.4% in 2006. The progressive price
increases visible over the last two years are primarily tied to the increase in the price of a
barrel of oil in the international market, which have induced an increase in the price of
industrial products. More recently, the soaring costs of foodstuffs have reinforced this trend.
Finally, in recent years, the available labor force increased at a steady pace, since the growth
rate for Senegal’s working population aged 15 to 64 years was 4% each year between 1988
and 2002, or 1.6% faster than the total population. This rate was higher in cities (5.1% in
Dakar and 5.9% in other cities) than in rural areas (3%) because of migratory flows.
1.2. Analysis of the growth and performance of Senegal’s economy Senegal has experienced a long period of internal adjustments since the 1980s and until the
devaluation of the FCFA in 1994. Nevertheless, despite repeated adjustment efforts,
economic growth from 1980 to 1994 measured on average 2.2% and remained structurally
weak. The sources of this growth did not create sufficient employment or exports, nor were
they diversified. The development and maintenance of substantive components of the
country’s basic infrastructure suffered considerably from the restrictions imposed by
structural adjustments, including: road networks, ports and airports, sanitation, energy, and
congestion of Dakar, where most activities are centralized. Specifically, 90% of all
Senegalese businesses are based in Dakar, which in 2005 also served as the hub for 75% of
permanent employment.2
After the depreciation of the FCFA, Senegal’s economic rate of growth remained stable from
1994 to 2007 in a relatively stable macroeconomic environment, with the exception of 2002
and 2006. This is due notably to a prudent fiscal and monetary policy. The growth rate in
real terms (see graph 1) reached 5.9% in 2004 and 5.6% in 2005.
2 Sectoral policy letter on development of industry.

3
The evolution of growth over 1994-2006 shows that Senegal’s economy remains vulnerable
to exogenous shocks. Every three years on average, economic activity registers a slowdown
or a decline largely due to the sub-standard performance of the agricultural subsector.
The deceleration noted in 2006 is primarily a result of the sub-standard performance of the
primary sector (- 10.0%) in agriculture and fishery. However, this slowdown was also due to
the poor performance of the secondary industry (1.6%), particularly related to extractive
activities following the decrease in oil refining and chemical manufacturing. Nevertheless,
this deceleration was attenuated by the growth of the service sector, which stabilized at 5.5%
in 2006 and was accompanied by a high level of tax collection.
Graph 2: GDP and agricultural subsector growth
Generally, agricultural activities suffer from a lack of rain and other climatic hazards,
particularly natural disasters (floods, infestations of predatory animals such pilgrim locusts
etc). The sector’s strong dependence on uncertain rain patterns (only 10% of cultivated land is
irrigated) constitutes a structural factor of insecurity that is likely to increase the risk for
Graph 1: Annual rate of growth for the GDP
2.0
3.1
5.96.3
3.2
4.6
0.7
6.75.9 5.6
2.3
0.01.02.03.04.05.06.07.08.0
1996 1997 1998 1999 2000 2001 2002 2003 2004 2005 2006

4
private investment in the agricultural and agro-industrial industries. Additionally, there are
difficulties unique to the peanut industry, the primary product exported from Senegal to the
world market. The fishery industry, Senegal’s second largest export sector, encounters
hardship due to scarce fishing resources, which results in a drop in the number of catches.
In addition to its vulnerability to climatic risks, Senegal’s economy suffers from an
infrastructure deficit, which is the cause of the lack of private industrial sites, the overall
weakness of the industrial fabric, and the lack of trade with the countries bordering on
Senegal and in the same sub-region. Additionally, the lack of an intercity road network (of
which one of the consequences is the congestion of Dakar), the weakness of the production
trails and the insufficiency of railway and maritime infrastructures also constitute constraints
common to all sectors of economic activity and to the integration of the sectors particularly in
rural areas.
Recent results show that the primary and secondary sectors, respectively, accounted for
13.8% and 19.7% of the GDP in 2006, whereas the service sector accounted for 52.8% of the
GDP. Net taxes of products account for 13.7% of the GDP.
The primary sector remains dominated by agriculture (6.7%), notwithstanding difficulties
cited above that are inherent to this particular sub-sector. The contribution of animal breeding
to the GDP remained relatively stable during the last three (3) years and measured around 4%
of the GDP.
Relative to the secondary industry, it is noteworthy that the deceleration of the chemical
manufacturing branch occupied a share of 1.9% of the GDP in 2004 and 1.1% in 2006. The
dynamism of public works projects results in an increase of its share of the GDP, which was
4.9% in 2006, at the time when the energy’s share stabilized around 2.3%. Mining’s share
was 0.8% in 2006.
Graphique 3: GDP Structur by sector
Primary Sector; 13.8%
Secteur secondaire; 19.7%
Tertiary Sector; 52.8%
Net Taxes on products; 13.7%

5
In the tertiary sector, the weight of commercial activities remains preponderant, with a share
of nearly 16% of the GDP in 2006. Transport, post offices and telecommunications account
for 0.8%. The growth of administrative activities remains constant, and was maintained
above 6% in 2006.
The sub-standard performance of Senegal’s economy demonstrates the persistence of the
trade deficit, which becomes permanent due to the increase in imports and the decrease in
exports. The deficit of the trade balance became more pronounced between 2002 and 2006,
when it reached 792 billion FCFA.
Graph 4: Evolution of the trade deficit from 2002 to 2006
‐1000,0
‐500,0
0,0
500,0
1000,0
1500,0
2000,0
2 002 2 003 2 004 2 005 2 006
importations
exportations
Défic it Commerc ial
The import of goods increased from 1.118 billion FCFA to 1.605 billion FCFA in 2006—an
increase of 0.487 billion FCFA. This increase strongly burdened the trade deficit, which went
from 359 to 792 billion FCFA over the same period.
Exports dropped noticeably in 2006, with a loss of almost 9 points. This drop is attributed to
a decline in the quantity of primary export products like fish products (- 13%), phosphate (-
10%), and phosphoric acid (- 6%).
Efforts to increase exports face a series of obstacles related to the competitiveness of products
in the market (developed countries and the sub-region) and the low supply capacity. Problems
arise differently however, depending on the economic sector .
For example, in farming and agro-based industries, factors limiting market access are
summarized by difficulties with transportation insofar as the most important places of
production are isolated and producers have difficulty transporting their products to urban
areas where processing and packaging facilities are located. Such difficulties increase export

6
costs and thus affect competitiveness. For certain products, particularly the peanut, its decline
as an export product is related both to competition from new, similar products available on the
world market and to more demanding quality standards (e.g., aflatoxine content, etc.).
Regarding limited supply, market garden produce and fruit production in Niayes (coastal
fringe), two other export sources, are confronted with several complicating factors. These
challenges include: an advanced urban front, the salinification of groundwater (advanced salt
penetration) and costs of water. However, other potential zones for reorganization (Lake
Guiers, valley of the river, Kolda, Ziguinchor, Tambacounda) suffer from insufficient
facilities, equipment and transport problems. Private exporting companies also face freight
and transport problems. Small and medium enterprises and family agricultural companies are
particularly challenged by the high cost of management and investment problems related to
ill-fitting banking standards.
1.3. Povertyprofile
In 2005, Senegal’s average income per capita was around 710 USD.3 The country remains in
part of a group of the least advanced countries (LDC). The prevalence of poverty remains as
significant at a household level as for individuals. Indeed, the results of some investigations
(ESAM-II and ESPS) indicate that the incidence of poverty by household is 42.6%, and that
more than one out of every two people still live below the poverty line in 2005-2006.
The incidence of poverty remains highest in rural areas,4 where 61.7% of the individuals and
55.6% of the households live in the lower part of the poverty bracket. In Dakar, these rates
account for, respectively, 32.4% and 25.3%. Thus, the rural milieu contributes to the 71.2%
level of the national poverty rate.
Table 1: Evolution of poverty incidence according to place of residence
3 Atlas method, World Bank 4 Despite a slight decrease between 2001 and 2005 (57.5%- 55.6%).
Households Individuals
Nationallevel
Dakar
Other urban zones
Rural milieu
National level
Dakar
Other urban zones
Rural milieu
2001-02Incidence of poverty (%) 48,5 33,3 43,3 57,5 57,1 42,0 50,1 65,2Depth of poverty (%) 14,8 9,5 13,4 17,8 18,3 12,0 16,1 21,4Seriousness of Poverty (%) 6,2 3,7 5,7 7,5 7,9 4,7 6,9 9,4

7
Source: DPS, ESAM 95, ESAM 2002 and ESPS 2006
Disparities are also noted among regions. Areas where the poverty rate is higher than the
national average include outlying areas like Ziguinchor (67.1%), Kolda (66.5%) and
Tambacounda (56.2%), where they are remain isolated, in spite of enormous natural potential.
These areas are similar to central areas like Kaolack (65.3%) and Diourbel (615%), which are
located in the peanut basin and are subjected to the effects of the decline in economic activity
related to the peanut industry.
In average to less-impoverished regions where the poverty rate is close to or lower than the
national average, these areas frequently correspond to free coastal zones, which provide more
sources of income because of the activities in the sectors contributing to growth during recent
years (tourism, irrigable farming, fishing, horticultural exports, commercial businesses,
information technology). These regions include Dakar (33.6%), Thiès (48.6%), Fatick
(46.3%), Saint-Louis (41,2%). These zones also have the presence of agribusiness industries
(particularly for Saint-Louis and Dakar) and mining (Dakar and Thiès).
With regard to basic social sectors, the gross rate of enrollment in 2006 was 81.8%, but the
rate of completion, 45.5%, remains much lower. In the health sector, in 2006, the rate of
assisted childbirths was 52.47%, with lower rates in the outlying areas of Kolda (25.8%),
Tambacounda (33.6%) and Matam (34%).
Also in 2006, the rate of access to drinking water was 93% in urban areas and 69% in rural
areas. Access to energy service is relatively high in urban areas but remains weak in rural
areas where, in 2006, the rate of rural electrification was 16% (see Appendix A3).
1.4. Conclusion
Ultimately, the economic and financial performances recorded over recent years remain
insufficient to significantly reduce poverty. If one considers that the elasticity of the poverty
rate starts from -1.38 (in other words, one point of the income per capita growth rate
corresponds to a reduction in poverty of 1.38 points, according to DSRP2), much effort will
be required to achieve the stable growth rate required to reduce poverty. Indeed, Senegal’s
economic performance has remained fragile over the course of time. This fragility is
Gini Coefficient 37,4 41,9 38,3 29,9 34,2 37,3 35,2 30,1 2005-06Incidence of poverty (%) 42,6 25,3 30,8 55,6 50,6 32,4 38,6 61,7Depth of poverty (%) 13,4 6,3 8,5 18,8 16,1 8,2 10,7 21,4Seriousness of Poverty (%) 6,0 2,3 3,5 8,9 7,3 3.0 4,4 10,2Gini Coefficient 35,1 35,3 32,1 31,4 32,0 31,9 28,9 30,2Contribution 100 16,6 13,3 70,1 100 15,4 13,4 71,2

8
exemplified in the brutal declines in economic growth in 2002 and 2006, when the economy
underwent external shocks.
In the absence of serious macroeconomic risks, growth capped off at around 5%, its fragility
due to the following factors:
- low productivity of the primary sector, which accounts for only 13.8% of the GDP
although it employs 58% of the population;
- insufficient competitiveness of the buyer’s sector and the ongoing importance of the
informal sector in the formation of the GDP.
Private investment and the development of entrepreneurship to support growth remain weak.
The primary, binding constraints of these phenomena are caused on the one hand by the
infrastructure deficit, and on the other hand, by the persistent number of institutional
rigidities, which constitute much of the risk on a micro-economic level.
The infrastructure deficit primarily relates to (i) the road network, which cannot support
growth because of its inadequacy, (ii) difficulties in accessing water for economic purposes
and (iii) the energy deficit.
On an institutional level, major obstacles relate to: (i) labor law regulations; (ii) the legal
framework for litigation settlements and resolution; (iii) the access to land; and, (iv) contract
performance and debt recovery, which affect access to credit.

9
2. Major constraints to economic growth and the development of the private sector
2.1. Evolution of Private investment The rate of global investment (FBCF5 plus stock variation) has regularly increased since the devaluation of the FCFA. It measured 20.5% in 2000 to 25.5% in 2006 following an increase of 19.9% in gross fixed capital expenditure (FBCF). These adjustments are the result of positive externalities, in response to the strong increase in the FBCF beginning in 2004 (14.8%), public infrastructure improvement, as well as remittances from Senegalese abroad who acquired real estate. Public investments have increased regularly and accounted for 5.7% of the GDP in 2005. An analysis of public investments shows that inland transportation, administrative facilities and health are the most prevalent areas for investment.
Graph 5: Evolution of private and public investments from 2000 to 2006
0
200
400
600
800
1 000
1 200
2000 2001 2002 2003 2004 2005 2006
publique
privée
Source: National Agency for Statistics and Demographics– Account Regarding private investment, it evolved in a manner that contrasted with public investment over the same period of time, with an average of 8.3% from 2000 to 2006. Despite efforts to improve the business climate—particularly the decrease in taxation, the reduction in the number of days necessary to create a new business, incentivizing measures taken from the framework of the Presidential Council for the Investments (CPI)—private investment nonetheless remains very weak in comparison to needs of the economy6 and in comparison to countries experiencing development that was both fast and sustainable. Thus, it was noted that a portion of private investment in the GDP accounted for 16.6% in China (2000), 16.6% in India (2000), 15.0% in Uganda (2002), whereas it only represents 10.3% of the GDP in Senegal (2002).
5 Gross fixed capital expenditure. 6 The share of private investment in the GDP reveals a decline, dropping from 17% in 2000 to 14% in 2004 (Source: Country Assistance Strategy, 2007-2010: World Bank)

10
The weakness in the private investments is due (i) an infrastructure deficit in provision of essential services to the energy, road and water sectors, and (ii) a number of institutional problems.

11
Problem Tree: Explanatory model
Caption: the problems which constitute binding structural constraints are in the red boxes.

12
2.2. Constraints to private investment7
2.2.1. Human resources
2.2.1.1. High cost of labor A number of constraints constitute barriers to an effective labor market and competitive companies. In Senegal, increased wage scales, particularly for unskilled workers, were identified as a contributing factor to the increase in production costs. Analysis of the method used to establish wages shows that the following factors play a fundamental role in the determination: (i) individual characteristics of the employees (education, experience, nationality, gender), (ii) the location of the company, and (iii) the existence of labor laws and global agreements negotiated between employers and trade unions. According to the average exchange rate in the first quarter of 2004 based on a sample of manufacturing companies, the World Bank study on Evaluation of the Investment Climate in 2006 shows that Senegal’s average monthly remuneration ranges from 281.90 USD and 431.50 USD. Further, variations in salary within the same employment sector are significant. Such rates are higher in comparison to similar countries.
Graph 6: Monthly income for unqualified production workers in the manufacturing sector (TCN) in various countries
Significant wage differentials were also noted across various types of employment. In fact, an unskilled production worker in the manufacturing sector earns approximately 143 USD per month, whereas a manager earns approximately 672 USD monthly. In contrast, this same production worker would earn 57.7% more in Tanzania.
7 Private investment pertains to investments that are not public. This includes direct foreign investment, investments of the national private sector, by household, and family operations.

13
2.2.1.2. Labor Productivity Labor productivity is affected by lower levels of training and qualification of employees. A World Bank study of the Evaluation of the investment climate in 2005 shows a positive correlation between labor productivity and the level of education of a worker. Indeed, it indicates that each additional year in school results in an increase in labor productivity around 7.5% and 5.4%, for the formal and informal sectors, respectively. In Senegal, where less than 5% of the working population continues education beyond high school, skill levels remain low. Half of the labor force employed in Dakar’s informal sector has never attended school. In comparison to other countries, however, at 26.3% Senegal has fewer employees with less than 6 years of education than in Tanzania (48.0%) and Pakistan (59.3%), although it has more than in Uganda (12.3%). This gap in qualifications is increasingly lessened by companies who provide relevant training for their employees, in effect strengthening the company’s capacity. In cooperation with employers, the Senegalese government established a fund (FONDEF) that pays for a training program for employees. As such, in the manufacturing sector, more than 32.3% of companies offer formal training to their employees. This rate is 29.7% in Uganda and 44.0% in Tanzania. Similarly, more than 40.7% of qualified employees receive training versus 3.0% in Uganda and 7.3% in Tanzania. One problem that frequently hinders the performance of certain businesses relates to absenteeism due to health problems, particularly malaria. According to estimates in a cross-country analysis, malaria reduces Senegal’s GDP growth by 0.35% annually (McCarthy et al. 2000).8 The economic impact of this phenomenon is a loss of labor, agricultural productivity and lost of growth in industries like tourism. To combat this disease, significant efforts are underway for the prevention and implementation of new techniques to fight malaria, which are supported by several financial backers including USAID. These efforts have resulted in a downward trend in Senegal’s malaria incidence. A recent study shows that death and morbidity rates dropped by 50%. Ultimately, it is noteworthy that high costs pose problems when workforce productivity does not keep up with costs. In Senegal, labor output is relatively high in comparison to other African countries. For example, in the manufacturing sector, labor output is noticeably higher for the average Senegalese company than for the average Kenyan, Ugandan or Tanzanian companies. Finally, analysis of the problems relating to human resources indicates that productivity does not constitute a major challenge for private investment, and that the plan of action to provide education and training is capable of satisfying demand.
8 World Bank (2005)- Risk management in rural area of Senegal: multi-sector review of initiatives to reduce vulnerability.

14
2.2.2. Financing After the implementation of a vigorous restructuring policy, the Senegalese financial system was stabilized. These efforts supported the growth of the banking network with 17 active banks, linking banks with the population, thus contributing to an increase in the population’s banking rate. However, at 7%, this rate remains weak, even if it exceeds the West African Economic and Monetary Union (UEMOA) average of 4%. Other financial establishments are also engaged in the credit and debt recovery sectors. From an international perspective, interest rates in Senegal are not very high. For example, in the manufacturing industry, the average interest rate for banking loans is 10.9%, compared to 16.7% in Uganda and 16.3% in Tanzania. The interest rate in the service sector is around 10%. The Senegalese financial system is marked by a strong prevalence of credit allocated by banks to profit large companies, which frequently present certified accounts and use assets as loan security. Moreover, analysis of credit distribution shows that the share assigned to the primary sector is weak, compared to allocations towards the service sector (Study DPEE, 2007). In 2005, the industries benefiting most from credit distribution are: manufacturing (30%), trade, restaurant, hotels (25%), various services (18%), whereas agriculture, forestry and fishing sectors access only 3% of this credit. The performance of the financial system contrasts with difficulties accessing credit. This process is criticized by economic actors, particularly small businesses that at the time of credit applications have to take into account, when requesting credit, the importance of equity and the cost of portfolio preparation. According to the results of a survey based on a sample of the manufacturing sector, 64.5% of entrepreneurs estimated that the cost of and access to finance constitute their most important concerns within the framework of their activities. The results of this report are similar to responses in Uganda (60.3%). On the other hand, in China and Turkey, only 21.6% and 28.2% of entrepreneurs, respectively, highlighted the importance of financing issues. SME and SMI access to financing, which accounts for 25% and 70%, respectively, of Senegalese companies, is limited because of the high level of bonds required by Senegalese banks for uncovered balances and for loans. These bonds may represent as much as 103-150% of the value of the appropriations granted, according to the sector. The private sector, specifically SME and SMI, also face obstacles related to the criteria for distribution of credit, particularly related to obtaining the services of an external auditor. To address these constraints, an SME has alternative options, like re-investment of earnings and supplier’s credit (2 out of every 3 businesses in the manufacturing sector use supplier credit). Certain companies favor decentralized financial institutions to address their need for working capital and for their investments. However, these institutions are confronted with challenges related to the low volume of financing, the difficulty in refinancing and their unequal geographic distribution over the national territory (concentrated in the Dakar Thiès region).
15
The analysis seems to show that the difficulties accessing the private sector are related to institutional problems rather than a weak offer from financial institutions. Indeed, problems relating to contract performance and debt recovery9 were identified as constraints to an increase in credit supply. Otherwise stated, the unavailability of long-term resources blocks banks from distributing long-term credits.
2.3. Infrastructure deficit
2.3.1. Transportation infrastructure
The transport sector plays a very important role in Senegal’s economy. The sector’s value-added contribution to the GDP is about 7%, but this figure only partially reflects the effects of availability and quality of transport services on the remainder of economic activity. Within the transport sector, the road sector occupies a dominant place in mainland transport. Thus, roads ensure approximately 99% of human transportation within the country and more than 95% for the goods. The classified and non-classified road networks are distinct. The classified road network, structured on the basis of the country’s administrative layout, is regulated by law (law 74-20 of January 24, 1974 and the decree of application n° 74-718).10 The non-classified road network includes the secondary urban roadway system and unpaved rural roads. The classified road network is divided as follows:
- national roads, which connect administrative regions or adjacent countries; - regional roads, which connect the key locations of a county11 within the same region; - county roads, which connect key rural communities within the same county; - urban roadway systems which provide connections within urban centers.
2.3.1.1. Density of the weak road network The first characteristic of the Senegalese road network is its star shape, which is indicative of the configuration created specifically to address the flux of passengers and goods coming from the hinterland and intended for the country’s borders or exit points (ports, airports, train stations, etc). Today, the classified road network measures an overall length of 14,615 km including 4,554 km of paved roads (31.2%), and 10,061 km of unpaved roads (68.8%). The network has more than doubled since 1960, Senegal’s year of independence (from 6,034 km to 14,615 km). Nonetheless, this network is relatively weak compared to that of other countries like Ghana, Mozambique, Tanzania and Uganda.
9 See institutional section. 10 A study funded by the Public Works Department on the development of a new road classification system was recently finalized in November 2007, but its conclusions have not been officially adopted yet. 11 Translator’s note: for the purpose of this exercise, ‘county’ is the translation used to approximate the French “département.”

16
Table 2: Road network comparison with other countries Senegal Ghana Mozambique Tanzania Uganda
LengthLength network, in km 14615 57613 29238 28999 76150Length covered, in km 4554 9038 5710 5184 2991Length not covered, in km 10061 48575 23528 23816 73159 DensityKm of road/1000 inhabitants 1.9 2.7 1.5 0.8 2.7Km of road/1000 km ² of surface 23.1 241.6 37.4 32.9 386.4Source (World Bank document from June 2004 on the road transport sector in Senegal, SSATP No85B, Oct. 2007) Network weakness is due to an absence of policy of extension and a weakness of the investments as demonstrated by the development of the road network from 1990 to 2003.
Table 3: Annual growth of the road network Years 1990-1995 1996-2001 2002-2003Annual growth
Classified paved roads 2,2% 0,0% 3,3% Classified unpaved roads 0,7% 0,0% - 1,2% Total classified roads 1,1% 0,0% 0,3%
Source:(World Bank document from June 2004 on the road transport sector in Senegal) www.worldbank.org/transport/transportresults/regions/africa/senegal-
output-esw.pdf
2.3.1.2. Disproportionate geographical distribution
The Senegalese population is particularly concentrated around the Dakar area. The city hosts nearly one quarter of Senegal’s population on 0.3% of the territory. Thiès and Diourbel also represent a significant proportion of the population (13.8% and 9.5% respectively) on limited territories (3.4% and 2.2%). Thus, nearly half of Senegal’s population lives in the center of the future highway and its continuation towards Diourbel, on a territory that is less than 6% of the total surface area of the country. This distribution does not support the inter- and intra-regional exchanges.
Table 4: Road density compared to the population
(linear km per 1000 residents) Density of all
Roads Density of paved
roads
Density of unpaved roads
Paved proportion
TOTAL 1.49 0.46 1.03 31.2% Dakar 0.127 0.122 0.005 95.8% Diourbel 0.583 0.221 0.362 37.9% Thiès 0.736 0.376 0.360 51.1% Kaolack 1.245 0.326 0.919 26.2% Fatick 1.290 0.586 0.703 45.5% Ziguinchor 1.888 0.581 1.307 30.8% Kolda 2.331 0.620 1.711 26.6% Saint-Louis 2.425 0.777 1.647 32.1% Louga 3.029 1.055 1.974 34.8% Tambacounda 7.081 1.325 5.756 18.7% Source:(World Bank document from June 2004 on the road transport sector in Senegal): www.worldbank.org/transport/transportresults/regions/africa/senegal-
output-esw.pdf

17
The density of Senegal’s roads compared to its population is 1.49 km of road for one thousand residents on average. Road density varies in proportion of more than 1 to 50 between Dakar and Tambacounda in the east.
Table 5: Geographical density of paved roads
(linear km for 1000 km2) Density of current
paved roads Density of paved
roads in 1996
TOTAL 23.1 21.7Dakar 533.0 529.0Thiès 76.8 71.0Diourbel 47.2 46.1Fatick 47.2 46.0Ziguinchor 44.2 44.1Saint-Louis 15.2 15.2Tambacounda 11.8 7.8Kaolack 23.0 23.0Louga 20.2 20.2Kolda 24.6 24.6
Source:(Doc. BM June 2004 on road transport sector in Senegal): www.worldbank.org/transport/transportresults/regions/africa/senegal-output-esw.pdf Regarding geographical density, the most interesting element of the roads is the allocation for paved roads, considering their importance in terms of traffic. Overall, Senegal has 23.1 linear km of paved roads for 1000 km² of surface area.
2.3.1.3. Road quality The implementation of the Program for Adaptation of the Transport Sector (PAST) made it possible to start to make up for the backlog in road maintenance through an allowance of 75% of the road subsector budget for maintenance. In many cases, maintenance work was of poor quality. To date, questions persist about the adequacy of current maintenance activity compared to maintenance needs, since the inventory undertaken by the Autonomous Agency of Road Works (AATR) on current road maintenance expenditures found that less than 25% of the annual budget is spent in this area. The results of the national inspection campaign conducted in 2001 and 2002 in preparation for the triennial capital spending program of 2003-2005 (this campaign having covered more than 90% of the linear total of the country), reveal the following (see table in appendix for details by region):
- only 7.5% of the road network is in a “good state”; - nearly 72% of the network is in “bad” (47.5%) or “very bad” (24.4%) condition; - the paved network is in better condition comparatively: “only” 43% is in bad or very
bad condition, the maximum being reached by secondary roads (62%); - a very large portion (approximately 86%) of the road network that is unpaved is in bad
to very bad condition, the maximum being 92%.
The quality of the roads heavily influences the cost of transport and private investments. A comparison of road quality in countries at the same developmental stage shows that the state

18
of the roads in Senegal is quite degraded. Indeed, only 28% of the roads are in good to average condition, compared to 62.8% in Ghana, 61.3% in Mozambique, 78% in Tanzania and 31% in Uganda.
2.3.1.4. Urban mobility Urban transport suffers from a gap between supply and demand resulting from the SOTRAC (Senegal Public Corporation for Public Transport) crisis in the context of rapid urbanization. Dakar’s urban transport operations were until 2005 almost exclusively by a system of informal transport, characterized by the following :
- organizational deficiencies, - a dilapidated state of affairs of the park and anarchical operating methods, which were
implicated in many accidents, and - a major contribution to the sound and atmospheric pollution of the urban environment.
In addition to a problematic system, other problems include the isolation of suburban areas, where workers who commute to businesses located in city centers reside, and the advanced degradation of certain portions of the urban road network. Significant efforts were recently made or were programmed into the framework for the Program for Improvement of Urban Mobility (PAMU).
2.3.1.5. Rural transport The documented network includes 14,615 km of highways, of which 68.8% are unpaved roads. This network is managed by the State. The undocumented network of small rural roads is a concern for local communities, rural development companies, and NGOs. The precise length of the non-classified network is unknown because of a lack of reliable statistics. Non-classified small rural roads are not regularly maintained. Limited access to rural infrastructure is one of the principal factors behind low productivity in rural settings. Agricultural development is slowed by various constraints including the isolation of regions where production takes place as well as the countryside. The existing network of small rural roads is insufficient. This road network is in poor condition and limits access for rural populations to the infrastructure and services. The principal constraints identified are:
- an inadequate institutional framework; - high standards of construction; - an insufficient finance system; - the high cost of motorized transport services; - weakness in the capacity to plan, program, and manage actors; - the unequal treatment of men and women regarding transport requirements.
2.3.1.6. Underutilization of other means of transport
Other transportation sub-sectors currently have a marginal role in mainland transport. Like the road sector, other modes of transport suffer from a significant financing deficit.
- The rail network has only recently developed and is rather degraded. Rail transport is used especially for freight, specifically for international transport towards Mali for the most part, which remains the country’s main rail axis. The development of the rail sector has been entrusted to the private sector.

19
- Domestic air transport remains very limited. Infrastructure-related constraints include: (a limited number of secondary airports) the cost of air transport compared to the incomes of the Senegalese population; and short interior distances, which portend for significant development.
- Domestic maritime transport remains limited to operations of the Dakar-Ziguinchor axis and the Dakar-Gorée sea connection.
2.3.2. Water resource infrastructure In spite of unstable climate conditions (weak and variable rain, high evaporation), Senegal has relatively significant water resources, which are provided by Guinea’s rainy zones, underground reserves and strong winter rains in the southern and eastern areas. A comparison of available water resources per capita with other countries shows that Senegal is largely well supplied in terms of water resources. Table 6: Comparison of available resources per capita in various countries Country Available water
resource per capita (m3/resident.)
Senegal 55 182Morocco 767Tunisia 476Burkina Faso 28 714Benign 1730
Subterranean water: total aquifer potential ranges between 450 and 600 billion m³ of water, with an annual refill ranging from 3 to 4 billion m³ per year. However, mobilization of these resources requires the implementation of processing facility works in various underground water tables. In the areas where ground water or a ground water table exist (Continental Terminal and hard water), access costs are lower. The southern zone and western coastal zone fall into this category. On the other hand, in the areas where the only alternative remains deep ground water tables (Maestrichtien), access costs are very high, which is above all due to the difficulty of penetrating great depths to access this water source. There is also an excessive exploitation of this resource, especially in the central areas (Diourbel, Thiès, Dakar, Niayes) which involve a progressive subsiding which is more or less pronounced according to location of the dynamic water table levels. This results in increased costs to exploit and pump the water. Surface water: availability of this resource is estimated at 7 billion m³. This water comes from three perennial rivers, which cover the north and south of the country: the Senegal River, Gambia and Casamance. Temporary or fossil rivers are also present in certain areas of the country. Surface water usage is low because it requires large amounts of funds that cannot be supported by private investments. Water run-off: in Senegal’s eastern and western regions, where rain levels are relatively high (1200 mm/year), water resources are not developed and are lost due to water run-off, which

20
also causes environmental problems. In particular, it accelerates water erosion or the ground leaching which results in a reduction of arable lands. Thus, 150 billion m³ of water is lost each year due to a lack of storage capacity. In spite of this strong potential and the diversity of water sources, less than 10% of the reserves are currently mobilized per year for both social (drinking water) and economic needs due to the structural deficit of water resource systems.
2.3.2.1. Access to drinking water In this area, continuous efforts to improve the rate of transport services were implemented. In urban areas, the rate of overall service is around 93%, which places Senegal among the countries with the best rates of access in sub-Saharan Africa (74% in Burkina, 88% in 2003 for Morocco). The evolution of the demand for water in urban areas is in direct proportion to demographic growth and the socio-economic level, or the population’s standard of living. The dynamics of urban population migration are strongly dependant on economic zones. The migratory destination for 93.57% is Dakar’s urban area. The combination of this phenomenon along with natural population increases results in a higher demand for water, with a hypothesized flow of 5.46% by 2030, representing a peak output of 10.8 m³/s in the Dakar area. In any case, resource availability is sufficient large and nevertheless makes it possible to face this increase in demand according to even the most pessimistic assumptions. In rural areas, the rate of access to drinking water is relatively correct and is around 69% (14% for Morocco, 60% for Burkina). However, this poses a major concern because of the rate of degradation of certain water collection (and purification) systems. Indeed, 10% of the collection systems are more than 30 years old and in need of rehabilitation. This degradation also poses the institutional problems of coordination and synergy in interventions.
2.3.2.2. Access for economic uses Water access for economic use is a major constraint for the economic growth and the advancement of private investment in Senegal. It significantly contributes to: the development of rural areas, the competitiveness of businesses in rural areas, and minor cities. In most instances, mobilization of these resources requires significant investment for the installation of structural works, which influence operational costs. The cost of water for economic uses (agriculture, industry) is a function of the ecological zones, the cost of water treatment, and the cost of transport. Water is generally treated for the food supply (drinking water), and the price is defined consumption. For the majority of companies installed in Dakar and in the maritime fringe have recourse to this water treated by SDE, for uses not requiring this level of quality. As a result, the costs are very high and not justified from an economic perspective. The cost of untreated water varies from 7 fcfa with 150 CFA according to zones, whereas treated water costs on average 230 CFA. If large companies (6.4%) want to turn to independent wells and drillings, the majority does not have sufficient means or is confronted with physical constraints which prevents them from considering this option (high costs of drilling is due to the depth of the water table, pumping out, high salt rate).

21
Table 7: Comparison of the percentage of firms having their well in various countries Country Percentage of firms having
built their own wellSenegal 6.4Uganda 13Kenya 33.5Tanzania 34.7India 50.8
Source:(Doc. BM Mars 2005, Evaluation of the climate of the investments) The outputs noted on the level of the agricultural production encourage investors to turn more to irrigation. The role of water and conservation techniques is important in agricultural development. However it constitutes one of the ways to improve under-utilization of agricultural production from the perspective of resource availability. A comparison of the operating statement of the principal speculations under various farming systems (rain and irrigated) shows significant margins with irrigation use. This productivity profit could be explained not only agronomic reasons but also the investment of farmers because of safety which this system by contribution confers on the climatic risks (minimization of the risks). The under-irrigation is, however, exploited the mobilization of the resources water for economic use requires work and structural installations without which this resource is not accessible to the private sector. These structural investments are generally carried out by public authorities because they have the authority which is beyond the capacity for most companies except for some large agro-industrial companies having broad surfaces like the Senegalese sugar company in the Senegal River Delta. The major problems related to water access for economic use are thus primarily due to the absence of waterworks, the infrastructure for mobilization and distribution of water, and other institutional aspects (operations and maintenance of waterworks and coordination).
2.3.3. Deficit in energy services The deficit of energy services are presented more in terms of access for the rural milieu and quality for the urban environment. Indeed, the rate of rural electrification remains weak and measured 16% in 2006. This situation, of which the sector is aware, is explained on one hand by the weakness of public and private investment in the sector, and on the other hand, by the lack of diversification of the energy sources. In urban environments, companies suffer due to the poor quality of these services. The electricity supply in eastern Senegal is managed by a public company called SENELEC, which deals with various types of output problems due to outdated infrastructure and financing difficulties. This situation results in constraints to effective management. The study on the manufacturing sector shows supply problems for electricity are regarded as serious by little more than one quarter of companies (Appendix A2, table 1). In the rural milieu, agricultural companies and SMEs organize themselves into groups that own thermal motor-driven pumps, which produce energy that generates additional costs and affects their competitiveness. Analysis showed that in large spaces equipped with electric pumping stations, the total cost of irrigation is 20-25% lower.

22
With the persistence of supply problems to obtain quality electricity services, private sector agents, particularly those moving into the industrial sector, run into the effects of power outages. Operation of water resource infrastructure is also affected by this deficit in energy services. In response to these problems, certain companies are often obligated to buy and utilize alternative sources of electricity (power generating units, etc), which involve additional costs and production difficulties. In Senegal, 61.6% of manufacturing companies (study on the businesses climate, BM, 2005) indicate that they acquired their own generator, whereas this rate is 35.3% in Uganda. In conclusion, it appears that the energy deficit is a major constraint for economic growth and the development of the private sector in Senegal. It results in an inequality between supply and demand and a poor quality of service, both of which affect the competitiveness of various economic sectors (agriculture, irrigation, fishing, industry, SME). Otherwise stated, energy access constitutes a constraint to private investment in parts of the country with strong economic potential. Further, it also affects the quality of life for the population because of the broad nature of the sector.
2.4. Legal and institutional framework insufficiently incentivizedThe legal environment serves as a determinate factor in guiding the level of economic performance and making it attractive for investment. However, analysis reveals some major constraints which center on the deficit of specialized training in human resources in the areas of administration and justice, access to land as well as the slowness and high cost of the land access procedures. These major constraints relate to the areas of labor law regulation, the framework for settling litigation, land access, the framework for opening and closing businesses, taxation and international trade.
2.4.1. Slowness, rigidity and elevated procedural costs These constraints particularly concern the framework for opening and closing business, taxation, international trade, and labor law regulation. Related to opening and closing businesses, performance indicators examine the number and duration of procedures for the creation of companies and the duration and cost of liquidation, and the rate of auditing the liability for closing. Regarding business set-up, Senegalese regulations impose: ten (10) to eleven (11) procedures for UEMOA countries, 6.5 on average for OECD countries, 12 for Kenya, 18 for Uganda, 44 for Tanzania, 9 for Nigeria and 11 for Ghana. The time period for starting a business is 2 days in Senegal, 63.8 on average for UEMOA countries, 9 for Angola, 34 for Nigeria and 42 for Ghana. The required capital for starting a business in Senegal is 176.9% of the GDP per capita, 58.8% for Kenya and 236.5% for Tanzania. Regarding indicators relating to the shutting down a business, Senegal’s performance is weak because it takes three years on average to liquidate a company; whereas it takes 2 years in Ghana, and 1.9 years in Nigeria. The cost of this process is equivalent to 7% of social capital for Senegal, 22% for Ghana and Nigeria; whereas rate of credit recovery for closing companies is 32.4% for Senegal, 20.5% for Tanzania, 31% for Kenya, and 24% for Ghana. In spite of the adoption of uniform acts on the rights of public companies and economic interest groups within the framework of the OHADA treaty in 1998, the procedures for opening and closing a business remain complex and costly, negatively influencing the rate of asset recovery and audit liability.

23
On taxation in Senegal, 50% of entrepreneurs believe that both the taxation rates and the conditions for the implementation of tax legislation constitute constraints. The implementation of tax legislation comes in 4th position for the constraints considered to be both major and severe. In spite of the government’s efforts to simplify payment procedures, and to lower taxes, Senegal remains weak in this field. Thus, the number of taxes, the duration and payment of these taxes, as well as the cost of the taxes in connection with the gross profit carried out are poorly perceived by corporate managers. There are 59 different taxes in Senegal, compared to 32 in Ghana, 41 in Kenya, 47 in Tanzania, and 2 in Sweden. Corporate managers in Senegal devote 696 hours per year to paying taxes compared to 304 hours in Ghana, and 432 in Kenya. Finally, taxes account for 46% of the gross profits made by Senegalese companies compared to 29.2 in Nigeria, and 32% in Ghana (DB report in Sub-Saharan Africa, 2008). Regarding the international trade sector, Senegal occupies a very respectable place amongst south sub-Saharan countries. The essential constraints for Senegal are: infrastructure (see infrastructure section), transportation documents as required by authorities, and the time and cost required to process these operations. The number of import and export documents imposed by authorities is 11 and 26, respectively, compared to 6 and 29 in Ghana, and 10 and 46 in Nigeria. The necessary time to achieve the import and export operations averages 20days for both; whereas in Ghana the average is 19 and 9 days, and in Nigeria is 36 and 39 days. Finally, in Senegal the cost to import and export one container is 1720 and 828 dollars compared to 895 in Ghana. (World Bank “Doing Business” report, 2008). The primary causes of constraints in this field are:
‐ insufficient education on customs procedures; ‐ slowness and operational costs of transfer and storage; ‐ failure to ratify the international conventions on the simplification and harmonization
of customs procedures; particularly that of Kyoto of May 18, 1973. Nevertheless, Senegal made efforts, by computerizing sea export procedures (ORBUS system), by increasing transparency (taking anti-corruption measures) and by improving port performances through the development of a document for the strategic development of the port authority of Dakar. However, slow and costly procedures remain problems impeding international trade. In the area of labor laws, the constraints are: the rigidity of regulations relating to recruitment, a fixed work schedule, and firing policies. For the latter challenge, the difficulty lies in uncertainty on severance pay in the event of an unfair dismissal. In the manufacturing and service sectors, 12 to 17% of companies believe firing constitutes a significant constraint to the regulatory framework for labor laws. The Doing Business indicators highlight that Senegal’s performance is close to that of other countries in the southern Sahara but far from countries like China and Singapore and competitive African countries. (Appendix A2, table 2). Senegal is classified 160 out of 178 in the world, behind Nigeria (30th), Uganda (11th), Kenya 66th), and Tanzania (151st). These constraints originate primarily from the rigidity of laws, which come up against with modifications, which are weighted down by trade unions that oppose progress and are unwilling to endorse any changes to labor laws that may weaken their status or call into question the rights that they have acquired in the past. Additional constraints include the outdated nature of collective agreements and the absence of texts interpreting the labor code. The lack of flexibility with respect to working hours and the

24
rigidity of the firing process were, however, mostly sorted out on paper by the fair labor standards act of 1997. Regarding judicial procedures, it is necessary to go through 44 procedures, with a duration of 780 days, to force contract execution or recover debt. In comparison, it takes 36 over 487 days in Ghana, and 39 over 457 days for Nigeria. In this domain, Senegal places 8th amongst African countries. The cost of these procedures is 26.5% of the litigious value for Senegal, 23% for Ghana, and 32% for Nigeria. The major constraints in this field are primarily the lack of specialized training of magistrates and promotion and popularization of recourse to arbitration. It should, however, be noted that Senegal agreed to make an effort to increase the number of magistrates and improve their social status in order to combat corruption in this sector. With reference to land access procedures, in comparison to other African countries and OECD countries, issues with land access procedures in Senegal are centered around the costs of property registration, related to original site value, which is 19.5%, whereas it amounts to 1.3% in Ghana, 22.2% in Nigeria, and 7% in Angola. These costs are relatively high compared to those of European countries like France (6.1%), the Netherlands (6.2%), Greece (4%), and Italy (0.6%). The number of land access procedures is 6 in Senegal, 5 in Ghana, 14 in Nigeria and 7 in Angola. The duration of these procedures is 114 days in Senegal, 34 in Ghana and 82 in Nigeria, compared to 33 days in OECD countries on average. As such, in the area of property registration, Senegal occupies 33rd place out of 40 in Africa, 8th out of 12 amongst CEDEAO countries, and 6th out of 8 in the UEMOA. Slow procedures result most often because of the fact that government administration does not respect the procedural timeline in the treatment of applications. To address this issue, the State has initiated a number of reforms to remedy this problem. They are:
‐ the reduction of authorization for real estate transactions that are less than ten million FCFA and delegation of the signature of the Minster of Economy and Finance for amounts less than 50 million and amounts between 50 and 100 million;
‐ the simplification of payment procedures for property taxes and the reduction of tax burdens;
‐ the reform of land rights, which was initiated by the government in 2005 and is ongoing.
The number of procedures, slow application processing, as well as processing costs, do not facilitate obtaining property titles within the timeframe. This situation does not allow for securing investments, and often causes private firms to settle in more countries with more attractive investment climates. Moreover, the absence of land titles prevents those private firms with private property from utilizing it as a guarantee for loans.
2.4.2. Administrative performance and corruption The constraints in this sector are specifically related to the regulatory measures that burden companies, however, some constraints are also related to corruption. In Senegal, contractors spend 60% of their time attending to administrative formalities, 11% of which deal with industrial legislation and 9% of which deal with tax-related formalities (Appendix A2, table 4). The perception of corruption amongst entrepreneurs remains a concern. In the manufacturing and service sectors, between 39-40% of the service sector regards it as a major constraint.

25
Studies reveal that 6.5% of contract value is lost in the payment of expenses for illegal acts or gifts. This corruption also exists because entrepreneurs use the practice to influence the decisions of authorities (Appendix A2, graphic 2). The slowness of administrative and legal procedures can be found, in large part, in this corruption. The second cause of this slowness is the lack of modern administrative procedures, and their inapplicability to practices in the business world. These constraints have not yet been eradicated, despite the following actions: adopting a code for government contracts; the creation of regulatory agency for government contracts; the creation of a national commission to combat corruption, non-transparency and misappropriations; the creation of the Court of Accounts, and; the suppression of certain authorizations and preliminary licenses.
2.4.3. Problem of land access One of the fields considered by investors when determining whether to establish themselves in the country is property development. Certain companies have to settle in neighboring countries to access available land in the absence of structural framework, which are the jurisdiction of public authorities. These prohibitive costs are thus outside the realm of the possible for individual and family operations. Investors who require vast spaces are obligated to resort to public investment or public/private partnerships to proceed with development plans. This constraint is related to diversity and the outdated laws which satisfy neither investment needs nor the need to secure credit. This is in the process of being remedied through reform projects on land rights. Ultimately, one may consider two distinct situations: -At the urban level, the situation in Dakar differs from that of the other economic hubs in Senegal. Indeed, in Dakar, the concentration of industries has driven a lack of developed land, but this constraint is in the process of being resolved through the creation of a “special economic zone.” In other regions, however, space is available, but there is no development adapted to the needs for the companies that would wish to settle in these areas.
-In the rural milieu, the possession of cultivable grounds has lowered appreciably over recent years. Of the population living in these areas (58.4%), 56.7% have cultivable surfaces less than 1 hectare, and only 24.3% have small holdings larger than 4 hectares. This situation leads to strong pressure on available land, and the need for recourse to intensive agricultural production (Appendix 2, graphic 1). It involves additional costs related to inputs. Moreover, the land that the rural population uses only confers them usage rights. Access to developed land is thus a fundamental problem, given that only 13-15% of the arable land is developed. This situation is explained by the high investment costs for provision of water transport and storage. Indeed, only large companies are able to support these costs because the investments on large areas enable them to use economies of scale and benefit from their investment.
2.4.4. Lack of confidence in the application of the legal framework and the justice system.

26
Uncertainty in the interpretation of laws: this situation is explained by: (i) the lack of specialization of judges, especially with regard to corporate law, (ii) difficulties that civil servants have in making texts evolve and adapting them to institutional needs, and (iii) the failure to promote arbitration, which is often related to the lack of human resources. Consequently, these factors lack a confident and coherent framework for legal and administrative systems. Thus, 42% of entrepreneurs do not have confidence in the capacity of the public administration to ensure coherent application of the law, and 40% of these same entrepreneurs do not have confidence in the legal system in the areas contract law and property protection. The way that these companies apprehend the stability and the coherence of the justice system determines in large part their degree of confidence in the business environment (Appendix A2, table 3). This report is confirmed by the weak rate of litigation cost recovery in commercial jurisdictions; between 3-7% of court cases result in the decision that damages should be paid in the event of unfair dismissal. In conclusion, the problems related to institutional and legal framework are numerous and varied in their configuration. All the same, we may consider that some of them are in the process of resolution particularly those related to the Rural Land register, outdated texts (through the PAMOCA, or project to support modernization of the land registry) and the project to reform land rights. Even if efforts to formalize procedures for shutting down businesses, corruption, sluggish taxation procedures, international trade and regulation of labor law continue, these areas will remain major constraints to investment and entrepreneurship. Notwithstanding the constraints mentioned in the preceding paragraph, other major constraints to private sector development include: land development, the framework for conflict resolution (procedures on contract performance, debt recovery, resolution of labor law conflicts) including judicial organization (bringing together parties in dispute, sensitization and arbitration). It is necessary to add the institutional and legal framework for distribution of credit to these constraints.

a
Bibliographical references Senegal, (2002), Strategy of development of the private sector, 62p. Senegal, (2002), Ministry for the Economy and Finances, Direction of the forecast and the statistics, Enquête sénégalaise near manage (ESAM-II). Senegal, (2002), Document of strategy of reduction of poverty (DSRP), 100p. Senegal, (2005), Letter of sectoral policy of the development of Industry. The policy of industrial redeployment. Senegal, (2006), Ministry for the Economy and Finances, Arranges National Statistics and of Demography, Résultats of the third general census of the population and habitat, Rapport national of presentation, 122p Senegal, (2006), Document of strategy of reduction of poverty (DSRP-II), 103p. Senegal, (2006), Action plan of the Strategy of Growth Accelerated (SCA) “To make of Senegal an emergent country by 2015, 71 p. Senegal, (2007), Ministry for the Economy and Finances, Arranges National Statistics and Demography, Economic and social Situation of Senegal, 235p. Senegal, (2007), Ministry for the Economy and Finances, Arranges National Statistics and Demography, Enquête of follow-up of poverty ESPS 2005 2006, 63p. Senegal, (2007), Ministry for the Economy and Finances, Direction of the Forecast and the Economic surveys (DPEE/MEF), Report/ratio Economic and financial, 34p. Senegal, (2007), Ministry for the Economy and Finances, Direction of the Forecast and the Economic surveys (DPEE/MEF), Situation Economic and financial, 36p. Senegal, (2007), Ministry for the Economy and Finances, Direction of the Forecast and the Economic surveys (DPEE/MEF), monthly Note of economic situation, 32p. Senegal, (2007), Ministry for the Economy and Finances, Direction of the Forecast and the Economic surveys (DPEE/MEF), Risk management of the credit and financing of the Economies of the UEMOA, Document of Study n° 3, 31p. The World Bank (2005), Senegal, Africa Area, Department Private Sector and Infrastructures, Regional Program on the Development of the Companies - an evaluation of the climate of the investments The Recent World Bank (2006), Senegal, Developments and Sources of Financing of the Budget of the State - Review of the Public expenditure. The World Bank (2006), Risk management in rural medium in Senegal: multisector review of the initiatives as regards reduction of the vulnerability, 145p. The World Bank (2007), Senegal - With the Research of – Employment the Way towards Prosperity - Economic Memorandum on the Country. Mbaye A.L. & Golub S., (2002), Obstacles and Opportunities for Senegal'S International Competitiveness: Put studies off the peanut oil, textile Fishing and industries, Word Bank 42p.

b
Mbaye A.L. & Golub S., (2002), Convergence in productivity: Senegal in the world economy, CREATED; 102p. International Monetary Fund (IMF) (2006c). Senegal—ThirdPost-Program Monitoring Discussions (EBS/06/47), April 3. World Bank, (2007). Doing Business How to reform -Senegal. Economy Profiles. 16p.

c
APPENDIX

d
A1 appendix: Infrastructures
Table 1: State of the roads by area
Source:(Doc. BM June 2004 on road transport sector in Senegal): www.worldbank.org/transport/transportresults/regions/africa/senegal-output-esw.pdf Table 2: comparison costs water by zone Zones Costs of treated water F CFA Costs of untreated water F CFA Dakar 230 38Northern zone 230 7Zone Centers 230 50-150Zone CUS 230 50-150Zone Is 230 50-150
Table 3: Comparison of the gross margin of the culture of rice in rainy and irrigated zone Rice Designations Rainy zone Irrigated zoneProduction costs
- Tillage - Seed - Manure - Plant health Products - Loads harvests - Other loads - Total
15 000 28 000 39 000 41 000 31 000 5 000 144 600
10 000 14 000 63 500 43 200 78 232 146 900 356 709
Output 1t/ha 6t/haClear margin 25 400 124 600
Table 4: Comparison of the gross margin of the culture of sweet potato in rainy and irrigated zone The Sweet potato Designations Rainy zone Irrigated zoneProduction costs (F CFA)
- Tillage - Seed - Manure - Plant health Products - Loads harvests - Other loads - Total
25 000 5 000 13500 16875 188 250 81000 329 625
26 000 5 000 38 000 16 875 60 000 43325 189 200
Output (kg) 12 550 15 680Selling price (F CFA) 100 100
Area % good and average state % bad and very bad condition Dakar 38.3% 61.7%
Thiès 56.4% 43.6%
Diourbel 47.1% 52.9%
Fatick 27.8% 72.2%
Kaolak 16.3% 83.7%
Kolda 15.6% 84.4%
Longa 31.5% 68.5%
Saint-Louis 31.9% 68.1%
Ziguinchor 47.2% 52.8%
Tambacounda 24.7% 75.3%
Matam 26.5% 73.5%
Total of Senegal 28.1% 71.9%

e
Incomes (F CFA) 1 255 000 1 568 000Clear margin (F CFA) 925 375 1 378 800

a
A2 appendix:
Table 1: Evaluation by the heads of undertakings of major” or “very severe” constraints the “ for their operations and growth of their companies (Pct) (Extracted World Bank Study “Study on the Climate Investments, 2005)
Table 2: Comparison of the regulation of work
Regulation of the
Labor market Regional average
Senegal Burkina Faso
Ivory Coast Africa ofSouth
China Singapore
Index of flexibility of recruiting
49 48 53 53 42 17 33
Index of condition of uses
68 .0 83.0 79.0 61.0 36.0 67.0 26.0
Index of flexibility of dismissal
40.0 30.0 27.0 45.0 30.0 57.0 1.0
Index of laws of work 52.0 54.0 53.0 53.0 36.0 47.0 20.0
NB: The indices go from 0 to 100. 100 indicates a maximum rigidity Source: Indicators doing business 2004. Table 3: Confidence in the application of the lawful framework and towards the legal system
Senegal Very small firms
Average firms
Large and very large firms
Foreigners Buildings
The interpretation of the payments is coherent (percentage of dissension)
47.96 47.19 50.00 60.00 38.46 52.86
Leaves the profits reinvested in the company 42.81 43.52 n.a. 50.53 49.59 40.05Confidence granted to the legal system (percentage of agreement)
65.00 65.93 50.00 60.00 73.08 61.11
Percentage of litigious invoices recovered thanks to the commercial courts
3.01 3.14 0.50 3.33 6.70 1.83
NB: Exclusively for the firms of service Source: Inquire climate of the investments in Senegal, the World Bank/French Agence of Development

b
Table 4: Evaluation by the heads of undertaking of the weight of the regulations Senegal Very
small firms
Small and average firms
Large and very large firms
Foreigners Buildings Exporters
Not Exporters
Regulation Percentage of the time of an affected manager of undertaking to the treatment of the regulations
60 .79
62.69
54.66
69.76
62.91
60.35
65.07
33.87
Inspections and meetings A number of days spent in inspection or meetings with civils servant Which leaves last in inspection or meeting with the local authorities Total cost of the fines or the seized goods (expressed as a percentage of the sales turnover) Cases or of the gifts “Gifts or payments abstract” are necessary (in percentages) If so, which is the value (percentage of the sales turnover) Importation Average time related with the taking out of bond of a container (in days) The longest time supported with the taking out of bond of a container (in days) Export Average time related with the taking out of bond of a container (in days) The longest time supported with the taking out of bond of a container (in days)
18.43 12.60 0.46 8.98 0.15 7.06 14.53 6.50 14.44
13.83 6.67 0.08 5.00 0.11 8.37 14.14 9.00 13.29
18.78 13.02 0.29 10.69 0.21 6.61 12.22 6.29 10.82
28.50 18.62 1.85 11.76 0.01 7.12 21.68 5.95 11.84
27.21 19.23 0.11 7.65 0.15 8.06 15.73 6.27 11.07
16.68 10.44 0.55 14.29 0.15 6.72 14.14 6.58 11.57
20.10 16.08 0.83 15.38 0.18 6.90 15.30 6.50 11.44
16.77 8.45 0.08 3.15 0.06 7.31 13.27 n.a n.a
NB: Exclusively for the firms of the manufacturing sector Source: Inquire climate of the investments in Senegal, the World Bank/French Agence of Development Graph 1: Distribution of households according to plot of land possessed
0
10
20
30
40
50
60
70
80
moins d'1 an de 1 à 2 ha de 2 à 4 ha de 4 à 6 ha 6 ha et plus
ESPS
ESAM
Sources: Inquire of Follow-up of Poverty to Senegal (ESPS, 2005 - 2006), ANSD, Dakar, Senegal; Inquire Sénégalaise Near Households (ESAM II, 2001-2002), ANSD, Dakar, Senegal

h
A3 appendix: Evolution of the principal economic and social indicators
Stamp of follow-up of the Strategy of growth and reduction of the poverty of Senegal (DSRP2)
FIELD INDICATORS ACHIEVEMENTS OBJECTIVES
2000 2001 2002 2003 2004 2005 2006 real2006
objectives2007 2008 2009 2010 2015
REAL SECTOR
1. Growth rate of the real GDP/inhabitant 0,5% 1,8% - 1,5% 5,6% 3,1% 2,8% - 0,4% 4,1% 3,2% 3,4% 3,5% 3,7%
5,6%
2. Total net budgetary position except gifts (scheduling bases)/GDP (running)
- 1,20% - 4,1% - 1,7% - 3,3% - 5,2% - 4,6% - 7,3% <3% - 6,7% - 4,9% - 6,0% - 5,4%<3%
3. External balance running except transfer/GDP
- 8,70% - 6,4% - 7,7% - 8,1% - 7,9% - 9,1% - 9,4% - 6,4% - 9,0% - 7,4% - 6,6% - 5,9%<5%
4. Rate of unemployment (15 years and +) ND 16% ND ND 16% 16% 15,0% 14% 13% 10% 5. Rate of investment 20,5% 18,4% 17,2% 22,3% 22,3% 25,20% 25,20% 23,5% 22,7% 24,0% 24,6% 25,2% >25%
ROADS
6.% of villages having access to a road (bituminized or lateritic) with less 5kms
Bituminized 28.31% ND ND ND ND ND ND ND ND ND
Lateritic 30.72% ND ND ND ND ND ND ND ND ND
Together 47.71% ND ND ND ND ND ND ND 60% 70%
7.1 % of the road ground network classified in good and average state
14% 18% 19% 25% 68% 73% 35% >60% >75%
7.2. % of the covered road network classified in good and average state
40% 57% 59% 66% 72% 55% 57% 65% >95% >95%
ENVIRONMENT 8. Ratio of vegetable cover (afforestation) ND ND 1,9 1,83 >ratio
2003 >ratio 2004
>ratio 2005
>ratio 2006
>ratio 2007
>ratio 2008
>ratio 2009
>ratio 2014
9. Control impact of the economic activities on the environment ND ND ND ND 30% 56% >ratio
2005 >ratio 2006
>ratio 2007
>ratio 2008
>ratio 2009
>ratio 2014
WATER AND CLEANSING
10.a Proportion of populations having access to a source of water (better) in urban environment
78% 81% 84% 87% 91% 92% 93% 86% 98% 98% 98% 99% 100%
10.b Proportion of populations having access to a source of water (better) in rural medium
56% 57% 59% 62% 64% 66% 69% 63% 71% 73% 75% 77% 82%
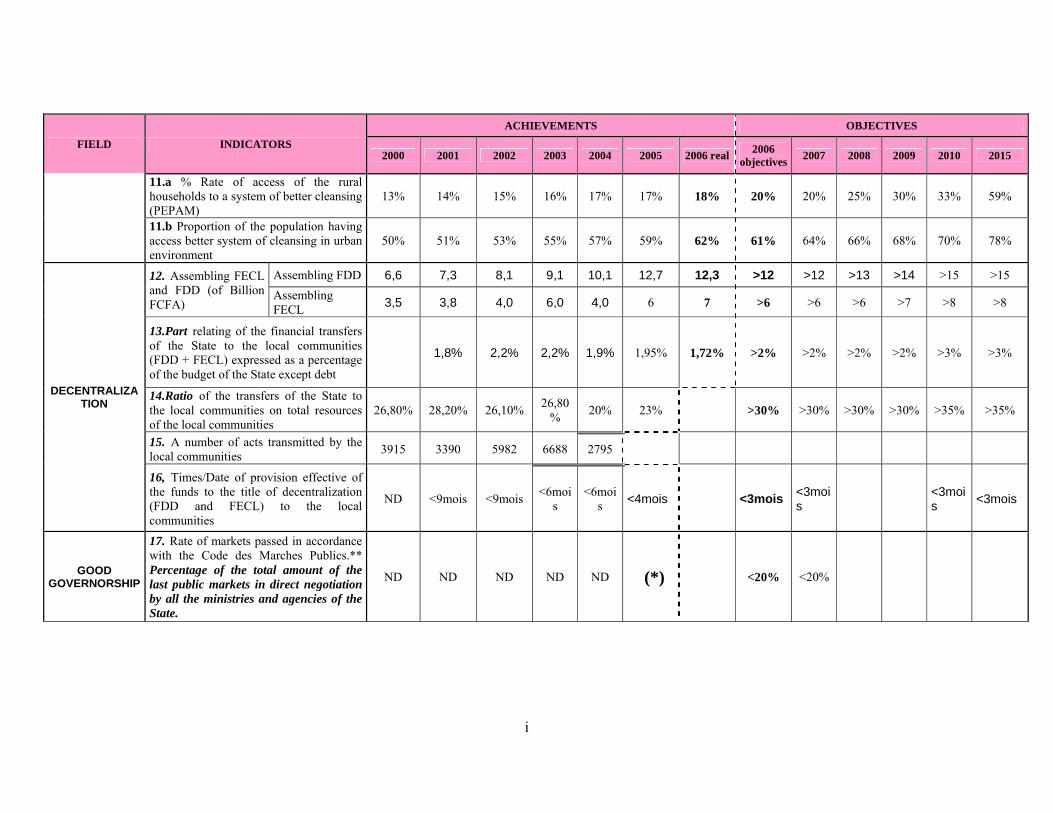
i
FIELD INDICATORS ACHIEVEMENTS OBJECTIVES
2000 2001 2002 2003 2004 2005 2006 real2006
objectives2007 2008 2009 2010 2015
11.a % Rate of access of the rural households to a system of better cleansing (PEPAM)
13% 14% 15% 16% 17% 17% 18% 20% 20% 25% 30% 33% 59%
11.b Proportion of the population having access better system of cleansing in urban environment
50% 51% 53% 55% 57% 59% 62% 61% 64% 66% 68% 70% 78%
DECENTRALIZATION
12. Assembling FECL and FDD (of Billion FCFA)
Assembling FDD 6,6 7,3 8,1 9,1 10,1 12,7 12,3 >12 >12 >13 >14 >15 >15 Assembling FECL 3,5 3,8 4,0 6,0 4,0 6 7 >6 >6 >6 >7 >8 >8
13.Part relating of the financial transfers of the State to the local communities (FDD + FECL) expressed as a percentage of the budget of the State except debt
1,8% 2,2% 2,2% 1,9% 1,95% 1,72% >2% >2% >2% >2% >3% >3%
14.Ratio of the transfers of the State to the local communities on total resources of the local communities
26,80% 28,20% 26,10% 26,80% 20% 23% >30% >30% >30% >30% >35% >35%
15. A number of acts transmitted by the local communities 3915 3390 5982 6688 2795
16, Times/Date of provision effective of the funds to the title of decentralization (FDD and FECL) to the local communities
ND <9mois <9mois <6mois
<6mois <4mois <3mois <3moi
s <3mois <3mois
GOOD GOVERNORSHIP
17. Rate of markets passed in accordance with the Code des Marches Publics.** Percentage of the total amount of the last public markets in direct negotiation by all the ministries and agencies of the State.
ND ND ND ND ND (*) <20% <20%

j
FIELD INDICATORS ACHIEVEMENTS OBJECTIVES
2000 2001 2002 2003 2004 2005 2006 real2006
objectives2007 2008 2009 2010 2015
18 a Number of management accounts received by the Court of Auditors /a Number of management accounts to be received (accounts of the State, accounts regional, accounts of the Publicly-owned establishment) (expressed as a percentage)
3,4% 4,2% 9,2% 14,0% 15,5% 8,0% 20,0% 30,5% 60% 85%
HEALTH/NUTRITION
19. Vaccine cover rate DTC3 in the children from 0 to 11 months 41% 56% 72% 70% 78% 84% 89% 80% ≥ 85% ≥ 85% ≥ 85% ≥ 85% ≥ 85%
20. Rate of total primary consultation 24% 28% 33% 46% 50% 55% 54% 54% 60% 65% 70% 75% >75%
21. Proportion of childbirth assisted by trained personnel 38% 40% 54% ND 52% 51.9% 59% 65% 62% 65% 68% 70% 75%
22. Rate of prevalence of the HIV (AIDS) in the general population 1.0% 1.1% 1.2% 1.5% 0,7 0,7 < 3% < 3% < 3% <3%
23. Rate of prevalence of the ponderal insufficiency (ratio weight/age) in the children from 0 to 59 months
21.0% 19.1% ND ND 19% 17% 15% 14% 13% 12% 11% 10%
24. Leaves the budget of health (operation + investment) in the budget of the State except debt
5.53% 6.78% 7.96% 7.70% 7.82% 9.7% 8% 8% >= 9% 12% 15%
EDUCATION
25. Rough rate of elementary schooling
National 71,80% 73,10% 73,40% 76,8% 80,3% 81,6% 81,8% 85,5% 100,0%
Girl 66,8% 68,90% 70,10% 74,1% 78,8% 80,8% 82,2% >80%
Boy 76,60% 77,20% 76,60% 79,4% 81,7% 82,3% 81,5% >85%
26. Rate of admission with Ci
National 79,30% 73,00% 76,00% 81,4% 86,4% 86,8% 91,4% 100,0% 100,0%
Girl 77,50% 72,50% 75,80% 81,6% 88,4% 89,00% 94,60% 100,0% Boy 81,20% 72,50% 76,30% 81,3% 84,4% 84,70% 88,30% 100,0%
27. Rate of completion for the elementary one
National 46,0% 46,1% 49,9% 45,8% 58,3% 100% Girl 42,1% 43,2% 47,1% 45,1% 57,0% Boy 49,8% 49,0% 52,6% 46,6% 59,5%

k
FIELD INDICATORS ACHIEVEMENTS OBJECTIVES
2000 2001 2002 2003 2004 2005 2006 real2006
objectives2007 2008 2009 2010 2015
28. Leaves the budget education and training (operation + investment) in the budget of the State except debt
13.50% 11.82% 14.95% 16.38%
18.11% 25.6% 25,0% 25,00% 27,00
% >30% >30%
VILLAGE INFRASTRUCTU
RES
29. Aggregative index of access to the basic social services in rural medium. 271/500 ND ND ND 0.6 0,6 0.64 0,70 0,75
30. Rate of electrification of the rural households 8% ND ND 12.5% ND 14% 16,5% 15,0% 17% 21% 26% 35% 60%
CHILDHOOD 31. Proportion of children 6-14 years which work
National 36.7% ND ND ND ND <30% <30% <25% <15% <7,5% Boys ND ND ND ND ND <30% <30% <25% <15% <7,5% Girls ND ND ND ND ND <30% <30% <25% <15% <7,5%
POVERTY
32. Percentage of the population living in lower part of the poverty line
Urbain ND 45.7% ND ND ND 40% 38% 34% <30% <25% Rural ND 65.2% ND ND ND 62,20% 56% 48% <43% <30% National ND 57.1% 57.8% 55.8% 54.0% 50.6% 50.4% 48.4% 42% <30%
AGRICULTURAL SECTOR
33. Leaves agriculture in the GDP 9.9% 9.7% 6.4% 8.1% 8.5% 8.6% 8.7% 8.8% 9.0% 10%
34. Leaves the Budget of Investment on interior resources devoted to the agricultural sector
13.21% 9.98% 9.74% 8.48% 8.18% >10% >12% >17%12,28
% >20% >20%
12
Senegal counted officially 11 administrative areas until January 2008, before three new areas are not created (Sédhiou, Kédougou, Kaffrine). 13Letter of sectoral policy of the development of Industry 14Method Atlas, the World Bank. 15In spite of a light fall between 2001 and 2005, (57,5% to 55,6%). 16Gross fixed capital formation

l
17Compared to the share of the investments deprived in the GDP, one notes even a fall going of 17% in 2000 to 15% in 2004 (Source: Strategies of assistance country 2007-2010, the World Bank) 18the private investment relates to the investments which is not public. It includes/understands the IDE, the investments of the national private sector, the households and the family exploitations,… 19The World Bank (2005) - Risk management in rural medium in Senegal: multisector review of the initiatives as regards reduction of the vulnerability, 149 p.
20Cf left Institutional. 21
A study financed by the public Work Management on the development of a new road classification has been just finalized in November 2007, the conclusions are not adopted yet. 22The cost of water in the industrial park of Dakar integrates also the costs of transport because water is pumped since the distant Guiers Lake of more than 270 km. 23
Tariffing is made by the National Company of Distribution of water (SDE). It takes into account the consumption established by raised section of the taxes (municipal, cleansing). 24The cost of untreated water is fixed according to the mode of production (stopping or drilling). 25The objective laid down for indicator 7.1 is to carry out 300 km of road and laterite track per annum. 26The objective laid down for indicator 7.2 is to carry out 1000 km of overland route per annum. 27This indicator which cannot be indicated for the year 2005, it is retained that the six ministries (Ministry for the Economy and Finances, Agriculture, Education, Health, Infrastructures and Equipment, and the Habitat), deposit plans of making of markets to the title of the year 2006 with the CNCA 28Data source: EDS-IV